investor presentation - maybank.com€¦ · national commercial bank, saudi 33.1 4 dubai islamic...
TRANSCRIPT

0 www.maybank.com
Investor Presentation
Financial Results 2Q FY2014 and 1H FY2014 ended 30 June 2014
28 August 2014
Humanising Financial Services

1
Table of Contents
Financial Results: 2Q FY2014 and 1H FY2014 ended 30 June 2014
Appendix: Business Sector Review
11
2
27
1. Community Financial Services
2. Global Banking
3. Maybank Singapore
4. Bank Internasional Indonesia
5. Other segments
6. Affiliates
31
36
41
44
48
52
Executive Summary
Financial Performance
Prospects & Outlook
7. Quarterly Financial Summary 55

2 2
Overview (1/2) Maybank delivers higher YoY 1H FY2014 profit led by higher net fund based income, improved cost management and
lower impairment losses
Group loan growth improved to 7.5% for 1H, as loan performance
picked up in 2Q led by international markets
Malaysia 1H loan growth improved in 2Q largely contributed by CFS
growth at 9.8%. If adjusted for offshore foreign currency loans and
unrated bonds, Malaysia 1H annualised loan growth stands at 5.4%
Singapore 1H loan growth of 14.6%, exceeded target of 13.0%
Indonesia loan growth at 9.0% for 1H FY2014, with much stronger
performance in 2Q FY2014
Higher YoY 1H profit
growth, and higher PPOP
QoQ
Stronger loan growth across
all home markets
Net fund based income growth of 8.1% YoY, led by international (12.0%)
and CFS (3.5%)
Lower YoY overhead expenses of 2.7%
Lower impairment losses of 46.4% YoY
But offset by lower fee-based income of 18.0% YoY
2Q FY2014 PPOP higher by 5.6% from earlier quarter, but net profit
softer by 1.6% QoQ due to higher impairments

3 3
Overview (2/2) Group achieves good loan growth traction in 2Q, and funding strategy strengthens deposit growth
Group asset quality
improves
Group GIL improved to 1.50% from 1.86% a year ago, and 1.52% last
quarter
Rise in GIL for BII due to selected corporate accounts in confined sectors
1H Group net charge off rate at 20bps, and loan loss coverage at 107.7%
NIM within expected range
Group NIM at 2.36% as at June 2014 (Dec 2013: 2.43%)
NIM improves in Singapore, while Indonesia and Malaysia continue to
experience some compression
Capital position remains
healthy
Group total capital at 15.96% and CET1 at 11.44% as at 30 June 2014
(assuming an 85% DRP reinvestment rate)
Interim dividend of 24 sen consisting of 4 sen cash portion and 20 sen
electable portion for the Dividend Reinvestment Plan
Strategic deposit taking in
all key markets
2Q annualised deposit growth at 11.0% (1Q: 0%) spearheaded by
International at 11.4% with robust growth in Singapore at 18.1%
Improved focus on retail deposit taking across key markets
Selective growth on non-retail deposits to manage funding cost

4 4
FY2014 Group Targets Above peer growth in key markets and well above industry YoY in Singapore and Indonesia
Annualised YoY
Key Performance
Indicators
FY2014
Targets
1Q
FY2014*
2Q
FY2014*
1H
FY2014*
Industry
Average^
Industry
Average
Peer
Average** Maybank
Headline KPI
Return on Equity* 15.0% 13.8% 13.4% 13.5% - - - -
Other targets
Group Loans Growth 13.0% 5.3% 9.5% 7.5% - - 11.2% 13.1%
• Malaysia 12.0% (0.7)% 5.8% 2.5% 7.7% 9.2% 7.9% 8.2%
• Singapore# 13.0% 5.1% 23.7% 14.6% 8.2% 12.3% 16.6% 18.6%
• Indonesia# 17.0%- 20.0% (1.3)% 19.4% 9.0% 10.3% 13.7% 14.3% 25.5%
Group Deposits Growth 13.0% 0.0% 11.0% 5.5% - - 7.7% 9.1%
* Annualised
^ Numbers are annualised based on June 2014 position for Malaysia, Singapore and Indonesia
# in local currency terms
** Peer comparisons are computed for selected banks based on their June 2014 results. For peer banks which have yet to release their results, computation is based on their
previous quarter results

5 5
Review of 5-Year Strategic Objectives (1/5) Leading funding franchise and stable financing position in domestic market
Strategic Objective 1: Undisputed No. 1 Retail Financial Services provider in Malaysia by 2015
* Refers to Housing & Shophouse Loans
# The above market share for Cards refers to Receivables. In terms of Cardbase, Billings and Merchant Sales, Maybank is ranked No. 1
^ MBB ranking as at Dec’13
The above industry figure includes commercial banks and Non-Financial Institutions and 2Q’14 market share as at May’14
Q4’11 Q4’12 Q2’13 Q3’13 Q4’13 Q1’14 Q2’14
Q2’14
vs
Q1’14
MBB
Rank^
Deposits
Total Deposits 17.4% 17.1% 17.7% 17.7% 18.5% 18.2% 18.2% 1
Total Core Retail Deposits 18.1% 18.3% 18.3% 18.7% 19.0% 19.0% 19.2% 2
Retail CASA 23.3% 23.6% 23.1% 23.9% 24.8% 24.7% 24.5% 1
Retail Savings 28.1% 28.2% 28.0% 27.5% 29.8% 29.9% 29.7% 1
Retail Fixed Deposits (FD) 15.1% 15.2% 15.4% 15.6% 15.7% 15.7% 16.1% 2
Loans
Total Consumer/Household 16.4% 17.0% 17.1% 17.1% 17.2% 17.2% 17.2% 2
Auto (Purchase of transport vehicles) 19.2% 20.2% 20.5% 21.0% 21.5% 21.9% 22.4% 2
Total Mortgage* 13.2% 13.4% 13.3% 13.2% 13.1% 13.0% 13.0% 2
Credit Cards # 15.3% 15.2% 15.3% 15.3% 15.1% 15.1% 15.2% 2
Unit Trust 63.9% 60.2% 57.6% 56.8% 55.8% 54.5% 53.8% 1
Q4’11 Q4’12 Q2’13 Q3’13 Q4’13 Q1’14
Q1’14
vs
Q4’13
MBB
Rank^
Internet Banking – 3 months Active Users 35.68% 34.1% 34.0% 34.31% 33.94% 34.88% 1
Mobile Banking – 1 month Active Users 87.0% 80.5% 76.7% 75.43% 75.35% 75.04% 1
Branch Network 19.0% 19.0% 20.0% 23.0% 20.0% 20.0% 1

6 6
Review of 5-Year Strategic Objectives (2/5) Global Banking continues to roll-out regional business model across the region
Strategic Objective 2: Leading ASEAN wholesale bank eventually expanding
to Middle East, China & India
NOTABLE DEALS COMPLETED FROM JAN – JUN 2014
Regional League Table – Equities
Regional League Table – Regional Bonds
Source: Bloomberg
Countries : Malaysia, Indonesia, Singapore , Hong Kong,
Philippines, Thailand & Vietnam
Jun 2014 Dec 2013 Dec 2012
Ranking Advisor Ranking Advisor Ranking Advisor
1 Goldman
Sachs 1 UBS 1 UBS
2 HSBC Bank 2 Credit
Suisse 2 JP Morgan
3 Bank of
America 3
JP
Morgan 3
Morgan
Stanley
4 DBS Group 4 CIMB 4 Goldman
Sachs
7 Maybank 10 Maybank 11 Maybank
Jun 2014 Dec 2013 Dec 2012
Ranking Advisor Ranking Advisor Ranking Advisor
1 HSBC Bank 1 HSBC Bank 1 HSBC Bank
2 SCB 2 SCB 2 SCB
3 Citi 3 CIMB 3 CIMB
4 CIMB 4 DBS Group 4 DBS Group
6 Maybank 11 Maybank 5 Maybank
7 7
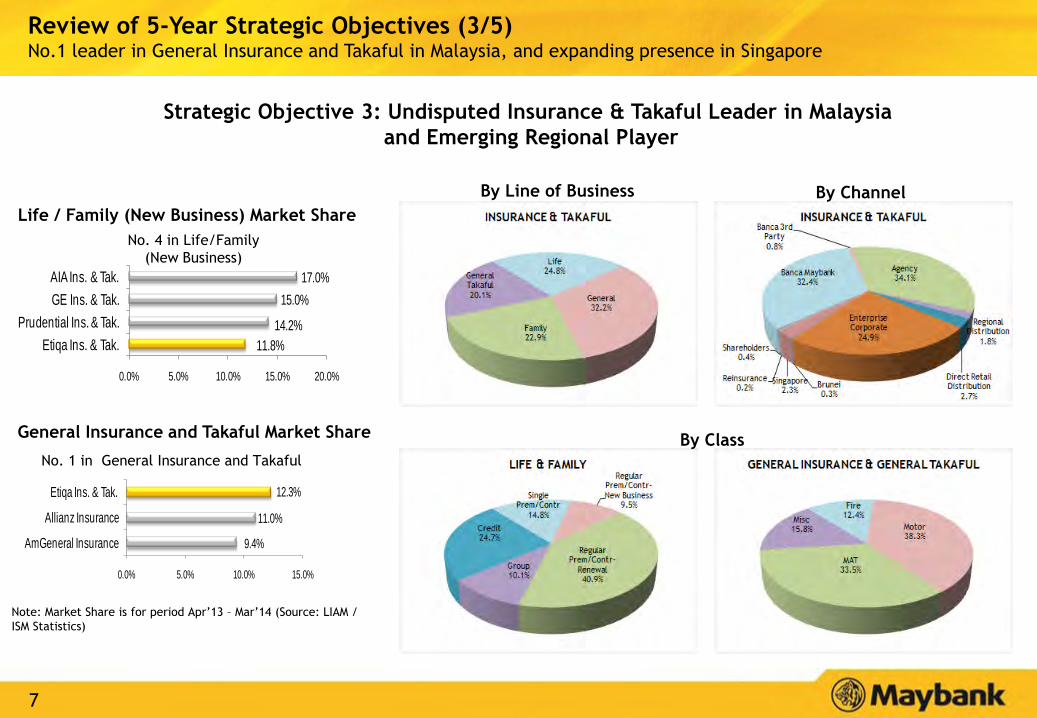
Review of 5-Year Strategic Objectives (3/5) No.1 leader in General Insurance and Takaful in Malaysia, and expanding presence in Singapore
Strategic Objective 3: Undisputed Insurance & Takaful Leader in Malaysia
and Emerging Regional Player
Life / Family (New Business) Market Share
General Insurance and Takaful Market Share
No. 4 in Life/Family
(New Business)
No. 1 in General Insurance and Takaful
Note: Market Share is for period Apr’13 – Mar’14 (Source: LIAM /
ISM Statistics)
11.8%
14.2%
15.0%
17.0%
0.0% 5.0% 10.0% 15.0% 20.0%
Etiqa Ins. & Tak.
Prudential Ins. & Tak.
GE Ins. & Tak.
AIA Ins. & Tak.
9.4%
11.0%
12.3%
0.0% 5.0% 10.0% 15.0%
AmGeneral Insurance
Allianz Insurance
Etiqa Ins. & Tak.
By Line of Business By Channel
By Class

8 8
Review of 5-Year Strategic Objectives (4/5) International PBT contribution at 30.2% for 1H FY14
Strategic Objective 4: Truly regional organisation with approx. 40% of pre-tax profit
derived from international operations by 2015
60.8% 23.5%
7.9% 7.8%
RM375.3b
69.8%
12.1%
3.4%
14.7%
Malaysia Singapore Indonesia Others
RM4.45b
Overseas:
39.2%
1H FY13
Net Income Profit Before Tax
1H FY14
Overseas:
35.5%
Overseas:
34.4%
Overseas:
31.5%
Overseas:
30.2%
Gross loans*
Overseas:
36.6%
* Including Islamic loans sold to Cagamas and excludes unwinding of interest & EIR adjustment
64.5% 15.7%
12.5%
7.3%
RM8.91b
65.6%
14.7%
13.8%
5.9%
RM9.03b
68.5%
14.7%
6.9%
9.9%
RM4.22b
63.4%
21.8%
8.4% 6.4%
RM331.9b

9 9
Review of 5-Year Strategic Objectives (5/5) Largest Malaysian Islamic bank gains market share in key segments
Strategic Objective 5: Global leader in Islamic Finance
26.2% 26.8%28.1%
28.9%30.6% 30.7% 31.1%
23.2% 22.5% 22.1% 22.5%23.8% 24.1%
25.1%
15.0%
20.0%
25.0%
30.0%
35.0%
Dec-12 Mar-13 Jun-13 Sep-13 Dec-13 Mar-14 Jun-14
Financing Deposit
Domestic Market Share
Jun-14 Jun-13
Automobile financing 37.5% 31.9%
Home Financing 24.3% 22.1%
Term financing 27.8% 25.8%
Maybank Islamic Market Share (Malaysia)
Maybank Islamic Contribution to Maybank Domestic
Financing as at June 2014
Year Contribution
Dec 2012 31.0%
Dec 2013 38.9%
June 2014 41.9%
Maybank Islamic, 41.9%
Maybank Conventional
Domestic, 58.1%
Bank
2013*
Total Assets 2013
(US$ b) Rank
Al Rajhi Bank, Saudi 74.6 1
KFH, Kuwait 57.2 2
Maybank Islamic, Malaysia 38.8 3
National Commercial Bank, Saudi 33.1 4
Dubai Islamic Bank, UAE 30.8 5
Global Position: 3rd Largest Islamic Bank by asset size
Note:
1. Conversion rate as at 31 Dec’13: USD1 = RM3.2757, IDR12,171, SAR3.7506, KWD 0.28236, AED3.6728
2. Source: Respective Bank’s Financial Statement Dec-13, Websites, Bloomberg & Mass Media, 2013
3.*Exclude Iran

10
Table of Contents
Financial Results: 2Q FY2014 and 1H FY2014 ended 30 June 2014
Appendix: Business Sector Review
11
2
27
1. Community Financial Services
2. Global Banking
3. Maybank Singapore
4. Bank Internasional Indonesia
5. Other segments
6. Affiliates
31
36
41
44
48
52
Executive Summary
Financial Performance
Prospects & Outlook
7. Quarterly Financial Summary 55

11 11
P&L Summary: 1H FY2014 Net Profit increased 3.4% YoY, on higher fund-based income, lower overhead expenses and lower impairment losses
RM million 1H FY14 1H FY13 YoY 2Q FY14 1Q FY14 QoQ 2Q FY13 YoY
Net interest income 4,800.2 4,808.9 (0.2)% 2,407.4 2,392.8 0.6% 2,381.5 1.1%
Net Fund based income (Islamic Banking) 1,458.7 981.9 48.5% 727.2 731.5 (0.6)% 506.7 43.5%
Net Fund Based income 6,258.9 5,790.8 8.1% 3,134.6 3,124.3 0.3% 2,888.2 8.5%
Non-interest income 2,597.0 3,069.6 (15.4)% 1,364.9 1,232.1 10.8% 1,705.4 (20.0)%
Fee based income (Islamic Banking) 159.0 303.5 (47.6)% 82.0 76.9 6.7% 159.4 (48.5)%
Net income from insurance business (100.4) (133.2) (24.6)% (102.2) 1.8 <0% (55.1) 85.7%
Net Fee Based income 2,655.6 3,239.9 (18.0)% 1,344.7 1,310.8 2.6% 1,809.7 (25.7)%
Net income 8,914.5 9,030.7 (1.3)% 4,479.3 4,435.1 1.0% 4,697.9 (4.7)%
Overhead expenses (4,254.8) (4,372.2) (2.7)% (2,086.4) (2,168.4) (3.8)% (2,214.3) (5.8)%
Pre-provisioning operating profit (PPOP)¹ 4,659.7 4,658.5 0.0% 2,392.9 2,266.7 5.6% 2,483.6 (3.7)%
Impairment losses (278.8) (520.0) (46.4)% (183.4) (95.4) 92.2% (436.4) (58.0)%
Operating profit 4,380.9 4,138.5 5.9% 2,209.5 2,171.3 1.8% 2,047.2 7.9%
Share of profits in associates 73.7 77.1 (4.4)% 37.3 36.5 2.2% 41.6 (10.5)%
Profit before taxation and zakat 4,454.6 4,215.6 5.7% 2,246.8 2,207.8 1.8% 2,088.8 7.6%
Profit attributable to equity holders (Net Profit)² 3,177.1 3,073.9 3.4% 1,575.5 1,601.6 (1.6)% 1,567.7 0.5%
EPS - Basic (sen) 35.6 36.1 (1.6)% 17.5 18.1 (3.4)% 18.2 (4.2)%
¹Pre-provisioning operating profit (PPOP)is equivalent to operating profit before impairment losses
²Net profit is equivalent to Profit attributable to equity holders of the Bank

12
4,658
1,748
906 791 258
1,207
419
4,660
1,920
909 702
113
1,398
402
Total Community FinancialServices
Corporate Banking Global Markets Investment Banking InternationalBanking
Insurance, Takaful &Asset Management
1H FY2013 1H FY2014
9.9% 0.3% -11.3%
9,031
3,532
1,107 911 784
2,597
770
8,915
3,646
1,136 788 591
2,797
739
Total Community FinancialServices
Corporate Banking Global Markets Investment Banking InternationalBanking
Insurance, Takaful &Asset Management
1H FY2013 1H FY2014
3.2% -13.5%
Global Banking (GB)
- 1.3%
-24.6% 7.7%
-10.2%
-4.0% 2.7%
Business Segment Performance: 1H FY2014 (1/2) Net income and PPOP for 1H FY2014 was softer, due to higher fee income gains in last year’s corresponding period
(RM
mill
ion
) (R
M m
illio
n)
Global Banking (GB) 0.0%
-56.2% 15.8% -4.1%
-11.8%
Note: Net income & pre-provisioning operating profit for group includes expenditures of Head Office & Others of RM669.5 million for 1H 2013 and RM783.1 million for 1H 2014
Net Income
Pre-provisioning Operating profit

13
Global Banking (GB) 5,791
2,706
780 348 94
1,809
456
6,259
2,800
777 360
79
2,026
478
Total CommunityFinancial Services
Corporate Banking Global Markets Investment Banking InternationalBanking
Insurance, Takaful& Asset
Management
1H FY2013 1H FY2014
3.5% -15.8% -0.4% 3.4% 12.0%
8.1%
-0.5%
4.9%
3,240
827 327 563 689 788
314
2,656
845 359 428 512 772
261
Total Community FinancialServices
Corporate Banking Global Markets Investment Banking InternationalBanking
Insurance, Takaful &Asset Management
1H FY2013 1H FY2014
-18.0 %
-25.8% -16.8% -24.0% 9.9% 2.3%
Global Banking (GB) -17.8%
-2.0%
Business Segment Performance: 1H FY2014 (2/2) Net fund based income was up 8.1% led by International Banking and Community Financial Services
(RM
mill
ion
) (R
M m
illio
n)
Fee-based Income -18.0%
Net Fund Based Income +8.1%
Note: Net fund based income includes expenditures of Head Office & Others of RM401.9 million for 1H FY13 and RM261.9 million for 1H FY14.
Fee-based income includes expenditures of Head Office & Others of RM267.6 million for 1H FY13 and RM521.2 million for 1H FY14

14
1,232
785
279
-97
228
37 2
77
1,365
902
212
86 92 73
(102)
82
Non-interestincome
Commission,service charges
and fees
Investment &Trading Income
Unrealised gain/(losses) onsecurities &derivatives
Foreign ExchangeProfit
Other Income Net Income fromInsurance Business
Fee Income fromIslamic Operations
1Q FY14 2Q FY14
-24.0% 189.0%
Fee based Income: 2Q FY2014 – QoQ (1/2) Core fee income increased by 10.8% QoQ due to higher commission, service charges and fees
14.9% -59.6% 98.6% -5822.3% 6.8%
10.8%
RM
million

15
3,070
1,754
875
(8) 309 140
(133)
304
2,597
1,687
491
(11) 320
110 (100)
159
Non-interestincome
Commission,service charges
and fees
Investment &Trading Income
Unrealised gain/(losses) onsecurities &derivatives
Foreign ExchangeProfit
Other Income Net Income fromInsurance Business
Fee Income fromIslamic Operations
1H FY2013 1H FY2014
-44.0% -27.2%
-15.4%
-3.8% -21.4% 24.6% -47.6% 3.8%
Fee based Income: 1H FY2014 – YoY (2/2) Core fee income decreased by 15.4% YoY primarily due to slower capital market activity in the first half of the year
RM
million

16
Group Loans Growth: 30 June 2014 Group loans growth picked up in 2Q, supported by robust international loans growth
30 Jun 14 31 Dec 13 YTD
Annualised 30 Jun 13 YoY
Group Gross Loans * 375.3 361.8 7.5% 331.9 13.1%
Malaysia (RM billion)** 226.4 223.6 2.5% 209.2 8.2%
Community Financial Services 159.4 151.9 9.8% 143.1 11.4%
Global Banking 67.0 71.7 (13.1)% 66.1 1.3%
International
(RM billion) 144.7 134.7 14.9% 119.4 21.2%
Singapore (SGD billion) 33.2 31.0 14.6% 28.0 18.6%
Consumer 11.1 10.6 9.6% 10.0 11.6%
Commercial 22.1 20.4 17.1% 18.1 22.5%
Indonesia (Rupiah trillion) 108.4 103.7 9.0% 86.4 25.5%
Consumer 37.6 35.3 12.8% 30.6 22.7%
Non-consumer 70.9 68.4 7.1% 55.8 27.1%
Other markets (RM billion) 29.8 26.3 27.0% 21.8 37.0%
Investment Banking
(RM billion) 4.2 3.5 37.6% 3.3 28.9%
*Including Islamic loans sold to Cagamas and excludes unwinding of interest
**Takes into account others portion - Jun 14: 0.0 vs Jun 13: (0.0)

17
RM billion 30 Jun 14 31 Dec 13 YTD
Annualised 30 Jun 13 YoY
Community Financial Services (Reported) 159.4 151.9 9.8% 143.1 11.4%
Community Financial Services (Re-based*) 159.4 151.4 10.5% 143.1 11.4%
Consumer (Reported) 128.4 121.9 10.6% 114.6 12.0%
Consumer (Re-based*) 128.4 122.2 10.2% 114.6 12.0%
Total Mortgage 56.8 53.8 11.2% 50.9 11.5%
Auto Finance 37.0 35.0 11.8% 32.9 12.7%
Credit Cards 5.5 5.6 (2.8)% 5.4 2.7%
Unit Trust 27.3 26.3 7.4% 24.2 12.9%
Other Retail Loans (Reported) 1.8 1.3 74.6% 1.3 38.0%
Other Retail Loans (Re-based*) 1.8 1.6 31.1% 1.3 38.0%
Business Banking + SME (Reported) 31.0 29.9 6.9% 28.5 8.7%
Business Banking + SME (Re-based*) 31.0 29.2 11.9% 28.5 8.7%
SME (Reported) 6.4 6.0 10.4% 5.4 17.8%
SME (Re-based*) 6.4 5.3 42.1% 5.4 17.8%
Business Banking (Reported) 24.6 23.9 6.0% 23.1 6.6%
Business Banking (Re-based*) 24.6 24.0 5.2% 23.1 6.6%
Global Banking (Corporate)
- Reported 67.0 71.7 (13.1)% 66.1 1.3%
- Re-based* 67.0 72.1 (14.3)% 66.1 1.3%
- Re-based** 74.1 75.4 (3.6)% 69.9 6.0%
Total Domestic^ 226.4 223.6 2.5% 209.2 8.2%
Malaysia Loans Growth: 30 June 2014 Consumer loan growth was above system, while Global Banking saw slower loan growth due to offshore financing
and repayments
*Re-based loan growth figures are based on adjusted 31 Dec 2013 position in line with migration of client accounts which are implemented on 1 January 2014
**Rebased loan growth figures include CB loans centred in Labuan and unrated bonds which is captured by Global Markets
^Including Islamic loans sold to Cagamas and excludes unwinding of interest and takes into accounts others portion – Jun 14: 0.0 vs Jun 13: (0.0)

18
30 Jun 14 31 Dec 13 YTD
Annualised 30 Jun 13 YoY
Group Gross Deposits 406.5 395.6 5.5% 372.5 9.1%
Malaysia
(RM billion) 265.1 259.1 4.6% 241.7 9.7%
Savings Deposits 38.7 37.6 6.2% 37.3 3.9%
Current Accounts 67.1 65.8 4.0% 56.5 18.8%
Fixed Deposits 137.4 138.3 (1.3)% 125.7 9.3%
Others 21.8 17.4 50.2% 22.2 (1.8)%
International 143.3 138.6 6.9% 132.1 8.5%
Singapore
(SGD billion) 35.0 34.0 5.9% 33.9 3.1%
Savings Deposits 4.3 4.1 6.0% 3.8 13.6%
Current Accounts 4.8 4.7 5.2% 3.4 38.8%
Fixed Deposits 25.2 24.7 4.2% 26.3 (4.1)%
Others 0.7 0.5 101.7% 0.4 76.3%
Indonesia
(Rupiah trillion) 106.2 107.5 (2.4)% 91.3 16.3%
Savings Deposits 24.3 24.7 (3.4)% 20.3 19.7%
Current Accounts 16.4 17.7 (14.6)% 15.1 8.7%
Fixed Deposits 65.5 65.1 1.3% 55.9 17.2%
Group Deposit Growth: 30 June 2014 Deposit growth improved in 2Q FY2014, with current accounts and savings deposits expanding in Malaysia and Singapore

19
LDR and CASA Ratio: 30 June 2014 CASA ratio was stable in key markets while Group LDR improved
Singapore BII Group
Group Malaysia
85.9% 86.6% 87.8% 87.9% 86.8%
38.8% 40.7% 39.9% 40.0% 39.9%
Jun-13 Sep-13 Dec-13 Mar-14 Jun-14
93.7% 95.5% 95.7% 98.3% 101.1%
38.7% 39.7% 39.4% 37.8% 38.3%
85.0% 86.4% 87.0% 88.9% 90.8%
Jun-13 Sep-13 Dec-13 Mar-14 Jun-14
LDR (Bank Level)
87.5% 88.2% 89.9% 91.0% 90.6%
34.2% 36.1% 36.1% 35.8% 35.7%
Jun-13 Sep-13 Dec-13 Mar-14 Jun-14
LDR CASA
82.2% 84.6% 90.9% 93.5% 94.7%
21.2% 23.6% 25.9% 25.8% 25.8%
Jun-13 Sep-13 Dec-13 Mar-14 Jun-14

20 20
Key Operating Ratios Operating ratios improved overall in 2Q but ROE and fee income ratio were still behind guidance
(%) 1H FY14 1H FY13 Variance
YoY 2Q FY14 1Q FY14
Variance
QoQ 2Q FY13
Return on Equity 13.5 14.4 (0.9)% 13.4 13.8 (0.4)% 14.7
Net Interest Margin 2.36 2.45 (9 bps) 2.35 2.37 (2bps) 2.44
Fee to Income Ratio 29.8 35.9 (6.1)% 30.0 29.6 0.4% 38.5
Loans-to-Deposit Ratio 90.6 87.5 3.1 % 90.6 91.0 (0.4)% 87.5
Cost to Income Ratio# 47.4 48.0 (0.6)% 46.3 48.6 (2.3)% 46.7
Asset Quality
Gross Impaired Loans Ratio 1.50 1.86 (36 bps) 1.50 1.52 (2 bps) 1.86
Net Impaired Loans Ratio 0.97 1.09 (12 bps) 0.97 0.99 (2 bps) 1.09
Loans Loss Coverage 107.7 103.5 4.2% 107.7 107.2 0.5% 103.5
Net Charge off rate (bps) 20 32 (12 bps) 17 23 (6 bps) 53
Capital Adequacy (Group)^
CET1 Capital Ratio 11.44 10.07 1.37 11.44 10.76 0.68 10.07
Total Capital Ratio 15.96 14.51 1.45 15.96 15.11 0.85 14.51
# Total cost excludes amortisation of intangibles for BII and Kim Eng.
^ The capital ratios are adjusted based on the assumption of 85% reinvestment rate under the DRP

21
Overheads: 1H FY2014 Group CIR improved to 47.4% from 48.0% a year ago
(RM million) 1H FY2014 1H FY2013
YoY
2Q FY2014
1Q FY2014
QoQ
Personnel costs 2,380.1 2,501.0 (4.8)% 1,142.8 1,237.3 (7.6)%
IT Expenses 260.3 296.9 (12.3)% 154.4 105.9 45.8%
Marketing Expenses 327.9 317.9 3.1% 192.6 135.3 42.3%
Admin &general expenses,
fees & brokerage,
establishment costs, and
depreciation & amortisation
1,286.5 1,256.5 2.4% 596.6 689.9 (13.5)%
Total 4,254.8 4,372.3 (2.7)% 2,086.4 2,168.4 (3.8)%
Group overheads composition
% 1H FY2014 1H FY2013 YoY 2Q FY2014 1Q FY2014 QoQ
Total Cost to Income 47.4% 48.0% (0.6)% 46.3% 48.6% 2.3%
Group JAW Position (1.4)% (2.8)%

22
86.0
427.6
270.5
-54.5
210.1
154.4
513.6
364.5
1QFY13
2QFY13
3QFY13
4QFY13
1QFY14
2QFY14
1H2013
1H2014
Allowances for losses on loans
Asset Quality: 30 June 2014 GIL and NIL improved both YoY and QoQ
Group Impaired Loans Ratio Allowance for losses on loans
1.86
1.57
1.28 1.22 1.09 1.18 1.09 1.06
0.95 0.99 0.97
2.84
2.44
2.00 1.90
1.78 1.89
1.86 1.83
1.48 1.52 1.50
Dec2011
Mar2012
Jun2012
Sep2012
Dec2012
Mar2013
Jun2013
Sep2013
Dec2013
Mar2014
Jun2014
Gross Impaired Loans Ratio (%)
Net Impaired Loans Ratio (%)
99.0%
103.5%
106.3%
107.5% 107.2% 107.7%
Loan loss coverage
(RM
mill
ion
)

23
Asset Quality by Market Stable asset quality for Malaysia and Singapore, while Indonesia continued to see elevated asset quality indicators
Malaysia Singapore BII Group
2.21 2.19 2.15
1.69 1.77
1.71
1.48 1.35
1.29
1.06 1.12
1.05
Mar-13 Jun-13 Sep-13 Dec-13 Mar-14 Jun-14
0.43 0.45
0.42
0.29 0.29
0.26 0.28
0.30
0.26
0.22 0.21 0.20
Mar-13 Jun-13 Sep-13 Dec-13 Mar-14 Jun-14
Gross Impaired Loans Ratio (%)
Net Impaired Loans Ratio (%)
1.96 1.82
2.15
2.81 2.98
3.53
1.43 1.76 1.70
2.46 2.53
2.95
Mar-13 Jun-13 Sep-13 Dec-13 Mar-14 Jun-14

24
Group Capital Adequacy: 30 Jun 2014 Total capital ratio at 15.96% (assuming 85% dividend reinvestment rate) and CET1 at 11.44%
11.64% 11.44% 11.38% 11.02%
13.19% 12.99% 12.93% 12.83%
16.16% 15.96% 15.90% 15.43%
Jun 14 Jun 14 Jun 14 Dec 13
Total Capital Ratio Tier 1 Capital Ratio CET 1 Capital Ratio
After proposed
dividend, assuming
85% reinvestment
rate
Group
Bank
Before
proposed
dividend
After proposed
dividend, assuming
85% reinvestment
rate
After proposed
dividend, based on
BNM’s Implementation
Guideline*
16.50% 16.22% 16.13%
15.61%
Jun 14 Jun 14 Jun 14 Dec 13
CET 1, Tier 1 and Total Capital Ratio
Note:
• CET1, Tier 1 and Total Capital Ratio are computed in accordance with Capital Adequacy Framework (Capital Components) issued by BNM in November 2012.
• Based on 85% reinvestment rate under the DRP, fully loaded, the CET1 Ratio would be at 10.67% (Group) and 9.57% (Bank) respectively.
* Capital ratios computed based on BNM’s implementation Guidelines on Capital Adequacy Framework (Capital Components) issued on 8th May 2013.

25
Dividend Dividend payout ratio will remain high in 2014 above policy rate of 40% - 60%
60.0% 61.0%
76.5% 74.9% 79.9% 74.7% 71.9%
68.9%
26
11
28 32 22.5 24
18
8
44
32
36
33
31
FY08** FY09 FY10 FY11 FP11 FY12 FY13 FY14
Final
Interim
The Board has recommended a single-tier interim dividend of 24 sen consisting of 4 sen cash portion and
20 sen electable portion for the Dividend Reinvestment Plan.
Dividend Payout Ratio
* Reinvestment rate for the Dividend Reinvestment Plan
** Adjusted for 1:4 Bonus Issue in February 2008 and 9:20 Rights Issue at RM2.74 in March 2009
# The Net Dividend is 28.5 sen of which 15 sen is single-tier dividend.
Gross Dividend (sen) and Payout Ratio (%)
85.9%*
85.7%*
88.2%* 85.9%*
88.5%* 91.1%*
86.1%*
88.6%*
#
N.A.*

26
Table of Contents
Financial Results: 2Q FY2014 and 1H FY2014 ended 30 June 2014
Appendix: Business Sector Review
11
2
27
1. Community Financial Services
2. Global Banking
3. Maybank Singapore
4. Bank Internasional Indonesia
5. Other segments
6. Affiliates
31
36
41
44
48
52
Executive Summary
Financial Performance
Prospects & Outlook
7. Quarterly Financial Summary 55

27
Malaysia
Market Outlook Key developments for 2H FY2014
Singapore
Indonesia
Outlook Key Developments
• Growth expected to taper in
2H 2014 and 2015 as
Government remains
committed to contain its
deficit spending
• GDP(f) 6.0% (2013: 4.7%)
• System loan(f) 9-10%
• System deposit(f) 7-8%
• GDP(f) 3.3% (2013: 3.9%)
• System loan(f) 10%
• System deposit(f) 3%
• Continued upward trend of
foreign fund flows dependent
on Jokowi’s ability to deliver
structural reforms
• GDP(f) 5.20% (2013: 5.78%)
• System loan(f) 16-17%
• System deposit(f) 11%
• From a 12-month high in July 2014, consumer spending is expected to
taper off in the event of further fuel subsidy removal, as seen last
year after the fuel hike in June 2013
• Low-to-mid low end segment may not be as hard hit as minimum
wage is set to increase
• Weaker 2H expected on the back of competition for deposits and in
selected segments such as trade loans
• Asset quality to remain steady in 2H
• SGD deposits gathering continue to soften but ability to raise USD
deposits improving
• BNM raised OPR by 25bps to 3.25% in July 2014 with another 25bps
hike expected
• Economic growth expected to taper in 2H 2014 and 2015 due to
tighter macroeconomic policies on domestic spending amid
Government’s commitment to reduce its deficit spending
• ETP-related investments and oil and gas investments expected to
gather pace
28
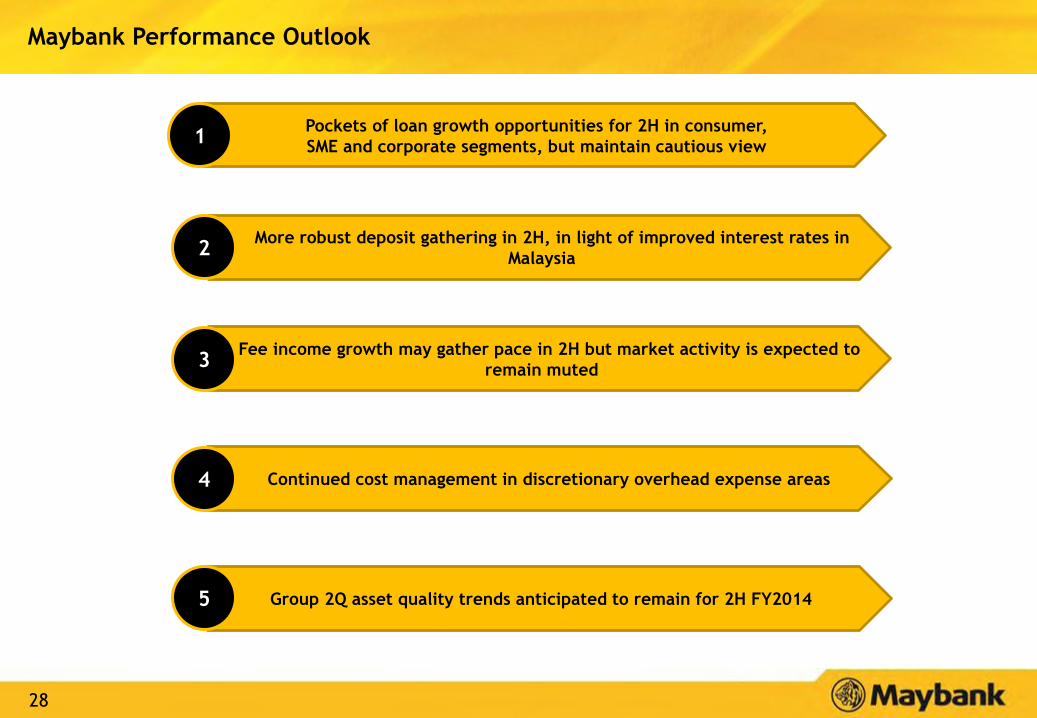
Pockets of loan growth opportunities for 2H in consumer,
SME and corporate segments, but maintain cautious view
More robust deposit gathering in 2H, in light of improved interest rates in
Malaysia
Fee income growth may gather pace in 2H but market activity is expected to
remain muted
Continued cost management in discretionary overhead expense areas
Group 2Q asset quality trends anticipated to remain for 2H FY2014
1
2
3
4
5
Maybank Performance Outlook

29
Key Performance Targets 2014
• Estimated at ~14.0% ROE
Group Loans Growth
Malaysia Loans Growth
Singapore Loans
Growth
Indonesia Loans
Growth
Group Deposits
Growth
• Loans growth expected to be in line with target driven by
International
• Range of 9%-10%, in line with system
• Expected to be in line with target
• Range of 16%-17%, in line with system
• Range of 10%-12%

30
Table of Contents
Financial Results: 2Q FY2014 and 1H FY2014 ended 30 June 2014
Appendix: Business Sector Review
11
2
27
1. Community Financial Services
2. Global Banking
3. Maybank Singapore
4. Bank Internasional Indonesia
5. Other segments
6. Affiliates
31
36
41
44
48
52
Executive Summary
Financial Performance
Prospects & Outlook
7. Quarterly Financial Summary 55

31
Community Financial Services (1/4) Growth in HNW and Affluent customer segments sustained with continued refinement of segment-led business model
and tactical campaigns
* Customer classification: HNW (IA > RM250K, TFA > RM1M); Affluent (IA between > RM 50K to < RM250K, TFA between > RM250K to < RM1m)
* TFA: Total Financial Assets (Deposits, Investments & Financing), IA: Investable Assets (Deposits & Investments)
124.4
128.7
133.5
137.3
141.6
6.26 6.30
6.37
6.48
6.54
6.10
6.20
6.30
6.40
6.50
6.60
115.0
120.0
125.0
130.0
135.0
140.0
145.0
2Q 2013 3Q 2013 4Q 2013 1Q 2014 2Q 2014
TFA RM billion Product per customer
96.7
98.7
101.0
103.2 104.7
2.90
2.95 2.99
3.04 3.08
2.80
2.90
3.00
3.10
3.20
92.0
94.0
96.0
98.0
100.0
102.0
104.0
106.0
2Q 2013 3Q 2013 4Q 2013 1Q 2014 2Q 2014
TFA RM billion Product per customer
Strategic product bundling for the Mass segment customers
under Maybank One has helped increase the Bank’s share-of-
wallet for Mass customers and defend the bank’s market
share for Mass segment.
Emphasis will remain on product bundling of Maybank One to
expand market share in the Mass segment.
Continued refinement of segment-led business model and
implementation of tactical campaigns to create customer
stickiness has sustained growth in the HNW and Affluent
segment.
Currently, the following brands serve the needs of our HNW
and Affluent customers with segment specific privileges:
• Private Wealth for Ultra HNW segment
• Premier Wealth for HNW segment
• Aspire for Affluent segment
HNW & Affluent Customer TFA grew 12.1% (Ann.)
with higher product cross sell ratio
Mass Customer TFA grew 7.3% (Ann.) with focus on
increasing customer’s share of wallet

32
Community Financial Services (2/4) Loans expanded by 10.5% (annualised) despite intense market competition
114.6 117.8
121.9 124.9
128.4
17.1 17.1
17.2 17.2 17.2
17
17.1
17.2
17.3
90
100
110
120
130
2Q 2013 3Q 2013 4Q 2013 1Q 2014 2Q 2014
Loan Balance RM billion Market Share %
122.2*
143.1 146.8
151.9 154.5
159.4
2Q 2013 3Q 2013 4Q 2013 1Q 2014 2Q 2014
CFS Loan Balance RM billion
28.5 29.0
29.9 29.6
31.0
2Q 2013 3Q 2013 4Q 2013 1Q 2014 2Q 2014
Loan Balance RM billion
Consumer loans annualised growth was mainly driven by mortgage
growth of 11.2%, auto growth of 11.8% and retail lending growth of
8.7%.
Retail SME saw a growth of 42.1% (ann.) was primarily driven by
higher term loan facilities utilisation by customers given the
positive business sentiment and competitive pricing.
Business Banking grew 5.2% (ann.) driven by higher utilisation of
term loan facilities but offset by lower utilisation of trade
facilities owing to intense price competition in the market.
Overall loans growth for CFS grew 10.5% (Ann.) to
RM159.4 billion
Consumer loans grew 10.2% (Ann.) to RM128.4 billion
Retail SME and Business Banking loans improved by
11.9% (Ann.) to RM31.0 billion
151.4*
29.2*
*Re-based loan growth figures are based on adjusted 31 Dec 2013 position in line with migration of
client accounts which are implemented on 1 January 2014.. Annualised growth is computed based
on rebased position.

33
Community Financial Services (3/4) Amidst stiff rate competition to attract depositors, CFS deposit grew by 9.6% (annualised)
102.7 105.4
107.5 111.0 112.4
18.3 18.7
19.0 19.0 19.1
16.0
17.0
18.0
19.0
20.0
21.0
22.0
80.0
90.0
100.0
110.0
120.0
2Q 2013 3Q 2013 4Q 2013 1Q 2014 2Q 2014
Deposit Balance RM billion Market Share %
107.2*
161.3
168.2
172.9 169.6
174.2
2Q 2013 3Q 2013 4Q 2013 1Q 2014 2Q 2014
Deposit Balance RM billion
CFS Deposits grew 9.6% (Ann.) mainly driven by
consumer deposit growth
Consumer deposit grew 9.7% (ann.) on the back of fixed deposit
(12.1%) and CASA (6.1%) growth due to strategic use of CRM
analytics and implementation of tactical segment focused
campaigns.
Retail SME grew 11.2% (ann.) while Business Banking was up 4.5%
(ann.) due to higher fixed and demand deposits as a result of
competitive pricing and tactical account management initiatives to
improve customer relationships to attract deposits.
Consumer Deposit saw strong growth of 9.7% (Ann.)
CFS
Deposi
t
Consu
mer
Deposi
t
Reta
il S
ME +
BB
Deposi
t
Retail SME and Business Banking deposits improved 9.4%
(Ann.)
58.6 62.9
65.5
58.5 61.8
2Q 2013 3Q 2013 4Q 2013 1Q 2014 2Q 2014
Deposit Balance RM billion
166.2*
59.1*
*Re-based loan growth figures are based on adjusted 31 Dec 2013 position in line with migration of
client accounts which are implemented on 1 January 2014.. Annualised growth is computed based
on rebased position.

34
Community Financial Services (4/4) Stronger credit asset quality with continued decline in GIL
3,257.9 3,281.9
2,837.5 2,872.4 2,812.7
2.3 2.2
1.9 1.9
1.8
1.5
2.0
2.5
2Q 2013 3Q 2013 4Q 2013 1Q 2014 2Q 2014
1,500.0
2,000.0
2,500.0
3,000.0
GIL RM million GIL %
CFS GIL improved to 1.8% with YoY reduction from 2.3% Consumer GIL rate declined YoY to 0.5% from 0.6%, the
lowest in the industry
Retail SME and Business Banking GIL declined YoY to
7.0% from 9.0% due to better credit asset quality
CFS GIL has shown QoQ improvement, ending at 1.8% for
2Q 2014
GIL % 2Q'13 3Q'13 4Q'13 1Q'14 2Q'14
CFS 2.3 2.2 1.9 1.9 1.8
Consumer 0.6 0.6 0.5 0.5 0.5
Mortgage 0.9 0.8 0.7 0.8 0.7
Auto 0.5 0.5 0.4 0.5 0.5
Credit Cards 1.0 0.9 0.9 1.0 0.8
Unit Trust Loan 0.1 0.1 0.04 0.04 0.1
Retail SME/ BB 9.0 9.0 7.4 7.5 7.0
SME 4.3 4.3 3.5 3.5 3.0
BB 10.1 10.1 8.4 8.4 8.0
715.1 685.3 620.3
667.0 670.1
0.6 0.6
0.5 0.5 0.5
0.4
0.5
0.6
0.7
2Q 2013 3Q 2013 4Q 2013 1Q 2014 2Q 2014
400.0
500.0
600.0
700.0
800.0
GIL RM million GIL %
2,542.8 2,596.6 2,217.2 2,205.4 2,142.5
9.0 9.0
7.4 7.5 7.0
5.0
7.0
9.0
11.0
2Q 2013 3Q 2013 4Q 2013 1Q 2014 2Q 2014
1,000.0
1,500.0
2,000.0
2,500.0
GIL RM million GIL %

35
Table of Contents
Financial Results: 2Q FY2014 and 1H FY2014 ended 30 June 2014
Appendix: Business Sector Review
11
2
27
1. Community Financial Services
2. Global Banking
3. Maybank Singapore
4. Bank Internasional Indonesia
5. Other segments
6. Affiliates
31
36
41
44
48
52
Executive Summary
Financial Performance
Prospects & Outlook
7. Quarterly Financial Summary 55

36
Global Banking (1/4) Corporate banking loans lower by 13.1% (annualised) as at end June 2014
2.6
31.0
32.5
2.7
34.1
34.9
2.6
28.8
35.5
Jun'14
Dec'13
Jun'13
Trade Finance and Others
Overdraft
Trade Finance market share ¹
Corporate Banking GILR at 1.59%
Total GB loans lower by 13.1% (ann.) to RM67.0 billion but
grew 1.3% YoY
-7.2% YoY
+1.7% YoY
RM billion
1Market share of total trade products (On Balance Sheet items, Contingent Liabilities and
Others)
+9.4% YoY
2.05% 2.01%
1.36%
1.62% 1.59%
Jun'13 Sep'13 Dec'13 Mar'14 Jun'14
Term Loan
26.0% 25.6%
27.1%
25.5%
24.8%
Jun'13 Sep'13 Dec'13 Mar'14 Jun'14

37
Global Banking (2/4) Global Markets’ business regionally saw PBT growth of 5.8% YoY for 1H FY2014
45.3%
32.1%
20.6%
0.3%
0.9%
0.8%
A
RM17.8
billion
Commercial
Papers
1,016
1,076
1H FY13 1H FY14
47.6 46.4 47.7 50.8 50.9
37.7 39.4 39.5 40.9 41.4
8.6 9.7 9.2 10.6 8.7
Jun 13 Sep 13 Dec'13 Mar'14 Jun'14
Others
PDS/CorpBonds
Govt.Securities
95.5
57.2% 19.7%
19.0%
1.0%
3.0%
0.2%
<A
27.3%
23.1% 24.1%
16.9%
8.6%
730 646
501 608
1H FY13 1H FY14
Net interest income
Non-interest income
1,254 1.8%
Group Securities Portfolio grew 7.6% YoY
+7.6% YoY
93.9 102.3 101.0
96.4
PBT and Revenue grew by 5.8% and 1.8% YoY respectively
5.8%
1,231
PBT Revenue
RM
million
Note: PBT & Revenue includes regional performance
Group Securities Portfolio: 40.0% Foreign Securities as at
Jun 2014
RM 101.0
billion
YTD Jun 14
52.7% of GM PDS (Maybank Conventional Domestic) rated
“AA” or above as at Jun 2014
RM14.7
billion RM
billion
YTD Jun 14 YTD Jun 13
Government
Securities
-Domestic
Government
Securities
-Foreign
PDS/Corp
Bonds
-Domestic
PDS –
Foreign
Others (NIDs,
BA, etc)
26.3%
24.5% 22.9%
17.3%
9.1%
PDS/Corp
Bonds
-Domestic
RM93.8
billion
Government
Securities
-Domestic
Government
Securities
-Foreign
PDS –
Foreign
Others (NIDs,
BA, etc)
YTD Jun 13
SA (Govt.
Guaranteed)
AAA
AA
SA (Govt.
Guaranteed) AAA
AA
A Commercial
Papers
Note: Group PDS (Maybank Domestic) for YTD Jun 2013 and YTD Jun 2014 are RM18.0 billion
and RM20.6 billion respectively
<A

38 38
Malaysia, RM233.2 (39%)
Singapore, RM136.4 (23%)
Thailand, RM132.3 (22%)
Indonesia, RM9.0 (2%)
Philippines, RM26.8 (5%)
Hong Kong, RM27.5 (5%) Others,
RM26.0 (4%)
Global Banking (3/4) Maybank Kim Eng’s 1H FY2014 total income registered at RM591.2mil
YTD June 2014 Equity Brokerage League Table by Country
* Ranking is not disclosed in respective exchanges
Note: Maybank Kim Eng represents the combined business of Maybank IB and business segments under Maybank Kim Eng Holdings
1H FY2014 Total Income (RM’Mil)
RM591.2mil
Country Rank Market Share Trading Value
(RM’Mil)
Thailand 1 9.9% 76,797
Malaysia 3 9.4% 49,907
Indonesia 5 4.4% 17,372
Philippines 5 7.1% 10,376
Singapore N/A* 5.9% 42,341
Hong Kong Tier2 0.2% 13,742
1H FY2014 Fee-based Income for Malaysia
783.7
591.2
1H FY2013 1H FY2014
- 24.6% YoY
RM
Million
Total Income for Maybank Kim Eng declined 24.6% YoY
Arrangers' Fees 33%
Brokerage 47%
Other Fee Income
4%
Agency/ Guarantee Fees
2%
Advisory Fees 3%
Placement Fees 8%
Primary Subscriber's
Fees 1% Underwriting
Fees 2%

39 39
Global Banking (4/4) Maybank Kim Eng achieved the Top 3 position in ASEAN Investment Banking & Advisory League Table
ASEAN IB&A League Tables – As at June 2014
2,617
2,649
2,684
2,763
4,597
5,298
5,879
6,879
8,360
12,174
8.9%
9.0%
9.1%
9.4%
15.6%
18.0%
20.0%
41.4%
28.4%
41.4%
AmInvestment Bank Bhd
Deutsche Bank
CIMB Group
BoA Merrill Lynch
Maybank
DBS
UOB
Morgan Stanley
Lazard
Credit Suisse
Market Share - M&A Volume (USD'Mil)
3,986
4,111
4,580
4,938
5,139
5,171
5,278
5,510
6,738
9,889
3.6%
3.7%
4.1%
4.4%
4.6%
4.6%
4.7%
4.9%
6.0%
8.8%
Deutsche Bank
JPMorgan
Siam Commercial Bank
DBS
Maybank
Citi
BoA Merrill Lynch
CIMB Group
Standard Chartered Bank
HSBC
Market Share - DCM + Loans Volume (USD'Mil)
7,925
8,033
8,360
8,706
9,215
9,318
10,082
10,233
10,629
13,814
5.21%
5.29%
5.50%
5.73%
6.06%
6.13%
6.63%
6.73%
6.99%
12.7%
Morgan Stanley
Standard Chartered Bank
Lazard
BoA Merrill Lynch
CIMB Group
UOB
HSBC
Maybank
DBS
Credit Suisse
Market Share - IB&A Volume (USD'Mil)
311
358
392
497
618
665
776
873
909
1,021
3.0%
3.5%
3.8%
4.8%
6.0%
6.5%
7.6%
10.0%
8.9%
41.4%
AmInvestment Bank Bhd
RHB Capital Bhd
DBS
Maybank
Goldman Sachs
BoA Merrill Lynch
UBS
Credit Suisse
Citi
CIMB Group
Market Share - ECM Volume (USD'Mil)
Source: Dealogic

40
Table of Contents
Financial Results: 2Q FY2014 and 1H FY2014 ended 30 June 2014
Appendix: Business Sector Review
11
2
27
1. Community Financial Services
2. Global Banking
3. Maybank Singapore
4. Bank Internasional Indonesia
5. Other segments
6. Affiliates
31
36
41
44
48
52
Executive Summary
Financial Performance
Prospects & Outlook
7. Quarterly Financial Summary 55

41
Maybank Singapore (1/2) Loans increased by 14.6% (annualised) as at June, spurred by stronger lending growth of 17.1% to businesses
7.8 7.8 8.7
3.9 4.4 8.7
3.1 4.0
4.2 3.2 4.3 0.6
5.3 6.1 6.5
2.9 2.6 2.3
1.7 1.9 2.3
Jun-13 Dec 13 Jun-14
Other (Consumer)
Car Loan
Housing Loan
Others (Corporate)
Non-Bank financialInstGeneral Commerce
Building & Const
Loans portfolio expanded by 14.6% (annualised) to
reach S$33.2 billion as of June 2014.
Business loans grew 17.1% (annualised) to S$22.1
billion as of Jun 2014. Growth was mainly driven
by trade finance loans, coupled with higher
lending to non-bank financial institutions.
Consumer loans grew 9.6% annualised to reach
S$11.1 billion as of Jun 2014. Housing and other
personal loans continued to register strong growth.
However, car loans continued to decline due to the
limited COE (certificate of entitlement) supply and
tight regulatory financing limits.
0.45 0.44 0.46 0.43
0.30 0.31 0.28
0.31 0.29 0.32 0.28 0.24 0.23 0.22
Dec 12 Mar 13 Jun 13 Sep-13 Dec-13 Mar-14 Jun-14
GIL Ratio NIL Ratio
Asset Quality improved YoY in June 2014
10.6%
13.6% 11.1% 13.6% 13.8% 13.3%
18.6%
10.4% 15.3%
15.1%
16.4% 19.5%
17.3%
16.5%
Dec 12 Mar 13 Jun 13 Sep 13 Dec 13 Mar 14 Jun 14
Maybank Singapore Growth Industry Growth
Maybank Singapore loans growth of 18.6% YoY
Diversified Loan Portfolio
14.6% annualised
28.0 31.0 33.2
Consumer
33%
Corporate
67%
SG
D b
illion

42
Maybank Singapore (2/2) PBT rose 5.6% YoY to S$209 million, led by gains in fee based income of 20.4% and fund based income of 17.5%
(SGD mil) 1H FY2014 1H FY2013 YoY
Net Fund Based income 244.62 208.12 +17.5%
Net Fee Based income 150.77 125.27 +20.4%
Net income 395.39 333.39 +18.6%
Overhead expenses 166.88 144.56 +15.4%
Operating profit 228.51 188.83 +21.0%
Profit before taxation 209.09 198.08 +5.6%
• PBT grew 5.6% YoY or S$11 million to S$209.09 million in the first half of FY 2014, buoyed by robust growth
across fee- and fund- based income.
• Fee-based income increased 20.4% YoY, led by growth in treasury, wealth management and trade finance
income.
• Fund-based income rose 17.5% YoY on the back of improvements in both loan margin and loan base.
• Overhead expenses increased by 15.4% YoY due to greater human capital investments.

43
Table of Contents
Financial Results: 2Q FY2014 and 1H FY2014 ended 30 June 2014
Appendix: Business Sector Review
11
2
27
1. Community Financial Services
2. Global Banking
3. Maybank Singapore
4. Bank Internasional Indonesia
5. Other segments
6. Affiliates
31
36
41
44
48
52
Executive Summary
Financial Performance
Prospects & Outlook
7. Quarterly Financial Summary 55

44
Bank Internasional Indonesia (1/3) 1H FY2014 net profit Impacted by NIM compression and increased provisioning
Note: Published results based on Bank Indonesia classification
(IDR bil) 1H FY2014 1H FY2013 YoY 2Q FY2014 1Q FY2014 QoQ
Net Fund Based income 2,953 2,810 5% 1,506 1,447 4%
Net Fee Based income 1,076 992 8% 572 504 13%
Net income 4,029 3,803 6% 2,078 1,952 6%
Overhead expenses (2,723) (2,651) 3% (1,355) (1,367) (1)%
Personnel (1,095) (1,227) (11)% (592) (503) 18%
General & Administrative (1,628) (1,424) 14% (764) (864) (12)%
Operating profit 1,307 1,152 13% 722 585 24%
Provisions Expenses (703) (324) 117% (368) (335) 10%
Non Operating Income/ Expenses (93) 139 (167)% (123) 30 (515)%
Profit Before Tax before Minority Interest 511 966 (47)% 232 279 (17)%
Net Profit 336 681 (51)% 147 189 (22)%
EPS - Basic (IDR) 5.5 12.1 (55)% 2.4 3.1 (22)%

45
5.73% 5.34% 5.20%
4.75%
Dec-12 Jun-13 Dec-13 Jun-14
14.7 15.1 17.7 16.4
18.8 20.3 24.7 24.3
52.5 55.7 64.9 65.2
86.0 91.1
107.3 105.9
Dec-12 Jun-13 Dec-13 Jun-14
Current Account Saving Account Time Deposit
25.5 23.9 31.0 29.4
27.1 30.2 35.3 38.3
28.3 31.1
35.8 38.3 80.9 85.2 102.1
106.0
Dec-12 Jun-13 Dec-13 Jun-14
Global Banking Business Banking Retail Banking
Net Interest Margin (Consolidated)
Asset Quality (Consolidated)
Loans composition (Consolidated)
Deposits Growth (Consolidated)
IDR trillion 16.2% YoY
Bank Internasional Indonesia (2/3) Loans expanded by 7.7% (annualised) as at end June 2014
24.5% YoY IDR trillion
2.19% 1.85%
2.85%
3.61%
1.26% 1.13%
2.24%
2.77%
Dec-12 Jun-13 Dec-13 Jun-14
Impaired Loan Gross Impaired Loan Net
7.7% (Ann.)
-2.5% (Ann.)

46
753 769
33 35
1H FY2013 1H FY2014
Total Revenue Profit Before Tax
2.66%2.85% 2.85%
3.05% 3.08%
1.38%1.57% 1.46% 1.30% 1.47%
Jun'13 Sep'13 Dec'13 Mar'14 Jun'14
NPL Gross (%) NPL Net (%)
168
66
234 201
77
278
New Used Total
1H FY2013 1H FY2014
Revenue and PBT (IDR billion)
(Stand Alone)
Consumer Financing (IDR billion)
(Stand Alone)
Unit Financing (’000 unit)
(Consolidated)
Asset Quality
(Consolidated)
+5.7% +15.6%
+20%
+36%
+18.7%
Bank Internasional Indonesia (3/3) Higher profits in WOMF due to improving operational efficiency despite tighter regulations
3,052
4,149
Jun'13 Jun'14

47
Table of Contents
Financial Results: 2Q FY2014 and 1H FY2014 ended 30 June 2014
Appendix: Business Sector Review
11
2
27
1. Community Financial Services
2. Global Banking
3. Maybank Singapore
4. Bank Internasional Indonesia
5. Other segments
6. Affiliates
31
36
41
44
48
52
Executive Summary
Financial Performance
Prospects & Outlook
7. Quarterly Financial Summary 55

48
Islamic Banking Total income grew YoY by 25.8% driven by higher fund based income
Group Islamic Banking Income
* Group Islamic Banking includes Maybank Islamic and the Group’s other Islamic
operations
** Other operating income comprise of fee income and other income
RM million 1H FY2014 1H FY2013 YoY
Growth
Fund based income 1,458.7 981.9 48.5%
Other operating income** 159.0 303.5 -47.6%
Total Income 1,617.7 1,285.4 25.8%
Maybank Islamic: Improving key ratios
Jun-14 Jun-13
Financing to Deposit Ratio (Adjusted) 90.4% 94.1%
Islamic Financing to Total Domestic
Loans 41.9% 34.4%
Gross Impaired Financing Ratio 0.67% 0.80%
Net Impaired Financing Ratio 0.46% 0.57%
Maybank Islamic: Total Gross Financing grew by 18.2%
(annualised) to RM94.8 bil
22.50
17.68
21.45
4.29
9.77 11.20
25.25
20.76
22.97
4.22
9.92 11.42
+24%
+35%
+14%
+3%
+4%
AITAB Mortgage Term Financing Others (CFS) Term Financing Others (GB)
Dec-13 Jun-14
q-3%
RM
billion
GB: +3% CFS: +22%

49
Insurance and Takaful Market leadership retained for General Insurance and Takaful
Total Assets (RM billion)
Gross Premium
-21.8% YoY
Profit Before Tax (RM million)
• PBT includes estimated transfer of RM39.57 million from Family Fund in June 2014
+2.1% YoY
+13.8% (Ann.)
* Market ranking in the bracket.
** Market Share & ranking data is for period Jan – Dec, except for 2013 (which is based
on rolling 12 months ending Mar’14). (Source: LIAM / ISM Statistics)
Insurance & Takaful – Market Share

50
Maybank Philippines Despite higher net interest income, PBT declined on lower non interest income and higher overheads
1,639.7
1,882.3
311.1 295.9
1H FY2013 1H FY2014
Revenue
PBT
37,257.5 41,141.6
50,587.3
43,293.2
As at 31 Dec 13 As at 30 June 14
PESO
Mil Gross
Loans
CustomerDeposits
Revenue and PBT
• PBT decreased by 4.9% YoY for the 1H FY2014 mainly due
to lower non interest income (NOII) and higher overheads.
• NOII was impacted by lower trading gains. Overheads rose
largely due to the additional 23 new branches from the
existing 56 as at Jun 2013.
• Gross loans grew 20.9% (annualised) driven by an increase
in term loans.
• Customer deposits was down by 28.8% (annualised) mainly
caused by a decline in fixed deposits and savings accounts.
• Gross impaired loans ratio was higher by 73 bps to 3.51%
from 2.78% in 4Q FY2013 previously, due to an increase in
impaired loan balance by PESO 409.1 million. Gross Loans and Deposits
Key Highlights
*Annualised growth
Key Ratios
1H
FY2014 4Q FY13
Return on assets 0.81% 1.09%
Return on equity 1.17% 5.41%
Cost-to-income ratio 80.04% 73.47%
Loans-to-deposit ratio 95.03% 73.65%
Gross Impaired Loans Ratio 3.51% 2.78%
Net Interest Margin 5.64% 5.12%
No. of branches 79 77
+14.8% YoY
-4.9% YoY
+20.9%*
-28.8%*
PESO
Mil

51
Table of Contents
Financial Results: 2Q FY2014 and 1H FY2014 ended 30 June 2014
Appendix: Business Sector Review
11
2
27
1. Community Financial Services
2. Global Banking
3. Maybank Singapore
4. Bank Internasional Indonesia
5. Other segments
6. Affiliates
31
36
41
44
48
52
Executive Summary
Financial Performance
Prospects & Outlook
7. Quarterly Financial Summary 55

52
An Binh Bank Revenue rose 6.0% backed by higher interest income from loans
739.8 784.4
214.4 170.3
1H FY2013 1H FY2014
Revenue
PBT
37,558.4 36,774.4
40,794.3 39,948.5
As at 31 Dec 13 As at 30 June 14
GrossLoans
CustomerDeposits
Revenue and PBT
Gross Loans and Deposits
• Although operating profit grew by VND50.5 billion YoY, PBT for
1H FY2014 declined by 20.5% due to higher loan loss
provisioning.
• Net interest income grew by VND102.1 billion backed by the
strong loan growth in FY2013.
• Overheads declined by 1.2% in line with cost saving
initiatives.
• Gross loans was down 4.2% (annualised) due to lower lending
to corporate, FI and retail banking.
• Despite intense market competition for term deposits, the
decline in customer deposits was slower at 4.2% (annualised).
• Gross NPL ratio rose to 5.58% from 3.91% in 4Q FY2013 mainly
due to lower loan base.
Key Ratios 1H FY2014 4Q FY2013
Return on assets 0.60% 0.30%
Return on equity 5.90% 3.20%
Cost-to-income ratio 64.56% 66.36%
Loans-to-deposit ratio 92.05% 92.07%
Gross NPL Ratio 5.58% 3.91%
Net Interest Margin 2.73% 2.98%
Key Highlights
+6.0% YoY
-20.5% YoY
-4.2%*
-4.2%*
VN
D B
il
VN
D B
il
*Annualised growth

53
24.9 27.1
18.2 18.1
1H FY2013 1H FY2014
Revenue
PBT
MCB Bank Revenue growth of 9.1% YoY owing to higher net interest income
268.5 303.3
620.4 672.8
As at 31 Dec 13 As at 30 June 14
GrossLoans
CustomerDeposits
• Revenue grew by 9.1% or PKR2.2 billion YoY on the
back of higher net interest income due to a policy
rate hike, resulting in NIMs improvement of 37bps.
• However, PBT marginally declined by 0.6% YoY
attributed to higher overheads and lower share of
associates’ profit in 1H FY2014.
• Gross loans rose 25.9% (annualised) led by private
sector business.
• Customer deposits expanded 16.9% (annualised)
contributed by higher CASA.
• Gross NPL ratio improved by 138 bps from 4Q FY2013
due to the drop in NPL amount, coupled with the
increase in loan base.
Revenue and PBT
Gross Loans and Deposits
+25.9%*
+16.9%*
-0.6% YoY
+9.1% YoY
Key Ratios 1H FY2014 4Q FY2013
Return on assets 2.79% 2.76%
Return on equity 22.99% 22.81%
Cost-to-income ratio 37.92% 40.40%
Loans-to-deposit
ratio 45.08% 43.27%
Gross NPL Ratio 7.29% 8.67%
Net Interest Margin 5.82% 5.45%
Key Highlights
PKR B
il
PKR B
il
*Annualised growth

54
Table of Contents
Financial Results: 2Q FY2014 and 1H FY2014 ended 30 June 2014
Appendix: Business Sector Review
11
2
27
1. Community Financial Services
2. Global Banking
3. Maybank Singapore
4. Bank Internasional Indonesia
5. Other segments
6. Affiliates
31
36
41
44
48
52
Executive Summary
Financial Performance
Prospects & Outlook
7. Quarterly Financial Summary 55

55
Group Gross Loans by quarter
31 Dec 13 31 Mar 14 Q1
Annualised 30 Jun 14
Q2
Annualised % Portfolio
Group Gross Loans * 361.8 366.6 5.3% 375.3 9.5%
Malaysia (RM billion)** 223.6 223.2 (0.7)% 226.4 5.8% 60%
Community Financial Services 151.9 154.5 6.9% 159.4 12.5% 70%
Global Banking 71.7 68.6 (17.1)% 67.0 (9.5)% 30%
International
(RM billion) 134.7 139.9 15.3% 144.7 13.9% 39%
Singapore (SGD billion) 31.0 31.4 5.1% 33.2 23.7%
Consumer 10.6 10.7 3.8% 11.1 15.3% 33%
Commercial 20.4 20.7 5.8% 22.1 28.1% 67%
Indonesia (Rupiah trillion) 103.7 103.4 (1.3)% 108.4 19.4%
Consumer 35.3 36.2 10.0% 37.6 15.1% 35%
Non-consumer 68.4 67.2 (7.1)% 70.9 21.7% 65%
Other markets (RM billion) 26.3 28.7 37.0% 29.8 15.6% 21%
Investment Banking
(RM billion) 3.5 3.6 7.6% 4.2 66.4% 1%
*Including Islamic loans sold to Cagamas and excludes unwinding of interest
**Takes into account others portion - Jun 14: 0.0 vs Jun 13: (0.0)

56
Malaysia Gross Loans by quarter
RM billion 31 Dec 13 31 Mar 14 Q1
Annualised 30 Jun 14
Q2
Annualised % Portfolio
Community Financial Services
(Reported) 151.9 154.5 6.9% 159.4 12.5% 70%
Community Financial Services
(Re-based*) 151.4 154.5 8.2% 159.4 12.5%
Consumer (Reported) 121.9 124.9 9.6% 128.4 11.3% 81%
Consumer (Re-based*) 122.2 124.9 8.8% 128.4 11.3%
Total Mortgage 53.8 55.0 9.2% 56.8 12.8% 44%
Auto Finance 35.0 35.9 11.0% 37.0 12.3% 29%
Credit Cards 5.6 5.4 (14.5)% 5.5 9.4% 4%
Unit Trust 26.3 26.9 8.4% 27.3 6.2% 21%
Other Retail Loans (Reported) 1.3 1.7 114.0% 1.8 27.4% 1%
Other Retail Loans (Re-based*) 1.6 1.7 32.8% 1.8 27.4%
Business Banking + SME (Reported) 29.9 29.6 (3.8)% 31.0 17.7% 19%
Business Banking + SME (Re-based*) 29.2 29.6 5.7% 31.0 17.7%
SME (Reported) 6.0 5.7 (22.2)% 6.4 45.4% 21%
SME (Re-based*) 5.3 5.7 34.9% 6.4 45.4%
Business Banking (Reported) 23.9 23.9 0.8% 24.6 11.1% 79%
Business Banking (Re-based*) 24.0 23.9 (0.7)% 24.6 11.1%
Global Banking (Corporate)
- Reported 71.7 68.6 (17.1)% 67.0 (9.5)% 30%
- Re-based* 72.1 68.6 (19.5)% 67.0 (9.5)%
- Re-based** 75.4 74.6 (4.3)% 74.1 (2.9)%
Total Domestic^ 223.6 223.2 (0.7)% 226.4 5.8% 70%
*Re-based loan growth figures are based on adjusted 31 Dec 2013 position in line with migration of client accounts which are implemented on 1 January 2014
**Rebased loan growth figures include CB loans centred in Labuan and unrated bonds which is captured by Global Markets
^Including Islamic loans sold to Cagamas and excludes unwinding of interest and takes into accounts others portion – Jun 14: 0.0 vs Jun 13: (0.0)

57
Group Deposits by quarter
31 Dec 13 31 Mar 14 1Q
Annualised 30 Jun 14
2Q
Annualised % Portfolio
Group Gross Deposits 395.6 395.7 0.0% 406.5 11.0%
Malaysia
(RM billion) 259.1 258.2 (1.5)% 265.1 10.7% 65%
Savings Deposits 37.6 39.1 16.1% 38.7 (3.5)% 15%
Current Accounts 65.8 64.0 (10.9)% 67.1 19.4% 25%
Fixed Deposits 138.3 136.6 (4.9)% 137.4 2.3% 52%
Others 17.4 18.5 23.4% 21.8 72.8% 8%
International 138.6 139.4 2.3% 143.3 11.4% 35%
Singapore
(SGD billion) 34.0 33.5 (6.0)% 35.0 18.1%
Savings Deposits 4.1 4.3 15.6% 4.3 (3.4)% 12%
Current Accounts 4.7 4.3 (27.4)% 4.8 40.7% 14%
Fixed Deposits 24.7 24.2 (8.5)% 25.2 17.3% 72%
Others 0.5 0.6 148.3% 0.7 40.3% 2%
Indonesia
(Rupiah trillion) 107.5 104.3 (12.0)% 106.2 7.4%
Savings Deposits 24.7 24.0 (10.6)% 24.3 4.0% 23%
Current Accounts 17.7 15.4 (51.2)% 16.4 25.4% 15%
Fixed Deposits 65.1 64.8 (1.8)% 65.5 4.4% 62%

58
Mohamed Rafique Merican
Group Chief Financial Officer
Contact: (6)03-2074 7878
Email: [email protected]
MALAYAN BANKING BERHAD
14th Floor, Menara Maybank
100, Jalan Tun Perak
50050 Kuala Lumpur, Malaysia
Tel : (6)03-2070 8833
www.maybank.com
Narita Naziree
Head, Group Performance Reporting & Investor Relations
Contact: (6)03-2074 8017
Email: [email protected]
Disclaimer. This presentation has been prepared by Malayan Banking Berhad (the “Company”) for information purposes only and does not purport to contain all the
information that may be required to evaluate the Company or its financial position. No representation or warranty, express or implied, is given by or on behalf of the
Company as to the accuracy or completeness of the information or opinions contained in this presentation.
The presentation does not constitute or form part of an offer, solicitation or invitation of any offer, to buy or subscribe for any securities, nor should it or any part of
it form the basis of, or be relied in any connection with, any contract, investment decision or commitment whatsoever.
The Company does not accept any liability whatsoever for any loss howsoever arising from any use of this presentation or their contents or otherwise arising in
connection therewith.
Investor Relations Contact
Humanising Financial Services