investor presentation 2016 results - rabobank · pdf fileinvestor presentation 2016 results. 7...
TRANSCRIPT

Investor Presentation 2016 results
7 June 2017
Rabobank
Investor Relations
Disclaimer
This presentation (the “Presentation”) is prepared by Coöperatieve Rabobank U.A. (“Rabobank”) incorporated under the laws of the Netherlands. The liability of its members is excluded. Rabobank is among others regulated by De Nederlandsche Bank N.V. and by the Netherlands Authority for the Financial Markets, as well as the European Central Bank. This Presentation is solely for information purposes and on the basis of the acceptance of this disclaimer. Neither the Presentation nor any of its contents, in whole or in part, directly or indirectly, may be used for any other purpose without the prior written consent of Rabobank. This Presentation is only directed at Eligible Counterparties and Professional Clients, as defined in the Markets in Financial Instruments Directive 2004/39/EC (“MiFID”) (the “Recipient”). It is not directed at Retail Clients (as defined in MiFID).
The content of this Presentation reflects prevailing market conditions and Rabobank’s judgment as on the date of this Presentation, all of which may be subject to change. The information and opinions contained in this Presentation have been compiled or arrived at from sources believed to be reliable, but no representation or warranty, express or implied is made as to their accuracy, completeness or correctness. The information contained in this Presentation is published for the assistance of the Recipient, but is not to be relied upon as authoritative or taken in substitution for the exercise of judgment by any Recipient nor will any information in this Presentation (including, but not limited to, Statistical Information (as defined below) and forward- looking statements) be subject to updating. Rabobank has further relied upon and assumed, without independent verification, the accuracy and completeness of all information made available to it. To the extent permitted by law, Rabobank excludes any liability howsoever arising from the contents of this Presentation or for the consequences of any actions taken in reliance on this Presentation or the content herein. Each Recipient is advised to seek independent professional advice as to the suitability of any products and to their tax, accounting, legal or regulatory implications.
Members of the Rabobank Group trade on their own account and may from time to time hold or act as market makers in securities issued by a client, or may act as advisers, brokers or bankers to a client or any of its affiliates.
This Presentation contains certain tables and other statistical analyses (the "Statistical Information"). Numerous assumptions have been used in preparing the Statistical Information, which may or may not be reflected in this Presentation or be suitable for the circumstances of any particular Recipient. As such, no assurance can be given as to the Statistical Information's accuracy, appropriateness or completeness in any particular context, or as to whether the Statistical Information and/or the assumptions upon which they are based reflect present market conditions or future market performance. The Statistical Information should not be construed as either projections or predictions.
This Presentation may include "forward-looking statements". Such statements contain the words "anticipate", "believe", “could”, “intend", "estimate", "expect", "will", "may", "project", "plan“, the negative of such terms and words of similar meaning. All statements included in this Presentation other than statements of historical facts, are forward-looking statements. Such forward-looking statements involve known and unknown risks, uncertainties and other important factors that could cause actual results, performance or achievements to be materially different from future results, performance or achievements expressed or implied by such forward-looking statements. Such forward-looking statements are based on numerous assumptions regarding present and future business strategies and the relevant future business environment. The information and opinions contained in this Presentation are wholly indicative, for discussion purposes only and are subject to change without notice at any time. No rights may be derived from any potential offers, transactions, commercial ideas et cetera contained in this Presentation. This Presentation does not constitute an offer, commitment or invitation and does not constitute investment advice and is not intended for the use by persons an offer of securities to whom would be subject to the Netherlands Financial Supervision Act. This Presentation shall not form the basis of or be relied upon in connection with any contract or commitment whatsoever.
© Rabobank, Croeselaan 18, 3521 CB Utrecht, The Netherlands, www.rabobank.com/ir, Chamber of Commerce number 30046259.
InvestingRabobank and the other parts of Rabobank Group that are designated as investment institutions are registered as such with the Netherlands Authority for the Financial Markets. The aforementioned investment institutions are licensed by the Netherlands Authority for the Financial Markets under the Financial Supervision Act. If you invest funds you have borrowed, you run the risk of incurring a debt as well as losing the invested funds.
This Presentation does not constitute an offering document. The information herein is an advertisement and does not comprise a prospectus for the purpose of EU Directive 2003/71/EC (as amended from time to time). The information herein has not been reviewed or approved by any rating agency, government entity, regulatory body or listing authority and does not constitute listing particulars in compliance with the regulations or rules of any stock exchange.
Nothing in this Presentation should be construed as legal, tax, accounting, regulatory or investment advice and the Recipient is advised to consult its own independent professional advisers in relation to investment in one of the products mentioned. The information contained herein does not purport to be complete and your decision to invest in one of the products mentioned should solely be based on the applicable prospectus or information memorandum including the risk factors, costs, terms and conditions and underlying values. The applicable prospectus or information memorandum is available with Rabobank or on www.rabobank.com/ir.
The value of your investment can fluctuate. Past performance offers no guarantee for future results.
2
Investor Relations
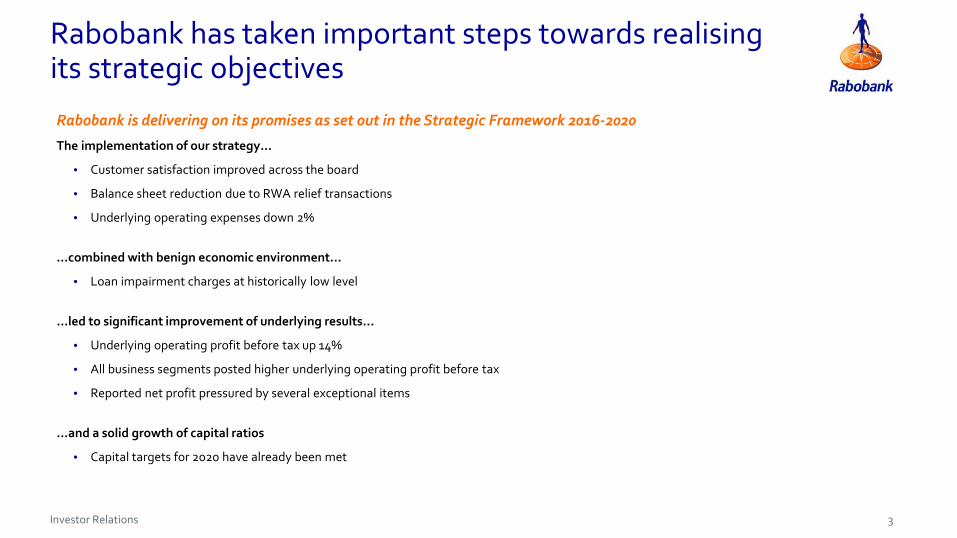
Rabobank has taken important steps towards realising its strategic objectivesRabobank is delivering on its promises as set out in the Strategic Framework 2016-2020
The implementation of our strategy…
• Customer satisfaction improved across the board
• Balance sheet reduction due to RWA relief transactions
• Underlying operating expenses down 2%
…combined with benign economic environment…
• Loan impairment charges at historically low level
…led to significant improvement of underlying results…
• Underlying operating profit before tax up 14%
• All business segments posted higher underlying operating profit before tax
• Reported net profit pressured by several exceptional items
…and a solid growth of capital ratios
• Capital targets for 2020 have already been met
3

Investor Relations
Topics
Update on strategy
Annual results 2016
Appendix:
• Rabobank: Dutch and cooperative
• Financial results
• Loan portfolio
• Capital, Funding & Liquidity
• Current & future developments
4

Investor Relations
Rabobank is a client centered cooperative bank
Strategy
Make a substantial contribution to welfare and prosperity in the Netherlands
Make a substantial contribution to feeding the world sustainably
Vision
Mission
Banking for Food
Banking for the
Netherlands
1. Excellent customer
focus
2. Flexibility and balance sheet
reduction
3.Improving
performance
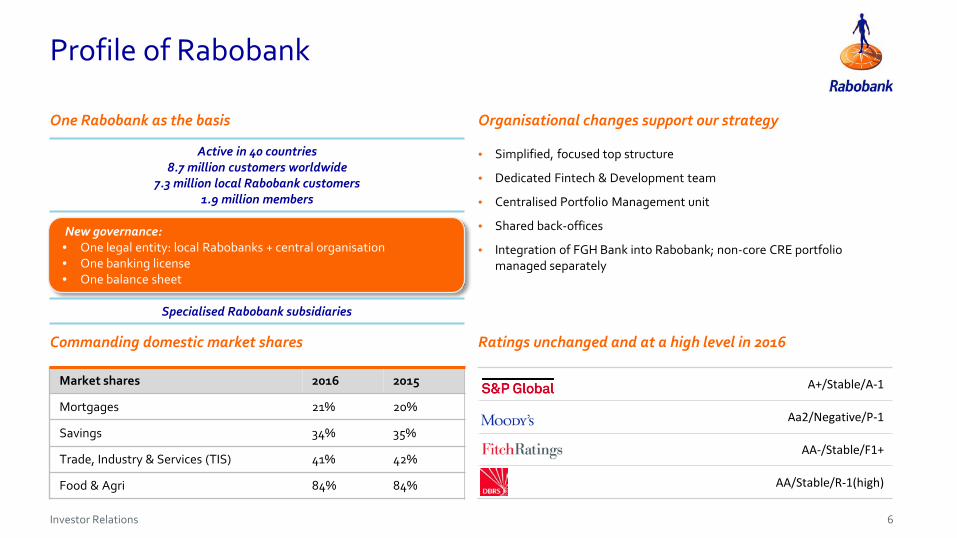
• Rabobank is a cooperative bank with its roots in the Dutch Food & Agri sector
• The Strategic Framework 2016-2020 enables Rabobank to strengthen its cooperative mission
• Rabobank’s mission stems from its cooperative heritage and agricultural roots
• Banking for the Netherlands: make a substantial contribution to welfare and prosperity as a leading cooperative and customer-oriented domestic bank
• Banking for Food: make a substantial contribution to feeding the world sustainably as a leader in Food & Agri in selected countries
5
Investor Relations
Profile of Rabobank
• Simplified, focused top structure
• Dedicated Fintech & Development team
• Centralised Portfolio Management unit
• Shared back-offices
• Integration of FGH Bank into Rabobank; non-core CRE portfolio managed separately
Organisational changes support our strategy
A+/Stable/A-1
Aa2/Negative/P-1
AA-/Stable/F1+
AA/Stable/R-1(high)
Ratings unchanged and at a high level in 2016
One Rabobank as the basis
Market shares 2016 2015
Mortgages 21% 20%
Savings 34% 35%
Trade, Industry & Services (TIS) 41% 42%
Food & Agri 84% 84%
Commanding domestic market shares
New governance:• One legal entity: local Rabobanks + central organisation• One banking license• One balance sheet
Active in 40 countries8.7 million customers worldwide
7.3 million local Rabobank customers1.9 million members
Specialised Rabobank subsidiaries
6
Investor Relations
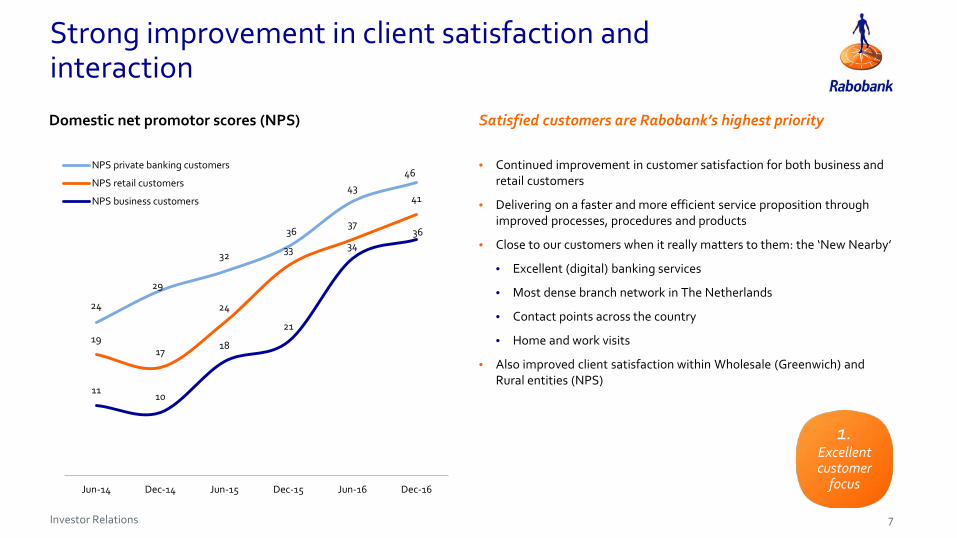
Strong improvement in client satisfaction and interaction
Satisfied customers are Rabobank’s highest priority
• Continued improvement in customer satisfaction for both business and retail customers
• Delivering on a faster and more efficient service proposition through improved processes, procedures and products
• Close to our customers when it really matters to them: the ‘New Nearby’
• Excellent (digital) banking services
• Most dense branch network in The Netherlands
• Contact points across the country
• Home and work visits
• Also improved client satisfaction within Wholesale (Greenwich) and Rural entities (NPS)
Domestic net promotor scores (NPS)
24
29
32
36
4346
1917
24
33
37
41
1110
18
21
3436
Jun-14 Dec-14 Jun-15 Dec-15 Jun-16 Dec-16
NPS private banking customers
NPS retail customers
NPS business customers
1. Excellent customer
focus
7
Investor Relations
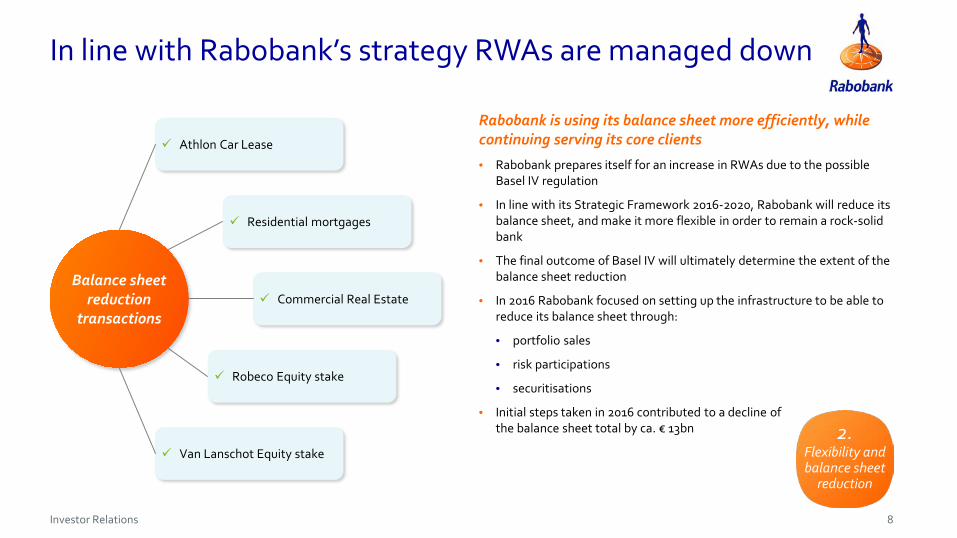
In line with Rabobank’s strategy RWAs are managed down
2. Flexibility and balance sheet
reduction
Rabobank is using its balance sheet more efficiently, while continuing serving its core clients
• Rabobank prepares itself for an increase in RWAs due to the possible Basel IV regulation
• In line with its Strategic Framework 2016-2020, Rabobank will reduce its balance sheet, and make it more flexible in order to remain a rock-solid bank
• The final outcome of Basel IV will ultimately determine the extent of the balance sheet reduction
• In 2016 Rabobank focused on setting up the infrastructure to be able to reduce its balance sheet through:
• portfolio sales
• risk participations
• securitisations
• Initial steps taken in 2016 contributed to a decline of the balance sheet total by ca. € 13bn
Athlon Car Lease
Residential mortgages
Commercial Real Estate
Robeco Equity stake
Balance sheet reduction
transactions
Van Lanschot Equity stake
8

Investor Relations
Rabobank is rationalising its business
Number of staff (in FTEs, incl. external hires)
1,899
5,191
1,255
53,912
52,013
45,567
38.500
2014 Realised 2015 Realised Athlon 2016 Planned 2018forecast
3. Improving
performance
9
2016: a year of accelerated change• Rabobank made good progress in executing its cost reduction programme,
aimed at:
• implementing more efficient processes
• centralising middle and back-office functions
• simplifying structures and delayering
• Targeted reduction of staff: 12,000 FTEs (excluding impact of Athlon sale) for the 2016-2018 period
• Headcount reduction of ~5,200 FTEs, versus target of 4,000 FTEs
• At the same time, initiatives were launched to increase revenues:
• margins in business lending are being attuned to the risk profile
• growth in rural lending
• performing in-depth sector reviews to focus more on attractive risk/return profiles
• increasing focus on fee and commission income

Investor Relations
These targets are set in the context of a more flexible and reduced balance sheet; ultimate reduction target is dependent on the final outcome of Basel IV
Rabobank is on track in realising its financial ambitions
Actuals Dec 2015
ActualsDec 2016
Ambition2020
CapitalCET1 ratio 13.5% 14.0% > 14%
Total capital ratio 23.2% 25.0% > 25%
ProfitabilityROIC 6.0% 5.2% > 8%
C/I incl. reg. levies 65.2% 70.9% 53%-54%
Funding & Liquidity
Wholesale funding € 203bn € 189bn < € 150bn
• Rabobank has already met its 2020 capital targets
• ROIC and C/I ratio were negatively impacted by a number of exceptional items:
• underlying ROIC (8.3%) at target
• underlying C/I ratio (excl. regulatory levies) stable at 60.8%
• Reduction of wholesale funding needs due to balance sheet reduction and an increase in amounts due to customers
• Balance sheet reduced by € 8bn* as a result of, amongst others, several portfolio management transactions and an increased focus on core activities
Financial targets and realisation Achievements in 2016
* Corrected for cash pool netting. See note on slide 37.
10

Investor Relations
Topics
Update on strategy
Annual results 2016
Appendix:
• Rabobank: Dutch, cooperative and profitable
• Financial results
• Loan portfolio
• Capital, Funding & Liquidity
• Current & future developments
11

Investor Relations
Solid net profit, especially considering several exceptional items
Profit & Loss account Main developments
• Net interest income reflects decrease in lending, lower rate environment and higher liquidity buffer costs
• Net fee and commission income increased
• Operating expenses inflated by two exceptional items
• Significantly lower loan impairment charges due to continued economic recovery
• Strong performance in H2 2016 compared to prior years
Net profit (in € mn)
in € mn 2015 2016
Net interest income 9,139 8,743
Net fee and commission income 1,892 1,918
Other income 1,983 2,144
Total income 13,014 12,805
Operating expenses -8,145 -8,594
Regulatory levies -344 -483
Impairment losses on goodwill and investments in associates
-623 -700
Loan impairment charges -1,033 -310
Operating profit before tax 2,869 2,718
Tax -655 -694
Net profit 2,214 2,024
1.110 1.0801.522
924
897 762
692
1.100
2.0071.842
2.2142.024
2013 2014 2015 2016
H2
H1
12

Investor Relations
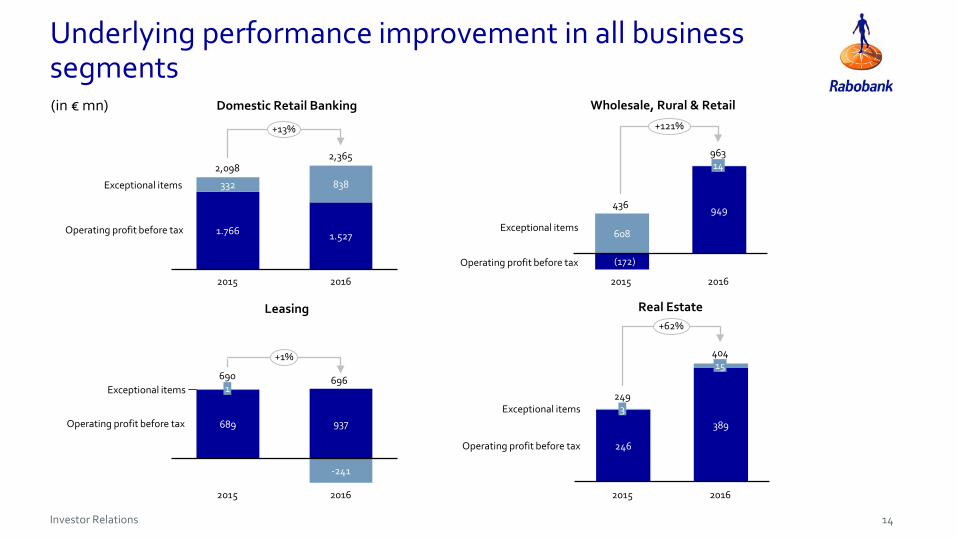
Significant improvement of underlying performance
Main developments
• Underlying operating profit before tax: +14%
• All business segments posted higher underlying operating profit before tax
Exceptional items included in operating profit before tax Underlying profit before tax (in € mn)
* Results on the fair value of issued debt instruments (structured notes) and hedge accounting
In € mn 2015 2016
Book profit on the sale of Athlon - 251
Fair Value items* 276 106
Derivatives Framework -150 -514
Restructuring costs -245 -515
Goodwill impairment RNA (2015) andimpairment stake in Achmea (2016)
-604 -700
Total effect -723 -1,372
2,869 2,718
7231,372
3,592
4,090
2015 2016
Exceptional items
Operating profitbefore tax
+14%
13
Investor Relations
Underlying performance improvement in all business segments
1.766 1.527
332 838
+13%
Operating profit before tax
Exceptional items
2016
2,365
2015
2,098
Domestic Retail Banking
(172)
949
608
+121%
Operating profit before tax
Exceptional items
2016
96314
2015
436
Wholesale, Rural & Retail
689
-241
937
+1%
Operating profit before tax
Exceptional items
2016
696
2015
6901
Leasing
246
389
2015
+62%
Operating profit before tax
404
Exceptional items
2016
249
15
3
Real Estate
(in € mn)
14
Investor Relations
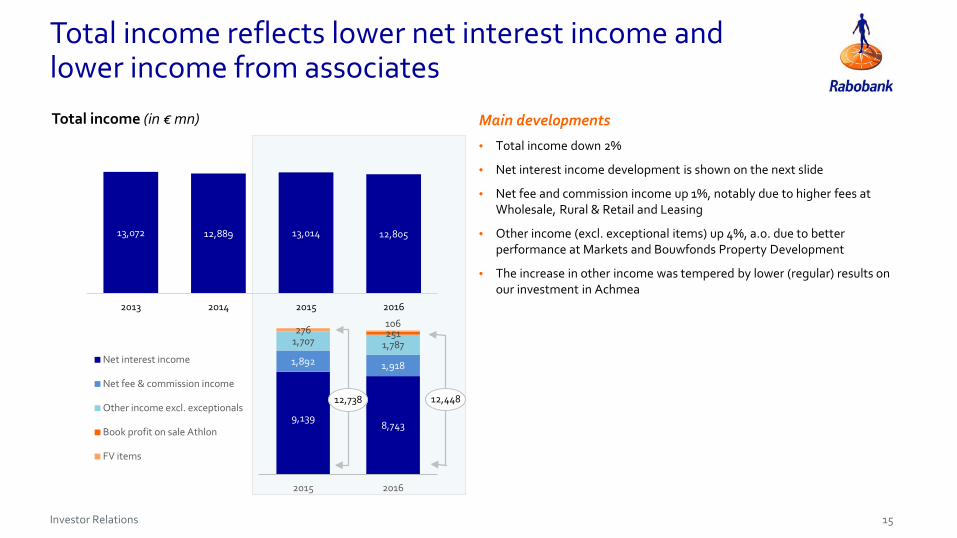
Total income reflects lower net interest income andlower income from associates
Main developments
• Total income down 2%
• Net interest income development is shown on the next slide
• Net fee and commission income up 1%, notably due to higher fees at Wholesale, Rural & Retail and Leasing
• Other income (excl. exceptional items) up 4%, a.o. due to better performance at Markets and Bouwfonds Property Development
• The increase in other income was tempered by lower (regular) results on our investment in Achmea
Total income (in € mn)
9,1398,743
1,892 1,918
1,707 1,787251276106
2015 2016
Net interest income
Net fee & commission income
Other income excl. exceptionals
Book profit on sale Athlon
FV items
12,44812,738
13,072 12,889 13,014 12,805
2013 2014 2015 2016
15
Investor Relations
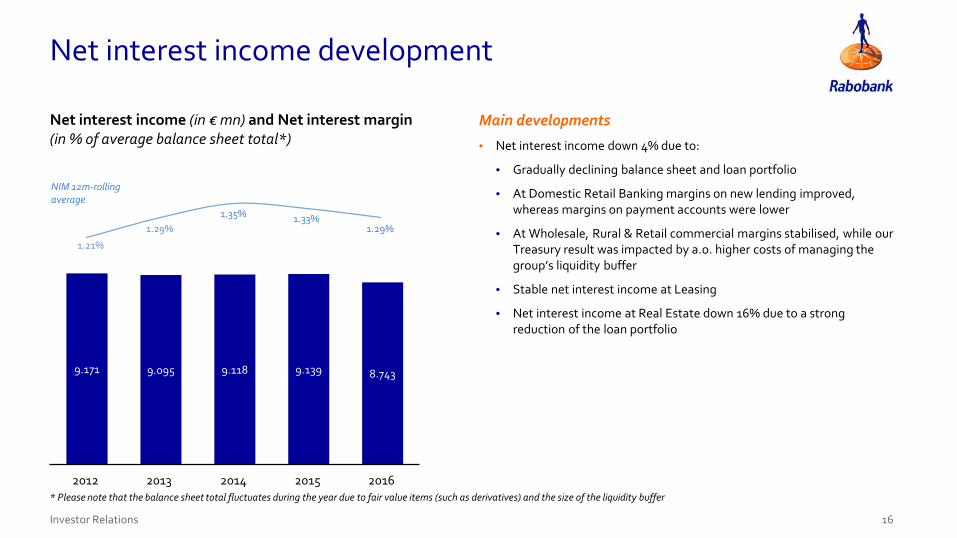
Net interest income development
Main developments
• Net interest income down 4% due to:
• Gradually declining balance sheet and loan portfolio
• At Domestic Retail Banking margins on new lending improved, whereas margins on payment accounts were lower
• At Wholesale, Rural & Retail commercial margins stabilised, while our Treasury result was impacted by a.o. higher costs of managing the group’s liquidity buffer
• Stable net interest income at Leasing
• Net interest income at Real Estate down 16% due to a strong reduction of the loan portfolio
Net interest income (in € mn) and Net interest margin(in % of average balance sheet total*)
NIM 12m-rolling average
16
9.171 9.095 9.118 9.139 8.743
20162014 201520132012
1.21%
1.29%1.33%1.35%
1.29%
* Please note that the balance sheet total fluctuates during the year due to fair value items (such as derivatives) and the size of the liquidity buffer

Investor Relations
Staff reduction main driver of decrease in underlyingoperating expenses
Underlying operating expenses develop favourable
• Underlying operating expenses down 2%
• Staff costs are on a downward trend due to restructuring efforts; in 2016 headcount was reduced by ~5,200 FTEs (excluding the impact of the sale of Athlon)
• The revaluation of property in own use contributed to an increase in other administrative expenses compared to 2015
Cost/income ratio development
2015 2016
C/I ratio incl. regulatory levies 65.2% 70.9%
C/I ratio excl. regulatory levies 62.6% 67.1%
Underlying C/I ratio excl. regulatory levies 60.8% 60.8%
9,7608,055 8,145 8,594
2013 2014 2015 2016
Operating expenses (in € mn)
4,7864,521
2,964 3,044
245 515150 514
2015 2016
Staff costs
Other Opex
Restructuring
Derivatives Framework
17
7,750 7,565

Investor Relations
Loan impairment charges at historically low level, non performing loans on a downward trend
All segments benefit from economic recovery• Historically low LIC of € 310mn (7 bps), considerably lower than 2015
(€ 1,033mn, 24 bps)• Limited or even negative LIC in all business segments• Domestic residential mortgage portfolio continues to perform well with
LIC at 2.7 bps (excluding non-recurring adjustments)• Releases on allowances for loan losses taken in prior years• Long term (10-year) average LIC stood at 36 bps of average lending
Non performing loans• Private sector lending decreased by € 1bn* to € 424.6bn • NPL volume: 5% down vs 2015 to € 18.5bn (4.4% of private sector loan
portfolio)• NPLs declined in all business segments (except WRR) on the back of the
continued economic recovery• Coverage ratio: 41%
2.643 2.633
1.033310
2013 2014 2015 2016
343
25
526
255
85
101
90
-75
2015 2016
Real estate
Leasing
WRR
Domestic Retail
Loan impairment charges (LIC)(in € mn and in bps of average lending)
59 bps 60 bps
24 bps 7 bps
18* Corrected for cash pool netting. See note on slide 37.

Investor Relations
-4.8
-6.1 +3.0+1.7 -4.0
Stable loan portfolio with focus on the Netherlands
• Loan portfolio decreased by € 1bn:
• Domestic Retail: residential mortgages portfolio decreased
• WRR: notably international lending increased
• Leasing: financial leases 7% up
• Real Estate: CRE lending further managed down in line with strategy
• 72% of private sector loan portfolio outstanding in the Netherlands
• 47% loan exposure to private individuals, 29% to trade, industry & services and 24% to food & agri
Loan portfolio compositionDevelopment of the loan portfolio (in € bn)
Group private sector loan portfolio € 424.6bn
2014
425.6
+4.4
WRRDomestic Retail
2015*
424.6
2016Leasing Real Estate FX / Other
430.4
19
* Corrected for cash pool netting. See note on slide 37.
Domestic commercial real estate **
6%
Domestic retail mortgages
46%
Domestic retail F&A7%
Other domestic retail SMEs
9%
Wholesale and Intl Rural &
Retail25%
Leasing7%
** Includes both the Domestic retail and the Real estate segments’ exposure to CRE

Investor Relations
Balance sheet remains well capitalised, matched fundedand highly liquid
• Balance sheet was reduced by € 8bn
• Rabobank is a frequent and flexible issuer of debt securities and has seen solid inflow of funds in the past years, reflecting its good creditworthiness
• Total liquidity buffer (HQLA) increased to € 103bn from € 98bn
• Rabobank amply meets current (and future) liquidity requirements:
• LCR: 130% (128%)
• NSFR: 119% (116%)
• Amounts due to customers increased by € 10bn
• Loan-to-deposit ratio improved to 1.22 from 1.26
• Due to the narrowing of the funding gap and lower balance sheet, wholesale funding needs declined
Balance sheet composition
435 430 426 425
326 326 338 348
2013 2014 2015 * 2016
Private sector lending Due to customers
Private sector lending and amounts due to customers (in € bn)
20
2232
6
68 52
Assets Liabilities & Equity
Balance Sheet (100% = € 662bn)
LT assets
ST and other assets
LT liabilities
ST and other liabilities
EquityLT wholesale funding
* Corrected for cash pool netting. See note on slide 37.
20
1.26 1.221.321.35 LtD ratio
Investor Relations
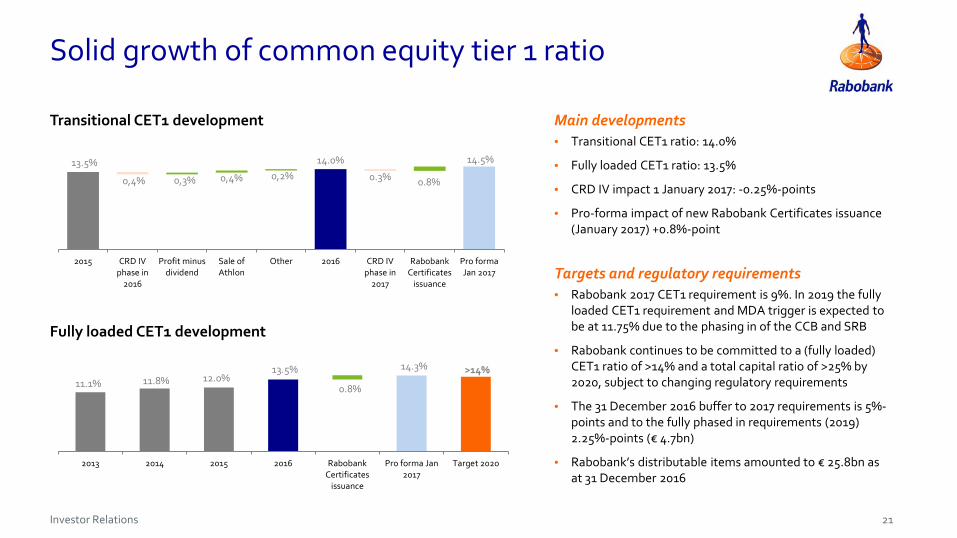
Solid growth of common equity tier 1 ratio
13.5%
0,3% 0,4% 0,2%14.0%
0,4% 0.3%
2015 CRD IVphase in
2016
Profit minusdividend
Sale ofAthlon
Other 2016 CRD IVphase in
2017
RabobankCertificates
issuance
Pro formaJan 2017
• Transitional CET1 ratio: 14.0%
• Fully loaded CET1 ratio: 13.5%
• CRD IV impact 1 January 2017: -0.25%-points
• Pro-forma impact of new Rabobank Certificates issuance (January 2017) +0.8%-point
Main developments
• Rabobank 2017 CET1 requirement is 9%. In 2019 the fully loaded CET1 requirement and MDA trigger is expected to be at 11.75% due to the phasing in of the CCB and SRB
• Rabobank continues to be committed to a (fully loaded) CET1 ratio of >14% and a total capital ratio of >25% by 2020, subject to changing regulatory requirements
• The 31 December 2016 buffer to 2017 requirements is 5%-points and to the fully phased in requirements (2019) 2.25%-points (€ 4.7bn)
• Rabobank’s distributable items amounted to € 25.8bn as at 31 December 2016
Targets and regulatory requirements
Transitional CET1 development
Fully loaded CET1 development
0.8%
14.5%
>14%
0.8%
2013 2014 2015 2016 RabobankCertificates
issuance
Pro forma Jan2017
Target 2020
11.1% 11.8% 12.0%13.5% 14.3%
21

Investor Relations
Rabobank already meets the > 25% total capital target
19.8%21.3%
CET1
AT1
Tier 2
13,5% 13,6% 13,5% 14,0%
>25%
3,1% 2,4% 2,9%3,6%
2.0%
3,2%5,3%
6,8%7,4%
0,0%2013 2014 2015 2016 Target 2020
23.2%
25.0%
>14%
Capital structure(in % of RWA)
Highlights
22
• Since 2012, high capital ratios are targeted to protect senior bond holders against the (unlikely) event of a bail-in
• Rabobank adjusted its target Additional Tier 1 layer to roughly 2% (from 3.5%) with the issuance of Rabobank Certificates. This will further optimise the capital stack
• More guidance on MREL is expected in 2017. Once the EC creditor hierarchy proposal is adopted and implemented in the Netherlands, Rabobank could opt to issue non-preferred senior debt to meet MREL requirements
• Transitional ratios as at 31 December 2016:
• Tier 1 ratio 17.6%
• Total capital ratio 25.0%
• Leverage ratio 5.5%
Investor Relations
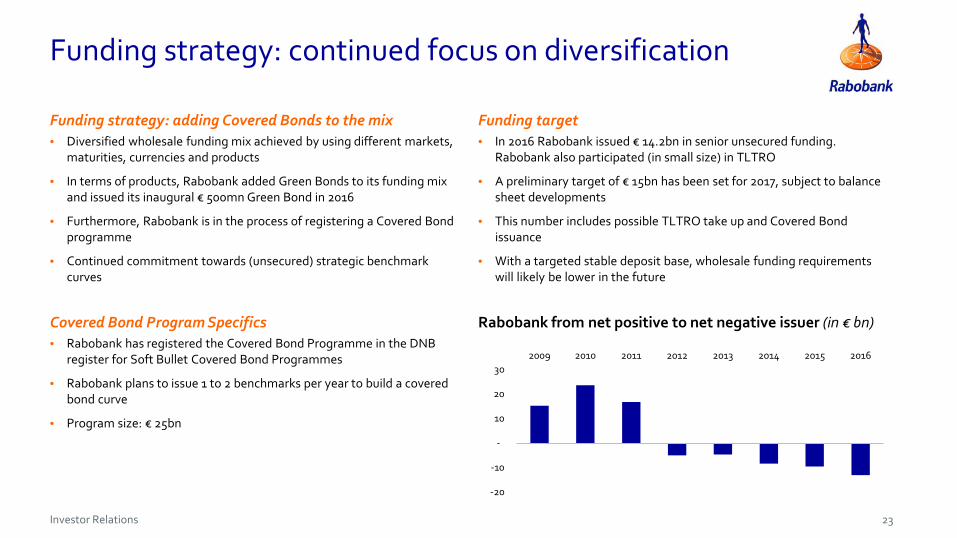
Funding strategy: continued focus on diversification
• In 2016 Rabobank issued € 14.2bn in senior unsecured funding.Rabobank also participated (in small size) in TLTRO
• A preliminary target of € 15bn has been set for 2017, subject to balance sheet developments
• This number includes possible TLTRO take up and Covered Bond issuance
• With a targeted stable deposit base, wholesale funding requirements will likely be lower in the future
Funding target
-20
-10
-
10
20
302009 2010 2011 2012 2013 2014 2015 2016
Rabobank from net positive to net negative issuer (in € bn)
• Diversified wholesale funding mix achieved by using different markets, maturities, currencies and products
• In terms of products, Rabobank added Green Bonds to its funding mix and issued its inaugural € 500mn Green Bond in 2016
• Furthermore, Rabobank is in the process of registering a Covered Bond programme
• Continued commitment towards (unsecured) strategic benchmark curves
Funding strategy: adding Covered Bonds to the mix
• Rabobank has registered the Covered Bond Programme in the DNB register for Soft Bullet Covered Bond Programmes
• Rabobank plans to issue 1 to 2 benchmarks per year to build a covered bond curve
• Program size: € 25bn
Covered Bond Program Specifics
23

Investor Relations
Topics
Update on strategy
Annual results 2016
Appendix:
• Rabobank: Dutch and cooperative
• Financial results
• Loan portfolio
• Capital, Funding & Liquidity
• Current & future developments
24

Investor Relations
Dutch economy shows continued strong recovery
Key figures Dutch economy (June 2017) Key figures Dutch economy
• Population 17mn
• GDP € 697bn
• GDP per capita 3rd in the EU, 13th in the world
• Household savings deposits € 403bn
• Pension funds assets € 1,409bn
• Household gross mortgage debt € 665bn
• Value of housing stock € 1,204bn
Economic Outlook
• The Netherlands is currently experiencing a strong economic recovery, driven mainly by strong growth in the domestic economy
• Private consumption rises because of higher disposable income of households and increased consumer confidence
• Further recovery of housing market
• Steady decline unemployment rate
• Inflation will increase in 2017
• International uncertainties remain pronounced risk for growth
Year-on-year change (%) Actual 2016 Forecast 2017 Forecast 2018
Gross Domestic Product 2.2 2.2 1.9
Private consumption 1.7 1.9 1.7
Government spending 0.5 0.8 0.8
Private investment 6.0 5.5 2.2
Exports 3.4 3.4 3.4
Imports 3.7 3.3 3.2
Inflation 0.1 1.4 1.5
Unemployment 6.0 5.0 4.5
Government budget (% GDP) 0.4 0.3 0.6
Government debt (% GDP) 62.3 59.3 57.2
25

Investor Relations
NL Rest of Europe Rest of world
Ratings remained unchanged and at a high level in 2016
AA/Aa2
BB/Ba2
A-/A3
* Source: Rabobank analysisGraph based on the average rating score with Fitch, Moody’s and S&P (January 2017) of the world’s 60 largest banks (source: the Banker, July 2016), plus major Dutch banks.
Dec 2015 June 2016 Dec 2016
A+/Stable/A-1 A+/Stable/A-1 A+/Stable/A-1
Aa2/Stable/P-1 Aa2/Stable/P-1 Aa2/Negative/P-1
AA-/Stable/F1+ AA-/Stable/F1+ AA-/Stable/F1+
AA/Stable/R-1(high) AA/Stable/R-1(high) AA/Stable/R-1(high)
26
Investor Relations
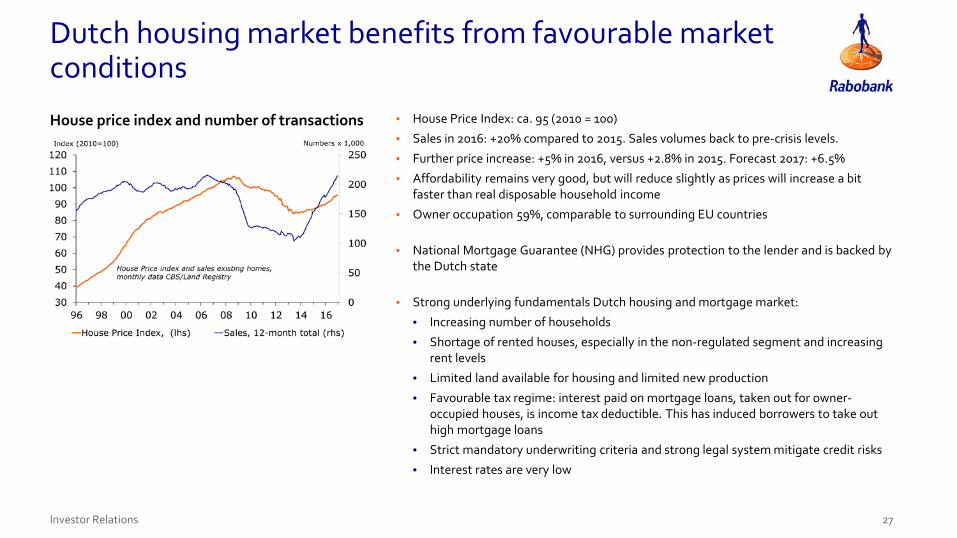
Dutch housing market benefits from favourable market conditions
House price index and number of transactions • House Price Index: ca. 95 (2010 = 100)
• Sales in 2016: +20% compared to 2015. Sales volumes back to pre-crisis levels.
• Further price increase: +5% in 2016, versus +2.8% in 2015. Forecast 2017: +6.5%
• Affordability remains very good, but will reduce slightly as prices will increase a bit faster than real disposable household income
• Owner occupation 59%, comparable to surrounding EU countries
• National Mortgage Guarantee (NHG) provides protection to the lender and is backed by the Dutch state
• Strong underlying fundamentals Dutch housing and mortgage market:
• Increasing number of households
• Shortage of rented houses, especially in the non-regulated segment and increasing rent levels
• Limited land available for housing and limited new production
• Favourable tax regime: interest paid on mortgage loans, taken out for owner-occupied houses, is income tax deductible. This has induced borrowers to take out high mortgage loans
• Strict mandatory underwriting criteria and strong legal system mitigate credit risks
• Interest rates are very low
27
Investor Relations
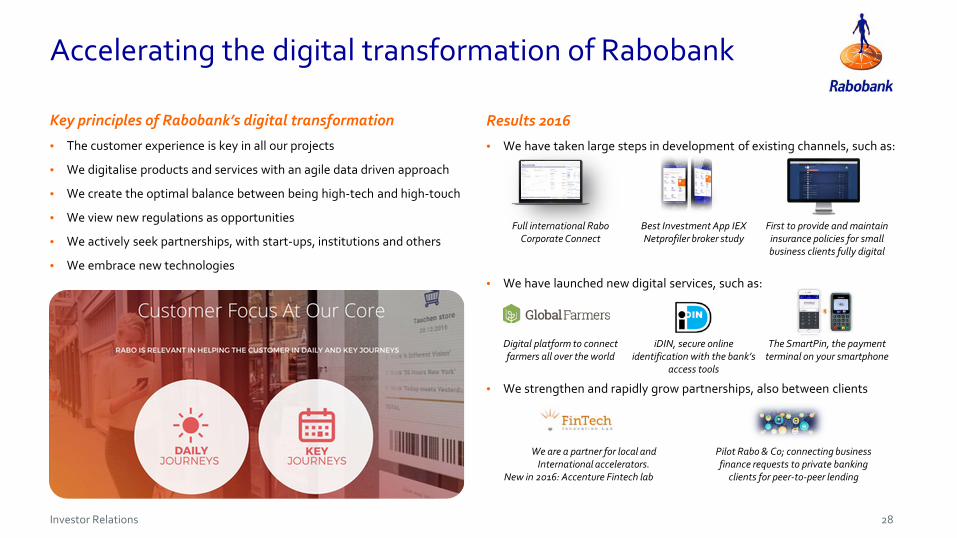
Accelerating the digital transformation of Rabobank
Key principles of Rabobank’s digital transformation
• The customer experience is key in all our projects
• We digitalise products and services with an agile data driven approach
• We create the optimal balance between being high-tech and high-touch
• We view new regulations as opportunities
• We actively seek partnerships, with start-ups, institutions and others
• We embrace new technologies
Full international RaboCorporate Connect
Best Investment App IEX Netprofiler broker study
First to provide and maintain insurance policies for smallbusiness clients fully digital
Digital platform to connectfarmers all over the world
iDIN, secure online identification with the bank’s
access tools
The SmartPin, the paymentterminal on your smartphone
We are a partner for local andInternational accelerators.
New in 2016: Accenture Fintech lab
Pilot Rabo & Co; connecting businessfinance requests to private banking
clients for peer-to-peer lending
Results 2016
• We have taken large steps in development of existing channels, such as:
• We have launched new digital services, such as:
• We strengthen and rapidly grow partnerships, also between clients
28

Investor Relations
Sustainability is incorporated in Rabobank’s DNA
Spearheads of our 2020 Sustainability Strategy
• Supporting retail and business clients to achieve greater sustainability
• Accelerating sustainable development of agriculture and food supply worldwide
• Strengthening vital communities
• Aiming to improve our sustainability ratings and achieve a top position
• Loans outstanding to ‘sustainable leaders’: € 18.8bn (Dec. 2016) In 2016 23 wind & solar projects were financed (amount: € 1.2bn)
Green & Sustainability Bond
• Development of Green & Sustainability Bond Framework
• First successful issuance of € 500mn Green Bond to institutional investors (Oct. 2016)
Sustainability ratings Rankings
91 points (7th ranking)
85 points (2th ranking out of 396), rising 5 positions from 2015
Fair Finance Guide
The majority of the subjects has a “sufficient” – “good” score
29
Investor Relations
Topics
Update on strategy
Annual results 2016
Appendix:
• Rabobank: Dutch, cooperative and profitable
• Financial results
• Loan portfolio
• Capital, Funding & Liquidity
• Current & future developments
30
Investor Relations
Rabobank posted solid net profit in 2016
In € mn 2015 2016 Change 2015 – 2016
Total income 13,014 12,805 -2%Net interest income 9,139 8,743 -4%Net fee and commission income 1,892 1,918 +1%Other income 1,983 2,144 +8%Total operating expenses 8,145 8,594 +6%Gross result 4,869 4,211 -14%Loan impairment charges 1,033 310 -70%
Contribution to resolution fund and DGS 172 313 +82%
Bank tax and levy 172 170 -1%Impairment losses on goodwill and investments in associates 623 700 +12%Operating profit before taxation 2,869 2,718 -5%Income tax 655 694 6%Net profit 2,214 2,024 -9%Return on Tier-1 capital 6.5% 5.8% -0.7%-pntROIC 6.0% 5.2% -0.8%-pntEfficiency ratio excluding regulatory levies 62.6% 67.1% +4.5%-pntEfficiency ratio including regulatory levies 65.2% 70.9% +5.7%-pntLoan impairment charges 24 bps 7 bps -17 bps
31
Investor Relations
Domestic Retail benefited from further economic recoveryOperating profit before tax(in € mn)
Loan portfolio vs. Due to customers(in € bn)
LtD ratio 1.33 1.24
Main developments
• Strong underlying profit on the back of further recovery of both the Dutch economy and the housing market
• Adjusted for exceptional items underlying profit before tax increased to € 2.4bn
• Staff costs decreased by 16%
• Very low loan impairment charges (1bp of average lending)
• Loan portfolio declined due to the sale of mortgage loans and continuing mortgage prepayments
• Credit quality of residential mortgage portfolio improved further
• Due to customers increased by € 11bn
282 276
212223
2015 * 2016
LoansDue to customers
+13%
1.7661.527
332 838
2.098
2.365
2015 2016
Exceptionalitems
Operatingprofit beforetax
32
* Corrected for cash pool netting. See note on slide 37.

Investor Relations
-172
949
608
14
436
963
2015 2016
Exceptionalitems
Profit beforetax
99105
124 124
2015 * 2016
LoansDue to customers
WRR results recovered due to continued higher gross results and lower impairments
Main developments
• Profit before tax showed strong recovery after € 604mn goodwill impairment in 2015
• Underlying profit before tax also improved strongly, driven by increased income, lower operating expenses and 52% lower loan impairment charges
• WRR income increased, also driven by increased fee & commission income
• Lower interest results from Treasury impacted net interest income, partly compensated by increased other income
• Loan portfolio grew by 6%
• Due to customers remained stable
Operating profit before tax(in € mn)
Loan portfolio vs. Due to customers(in € bn)
LtD ratio 0.80 0.84+121%
33* Corrected for cash pool netting. See note on slide 37.

Investor Relations
Leasing showed continued strong results and growth in activities
Main developments
• Sale of Athlon
• Net interest income stable, growth of fee & commission income
• Other income positively influenced by sale of Athlon
• Low loan impairment charges (30 bps), well below the long-term average
• Excluding sale of Athlon total lease portfolio grew by 8%
• Increase F&A share in lease portfolio to 34%689 937
1
-241
690 696
2015 2016
Exceptionalitems
Profit beforetax
+1%35.7
34.9
2015 2016
Operating profit before tax(in € mn)
Lease portfolio(in € bn)
sale Athlon
34
3.5

Investor Relations
Real Estate actively managed down non-core portfolio
Main developments
• Real Estate segment benefited from favourable developments in the real estate market, especially in the Netherlands
• Underlying profit before tax up 62%, Net profit 60% increase to € 288mn
• Lower net interest income on the back of declining loan portfolio, more than offset by lower Loan impairment charges (€ -75mn)
• Real estate developer BPD sold 9,905 houses (+18%)
• Loan portfolio declined 26% to € 11.3bn
• Start of transfer of FGH Bank clients who fit the real estate strategy of Rabobank to RaboReal Estate Finance
246
389
3
15
249
404
2015 2016
Exceptionalitems
Profit beforetax
15,3
11,3
2015 2016
Operating profit before tax(in € mn)
Loan portfolio(in € bn)
+62%
35
Investor Relations
Topics
Update on strategy
Annual results 2016
Appendix:
• Rabobank: Dutch, cooperative and profitable
• Financial results
• Loan portfolio
• Capital, Funding & Liquidity
• Current & future developments
36

Investor Relations
Balance sheet total slightly down
In € mn Dec 2015 (as reported)* Dec 2015 (adjusted)* Dec 2016
Assets Loans (incl. public sector) 465,993 457,702 452,807
Cash 64,943 84,405
Banks 32,434 25,444
Securities 43,441 38,486
Derivatives 48,113 42,372
Other 23,630 18,821
Total Assets 678,554 670,263 662,335
Equity & liabilities Equity 41,197 40,524
Due to customers 345,884 337,593 347,712
Long-term issued debt 150,009 145,092
Short-term issued debt 53,124 45,795
Banks 19,038 22,006
Derivatives 54,556 48,024
Other 14,746 13,182
Total equity & liabilities 678,554 670,263 662,335
Encumbered assets According to EBA guidelines 9% 9%
* The netting procedures with respect to cash pooling were adjusted in 2016, resulting in the netting of cash pools as from 2016. The 2015 figures in the ‘as reported’ column in table above are shown on a gross basis. The Dec. 2015 ‘adjusted’ column shows the adjusted figures on a net basis. Other Dec. 2015 figures in this presentation are on a net basis for a like-for-like comparison.
37

Investor Relations
Diversified loan portfolio with focus on the Netherlands
Group private sector loan portfolio by business segments Group private sector loan portfolio € 424.6bn
** Includes both the Domestic retail and the Real estate segments’ exposure to CRE
In € bn Dec 2015* Dec 2016 change
Group total 425.6 424.6 -0%
• Domestic retail 281.9 275.8 -2%
• Wholesale, Rural & Retail 98.8 105.2 +6%
- Domestic Wholesale 14.2 14.3 +1%
- International Wholesale 47.0 51.3 +9%
- International Rural & Retail 37.6 39.6 +5%
• Leasing 29.7 31.8 +7%
- Domestic 4.6 5.6 +22%
- International 25.1 26.2 +4%
• Real estate 15.3 11.3 -26%
Domestic commercial real estate **
6%
Domestic retail mortgages
46%
Domestic retail F&A7%
Other domestic retail SMEs
9%
Wholesale and Intl Rural & Retail
25%
Leasing7%
* Corrected for cash pool netting. See note on slide 37.
38

Investor Relations
Rabobank largest financier of the Dutch economy
Domestic private sector portfolio € 307.4bn(72% of Group loan portfolio)In € bn Dec 2015* Dec 2016 change
Total Domestic lending 316.3 307.4 -3%
• Mortgages 201.5 195.9 -3%
• Food & agri retail 28.2 27.8 -1%
• Commercial real estate** 28.0 23.8 -15%
• Other SMEs 39.8 40.1 +1%
• Wholesale 14.2 14.3 +1%
• Leasing 4.6 5.6 +22%
Domestic lending by client category
* Corrected for cash pool netting. See note on slide 37** Includes both the Domestic retail and the Real estate segments’ exposure to CRE
39
Mortgages64%
Food & agri retail9%
CRE **8%
Other SMEs13%
Wholesale4%
Leasing2%
Investor Relations
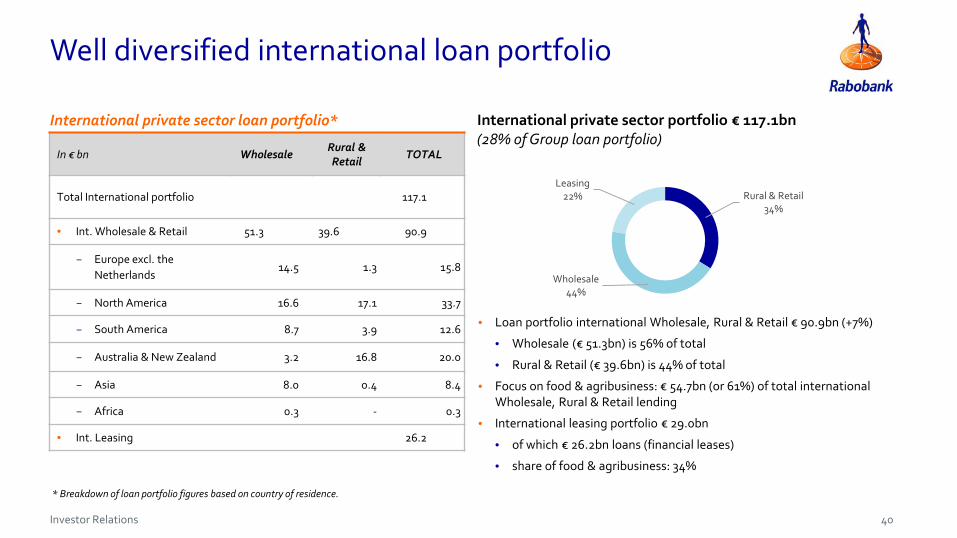
Well diversified international loan portfolio
International private sector loan portfolio*
• Loan portfolio international Wholesale, Rural & Retail € 90.9bn (+7%)
• Wholesale (€ 51.3bn) is 56% of total
• Rural & Retail (€ 39.6bn) is 44% of total
• Focus on food & agribusiness: € 54.7bn (or 61%) of total international Wholesale, Rural & Retail lending
• International leasing portfolio € 29.0bn
• of which € 26.2bn loans (financial leases)
• share of food & agribusiness: 34%
* Breakdown of loan portfolio figures based on country of residence.
In € bn WholesaleRural & Retail
TOTAL
Total International portfolio 117.1
• Int. Wholesale & Retail 51.3 39.6 90.9
− Europe excl. the Netherlands
14.5 1.3 15.8
− North America 16.6 17.1 33.7
− South America 8.7 3.9 12.6
− Australia & New Zealand 3.2 16.8 20.0
− Asia 8.0 0.4 8.4
− Africa 0.3 - 0.3
• Int. Leasing 26.2
International private sector portfolio € 117.1bn (28% of Group loan portfolio)
40
Rural & Retail34%
Wholesale44%
Leasing22%

Investor Relations
Loan quality further improved
In € mn Dec 2015% of
loansDec 2016
% of loans
Non-performing loans Domestic retail 9,166 3.2% 8,185 3.0%
Wholesale & int. retail 5,644 5.7% 6,421 6.2%
Leasing 681 2.3% 575 1.8%
Real estate 4,013 26.3% 3,350 29.6%
Total Rabobank Group 19,504 4.6% 18,530 4.4%
% of NPL % of NPL
Allowances Domestic retail* 3,996 44% 3,261 40%
Wholesale & int. retail 2,962 52% 3,089 48%
Leasing 344 51% 318 55%
Real estate 1,175 29% 874 26%
Total Rabobank Group 8,478 43% 7,542 41%
2015 2016
LIC** Domestic retail* 332 12 bps 29 1 bps
Wholesale & int. retail 526 53 bps 255 26 bps
Leasing 85 25 bps 101 30 bps
Real estate 90 56 bps -75 -54 bps
Total Rabobank Group 1,033 24 bps 310 7 bps
Loans, NPLs and allowances
* Including Other segments** Loan impairment charges
47%
18%25%
3%8%
100%
1%9% 6%
30%
2% 4%
16%
45% 48%
26%
55%
41%
Domesticprivate
individuals
DomesticSMEs
Wholesale &Int. Retail
Real estate Leasing Total
Lending in % of total private sector loan portfolio
Non-performing loans in % of loans
Allowances in % of NPL
41
Investor Relations
Consistently strong performing domestic residential mortgage portfolio (I)
In € mn Dec 2015 Dec 2016 change
Loans 201,498 195,909 -3%
Non-performing loans 1,837 1,526 -17%
− in % of loans 0.91% 0.78% -0.13%-pnt
Allowance 319 227 -29%
− in % of non-performing loans 17% 15% -2%-pnt
2015 2016 Change 2015 – 2016
Loan impairment charges 286 9 -97%
Loan impairment charges (excl. non-recurring effects*) 152 53 -65%
In basis points 14.1 bps 0.5 bps -13.6 bps
In basis points (excl. non-recurring effects*) 7.5 bps 2.7 bps -4.8 bps
* In 2015 Rabobank developed a new capital model for residential mortgage loans. In addition, Rabobank decided to cease allocating loan impairment charges on residential mortgage loansgranted to entrepreneurs, acting in a private capacity, to business lending. These changes resulted in € 134mn additional loan impairment charges in 2015.In 2016 loan impairment charges were lowered by € 44mn due to a reversal of a too conservative approach regarding defaulted clients in previous years.
42

Investor Relations
100% 0.40% 0.29% 0.01%Number of
mortgage clients1.1 million
>90 days past due in recovery procedure auction sales
Consistently strong performing domestic residential mortgage portfolio (II)
• Low loan impairment charges: 2.7 bps (excluding non-recurring adjustments)
• Average loan-to-value ratio: 69% (Dec. 2015: 73%)
• National Mortgage Guarantee (NHG): 20.6% of mortgage portfolio
• 95% of portfolio has (predominantly long-term) fixed interest rates
• Number of delinquencies and foreclosures remains very low
• Banks are in a preferential position to enforce the liquidation of collateral
• Bank has full recourse to the borrower
Delinquencies, recovery procedure and auction sales 2016 in % of total number of domestic mortgages
Contractual fixed interest rate period Rabobank mortgages
43
>10 years29%
6-10 years48%
4-5 years11%
2-3 years3%
fixed <1yr4%
variable5%

Investor Relations
Average loan-to-value mortgage portfolio still on a downward trend
LTV domestic residential mortgage portfolio • Mortgages with an LTV of >100% declined to 10.7% from 18.6%
• Prudent underwriting standards, including a Loan-expenses-to-income ratio, and active risk monitoring are the most important factors determining the risks in Rabobank’s mortgage portfolio
• LTV figures do not take into account
• free savings accounts of the borrower
• securities and other assets of the borrower
• To cover premature death risk, the majority of clients have taken out a life insurance, pledged to the bank
• Some clients have taken out an insurance to cover unemployment risk
• An LTV>100% does not mean that the loan in question is non-performing. As long as the borrower is able to meet debt service, the collateral value is less of an issue
Average Loan-to-value in Dec. 2016: 69% (Dec 2015: 73%)
* LTV (breakdown) based on EAD.
Loan-to-value* NHG Guaranteed Other Total
0%-50% 2.1% 24.4% 26.5%
50%-60% 1.3% 10.6% 11.9%
60%-70% 2.0% 10.0% 12.0%
70%-80% 2.9% 9.6% 12.5%
80%-90% 4.8% 9.7% 14.5%
90%-100% 4.4% 7.5% 11.9%
100%-110% 1.8% 4.0% 5.8%
110%-120% 0.7% 1.7% 2.4%
>120% 0.6% 1.9% 2.5%
20.6% 79.4% 100.0%
LTV is not the sole determinant of loan quality
44
Investor Relations
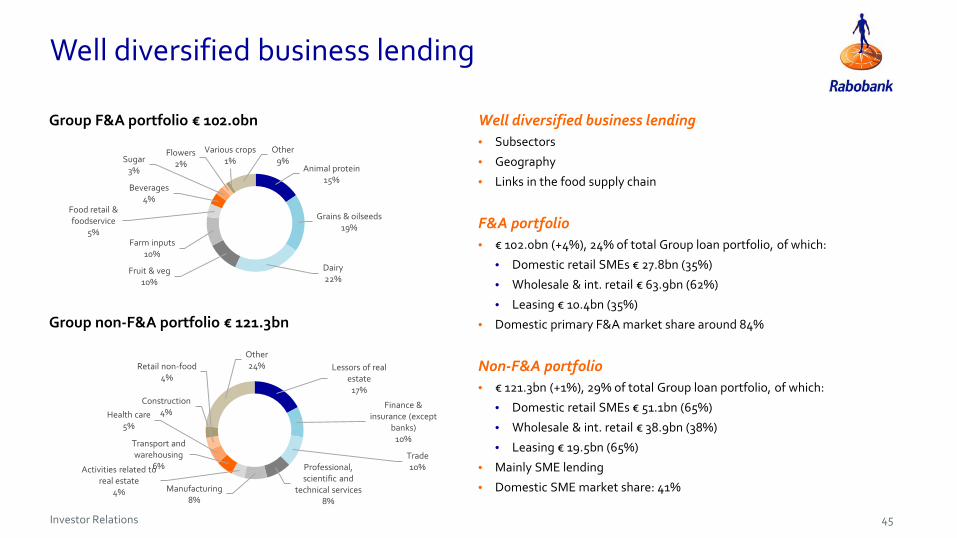
Well diversified business lending
Well diversified business lending• Subsectors
• Geography
• Links in the food supply chain
F&A portfolio• € 102.0bn (+4%), 24% of total Group loan portfolio, of which:
• Domestic retail SMEs € 27.8bn (35%)
• Wholesale & int. retail € 63.9bn (62%)
• Leasing € 10.4bn (35%)
• Domestic primary F&A market share around 84%
Non-F&A portfolio• € 121.3bn (+1%), 29% of total Group loan portfolio, of which:
• Domestic retail SMEs € 51.1bn (65%)
• Wholesale & int. retail € 38.9bn (38%)
• Leasing € 19.5bn (65%)
• Mainly SME lending
• Domestic SME market share: 41%
Group F&A portfolio € 102.0bn
Group non-F&A portfolio € 121.3bn
Lessors of real estate
17%
Finance & insurance (except
banks)10%
Trade10%Professional,
scientific and technical services
8%Manufacturing
8%
Activities related to real estate
4%
Transport and warehousing
6%
Health care5%
Construction4%
Retail non-food4%
Other24%
Animal protein15%
Grains & oilseeds19%
Dairy22%
Fruit & veg10%
Farm inputs10%
Food retail & foodservice
5%
Beverages4%
Sugar3%
Flowers2%
Various crops1%
Other9%
45

Investor Relations
Commercial real estate: exposure further managed down
• CRE financing by Domestic retail and Real estate segments
• CRE exposure is being actively managed down (2016: -15%). We continue to apply prudent financing, review and valuation policies
• Releases from loan impairment allowances exceeded additions, resulting in loan impairment charges of € -28mn
• LTV of domestic lessors of real estate (i.e. buy-to-let) loan portfolio further improved to 73% (79%)
• FGH Bank is being integrated into Rabo Real Estate Finance, the newly established centre of expertise for CRE within Rabobank
• International CRE financing by ACC Loan Management (net loan portfolio € 250mn)
Breakdown of domestic commercial real estate loan portfolio
In € mn Net loan portfolio Gross non-performing loans Allowance** LIC Write-offs
Dec. 2016 Dec. 2016 Dec. 2016 2016 2016
Domestic Lessors of real estate 22,200 4,069 1,191 -22 326
Domestic Property development 1,550 556 291 -6 49
Total Domestic 23,750 4,625 1,482 -28 375
Dec. 2015* Dec. 2015 Dec. 2015* 2015* 2015*
Total Domestic Dec. 2015 / 2015 28,023 5,728 1,991 164 406
Domestic commercial real estate lending
* As of 2016 Rabobank applies a more prudent definition of CRE exposure. As a result the net CRE loan portfolio as at Dec. 2015 increased to € 28.0 (€ 23.4) bn. The levels of allowances, LIC and write-offs did not change** The table above only concerns specific loan impairment charges and loan impairment allowances
46
Offices & mixed use26%
Residential21%Retail outlets
17%
Industrial14%
Land4%
Other 18%

Investor Relations
Topics
Update on strategy
Annual results 2016
Appendix:
• Rabobank: Dutch, cooperative and profitable
• Financial results
• Loan portfolio
• Capital, Funding & Liquidity
• Current & future developments
47
Investor Relations
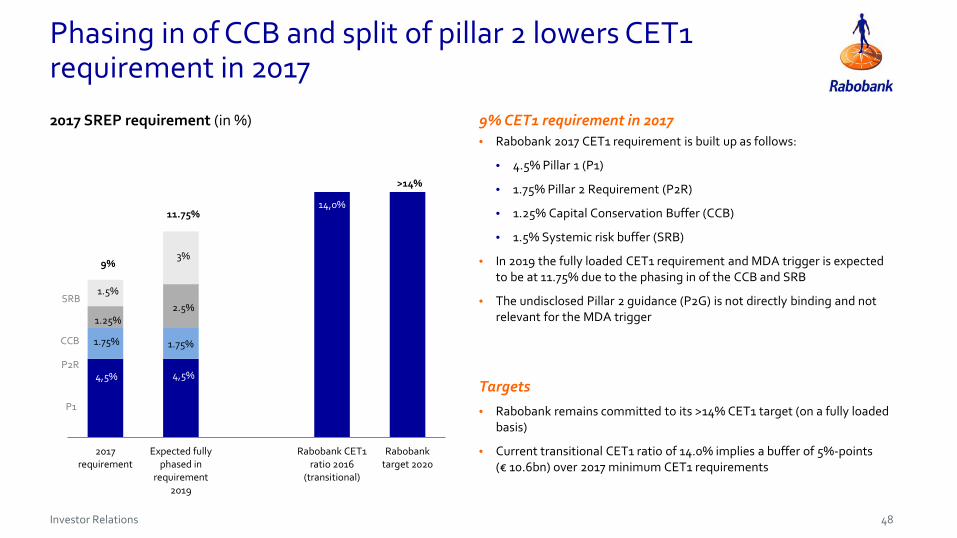
Phasing in of CCB and split of pillar 2 lowers CET1 requirement in 2017
• Rabobank 2017 CET1 requirement is built up as follows:
• 4.5% Pillar 1 (P1)
• 1.75% Pillar 2 Requirement (P2R)
• 1.25% Capital Conservation Buffer (CCB)
• 1.5% Systemic risk buffer (SRB)
• In 2019 the fully loaded CET1 requirement and MDA trigger is expected to be at 11.75% due to the phasing in of the CCB and SRB
• The undisclosed Pillar 2 guidance (P2G) is not directly binding and not relevant for the MDA trigger
2017 SREP requirement (in %) 9% CET1 requirement in 2017
• Rabobank remains committed to its >14% CET1 target (on a fully loaded basis)
• Current transitional CET1 ratio of 14.0% implies a buffer of 5%-points (€ 10.6bn) over 2017 minimum CET1 requirements
Targets4,5% 4,5%
14,0%
2017requirement
Expected fullyphased in
requirement2019
Rabobank CET1ratio 2016
(transitional)
Rabobanktarget 2020
11.75%
9%
1.5%
3%
2.5%1.25%
1.75%1.75%
>14%
P1
CCB
SRB
P2R
48

Investor Relations
13.5%
0,3% 0,4% 0,2%14.0%
0,4% 0.3%
2015 CRD IVphase in
2016
Profit minusdividend
Sale ofAthlon
Other 2016 CRD IVphase in
2017
RabobankCertificates
issuance
Pro formaJan 2017
Solid growth of common equity tier 1 ratio
• Transitional CET1 ratio: 14.0%
• Fully loaded CET1 ratio: 13.5%
• CRD IV impact 1 January 2017: -0.25%-points
• Pro-forma impact of new Rabobank Certificates issuance (Jan 2017) +0.8%-point
Main developments
• Rabobank 2017 CET1 requirement is 9%. In 2019 the fully loaded CET1 requirement and MDA trigger is expected to be at 11.75% due to the phasing in of the CCB and SRB
• Rabobank continues to be committed to a (fully loaded) CET1 ratio of >14% and a total capital ratio of >25% by 2020, subject to changing regulatory requirements
• The 31 December 2016 buffer to 2017 requirements is 5%-points and to the fully phased in requirements (2019) 2.25%-points (€ 4.7bn)
• Rabobank’s distributable items amounted to € 25.8bn as at 31 December 2016
Targets and regulatory requirements
Transitional CET1 development
Fully loaded CET1 development
0.8%
14.5%
>14%
0.8%
2013 2014 2015 2016 RabobankCertificates
issuance
Pro forma Jan2017
Target 2020
11.1% 11.8% 12.0%13.5% 14.3%
49

Investor Relations
Rabobank already meets the > 25% total capital target
13,5% 13,6% 13,5% 14,0%
>25.0%
3,1% 2,4% 2,9%3,6%
2.0%
3,2%5,3%
6,8%7,4%
0,0%2013 2014 2015 2016 Target 2020
23.2%
25.0%
>14%
Capital structure(in %)
Highlights
19.8%21.3%
CET1
AT1
Tier 2
50
• Since 2012, high capital ratios are targeted to protect senior bond holders against the (unlikely) event of a bail-in
• Rabobank adjusted its target Additional Tier 1 layer to roughly 2% (from 3.5%) with the issuance of Rabobank Certificates. This will further optimise the capital stack
• More guidance on MREL is expected in 2017. Once the EC creditor hierarchy proposal is adopted and implemented in the Netherlands, Rabobank could opt to issue non-preferred senior debt to meet MREL requirements
• Transitional ratios as at 31 December 2016:
• Tier 1 ratio 17.6%
• Total capital ratio 25.0%
• Leverage ratio 5.5%

Investor Relations
Large bail-in buffer protecting senior debt holders
• The bail-in buffer consists of (subordinated) balance sheet items protecting senior unsecured debt against the unlikely event of bail-in
• All buffer items have a residual maturity of over 1 year, in line with the proposed MREL requirements
• Rabobank has a strong buffer in place totaling € 58.0bn i.e. 27.5% of RWA
Stress testing bail-in buffer* (Dec. 2016) Bail-in buffer as proxy for MREL
• Senior unsecured is not affected until losses exceed 8.8% of Rabobank’s balance sheet total
• If losses were to amount 10% of the balance sheet total, senior unsecured would only be bailed in up to 6% of its nominal outstanding
Bail-in buffer stress test
0
50
100
150
200
Dec.2016
1% 2% 3% 4% 5% 6% 7% 8% 9% 10%
T2 AT1 CET1 Loss SCNs Loss T2 Loss AT1 Loss CET1
Loss in % of balance sheet total (€ 662bn)
€ bn
* Capital figures based on gross numbers, i.e. excluding CET1 deductions, including the notional amount of grandfathered Tier 1 and Tier 2 instruments. Minority interests are disregarded
51

Investor Relations
Funding strategy: continued focus on diversification
• In 2016 Rabobank issued € 14.2bn in senior unsecured funding. Rabobank also participated (in small size) in TLTRO
• A preliminary target of € 15bn has been set for 2017, subject to balance sheet developments
• This number includes possible TLTRO take up and Covered Bond issuance
• With a targeted stable deposit base, wholesale funding requirements will likely be lower in the future
Funding target• Diversified wholesale funding mix achieved by using different markets,
maturities, currencies and products
• In terms of products, Rabobank added Green Bonds to its funding mix and issued its inaugural € 500mn Green Bond in 2016
• Furthermore, Rabobank is in the process of registering a Covered Bond programme
• Continued commitment towards (unsecured) strategic benchmark curves
Funding strategy: adding Covered Bonds to the mix
• Rabobank has registered the Covered Bond Programme in the DNB register for Soft Bullet Covered Bond Programmes
• Rabobank plans to issue 1 to 2 benchmarks per year to build a covered bond curve
• Program size: € 25bn
Covered Bond programme specifics
52
-20
-10
-
10
20
302009 2010 2011 2012 2013 2014 2015 2016
Rabobank from net positive to net negative issuer (in € bn)

Investor Relations
Rabobank actively manages liquidity buffer
• Rabobank aims to be best-in-class issuer with a prudential approach to meet (regulatory) ratios and strong inflow due to high creditworthiness
• The liquidity strategy is driven by diversifying sources of funding, by using a range of (cash) products and instruments
• Total short-term debt outstanding € 45.7bn (Dec. 2016)• Issuance profile smoothened throughout the year• Notes are liquid and characterised by active trading in
secondary markets• Rabobank has an unparalleled track-record with respect to
providing liquidity in our own paper
• NSFR 119% (116%) – LCR 130% (128%)
Liquidity strategy
0
5
10
15
20
25
<5 5-30 31-90 91-180 181-365 >365
In € bn
days
Maturity profile short term debt (Dec. 2016)
Total liquidity buffer € 141.0bn (Dec. 2016)
53
Level 1 assets (72%)
Level 2A assets (0.6%)
Level 2B assets (0.1%)
Internal RMBS’s (27%)

Investor Relations
CRD IV qualifying capital
On a transitional basis (amounts in € bn) 31 Dec. 2015 1 Jan. 2016 31 Dec. 2016
Common Equity Tier 1 capital 28.8 27.8 29.6
Tier 1 capital 35.1 33.6 37.1
Total capital 49.5 48.2 52.9
Risk-weighted assets 213.1 212.8 211.2
Common Equity Tier 1-ratio 13.5% 13.1% 14.0%
Tier 1-ratio 16.4% 15.8% 17.6%
Total capital-ratio 23.2% 22.7% 25.0%
Leverage ratio 5.1% 4.9% 5.5%
On a fully loaded basis (amounts in € bn) 31 Dec. 2015 1 Jan. 2016 31 Dec. 2016
Common Equity Tier 1 capital 25.5 25.5 28.4
Risk-weighted assets 211.8 211.8 211.2
Common Equity Tier 1-ratio 12.0% 12.0% 13.5%
Leverage ratio 3.9% 3.9% 4.6%
54
Investor Relations
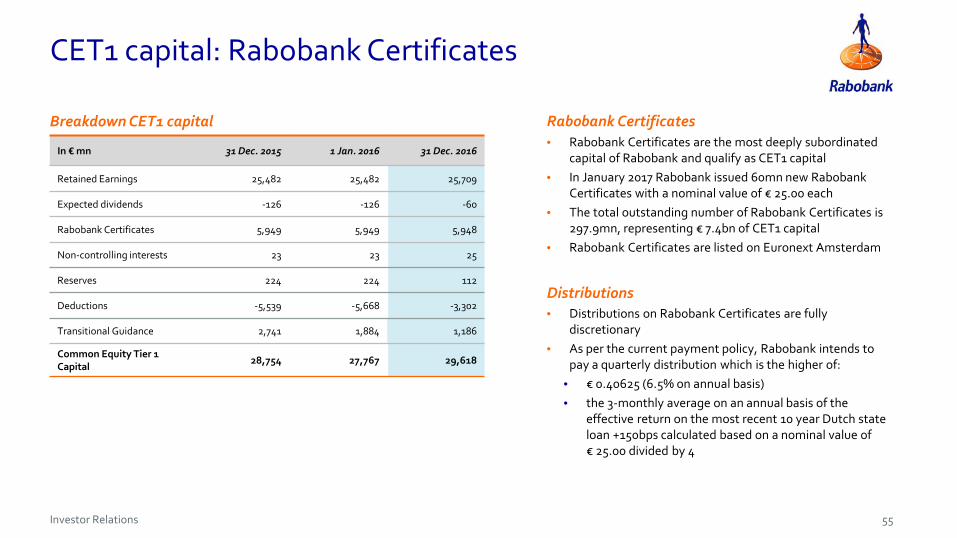
CET1 capital: Rabobank Certificates
In € mn 31 Dec. 2015 1 Jan. 2016 31 Dec. 2016
Retained Earnings 25,482 25,482 25,709
Expected dividends -126 -126 -60
Rabobank Certificates 5,949 5,949 5,948
Non-controlling interests 23 23 25
Reserves 224 224 112
Deductions -5,539 -5,668 -3,302
Transitional Guidance 2,741 1,884 1,186
Common Equity Tier 1 Capital
28,754 27,767 29,618
• Rabobank Certificates are the most deeply subordinated capital of Rabobank and qualify as CET1 capital
• In January 2017 Rabobank issued 60mn new Rabobank Certificates with a nominal value of € 25.00 each
• The total outstanding number of Rabobank Certificates is 297.9mn, representing € 7.4bn of CET1 capital
• Rabobank Certificates are listed on Euronext Amsterdam
Distributions• Distributions on Rabobank Certificates are fully
discretionary• As per the current payment policy, Rabobank intends to
pay a quarterly distribution which is the higher of: • € 0.40625 (6.5% on annual basis)• the 3-monthly average on an annual basis of the
effective return on the most recent 10 year Dutch state loan +150bps calculated based on a nominal value of € 25.00 divided by 4
Breakdown CET1 capital Rabobank Certificates
55
Investor Relations
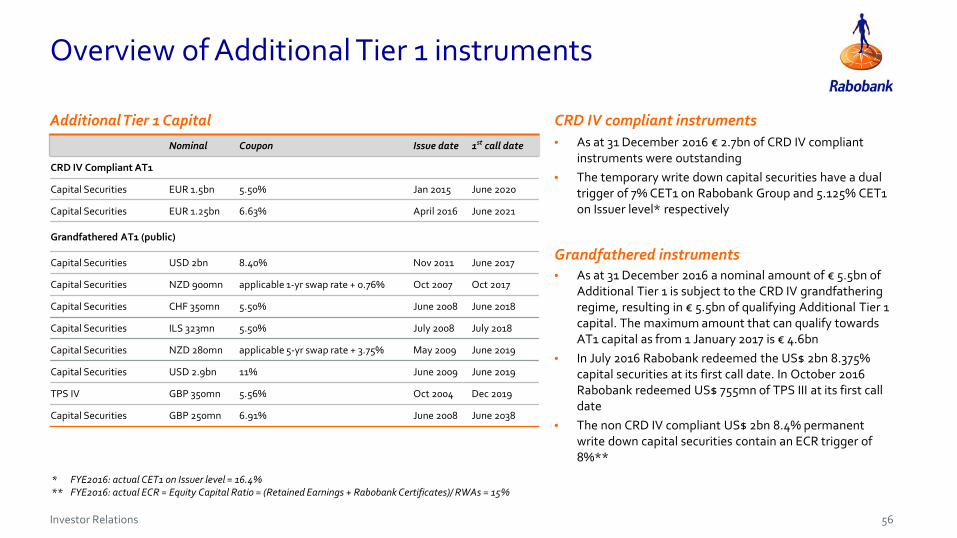
Overview of Additional Tier 1 instruments
Nominal Coupon Issue date 1st call date
CRD IV Compliant AT1
Capital Securities EUR 1.5bn 5.50% Jan 2015 June 2020
Capital Securities EUR 1.25bn 6.63% April 2016 June 2021
Grandfathered AT1 (public)
Capital Securities USD 2bn 8.40% Nov 2011 June 2017
Capital Securities NZD 900mn applicable 1-yr swap rate + 0.76% Oct 2007 Oct 2017
Capital Securities CHF 350mn 5.50% June 2008 June 2018
Capital Securities ILS 323mn 5.50% July 2008 July 2018
Capital Securities NZD 280mn applicable 5-yr swap rate + 3.75% May 2009 June 2019
Capital Securities USD 2.9bn 11% June 2009 June 2019
TPS IV GBP 350mn 5.56% Oct 2004 Dec 2019
Capital Securities GBP 250mn 6.91% June 2008 June 2038
• As at 31 December 2016 € 2.7bn of CRD IV compliant instruments were outstanding
• The temporary write down capital securities have a dual trigger of 7% CET1 on Rabobank Group and 5.125% CET1 on Issuer level* respectively
Grandfathered instruments• As at 31 December 2016 a nominal amount of € 5.5bn of
Additional Tier 1 is subject to the CRD IV grandfathering regime, resulting in € 5.5bn of qualifying Additional Tier 1 capital. The maximum amount that can qualify towards AT1 capital as from 1 January 2017 is € 4.6bn
• In July 2016 Rabobank redeemed the US$ 2bn 8.375% capital securities at its first call date. In October 2016 Rabobank redeemed US$ 755mn of TPS III at its first call date
• The non CRD IV compliant US$ 2bn 8.4% permanent write down capital securities contain an ECR trigger of 8%**
Additional Tier 1 Capital CRD IV compliant instruments
* FYE2016: actual CET1 on Issuer level = 16.4%** FYE2016: actual ECR = Equity Capital Ratio = (Retained Earnings + Rabobank Certificates)/ RWAs = 15%
56
Investor Relations
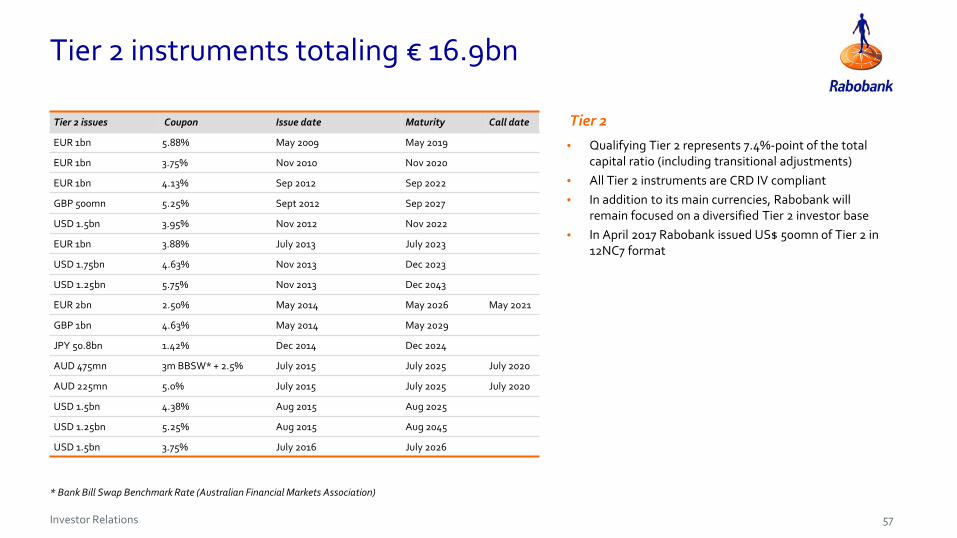
Tier 2 instruments totaling € 16.9bn
Tier 2 issues Coupon Issue date Maturity Call date
EUR 1bn 5.88% May 2009 May 2019
EUR 1bn 3.75% Nov 2010 Nov 2020
EUR 1bn 4.13% Sep 2012 Sep 2022
GBP 500mn 5.25% Sept 2012 Sep 2027
USD 1.5bn 3.95% Nov 2012 Nov 2022
EUR 1bn 3.88% July 2013 July 2023
USD 1.75bn 4.63% Nov 2013 Dec 2023
USD 1.25bn 5.75% Nov 2013 Dec 2043
EUR 2bn 2.50% May 2014 May 2026 May 2021
GBP 1bn 4.63% May 2014 May 2029
JPY 50.8bn 1.42% Dec 2014 Dec 2024
AUD 475mn 3m BBSW* + 2.5% July 2015 July 2025 July 2020
AUD 225mn 5.0% July 2015 July 2025 July 2020
USD 1.5bn 4.38% Aug 2015 Aug 2025
USD 1.25bn 5.25% Aug 2015 Aug 2045
USD 1.5bn 3.75% July 2016 July 2026
• Qualifying Tier 2 represents 7.4%-point of the total capital ratio (including transitional adjustments)
• All Tier 2 instruments are CRD IV compliant• In addition to its main currencies, Rabobank will
remain focused on a diversified Tier 2 investor base• In April 2017 Rabobank issued US$ 500mn of Tier 2 in
12NC7 format
* Bank Bill Swap Benchmark Rate (Australian Financial Markets Association)
Tier 2
57

Investor Relations
Globally diversified wholesale funding portfolio
• Rabobank is committed to a liquid EUR benchmark curve and has excellent access to short term as well as long term funding
• Issuance is done in over 20 different currencies enabling investors to diversify their portfolios
• Rabobank continues to explore new funding markets and is open for any attractive trade idea
Public market
• Active in all local markets• Possibility of different trade formats• Rabobank is a prominent issuer in structured MTNs, issuing
about 10% of funding in this format• Ability to issue in the most innovative products
Private Placements
58

Investor Relations
Topics
Update on strategy
Annual results 2016
Appendix:
• Rabobank: Dutch, cooperative and profitable
• Financial results
• Loan portfolio
• Capital, Funding & Liquidity
• Current & future developments
59

Investor Relations
Limited UK exposure and low direct impact of Brexit
• Rabobank’s direct exposure to clients in the UK is limited
• Total exposure UK (Dec. 2016): € 5.8bn (excluding deposits at the BoE and sovereign exposure)
• In the UK Rabobank focusses primarily on Food & Agri Banking. More than half of the exposure is related to Trade & Commodity Finance business, about a quarter are corporate loans and the remainder includes Asset Based Finance transactions
• Rabobank analysed the potential impact on our customers with substantial trade flows with the UK; some of them with a high concentration will suffer, but broadly spoken their position is relatively strong
• We do not expect a significant adverse impact on our portfolio
• Indirect effect of Brexit could be negative for the Dutch economy
• The UK is an important trade partner of the Netherlands. Around 8% of Dutch exports go to the UK, and they contribute 2.3% to Dutch GDP. In addition, around 11% of total Dutch imports come from the UK
60

Investor Relations
Likelihood of a Nexit significantly reduced due to the pro-EU outcome of the Dutch elections• The Dutch elections in March were the first elections this year in
a key Western economy
• Populist and eurosceptic Freedom Party was leading the polls in the run-up to the elections, but the Liberal Party overwhelmingly won the elections
• Freedom Party, the only party in favour of the Netherlands leaving the EU, will not be invited to participate in negotiations to form a new coalition
Nexit very unlikely
• Rabobank is of the opinion that the new coalition will not call for a consultative referendum on Nexit
• Additional safeguards exist, as the upper house would also have to agree to such referendum and for now is pro-EU (elections not until 2019)
• Advisory referendum on Nexit cannot be called by the Dutch population as there is no bill on leaving the EU
• Dutch population is less eurosceptic than EU average, according to Eurobarometer
Seats in lower house (out of 150 seats)
What about a referendum?
010203040506070
010203040506070
LiberalParty(VVD)
SocialDemocrats
(PvdA)
FreedomParty(PVV)
SocialistParty(SP)
ChristianDemocrats
(CDA)
LiberalDemocrats
(D66)
ChristianUnion(CU)
Greens(GroenLinks)
ElderlyParty
(50PLUS)
Others
Current seats in lower house Recent polls
Does need coalition partner(s)
Has a two-thirds majority
Does not need coalition partner(s)
0
20
40
60
80
100
0
20
40
60
80
100
UK EU NLAgree Disagree Don't know
% %Our country could better face the future outside the European Union*
61* Source: Eurobarometer 85, autumn 2016
Investor Relations
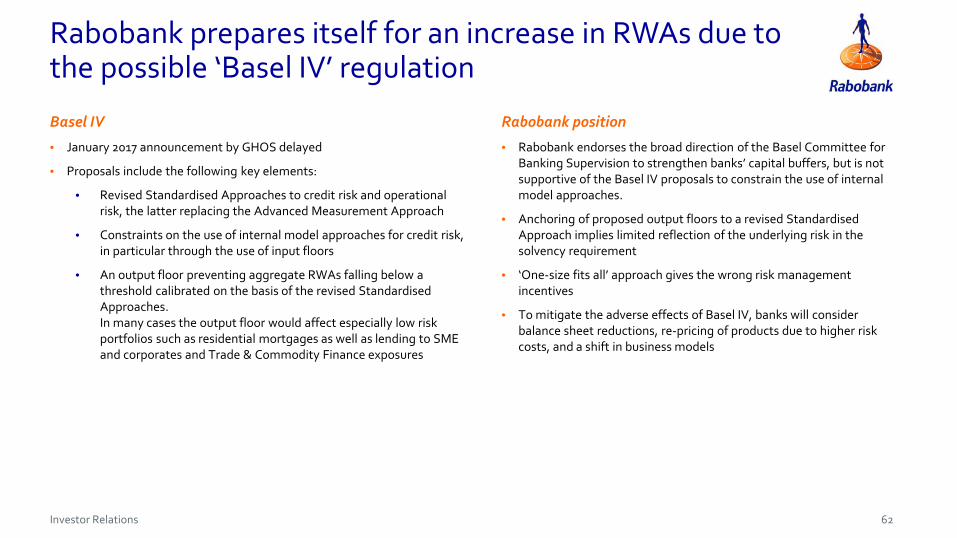
Rabobank prepares itself for an increase in RWAs due to the possible ‘Basel IV’ regulation
62
Basel IV
• January 2017 announcement by GHOS delayed
• Proposals include the following key elements:
• Revised Standardised Approaches to credit risk and operational risk, the latter replacing the Advanced Measurement Approach
• Constraints on the use of internal model approaches for credit risk, in particular through the use of input floors
• An output floor preventing aggregate RWAs falling below a threshold calibrated on the basis of the revised StandardisedApproaches.In many cases the output floor would affect especially low risk portfolios such as residential mortgages as well as lending to SME and corporates and Trade & Commodity Finance exposures
Rabobank position
• Rabobank endorses the broad direction of the Basel Committee for Banking Supervision to strengthen banks’ capital buffers, but is not supportive of the Basel IV proposals to constrain the use of internal model approaches.
• Anchoring of proposed output floors to a revised StandardisedApproach implies limited reflection of the underlying risk in the solvency requirement
• ‘One-size fits all’ approach gives the wrong risk management incentives
• To mitigate the adverse effects of Basel IV, banks will consider balance sheet reductions, re-pricing of products due to higher risk costs, and a shift in business models

Investor Relations
Rabobank prepares for the implementation of IFRS 9
• IFRS 9 replaces IAS 39 and becomes effective as per 1 January 2018
• Rabobank has set up an IFRS 9 program to prepare for the implementation of the new framework
• Compared to IAS 39 we expect an overall increase in the level of loan loss allowances, which are also expected to become more volatile
• Rabobank will utilize it’s regulatory A-IRB credit models as the basis for the Expected Credit Loss assessment under IFRS 9
• We will create an IFRS 9 overlay to our Basel A-IRB models to remove prudential regulatory elements and include point-in-time elements andmulti-year macro-economic scenario effects
• Adverse impact of higher provisions under IFRS 9 on the CET1 ratio will be somewhat mitigated by lower IRB shortfall deductions
• We expect the impact of IFRS 9 on Rabobank’s provisioning levels to be manageable and will communicate estimates of the quantitative impact in the 2017 Interim Report
Non-credit impaired12-months ECL
Non-credit impairedLifetime ECL
Credit impaired (defaulted)
Lifetime ECL
Stage 1 Stage 2 Stage 3
Significant increasein credit risk
Objective evidencefor impairmentAt loan origination
63
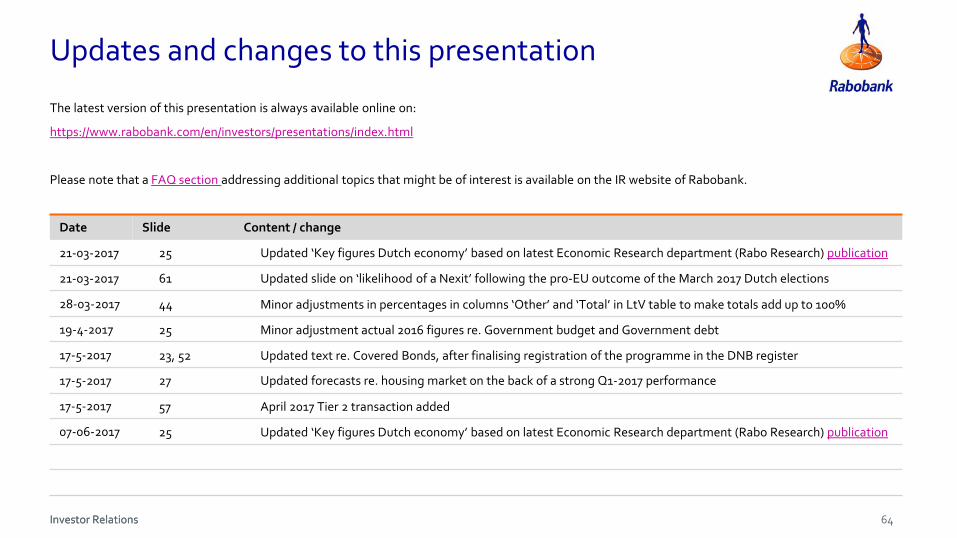
Investor Relations
Updates and changes to this presentation
64Investor Relations
The latest version of this presentation is always available online on:
https://www.rabobank.com/en/investors/presentations/index.html
Please note that a FAQ section addressing additional topics that might be of interest is available on the IR website of Rabobank.
Date Slide Content / change
21-03-2017 25 Updated ‘Key figures Dutch economy’ based on latest Economic Research department (Rabo Research) publication
21-03-2017 61 Updated slide on ‘likelihood of a Nexit’ following the pro-EU outcome of the March 2017 Dutch elections
28-03-2017 44 Minor adjustments in percentages in columns ‘Other’ and ‘Total’ in LtV table to make totals add up to 100%
19-4-2017 25 Minor adjustment actual 2016 figures re. Government budget and Government debt
17-5-2017 23, 52 Updated text re. Covered Bonds, after finalising registration of the programme in the DNB register
17-5-2017 27 Updated forecasts re. housing market on the back of a strong Q1-2017 performance
17-5-2017 57 April 2017 Tier 2 transaction added
07-06-2017 25 Updated ‘Key figures Dutch economy’ based on latest Economic Research department (Rabo Research) publication

Investor Relations – Rabobank Group
Telephone +31 30 712 2401 P.O. Box 17100, UC 044E-mail [email protected] 3500 HG UtrechtWebsite www.rabobank.com/IR The NetherlandsBloomberg RABO NA
Download the Rabo IR App on the Apple App Store or on Google Play
More information
Rabo IR
20170607