investor presentation december 2012 - max financial · pdf fileinvestor presentation december...
TRANSCRIPT
1
Max India Limited
Investor Presentation
December 2012
BSE Scrip Code: 500271, NSE Ticker: MAX, Bloomberg: MAX:IN www.maxindia.com

2
MAX GROUP - OVERVIEW
www.maxindia.com

3
“ IN THE BUSINESS OF LIFE ”
Life Insurance
Protecting Life Healthcare
Caring for Life
Health Insurance
Enhancing Life
74:26 JV* with Mitsui
Sumitomo;
Largest non bank lead
private life insurer
74:26 JV* with Life
Healthcare, SA;
2,000 beds
74:26 JV with BUPA
Finance Plc, UK
Our vision
“To be the most admired corporate for service excellence”
Multi-business corporate Focused on people and service
Focus on healthcare, children and the
environment
Corporate Social Responsibility
Senior Living
100% Owned;
Continuing Care
Retirement Community in
Dehradun
Niche high barrier polymer films & Leather
Finishing Foils
Speciality Films Clinical Research
100% owned;
486 active sites
* Max India currently holds 71.1% in Max Life and 71.2% in Max Healthcare
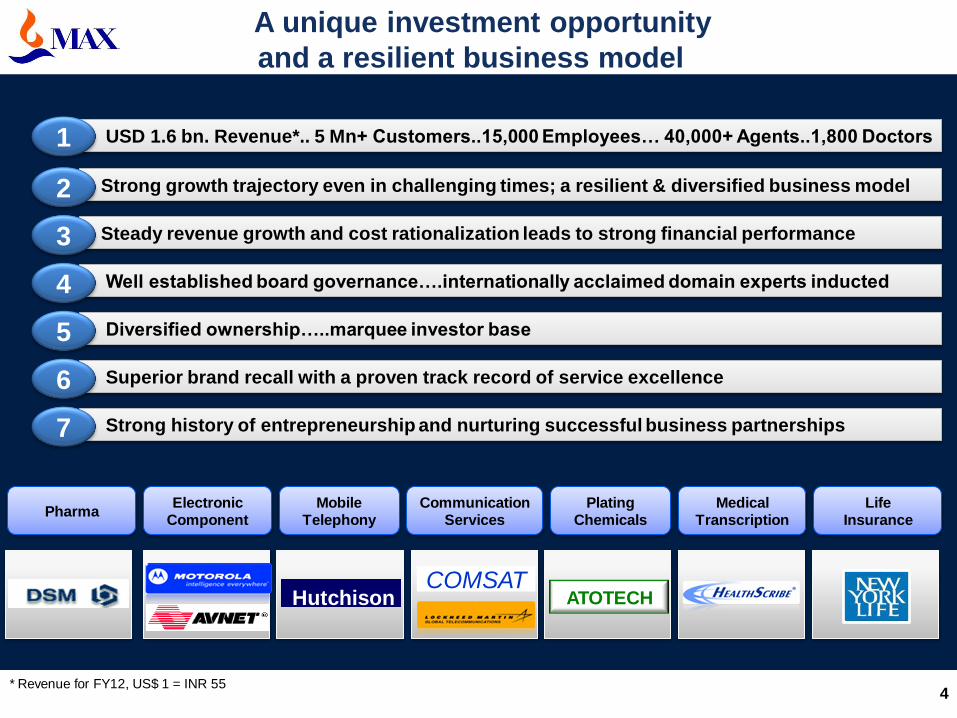
USD 1.6 bn. Revenue*.. 5 Mn+ Customers..15,000 Employees… 40,000+ Agents..1,800 Doctors
Strong growth trajectory even in challenging times; a resilient & diversified business model
Steady revenue growth and cost rationalization leads to strong financial performance
Well established board governance….internationally acclaimed domain experts inducted
Diversified ownership…..marquee investor base
Superior brand recall with a proven track record of service excellence
Strong history of entrepreneurship and nurturing successful business partnerships
4
A unique investment opportunity
and a resilient business model
1
2
3
4
5
6
7
Pharma Electronic
Component Mobile
Telephony Communication
Services Plating
Chemicals Medical
Transcription
Hutchison COMSAT
ATOTECH
* Revenue for FY12, US$ 1 = INR 55
Life Insurance
5
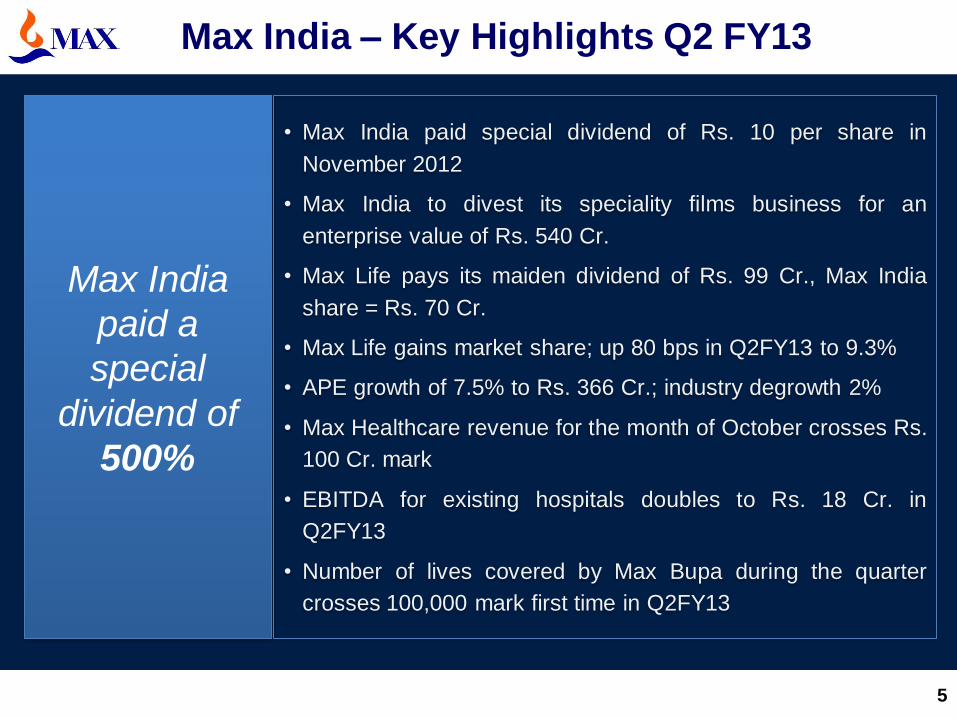
Max India – Key Highlights Q2 FY13
Max India
paid a
special
dividend of
500%
• Max India paid special dividend of Rs. 10 per share in
November 2012
• Max India to divest its speciality films business for an
enterprise value of Rs. 540 Cr.
• Max Life pays its maiden dividend of Rs. 99 Cr., Max India
share = Rs. 70 Cr.
• Max Life gains market share; up 80 bps in Q2FY13 to 9.3%
• APE growth of 7.5% to Rs. 366 Cr.; industry degrowth 2%
• Max Healthcare revenue for the month of October crosses Rs.
100 Cr. mark
• EBITDA for existing hospitals doubles to Rs. 18 Cr. in
Q2FY13
• Number of lives covered by Max Bupa during the quarter
crosses 100,000 mark first time in Q2FY13

6
3244 4508
5574 6668
7648
0
2000
4000
6000
8000
10000
FY 08 FY 09 FY10 FY11 FY12
Operating Revenue Trend
Rs Cr.
Rs Cr.
Consistent track record of strong growth across businesses
with the group turning strong profits
FY 08 FY 09 FY 10 FY11 FY12 H1
FY13
Net Worth 1,537 1,312 1,993 1,944 2,513 2,898
Loan Funds 552 347 440 507 549 572
Net Fixed
Assets 718 930 965 1,017 1,256 1,312
Treasury
Corpus 1,261 413 909 540 397 788
Life Ins. AUM 3,575 5,405 10,121 13,836 17,215 19,184
FY 08 FY 09 FY 10 FY’11 FY12 H1*
FY13
Operating
Revenue 3,244 4,508 5,574 6,668 7,648 3,661
Investment and
Other Income 367 383 2,087 1,223 914 1.128
Total Revenue 3,611 4,891 7,661 7,891 8,562 4,789
Expenses 3,671 5,224 7,747 7,859 8,320 4,674
Profit / (Loss)
before Tax (60) (333) (86) 32 242 115
(60)
(333)
(86) 32
242
-400
-300
-200
-100
0
100
200
300
FY 08 FY 09 FY10 FY11 FY12
Profitability Trend
Rs Cr.
*Investment & Other Income and PBT for H1’FY13 is net of income from stake sale in Max Life amounting to Rs. 802 Crore.

7
Growth potential recognized by the market….
high pedigree investor base
• Reliance MF
• Fidelity
• DSP Blackrock
• Natwest
• Temasek
• First State
• Matthews
• Cresta Fund
• Morgan Stanley
Shareholding Concentrated with Marquee
Investors
Number of outstanding shares : 26.5 Cr.
Promoter 38.9%
IFC 3.9%
Goldman Sachs 15.6%
FII (Others) 22.0%
Mutual Funds 9.3%
Others 10.3%
Shareholding Pattern as on Sep 30, 2012
8
MAX LIFE INSURANCE COMPANY (Max Life)
www.maxnewyorklife.com
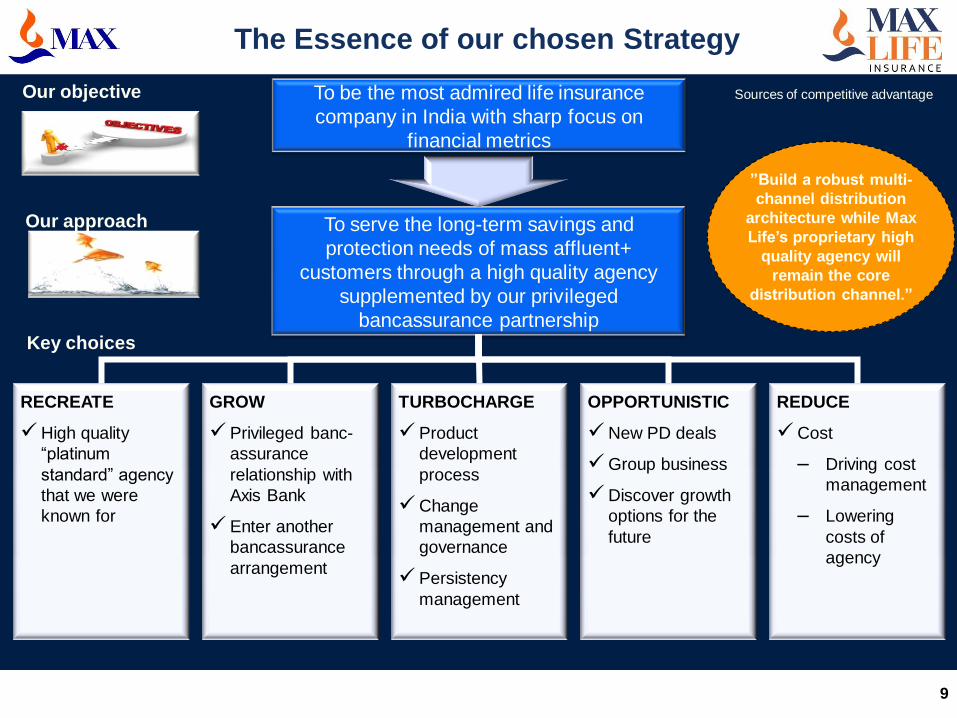
The Essence of our chosen Strategy
9
Sources of competitive advantage
To serve the long-term savings and
protection needs of mass affluent+
customers through a high quality agency
supplemented by our privileged
bancassurance partnership
To be the most admired life insurance
company in India with sharp focus on
financial metrics
RECREATE
High quality
“platinum
standard” agency
that we were
known for
GROW
Privileged banc-
assurance
relationship with
Axis Bank
Enter another
bancassurance
arrangement
TURBOCHARGE
Product
development
process
Change
management and
governance
Persistency
management
OPPORTUNISTIC
New PD deals
Group business
Discover growth
options for the
future
REDUCE
Cost
– Driving cost
management
– Lowering
costs of
agency
Our objective
Our approach
Key choices
”Build a robust multi-
channel distribution
architecture while Max
Life’s proprietary high
quality agency will
remain the core
distribution channel.”
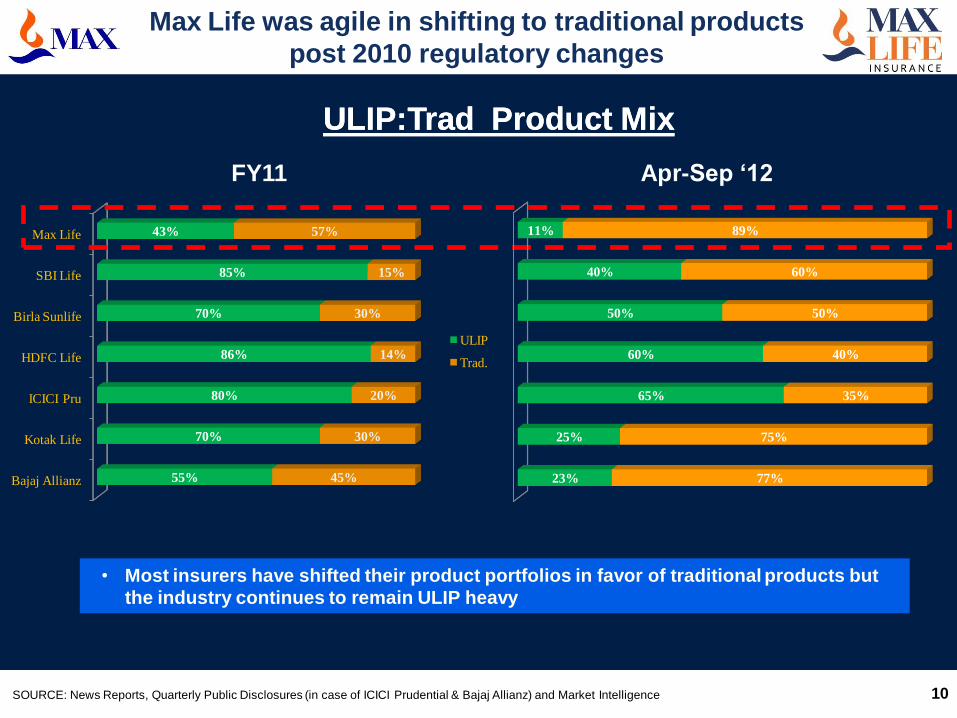
Bajaj Allianz
Kotak Life
ICICI Pru
HDFC Life
Birla Sunlife
SBI Life
Max Life
55%
70%
80%
86%
70%
85%
43%
45%
30%
20%
14%
30%
15%
57%
ULIP
Trad.
10
Max Life was agile in shifting to traditional products
post 2010 regulatory changes
• Most insurers have shifted their product portfolios in favor of traditional products but
the industry continues to remain ULIP heavy
ULIP:Trad Product Mix
SOURCE: News Reports, Quarterly Public Disclosures (in case of ICICI Prudential & Bajaj Allianz) and Market Intelligence
ULIP:Trad Product Mix
FY11 Apr-Sep ‘12
23%
25%
65%
60%
50%
40%
11%
77%
75%
35%
40%
50%
60%
89%
11
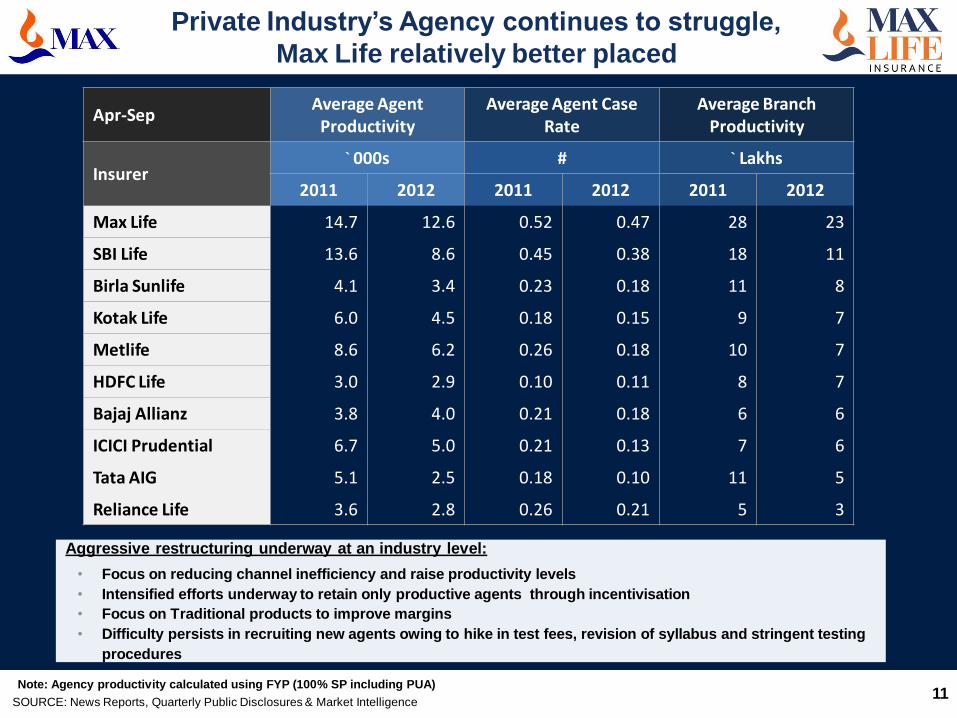
Private Industry’s Agency continues to struggle,
Max Life relatively better placed
SOURCE: News Reports, Quarterly Public Disclosures & Market Intelligence
Note: Agency productivity calculated using FYP (100% SP including PUA)
Aggressive restructuring underway at an industry level:
• Focus on reducing channel inefficiency and raise productivity levels
• Intensified efforts underway to retain only productive agents through incentivisation
• Focus on Traditional products to improve margins
• Difficulty persists in recruiting new agents owing to hike in test fees, revision of syllabus and stringent testing
procedures
Apr-Sep Average Agent
Productivity Average Agent Case
Rate Average Branch
Productivity
Insurer ` 000s # ` Lakhs
2011 2012 2011 2012 2011 2012
Max Life 14.7 12.6 0.52 0.47 28 23
SBI Life 13.6 8.6 0.45 0.38 18 11
Birla Sunlife 4.1 3.4 0.23 0.18 11 8
Kotak Life 6.0 4.5 0.18 0.15 9 7
Metlife 8.6 6.2 0.26 0.18 10 7
HDFC Life 3.0 2.9 0.10 0.11 8 7
Bajaj Allianz 3.8 4.0 0.21 0.18 6 6
ICICI Prudential 6.7 5.0 0.21 0.13 7 6
Tata AIG 5.1 2.5 0.18 0.10 11 5
Reliance Life 3.6 2.8 0.26 0.21 5 3

12
Highly productive agency
model and best in class
training
Agency base at 40,000+ agents
Average case size improves to ~Rs. 24,000 with average case rate ~0.45
Need based insurance sales
400+ trainers on board
Comprehensive product
portfolio with an enduring
customer base
Product mix for the quarter: Par 78%, Non-par 11%, ULIP 11%
Long tenor products (21 Yr) & a young customer profile (34 Yr)
Disclosures ahead of
competition
First life insurer to disclose Embedded Value; EV for FY12 at Rs. 3,684 Cr. grows
15% y-o-y
Implied NBM for FY12 at 17.8%
Other key drivers
Shareholder Profit for H1 FY13 at Rs. 242 Cr.
AUM at Rs. 19,184 Cr. as at Mar 31, 2012, grows 30% y-o-y
Expenses of Management Ratio for H1 FY13 at 29.3% against 30.4% for H1 FY 12
Over 3.5 million polices in-force with Sum assured of over Rs. 158,000 Cr.
Business capitalised at Rs. 2,127 Cr. as at Sep 30, 2012; solvency surplus of Rs.
1,632 Cr. and solvency margin of 554% post dividend distribution
Max Life well positioned for the transformation
Accreditations & Awards
Customer & Brand Loyalty Award 2011
Brand Excellence Award and recognition as ‘Powerbrand’ & ‘Master Brand’
CII Commendation for Business Excellence
CII Six Sigma – 2nd Prize in Project of the Year
Great Places to Work – 2nd best Life Insurance Co.
CIO 100 Award for technology implementation
Updated for H1 FY13 numbers

13
MAX BUPA HEALTH INSURANCE (Max Bupa)
www.maxbupa.in

A symbiotic partnership in
the health insurance space
14
• India’s leading conglomerate
• Successful track record of
building businesses
• Expertise in life insurance,
health insurance and
healthcare businesses
• Group revenues in FY 2012 –
Rs 8,562 crores
• Local perspective of the Indian
market
• Culture of service excellence
• Largest independent health
insurance provider in UK
• 11 million customers in over 190
countries
• Group revenues in 2011 - £8
billion and PBT of £559 million
• Employee base of over 52,000
• Recently voted as best
international health care provider
Leveraging the strengths of both partners to build a robust and profitable
enterprise with focus on service excellence

Industry is poised for an exponential growth
15
Key drivers of growth
SOURCE: Team analysis, WHO statistics, NCAER, McKinsey Urbanisation report, Government economic survey, BRIC report
▪ Increase in affordability
– Increasing affordability with rise
in income levels and healthcare
spend per capita
▪ Increase in willingness
– Rapid scale-up of hospitals and
expansion outside metros
– Take-off of comprehensive
insurance coverage products
e.g. secondary healthcare, out-
patient etc.
– Higher need with rise in
incidences of chronic diseases
(viz. cancer, heart disease)
– Acceptability of insurance with
increasing awareness
▪ Increase in ticket size
– Rise in healthcare costs with
market inflation
17 22 32
51 66 83 111
131 160
192 231
266 305
351
404
464
0
50
100
150
200
250
300
350
400
450
500
GW
P (R
s.
in B
illi
on
)
Indian Health Insurance Market (Rs. In Billion)
• Industry grew by 18% in 2011-12 over last year
• CAGR last 5 years at 34%
• Expected CAGR of 20 - 25% for next 5-10 years
• Insurers focusing on containing loss ratio’s and improving
profitability
• Standalone health insurers growing aggressively
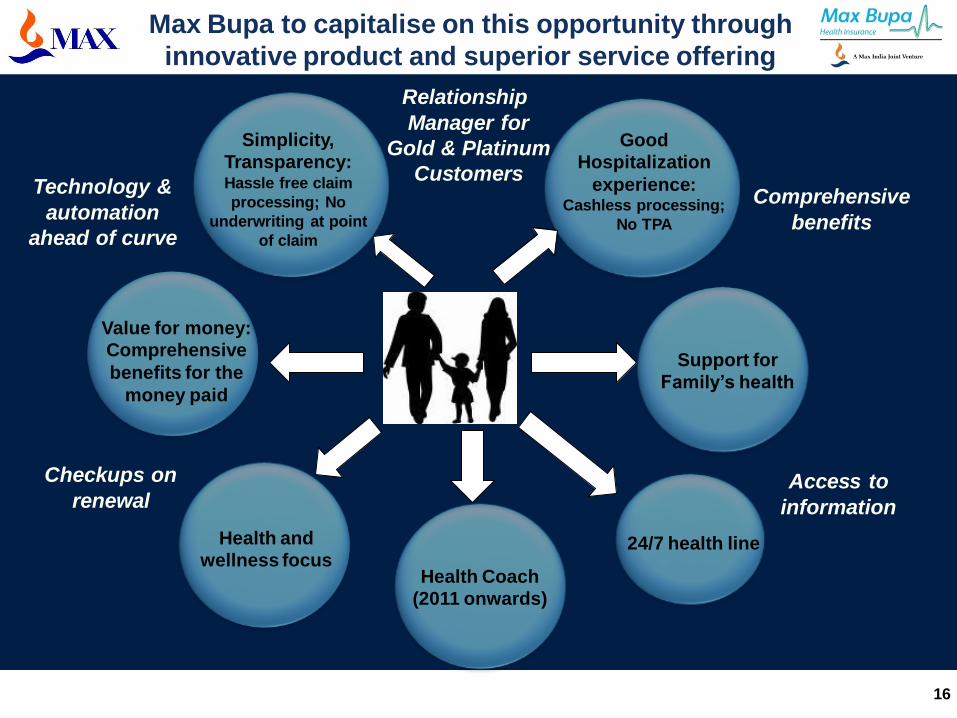
Health and
wellness focus
Value for money:
Comprehensive
benefits for the
money paid
Good
Hospitalization
experience: Cashless processing;
No TPA
Health Coach
(2011 onwards)
Simplicity,
Transparency: Hassle free claim
processing; No
underwriting at point
of claim
Comprehensive
benefits
Access to
information
Checkups on
renewal
Support for
Family’s health
24/7 health line
Relationship
Manager for
Gold & Platinum
Customers
Max Bupa to capitalise on this opportunity through
innovative product and superior service offering
Technology &
automation
ahead of curve
16
17
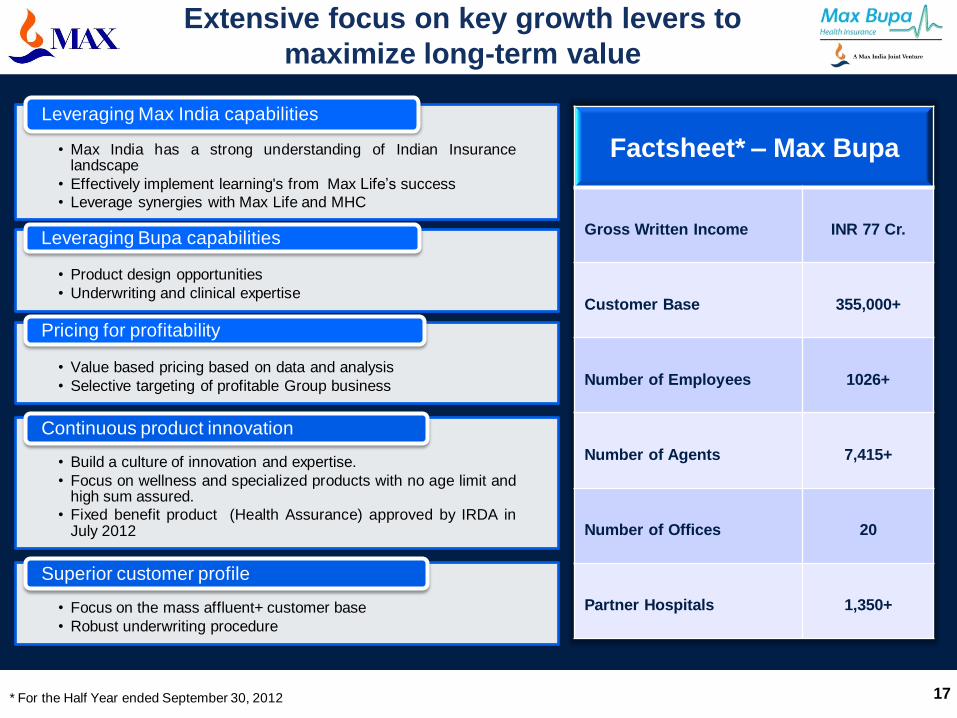
• Max India has a strong understanding of Indian Insurance landscape
• Effectively implement learning's from Max Life’s success
• Leverage synergies with Max Life and MHC
Leveraging Max India capabilities
• Product design opportunities
• Underwriting and clinical expertise
Leveraging Bupa capabilities
• Value based pricing based on data and analysis
• Selective targeting of profitable Group business
Pricing for profitability
• Build a culture of innovation and expertise.
• Focus on wellness and specialized products with no age limit and high sum assured.
• Fixed benefit product (Health Assurance) approved by IRDA in July 2012
Continuous product innovation
• Focus on the mass affluent+ customer base
• Robust underwriting procedure
Superior customer profile
Extensive focus on key growth levers to
maximize long-term value
Factsheet* – Max Bupa
Gross Written Income INR 77 Cr.
Customer Base 355,000+
Number of Employees 1026+
Number of Agents 7,415+
Number of Offices 20
Partner Hospitals 1,350+
* For the Half Year ended September 30, 2012

18
MAX HEALTHCARE (MHC)
www.maxhealthcare.in

19
Indian healthcare industry
poised for exponential growth
Sources: Research on India Report , 2010, Healthcare India Report, Fitch Ratings, 2010, FICCI E&Y Report, 2008
KEY HIGHLIGHTS
• Indian Health Industry is poised to double to USD 125 bn by 2015E, driven by a combination of ageing population, growing
lifestyle diseases and medical insurance penetration as well as increasing ability to afford quality healthcare.
• Realization of latent demand through growth in insurance & consumer education likely to be a key growth driver
• Private hospitals to contribute USD 45 Bn by 2012
• Share of top tier private hospitals (>100 beds) is expected to grow to 40% of the total hospital segment by 2015
• Specialty hospitals are estimated to grow faster than overall industry due to rise in lifestyle diseases
• India needs an investment of USD 86 Bn by 2025 to increase bed density to 2 per 1,000 population
20
14 17 22 32
51 66
84
111
0
20
40
60
80
100
120
FY04 FY05 FY06 FY07 FY08 FY09 FY10 FY11
Rs
bill
ion
Growing Health Insurance Market...
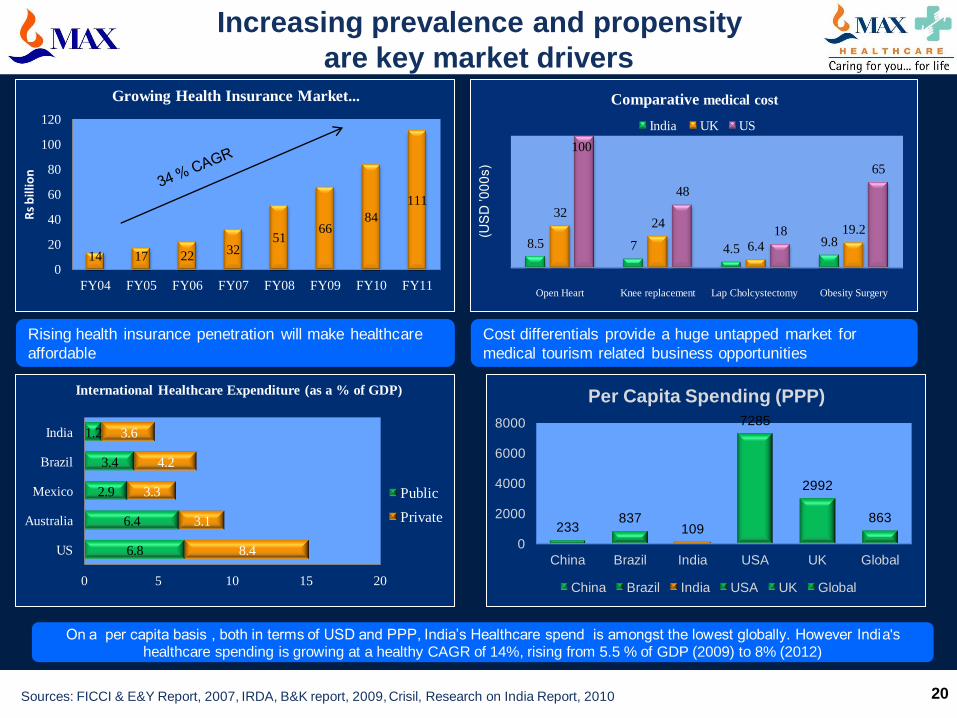
Increasing prevalence and propensity
are key market drivers
Sources: FICCI & E&Y Report, 2007, IRDA, B&K report, 2009, Crisil, Research on India Report, 2010
Rising health insurance penetration will make healthcare
affordable
Cost differentials provide a huge untapped market for
medical tourism related business opportunities
6.8
6.4
2.9
3.4
1.2
8.4
3.1
3.3
4.2
3.6
0 5 10 15 20
US
Australia
Mexico
Brazil
India
International Healthcare Expenditure (as a % of GDP)
Public
Private
8.5 7 4.5 9.8
32 24
6.4
19.2
100
48
18
65
Open Heart Knee replacement Lap Cholcystectomy Obesity Surgery
Comparative medical cost
India UK US
(US
D ’0
00
s)
233 837
109
7285
2992
863
0
2000
4000
6000
8000
China Brazil India USA UK Global
Per Capita Spending (PPP)
China Brazil India USA UK Global
On a per capita basis , both in terms of USD and PPP, India’s Healthcare spend is amongst the lowest globally. However India's healthcare spending is growing at a healthy CAGR of 14%, rising from 5.5 % of GDP (2009) to 8% (2012)
21
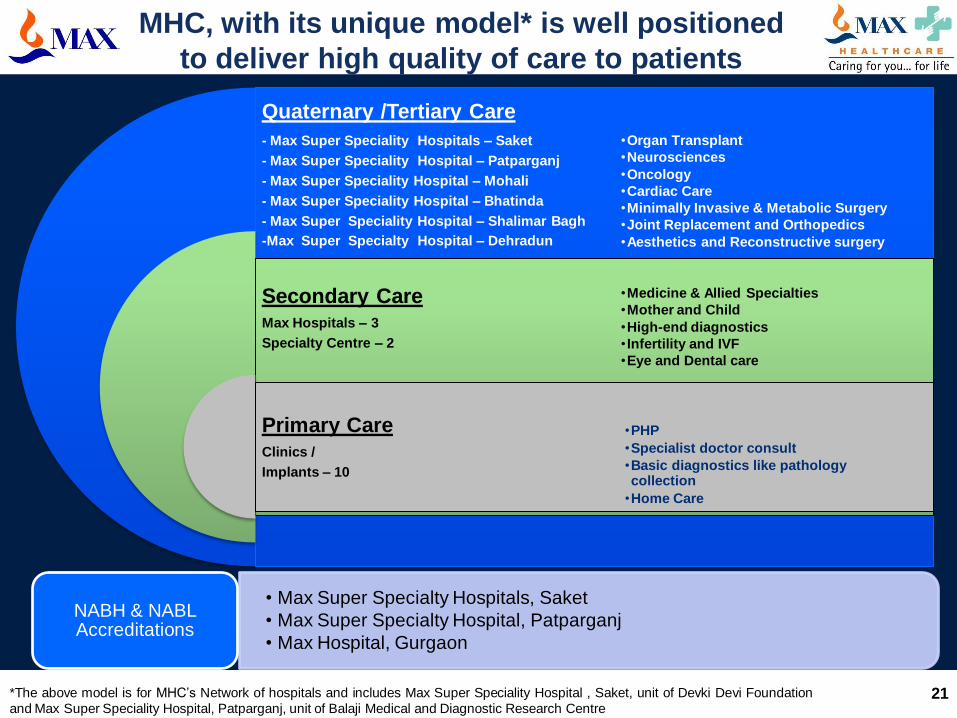
Quaternary /Tertiary Care
- Max Super Speciality Hospitals – Saket
- Max Super Speciality Hospital – Patparganj
- Max Super Speciality Hospital – Mohali
- Max Super Speciality Hospital – Bhatinda
- Max Super Speciality Hospital – Shalimar Bagh
-Max Super Specialty Hospital – Dehradun
Secondary Care Max Hospitals – 3
Specialty Centre – 2
Primary Care Clinics /
Implants – 10
•Organ Transplant
•Neurosciences
•Oncology
•Cardiac Care
•Minimally Invasive & Metabolic Surgery
•Joint Replacement and Orthopedics
•Aesthetics and Reconstructive surgery
•Medicine & Allied Specialties
•Mother and Child
•High-end diagnostics
• Infertility and IVF
•Eye and Dental care
•PHP
•Specialist doctor consult
•Basic diagnostics like pathology collection
•Home Care
• Max Super Specialty Hospitals, Saket
• Max Super Specialty Hospital, Patparganj
• Max Hospital, Gurgaon
NABH & NABL Accreditations
MHC, with its unique model* is well positioned
to deliver high quality of care to patients
*The above model is for MHC’s Network of hospitals and includes Max Super Speciality Hospital , Saket, unit of Devki Devi Foundation
and Max Super Speciality Hospital, Patparganj, unit of Balaji Medical and Diagnostic Research Centre
22
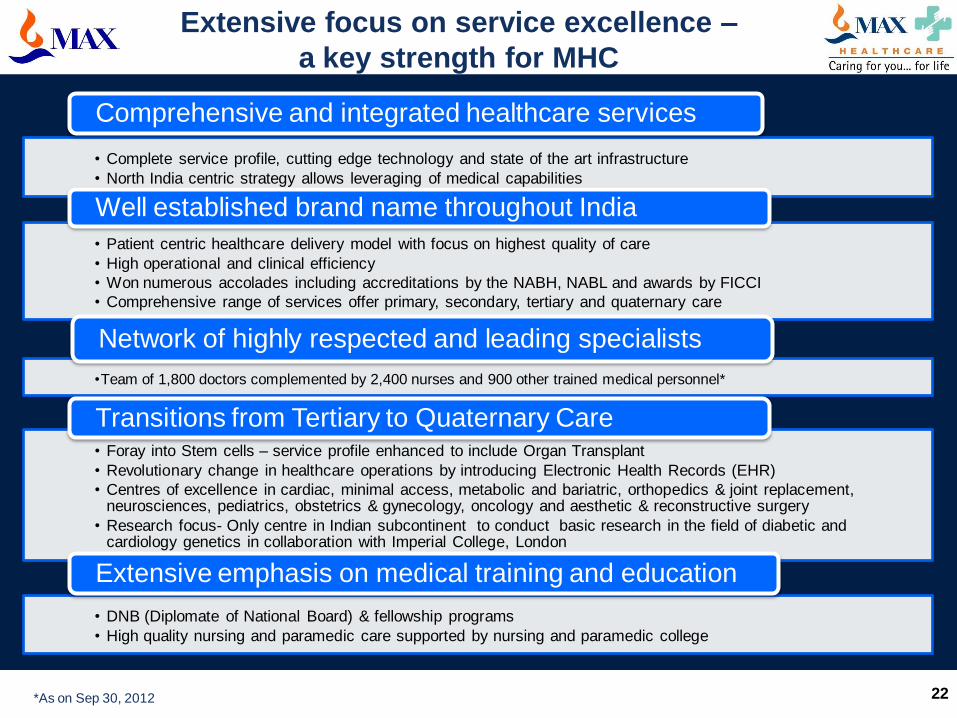
• Complete service profile, cutting edge technology and state of the art infrastructure
• North India centric strategy allows leveraging of medical capabilities
Comprehensive and integrated healthcare services
• Patient centric healthcare delivery model with focus on highest quality of care
• High operational and clinical efficiency
• Won numerous accolades including accreditations by the NABH, NABL and awards by FICCI
• Comprehensive range of services offer primary, secondary, tertiary and quaternary care
Well established brand name throughout India
•Team of 1,800 doctors complemented by 2,400 nurses and 900 other trained medical personnel*
Network of highly respected and leading specialists
• Foray into Stem cells – service profile enhanced to include Organ Transplant
• Revolutionary change in healthcare operations by introducing Electronic Health Records (EHR)
• Centres of excellence in cardiac, minimal access, metabolic and bariatric, orthopedics & joint replacement, neurosciences, pediatrics, obstetrics & gynecology, oncology and aesthetic & reconstructive surgery
• Research focus- Only centre in Indian subcontinent to conduct basic research in the field of diabetic and cardiology genetics in collaboration with Imperial College, London
Transitions from Tertiary to Quaternary Care
• DNB (Diplomate of National Board) & fellowship programs
• High quality nursing and paramedic care supported by nursing and paramedic college
Extensive emphasis on medical training and education
Extensive focus on service excellence –
a key strength for MHC
*As on Sep 30, 2012
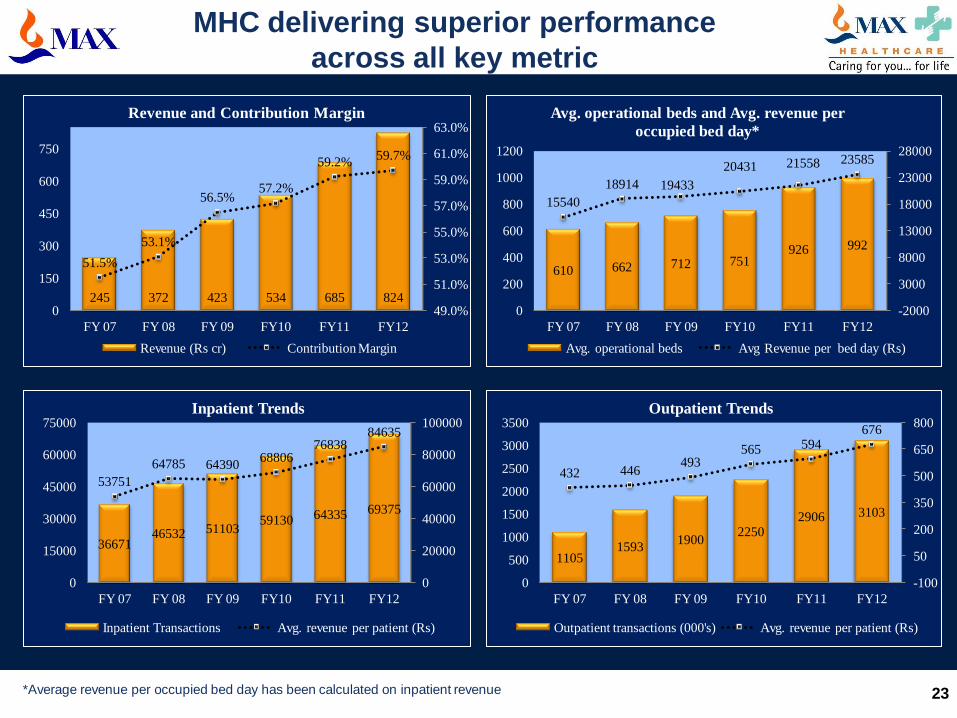
23
245 372 423 534 685 824
51.5%
53.1%
56.5% 57.2%
59.2% 59.7%
49.0%
51.0%
53.0%
55.0%
57.0%
59.0%
61.0%
63.0%
0
150
300
450
600
750
FY 07 FY 08 FY 09 FY10 FY11 FY12
Revenue and Contribution Margin
Revenue (Rs cr) Contribution Margin
MHC delivering superior performance
across all key metric
610 662 712 751 926 992
15540
18914 19433
20431 21558 23585
-2000
3000
8000
13000
18000
23000
28000
0
200
400
600
800
1000
1200
FY 07 FY 08 FY 09 FY10 FY11 FY12
Avg. operational beds and Avg. revenue per
occupied bed day*
Avg. operational beds Avg Revenue per bed day (Rs)
36671 46532 51103
59130 64335 69375
53751
64785 64390 68806
76838 84635
0
20000
40000
60000
80000
100000
0
15000
30000
45000
60000
75000
FY 07 FY 08 FY 09 FY10 FY11 FY12
Inpatient Trends
Inpatient Transactions Avg. revenue per patient (Rs)
1105 1593
1900 2250
2906 3103
432 446 493
565 594 676
-100
50
200
350
500
650
800
0
500
1000
1500
2000
2500
3000
3500
FY 07 FY 08 FY 09 FY10 FY11 FY12
Outpatient Trends
Outpatient transactions (000's) Avg. revenue per patient (Rs)
*Average revenue per occupied bed day has been calculated on inpatient revenue
24
MAX NEEMAN MEDICAL INTERNATIONAL (MNMI)
www.neeman-medical.com

100 120
150 160 175
250
300
0
50
100
150
200
250
300
350
2004 2005 2006 2007 2008 2009E 2010E
US$
Mill
ion
Growth of the Clinical Trial Industry in India
As per FICCI - Ernst and Young Survey Report 2008 and market information
India is one of the fastest growing
clinical research destinations
Key Growth Drivers of Clinical Research in India
• Clinical research trials in India have exhibited a CAGR of 39% between 2004 & 2008
• Large patient population base with genetic and therapeutic diversity
• Cost arbitrage
• Huge talent pool
• Data processing infrastructure for bio-informatics
• Favorable patent regulations
25
199
115
172 137
56
129 157
212
154
243
Ko
rea
Ch
ina
Ind
ia
Ro
ma
nia
Ph
ilip
pin
es
Ta
iwa
n
Hu
ng
ary
Ru
ss
ia
Bra
zil
Po
lan
d
# of industry sponsored trials initiated in 2008
26
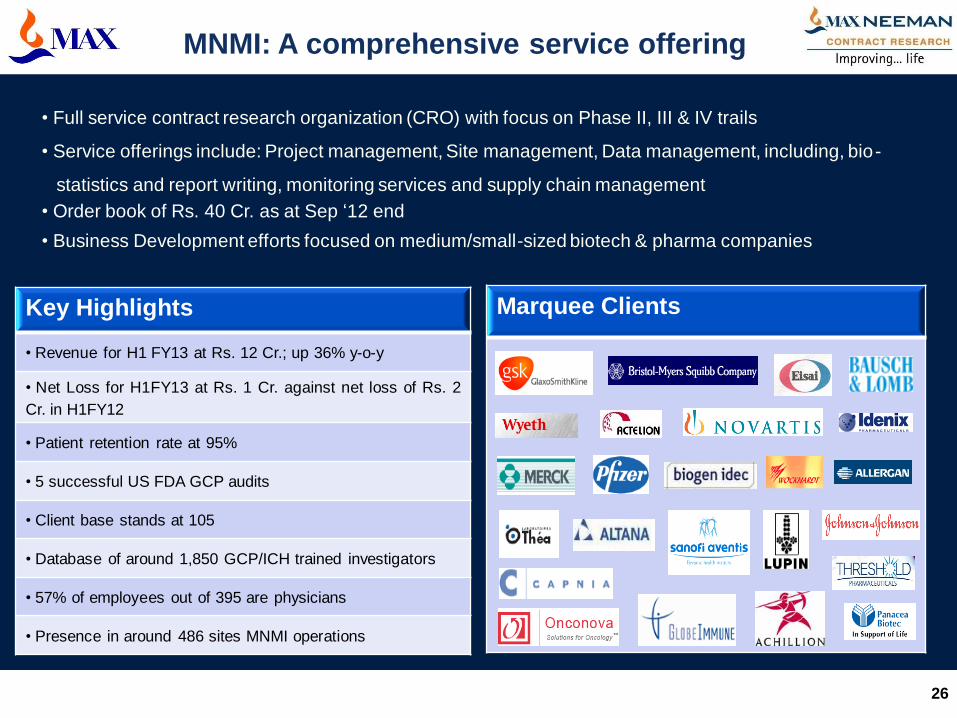
MNMI: A comprehensive service offering
Key Highlights
• Revenue for H1 FY13 at Rs. 12 Cr.; up 36% y-o-y
• Net Loss for H1FY13 at Rs. 1 Cr. against net loss of Rs. 2
Cr. in H1FY12
• Patient retention rate at 95%
• 5 successful US FDA GCP audits
• Client base stands at 105
• Database of around 1,850 GCP/ICH trained investigators
• 57% of employees out of 395 are physicians
• Presence in around 486 sites MNMI operations
Marquee Clients
• Full service contract research organization (CRO) with focus on Phase II, III & IV trails
• Service offerings include: Project management, Site management, Data management, including, bio-
statistics and report writing, monitoring services and supply chain management
• Order book of Rs. 40 Cr. as at Sep ‘12 end
• Business Development efforts focused on medium/small-sized biotech & pharma companies
27
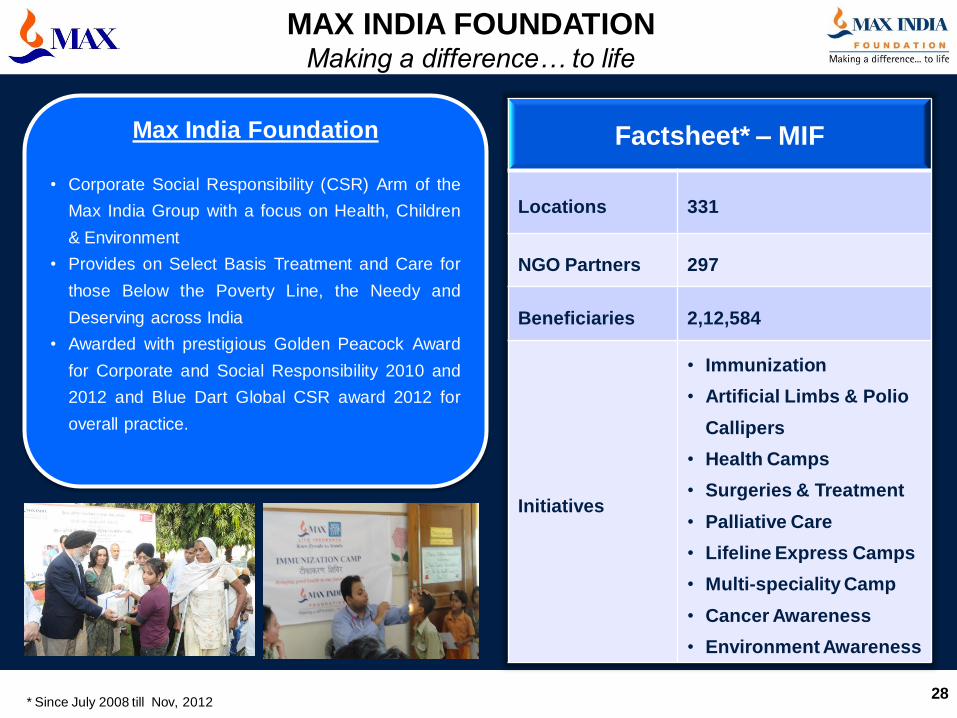
MAX INDIA FOUNDATION (MIF)
www.maxindiafoundation.org
28
MAX INDIA FOUNDATION Making a difference… to life
Factsheet* – MIF
Locations 331
NGO Partners 297
Beneficiaries 2,12,584
Initiatives
• Immunization
• Artificial Limbs & Polio
Callipers
• Health Camps
• Surgeries & Treatment
• Palliative Care
• Lifeline Express Camps
• Multi-speciality Camp
• Cancer Awareness
• Environment Awareness
Max India Foundation
• Corporate Social Responsibility (CSR) Arm of the
Max India Group with a focus on Health, Children
& Environment
• Provides on Select Basis Treatment and Care for
those Below the Poverty Line, the Needy and
Deserving across India
• Awarded with prestigious Golden Peacock Award
for Corporate and Social Responsibility 2010 and
2012 and Blue Dart Global CSR award 2012 for
overall practice.
* Since July 2008 till Nov, 2012
29
Thank You

Excellence
Honesty
Knowledge Caring
Integrity
Teamwork
Road Map to Becoming India’s Most Admired
Life Insurance Company
Key Public Messages
A trusted life insurance specialist
Customer centric
Financially responsible and strong
A great place to work
An admired member of the community
VISION Become the most admired Life Insurance Company in India
MISSION
KEY
OBJECTIVES
STRATEGIES
WHAT –Comprehensive suite ofproducts, competitive pricing, extensive distribution,
persistency, customer service excellence,
profitable portfolios
HOW –TalentedPeople, Professional & Productive Agents, Performance Metrics, Leverage Technology, Teamwork,
Customer Centric, Innovative Distribution and Marketing
INITIATIVES What-When-Who-How-Cost linkage plans at Departmental and Individual levels
VALUES & BELIEFS OPERATING PRINCIPLES METRICS &
STANDARDS
PERFORMANCE
MGMT PROCESS Customer comes first International quality standards
Do it right the first time
Fact based decisions Bias for result oriented action
Financial strength & discipline
Direct and open communication Respect Max & NYLI values & parentage
Fun at work
Input Output
External
Internal Absolute
Ratios
GMPR Ratings TEC/TTR – Templates
Primary, Shared and
Contributory Balanced scorecard
Core, Functional and
Leadership Competencies
Part of top quartile new Life Insurance Companies
National Player
Brand of FIRST choice Employer of Choice
Principal of Choice for Agents Key Differentiators
Financial Strength & Security
Quality of agents
Flexible Products
Service Excellence
Fair Terms of Business
30
31
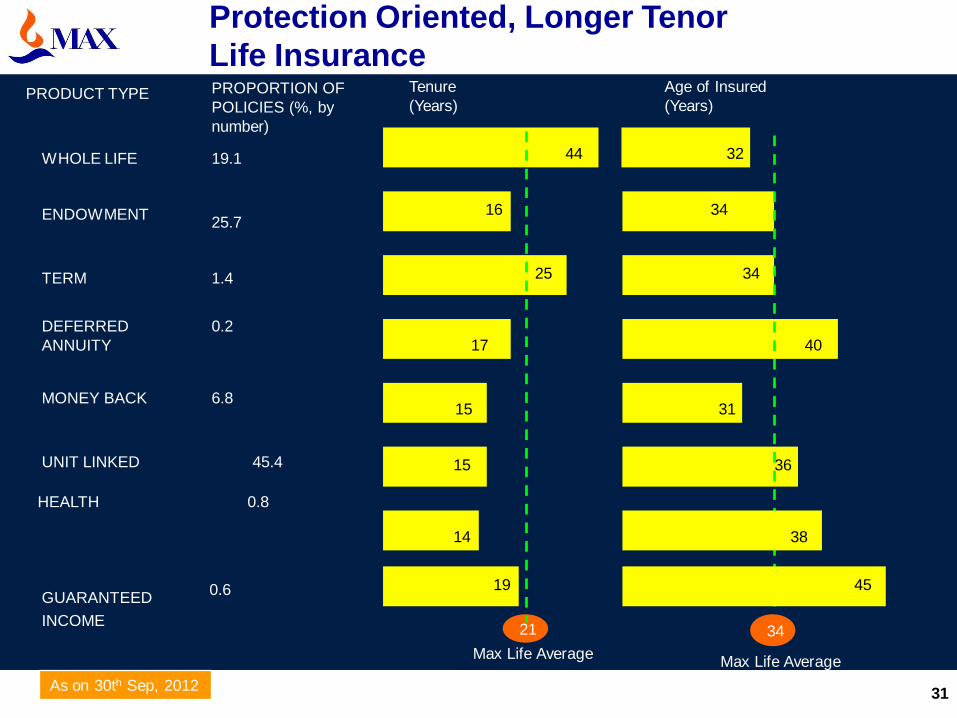
Protection Oriented, Longer Tenor
Life Insurance
34
34
32
0.2
DEFERRED
ANNUITY
6.8 MONEY BACK
UNIT LINKED 45.4
1.4 TERM
19.1 WHOLE LIFE
PROPORTION OF
POLICIES (%, by
number)
PRODUCT TYPE Tenure
(Years)
Age of Insured
(Years)
21 34
Max Life Average Max Life Average
17
25
44
31
36 15
15
40
ENDOWMENT 25.7
16
As on 30th Sep, 2012
HEALTH 0.8
14 38
GUARANTEED
INCOME
0.6
45 19

32
S. No. Company Individual New Business Premium (Rs. Cr)
Premium Adjusted for 10% single premium
YTD Sep ‘12 YTD Sep ‘11 Growth (%) Market Share
1 ICICI Prudential 1,224 1,029 19% 18.3%
2 HDFC Life 1,139 1,035 10% 17.0%
3 SBI Life 711 754 -6% 10.6%
4 Max Life 633 670 -6% 9.5%
5 Bajaj Allianz 427 487 -12% 6.4%
6 Birla Sunlife 421 523 -20% 6.3%
7 Reliance Life 410 454 -10% 6.1%
8 Metlife 242 162 49% 3.6%
9 ING Vysya 209 255 -18% 3.1%
10 Canara HSBC OBC 196 229 -15% 2.9%
Others 1,086 1,272 -15%
Private Total 6,698 6,871 -3%
LIC 13,931 10,383 34%
Grand Total 20,629 17,254 20%
Market Share of Pvt.
Players 32.5% 39.8%
Market Position Insurance Sales
Source: IRDA website

33
Amount in Rs. Crore
Value of New
Business
Opening EV
Unwind of
Discount
Other
Operating
Variance
Non
Operating
Variance
Closing EV
Denotes decrease to EV
Denotes increase to EV
419
168
76 93
3,216
Cost
Overrun*
102
* Cost Over-run includes over-runs that are relevant to Embedded Value
**VNB includes shareholders’ interest in the residual estate from participating business aggregating Rs. 24 Cr. Implied NBM is on a structural basis.
***APE – Adjusted Premium Equivalent (Annualized First Year Premium adjusted for 10% of Single Premium & 50% of Limited Pay Products)
Net Worth
Value of In-force business
3,684
Implied NBM** is
17.8% on APE*
(19.5% in 2010-11)
2,075
1,141 1,711
1,973
Max Life – Embedded Value
March 31, 2012
34
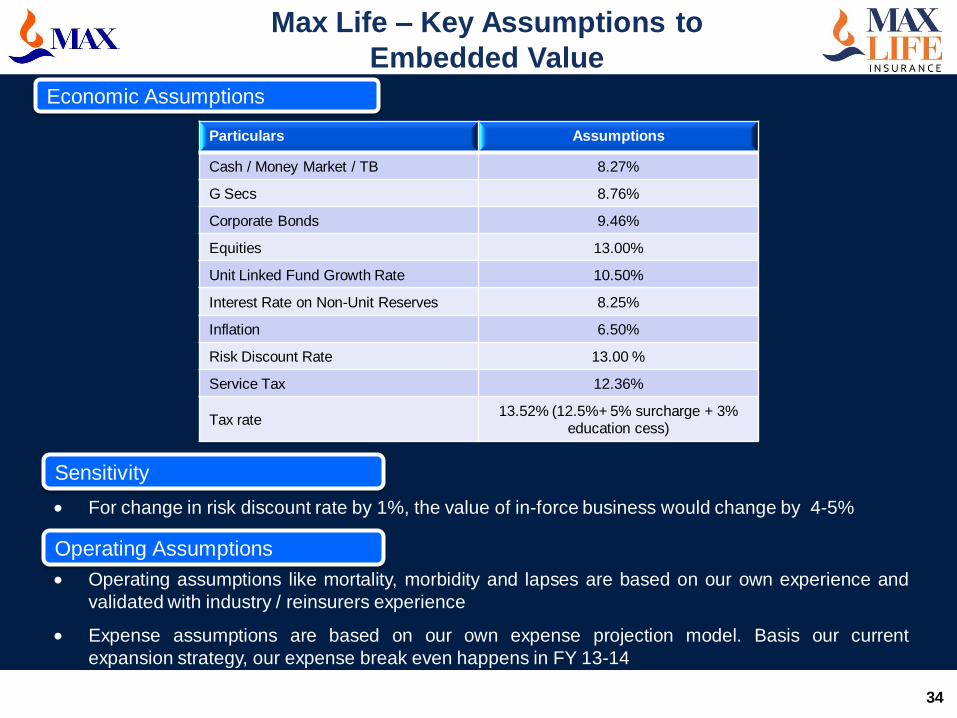
For change in risk discount rate by 1%, the value of in-force business would change by 4-5%
Operating assumptions like mortality, morbidity and lapses are based on our own experience and
validated with industry / reinsurers experience
Expense assumptions are based on our own expense projection model. Basis our current
expansion strategy, our expense break even happens in FY 13-14
Max Life – Key Assumptions to
Embedded Value
Economic Assumptions
Sensitivity
Operating Assumptions
Particulars Assumptions
Cash / Money Market / TB 8.27%
G Secs 8.76%
Corporate Bonds 9.46%
Equities 13.00%
Unit Linked Fund Growth Rate 10.50%
Interest Rate on Non-Unit Reserves 8.25%
Inflation 6.50%
Risk Discount Rate 13.00 %
Service Tax 12.36%
Tax rate 13.52% (12.5%+ 5% surcharge + 3%
education cess)

Max Life – Basis of Preparations
for Embedded Value
Max Life’s EV guided by European Embedded Value principles
“Top down” allowance for risk including allowance for time value of financial
options and guarantees
Explicit allowance for cost of capital where capital is the higher of the required
solvency margin and internal capital requirements
Actuarial assumptions based on past experience and on management’s views of
future trends in experience
Results not audited nor subject to external review but the EV methodology is in
line with accepted international practices
35
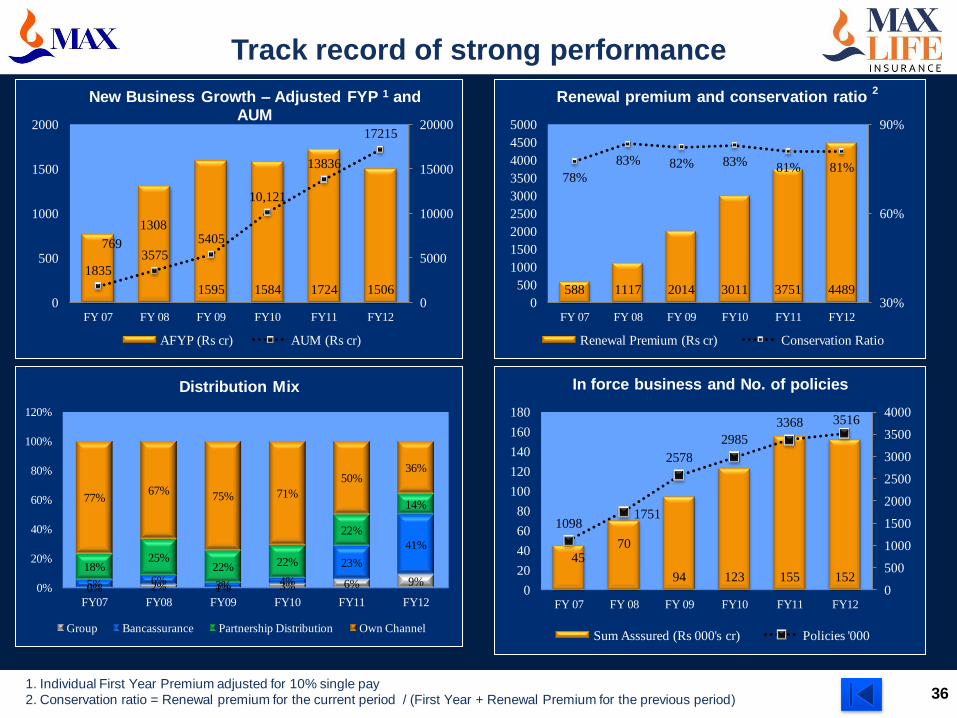
36
769
1308
1595 1584 1724 1506
1835
3575
5405
10,121
13836
17215
0
5000
10000
15000
20000
0
500
1000
1500
2000
FY 07 FY 08 FY 09 FY10 FY11 FY12
New Business Growth – Adjusted FYP 1 and AUM
AFYP (Rs cr) AUM (Rs cr)
Track record of strong performance
588 1117 2014 3011 3751 4489
78%
83% 82% 83% 81% 81%
30%
60%
90%
0
500
1000
1500
2000
2500
3000
3500
4000
4500
5000
FY 07 FY 08 FY 09 FY10 FY11 FY12
Renewal premium and conservation ratio 2
Renewal Premium (Rs cr) Conservation Ratio
45 70
94 123 155 152
1098 1751
2578
2985
3368 3516
0
500
1000
1500
2000
2500
3000
3500
4000
0
20
40
60
80
100
120
140
160
180
FY 07 FY 08 FY 09 FY10 FY11 FY12
In force business and No. of policies
Sum Asssured (Rs 000's cr) Policies '000
1. Individual First Year Premium adjusted for 10% single pay
2. Conservation ratio = Renewal premium for the current period / (First Year + Renewal Premium for the previous period)
0% 2% 1% 3% 6% 9% 5% 6% 3% 4%
23%
41%
18% 25%
22% 22%
22%
14% 77%
67% 75% 71%
50% 36%
0%
20%
40%
60%
80%
100%
120%
FY07 FY08 FY09 FY10 FY11 FY12
Distribution Mix
Group Bancassurance Partnership Distribution Own Channel
*Individual First Year Premium adjusted for 10% single pay
**Conservation Ratio = Renewal Premium for the current period / (First Year + Renewal Premium for the previous period)
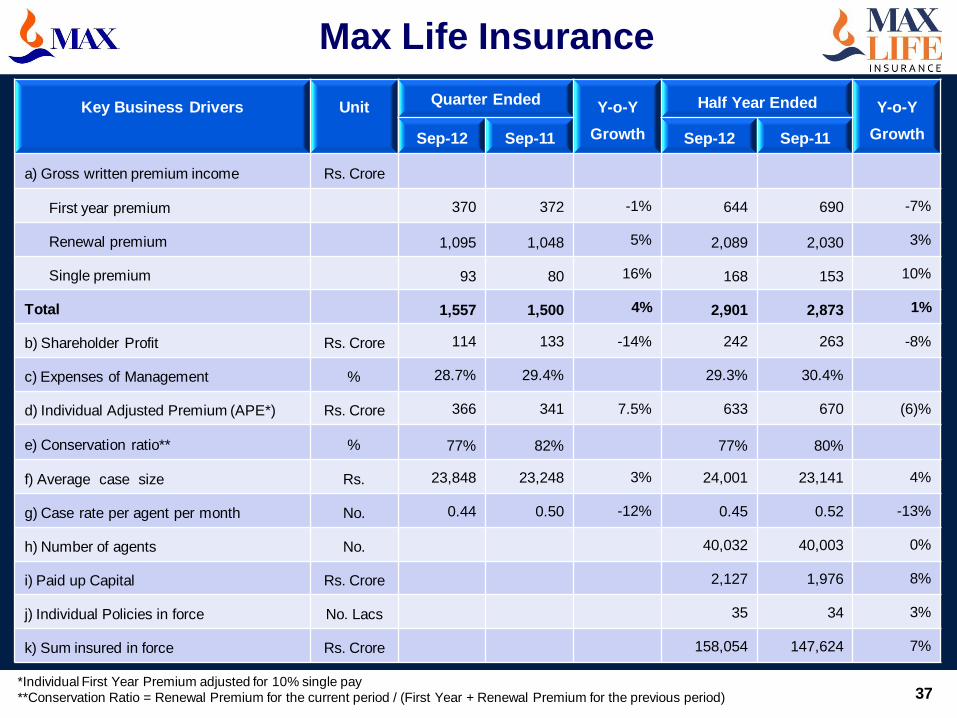
Max Life Insurance
37
Key Business Drivers
Unit
Quarter Ended Y-o-Y
Growth
Half Year Ended Y-o-Y
Growth Sep-12 Sep-11 Sep-12 Sep-11
a) Gross written premium income Rs. Crore
First year premium 370 372 -1% 644 690 -7%
Renewal premium 1,095 1,048 5% 2,089 2,030 3%
Single premium 93 80 16% 168 153 10%
Total 1,557 1,500 4% 2,901 2,873 1%
b) Shareholder Profit Rs. Crore 114 133 -14% 242 263 -8%
c) Expenses of Management % 28.7% 29.4% 29.3% 30.4%
d) Individual Adjusted Premium (APE*) Rs. Crore 366 341 7.5% 633 670 (6)%
e) Conservation ratio** % 77% 82% 77% 80%
f) Average case size Rs. 23,848 23,248 3% 24,001 23,141 4%
g) Case rate per agent per month No. 0.44 0.50 -12% 0.45 0.52 -13%
h) Number of agents No. 40,032 40,003 0%
i) Paid up Capital Rs. Crore 2,127 1,976 8%
j) Individual Policies in force No. Lacs 35 34 3%
k) Sum insured in force Rs. Crore 158,054 147,624 7%
38
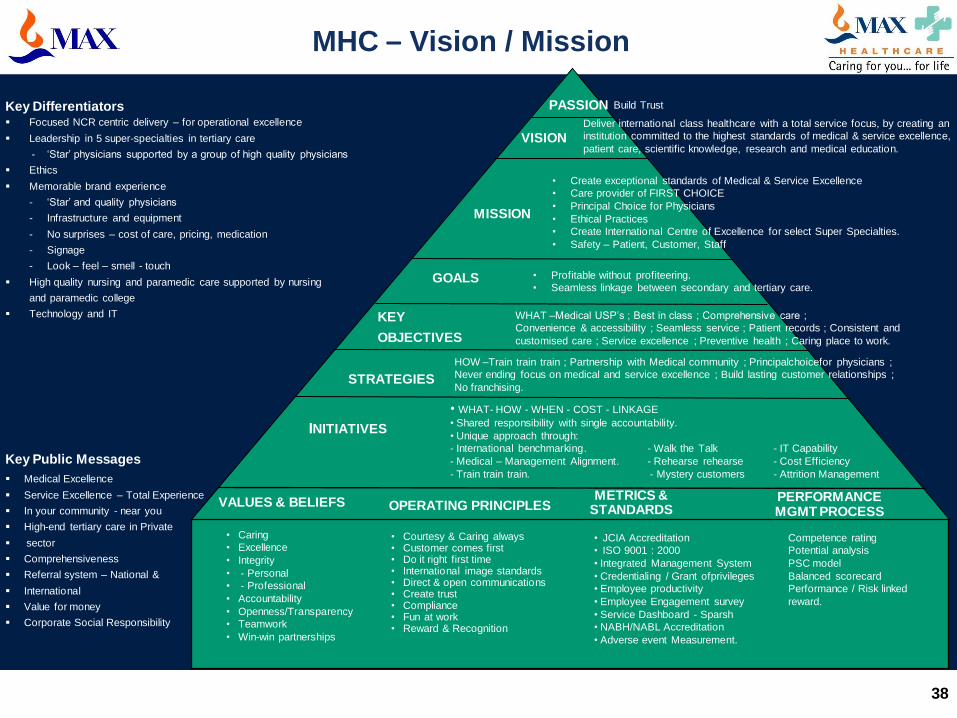
VISION Deliver international class healthcare with a total service focus, by creating an
institution committed to the highest standards of medical & service excellence,
patient care, scientific knowledge, research and medical education.
MISSION
GOALS • Profitable without profiteering.
• Seamless linkage between secondary and tertiary care.
KEY
OBJECTIVES
STRATEGIES
WHAT –Medical USP’s ; Best in class ; Comprehensive care ;
Convenience & accessibility ; Seamless service ; Patient records ; Consistent and
customised care ; Service excellence ; Preventive health ; Caring place to work.
HOW –Train train train ; Partnership with Medical community ; Principalchoicefor physicians ;
Never ending focus on medical and service excellence ; Build lasting customer relationships ;
No franchising.
VALUES & BELIEFS OPERATING PRINCIPLES METRICS &
STANDARDS PERFORMANCE MGMT PROCESS
• Create exceptional standards of Medical & Service Excellence
• Care provider of FIRST CHOICE
• Principal Choice for Physicians
• Ethical Practices
• Create International Centre of Excellence for select Super Specialties.
• Safety – Patient, Customer, Staff
• Competence rating
• Potential analysis
• PSC model
• Balanced scorecard
• Performance / Risk linked
reward.
• Caring
• Excellence
• Integrity
• - Personal
• - Professional
• Accountability
• Openness/Transparency
• Teamwork
• Win-win partnerships
• Courtesy & Caring always • Customer comes first • Do it right first time • International image standards • Direct & open communications • Create trust • Compliance • Fun at work • Reward & Recognition
• JCIA Accreditation
• ISO 9001 : 2000
• Integrated Management System
• Credentialing / Grant ofprivileges
• Employee productivity
• Employee Engagement survey
• Service Dashboard - Sparsh
• NABH/NABL Accreditation
• Adverse event Measurement.
INITIATIVES
• WHAT- HOW - WHEN - COST - LINKAGE
• Shared responsibility with single accountability.
• Unique approach through:
- International benchmarking. - Walk the Talk - IT Capability
- Medical – Management Alignment. - Rehearse rehearse - Cost Efficiency
- Train train train. - Mystery customers - Attrition Management
MHC – Vision / Mission
Build Trust PASSION Key Differentiators Focused NCR centric delivery – for operational excellence
Leadership in 5 super-specialties in tertiary care
- ‘Star’ physicians supported by a group of high quality physicians
Ethics
Memorable brand experience
- ‘Star’ and quality physicians
- Infrastructure and equipment
- No surprises – cost of care, pricing, medication
- Signage
- Look – feel – smell - touch
High quality nursing and paramedic care supported by nursing
and paramedic college
Technology and IT
Key Public Messages
Medical Excellence
Service Excellence – Total Experience
In your community - near you
High-end tertiary care in Private
sector
Comprehensiveness
Referral system – National &
International
Value for money
Corporate Social Responsibility
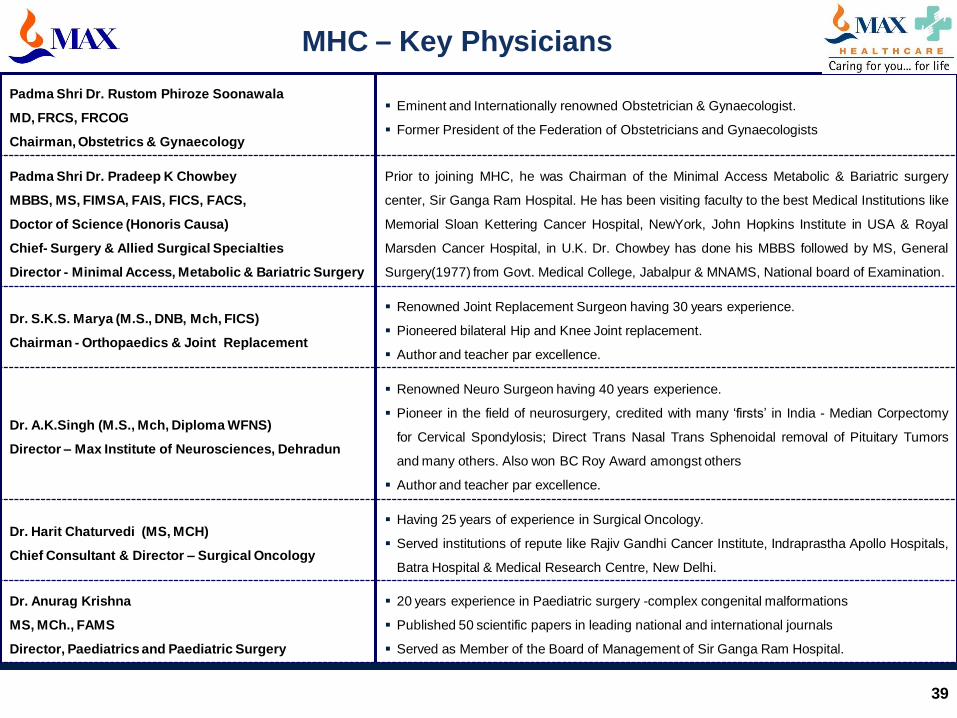
Padma Shri Dr. Rustom Phiroze Soonawala
MD, FRCS, FRCOG
Chairman, Obstetrics & Gynaecology
Eminent and Internationally renowned Obstetrician & Gynaecologist.
Former President of the Federation of Obstetricians and Gynaecologists
Padma Shri Dr. Pradeep K Chowbey
MBBS, MS, FIMSA, FAIS, FICS, FACS,
Doctor of Science (Honoris Causa)
Chief- Surgery & Allied Surgical Specialties
Director - Minimal Access, Metabolic & Bariatric Surgery
Prior to joining MHC, he was Chairman of the Minimal Access Metabolic & Bariatric surgery
center, Sir Ganga Ram Hospital. He has been visiting faculty to the best Medical Institutions like
Memorial Sloan Kettering Cancer Hospital, NewYork, John Hopkins Institute in USA & Royal
Marsden Cancer Hospital, in U.K. Dr. Chowbey has done his MBBS followed by MS, General
Surgery(1977) from Govt. Medical College, Jabalpur & MNAMS, National board of Examination.
Dr. S.K.S. Marya (M.S., DNB, Mch, FICS)
Chairman - Orthopaedics & Joint Replacement
Renowned Joint Replacement Surgeon having 30 years experience.
Pioneered bilateral Hip and Knee Joint replacement.
Author and teacher par excellence.
Dr. A.K.Singh (M.S., Mch, Diploma WFNS)
Director – Max Institute of Neurosciences, Dehradun
Renowned Neuro Surgeon having 40 years experience.
Pioneer in the field of neurosurgery, credited with many ‘firsts’ in India - Median Corpectomy
for Cervical Spondylosis; Direct Trans Nasal Trans Sphenoidal removal of Pituitary Tumors
and many others. Also won BC Roy Award amongst others
Author and teacher par excellence.
Dr. Harit Chaturvedi (MS, MCH)
Chief Consultant & Director – Surgical Oncology
Having 25 years of experience in Surgical Oncology.
Served institutions of repute like Rajiv Gandhi Cancer Institute, Indraprastha Apollo Hospitals,
Batra Hospital & Medical Research Centre, New Delhi.
Dr. Anurag Krishna
MS, MCh., FAMS
Director, Paediatrics and Paediatric Surgery
20 years experience in Paediatric surgery -complex congenital malformations
Published 50 scientific papers in leading national and international journals
Served as Member of the Board of Management of Sir Ganga Ram Hospital.
39
MHC – Key Physicians
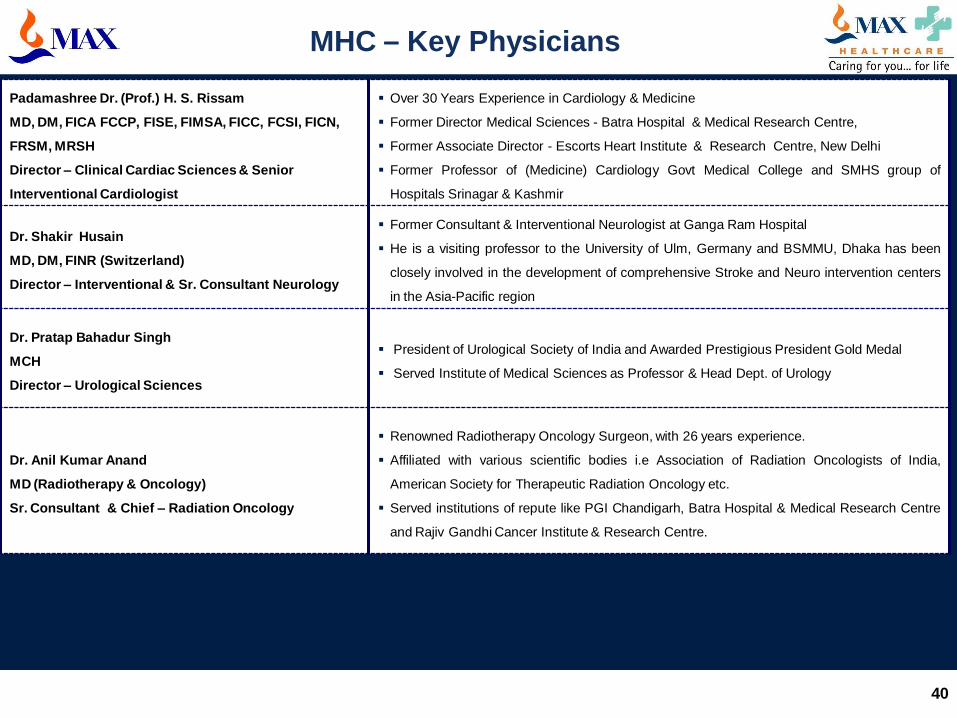
Padamashree Dr. (Prof.) H. S. Rissam
MD, DM, FICA FCCP, FISE, FIMSA, FICC, FCSI, FICN,
FRSM, MRSH
Director – Clinical Cardiac Sciences & Senior
Interventional Cardiologist
Over 30 Years Experience in Cardiology & Medicine
Former Director Medical Sciences - Batra Hospital & Medical Research Centre,
Former Associate Director - Escorts Heart Institute & Research Centre, New Delhi
Former Professor of (Medicine) Cardiology Govt Medical College and SMHS group of
Hospitals Srinagar & Kashmir
Dr. Shakir Husain
MD, DM, FINR (Switzerland)
Director – Interventional & Sr. Consultant Neurology
Former Consultant & Interventional Neurologist at Ganga Ram Hospital
He is a visiting professor to the University of Ulm, Germany and BSMMU, Dhaka has been
closely involved in the development of comprehensive Stroke and Neuro intervention centers
in the Asia-Pacific region
Dr. Pratap Bahadur Singh
MCH
Director – Urological Sciences
President of Urological Society of India and Awarded Prestigious President Gold Medal
Served Institute of Medical Sciences as Professor & Head Dept. of Urology
Dr. Anil Kumar Anand
MD (Radiotherapy & Oncology)
Sr. Consultant & Chief – Radiation Oncology
Renowned Radiotherapy Oncology Surgeon, with 26 years experience.
Affiliated with various scientific bodies i.e Association of Radiation Oncologists of India,
American Society for Therapeutic Radiation Oncology etc.
Served institutions of repute like PGI Chandigarh, Batra Hospital & Medical Research Centre
and Rajiv Gandhi Cancer Institute & Research Centre.
40
MHC – Key Physicians

41
FICCI Healthcare Excellence Awards (2010)
MHC – Accreditations and Awards
First in North India to get
NABH for MHVI & MSSH
ISO 14001:2004 at Pitampura
ISO 9001:2008 Recertification at
Max Heart & Vascular Institute,
Noida, Pitampura, Panchsheel
Park &Home Office
India International
Achiever Award
“MSSH, Saket has been awarded for Operational
Excellence in Healthcare Delivery and MSSH PPG
has been awarded for Excellence in Environment
Conservation.
CII – IGBC (Indian Green Building Council);
MHC receives LEED – GOLD Certification for
PPG II
Express Healthcare Excellence
Awards (2007 – 08)
“Best Managed
Healthcare
Program
(Health
Insurance/TPA)”
DL Shah National
Award
for Economics of
Quality: Feb 2009 “Innovative Marketing
Practices”
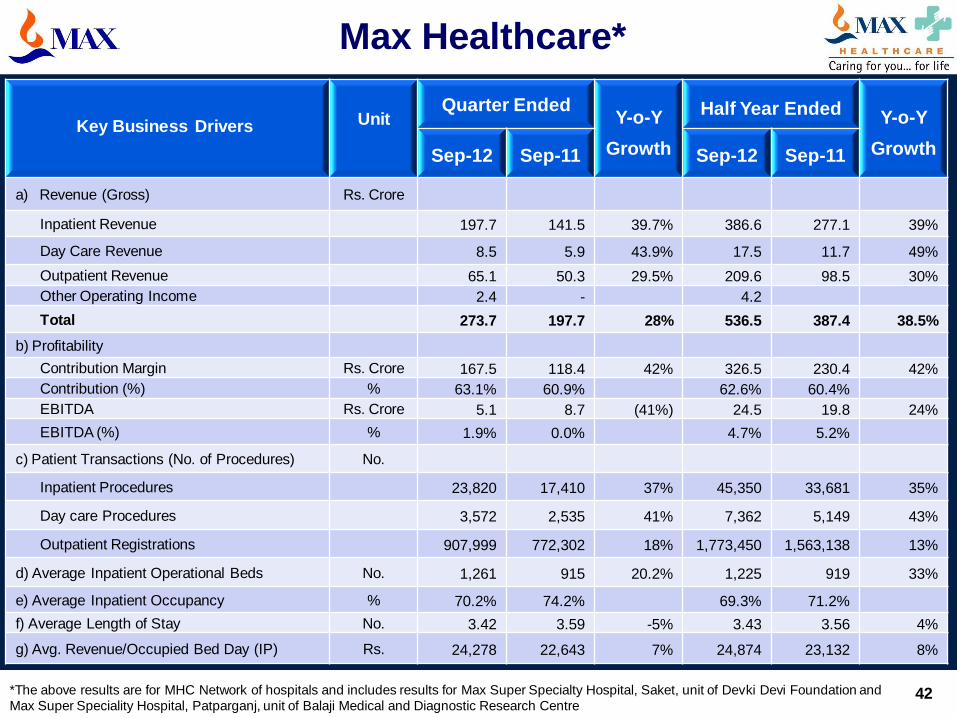
Max Healthcare*
42 *The above results are for MHC Network of hospitals and includes results for Max Super Specialty Hospital, Saket, unit of Devki Devi Foundation and
Max Super Speciality Hospital, Patparganj, unit of Balaji Medical and Diagnostic Research Centre
Key Business Drivers Unit
Quarter Ended Y-o-Y
Growth
Half Year Ended Y-o-Y
Growth Sep-12 Sep-11 Sep-12 Sep-11
a) Revenue (Gross) Rs. Crore
Inpatient Revenue 197.7 141.5 39.7% 386.6 277.1 39%
Day Care Revenue 8.5 5.9 43.9% 17.5 11.7 49%
Outpatient Revenue 65.1 50.3 29.5% 209.6 98.5 30%
Other Operating Income 2.4 - 4.2
Total 273.7 197.7 28% 536.5 387.4 38.5%
b) Profitability
Contribution Margin Rs. Crore 167.5 118.4 42% 326.5 230.4 42%
Contribution (%) % 63.1% 60.9% 62.6% 60.4%
EBITDA Rs. Crore 5.1 8.7 (41%) 24.5 19.8 24%
EBITDA (%) % 1.9% 0.0% 4.7% 5.2%
c) Patient Transactions (No. of Procedures) No.
Inpatient Procedures 23,820 17,410 37% 45,350 33,681 35%
Day care Procedures 3,572 2,535 41% 7,362 5,149 43%
Outpatient Registrations 907,999 772,302 18% 1,773,450 1,563,138 13%
d) Average Inpatient Operational Beds No. 1,261 915 20.2% 1,225 919 33%
e) Average Inpatient Occupancy % 70.2% 74.2% 69.3% 71.2%
f) Average Length of Stay No. 3.42 3.59 -5% 3.43 3.56 4%
g) Avg. Revenue/Occupied Bed Day (IP) Rs. 24,278 22,643 7% 24,874 23,132 8%
43
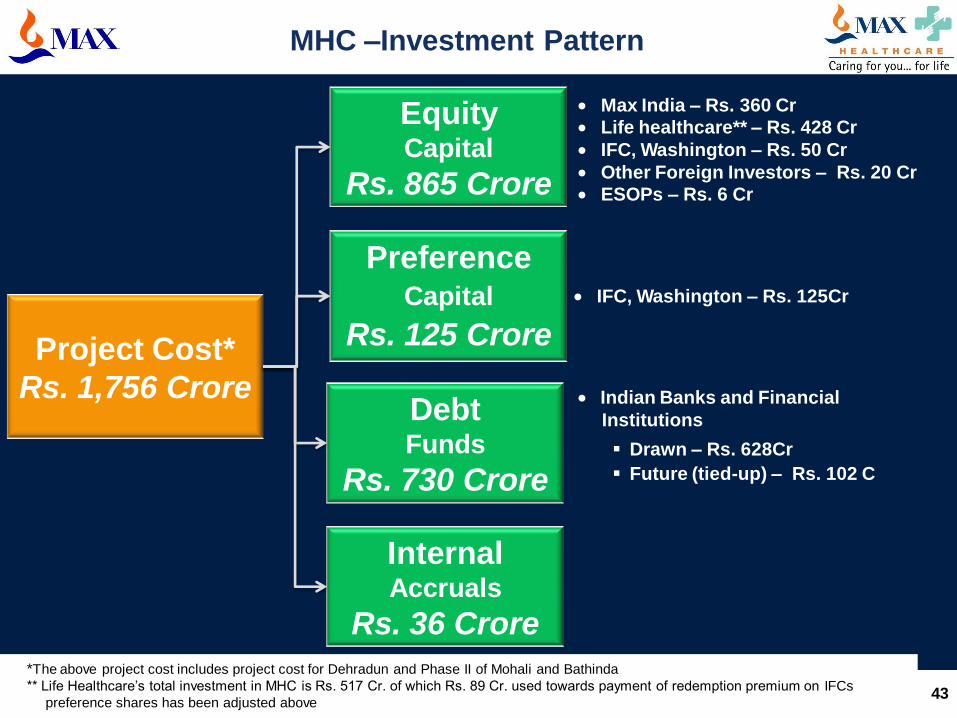
MHC –Investment Pattern
Project Cost*
Rs. 1,756 Crore
Equity Capital
Rs. 865 Crore
Preference Capital
Rs. 125 Crore
Max India – Rs. 360 Cr
Life healthcare** – Rs. 428 Cr
IFC, Washington – Rs. 50 Cr
Other Foreign Investors – Rs. 20 Cr
ESOPs – Rs. 6 Cr
Indian Banks and Financial
Institutions
Drawn – Rs. 628Cr
Future (tied-up) – Rs. 102 C
Debt Funds
Rs. 730 Crore
IFC, Washington – Rs. 125Cr
*The above project cost includes project cost for Dehradun and Phase II of Mohali and Bathinda
** Life Healthcare’s total investment in MHC is Rs. 517 Cr. of which Rs. 89 Cr. used towards payment of redemption premium on IFCs
preference shares has been adjusted above
Internal Accruals
Rs. 36 Crore
44
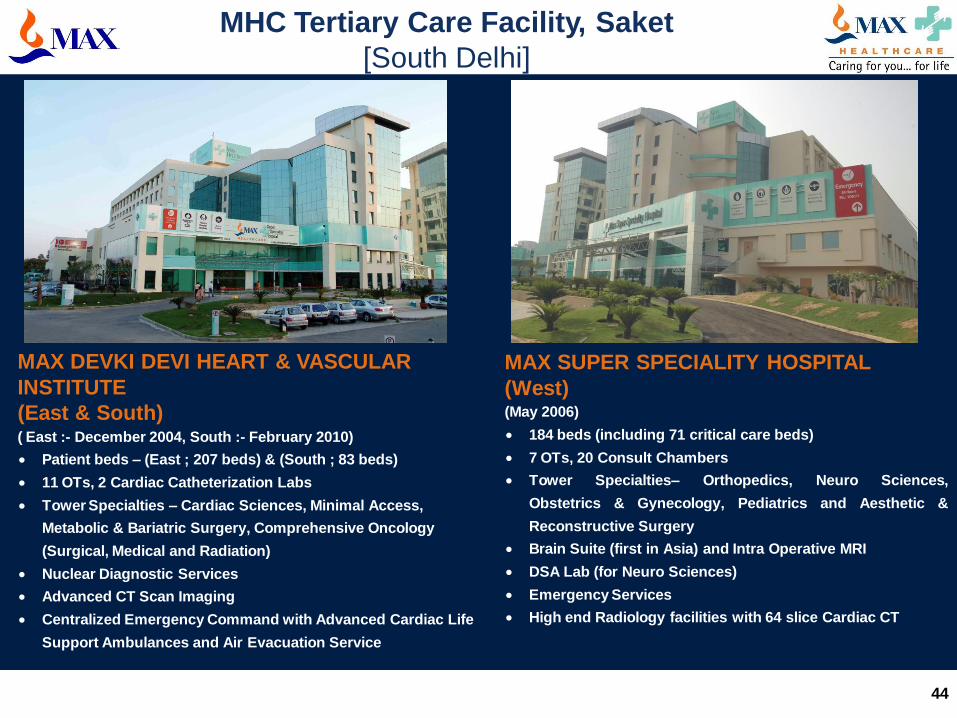
MAX DEVKI DEVI HEART & VASCULAR
INSTITUTE
(East & South) ( East :- December 2004, South :- February 2010)
Patient beds – (East ; 207 beds) & (South ; 83 beds)
11 OTs, 2 Cardiac Catheterization Labs
Tower Specialties – Cardiac Sciences, Minimal Access,
Metabolic & Bariatric Surgery, Comprehensive Oncology
(Surgical, Medical and Radiation)
Nuclear Diagnostic Services
Advanced CT Scan Imaging
Centralized Emergency Command with Advanced Cardiac Life
Support Ambulances and Air Evacuation Service
MAX SUPER SPECIALITY HOSPITAL
(West) (May 2006)
184 beds (including 71 critical care beds)
7 OTs, 20 Consult Chambers
Tower Specialties– Orthopedics, Neuro Sciences,
Obstetrics & Gynecology, Pediatrics and Aesthetic &
Reconstructive Surgery
Brain Suite (first in Asia) and Intra Operative MRI
DSA Lab (for Neuro Sciences)
Emergency Services
High end Radiology facilities with 64 slice Cardiac CT
MHC Tertiary Care Facility, Saket
[South Delhi]
45
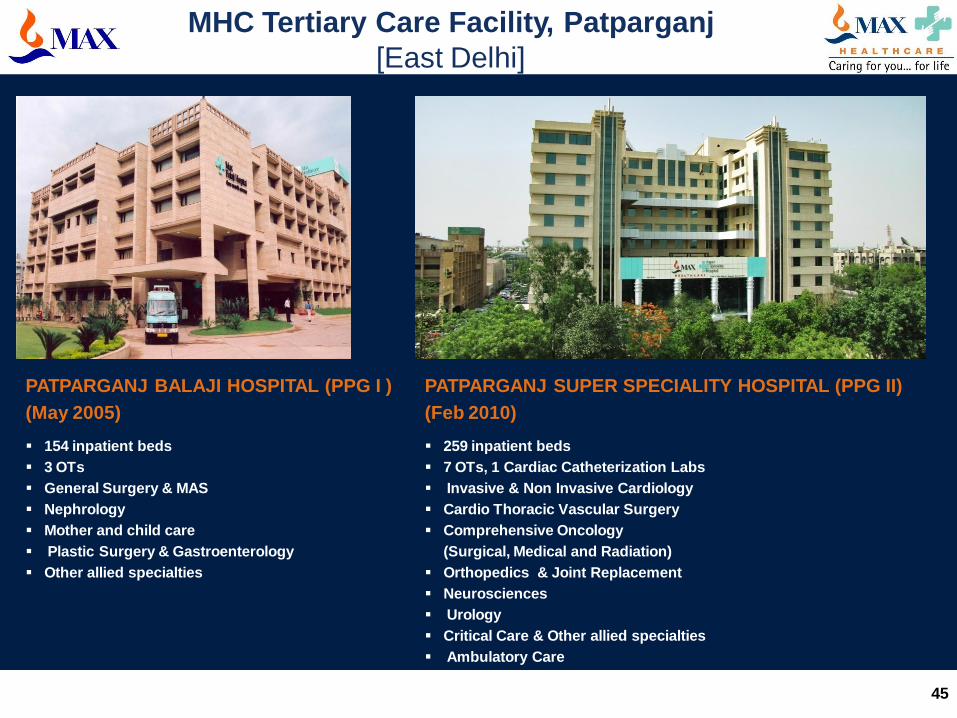
PATPARGANJ BALAJI HOSPITAL (PPG I )
(May 2005)
154 inpatient beds
3 OTs
General Surgery & MAS
Nephrology
Mother and child care
Plastic Surgery & Gastroenterology
Other allied specialties
PATPARGANJ SUPER SPECIALITY HOSPITAL (PPG II)
(Feb 2010)
259 inpatient beds
7 OTs, 1 Cardiac Catheterization Labs
Invasive & Non Invasive Cardiology
Cardio Thoracic Vascular Surgery
Comprehensive Oncology
(Surgical, Medical and Radiation)
Orthopedics & Joint Replacement
Neurosciences
Urology
Critical Care & Other allied specialties
Ambulatory Care
MHC Tertiary Care Facility, Patparganj
[East Delhi]

46
MHC Tertiary Care Facility
[ North India]
Mohali
(September 2011)
142 inpatient beds and 45 Critical Care Beds
5 OTs
Oncology
Cardiac Sciences
Orthopedics
Neuroscience
Mother and Child Care
Urology
ENT & Dialysis
Plastic and Reconstructive Surgery
Dentistry & Day Care
Bhatinda
(September 2011)
141 inpatient beds and 42 Critical Care Beds
5 OTs
Oncology
Cardiac Sciences
Orthopedics
Neuroscience
Mother and Child Care
Urology
ENT & Dialysis
Plastic and Reconstructive Surgery
Dentistry & Day Care

47
Shalimar Bagh
(November 2011)
196 inpatient beds and 80 Critical Care
7 OTs
Cardiology , Cathlab and Oncology
Orthopedics and Neuroscience
Mother and Child Care and Urology
ENT and Dialysis
Plastic Surgery and Reconstructive
Dentistry & Day Care
Ophthalmology
Dehradun
(May 2012)
166 inpatient beds and 39 Critical Care
4OTs
Neurosciences
Cardiac Care
Orthopedics
Mother and Child
Internal Medicine
General Surgery
ENT and Dialysis
Eye & Dental Care
MHC Tertiary Care Facility
[ North India]
48
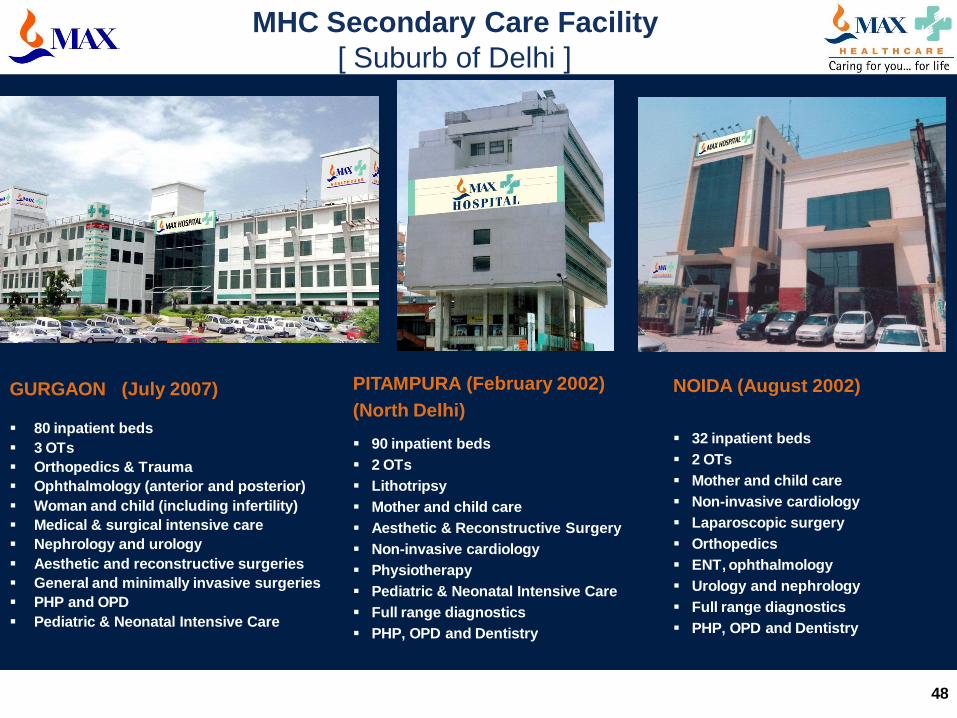
MHC Secondary Care Facility
[ Suburb of Delhi ]
NOIDA (August 2002)
32 inpatient beds
2 OTs
Mother and child care
Non-invasive cardiology
Laparoscopic surgery
Orthopedics
ENT, ophthalmology
Urology and nephrology
Full range diagnostics
PHP, OPD and Dentistry
GURGAON (July 2007)
80 inpatient beds
3 OTs
Orthopedics & Trauma
Ophthalmology (anterior and posterior)
Woman and child (including infertility)
Medical & surgical intensive care
Nephrology and urology
Aesthetic and reconstructive surgeries
General and minimally invasive surgeries
PHP and OPD
Pediatric & Neonatal Intensive Care
PITAMPURA (February 2002)
(North Delhi)
90 inpatient beds
2 OTs
Lithotripsy
Mother and child care
Aesthetic & Reconstructive Surgery
Non-invasive cardiology
Physiotherapy
Pediatric & Neonatal Intensive Care
Full range diagnostics
PHP, OPD and Dentistry

49
MHC Speciality Centres – Panchsheel
[South Delhi]
OPTHALMOLOGY AND DENTAL CARE
(November 2005)
Lasik, OPD and diagnostics
Dental – 5 chambers
Support services and offices
SPECIALIST CONSULTS AND
HIGH-END DIAGNOSTICS
(August 2006)
GP and specialist consults
Diagnostics
Neurology (EEG and EMG)
Preventive health and chronic care
Physiotherapy
Minor procedures and emergencies
IVF
Home Care

Disclaimer
50
This presentation has been prepared by Max India Limited (the “Company”). No representation or warranty, express or implied, is made and no
reliance should be placed on the accuracy, fairness or completeness of the information presented or contained in the presentation. The past
performance is not indicative of future results. Neither the Company nor any of its affiliates, advisers or representatives accepts liability
whatsoever for any loss howsoever arising from any information presented or contained in the presentation. The information presented or
contained in these materials is subject to change without notice and its accuracy is not guaranteed.
The presentation may also contain statements that are forward looking. These statements are based on current expectations and assumptions
that are subject to risks and uncertainties. Actual results could differ materially from our expectations and assumptions. We do not undertake
any responsibility to update any forward looking statements nor should this be constituted as a guidance of future performance.
This presentation does not constitute a prospectus or offering memorandum or an offer to acquire any securities and is not intended to provide
the basis for evaluation of the securities. Neither this presentation nor any other documentation or information (or any part thereof) delivered or
supplied under or in relation to the securities shall be deemed to constitute an offer of or an invitation.
No person is authorised to give any information or to make any representation not contained in and not consistent with this presentation and, if
given or made, such information or representation must not be relied upon as having been authorised by or on behalf of the Company any of
its affiliates, advisers or representatives.
The Company’s Securities have not been and are not intended to be registered under the United States Securities Act of 1993, as amended (the
“Securities Act”), or any State Securities Law and unless so registered may not be offered or sold within the United States or to, or for the
benefit of, U.S. Persons (as defined in Regulations S under the Securities Act) except pursuant to an exemption from, or in a transaction not
subject to, the registration requirements of the Securities Act and the applicable State Securities Laws.
This presentation is highly confidential, and is solely for your information and may not be copied, reproduced or distributed to any other
person in any manner. Unauthorized copying, reproduction, or distribution of any of the presentation into the U.S. or to any “U.S. persons” (as
defined in Regulation S under the Securities Act) or other third parties ( including journalists) could prejudice, any potential future offering of
shares by the Company. You agree to keep the contents of this presentation and these materials confidential.

51
MAX INDIA LTD. Max House, Okhla, New Delhi – 110 020
Phone: +91 11 26933601-10 Fax: +91 11 26933619
Website: www.maxindia.com