investigation of the clinical significance and prospective
TRANSCRIPT

ONCOLOGY REPORTS 42: 189-201, 2019
Abstract. The present study aimed to investigate the clinical significance and prospective molecular mechanism of cystatin (CST) genes in patients with hepatitis B virus (HBV)-related hepatocellular carcinoma (HCC). The role of CST genes in the molecular mechanism of HCC was revealed through bioinfor-matics analysis. The clinical significance of CST genes was investigated using GSE14520‑derived data from patients with HBV-related HCC. Gene set enrichment analysis (GSEA) was used to identify pathways in which the CST genes were enriched, as well as the association between these pathways and HCC. The expression levels of CST1, CST2, CST5, CSTA and CSTB genes were higher in HCC tissue compared with in normal tissue; conversely, CST3 and CST7 were reduced in HCC tissue. Subsequent receiver operating characteristic analysis of the CST genes demonstrated that CST7 and CSTB genes may function as potential diagnostic markers for HCC. Furthermore, the expression levels of CST6 and CST7 were strongly associated with recurrence‑free survival and overall survival of patients with HBV‑related HCC. GSEA of the CST genes revealed that CST7 was significantly enriched in tumor evasion and tolerogenicity, cancer progenitors, liver cancer late recurrence, liver cancer progression and several liver cancer subclasses. In addition, CST genes demonstrated homology in terms of protein structure and were revealed to be strongly
co‑expressed. The present findings suggested that CST7 and CSTB genes may serve as potential prognostic and diagnostic biomarkers for HCC.
Introduction
Hepatocellular carcinoma (HCC) was reported to be the sixth most common cancer and the fourth most common cause of malignancy-associated mortality worldwide in 2018. Each year, ~841,000 new cases of HCC are diagnosed and 782,000 deaths occur due to HCC worldwide (1). Notably, ~50% of newly diagnosed HCC cases and HCC-related deaths are thought to occur in China, with ~466,100 newly diagnosed patients and ~422,100 deaths occurring in China in 2015 (2). Primary liver cancer includes several pathological types, of which HCC is the predominant form that accounts for 75‑85% of all cases, with an incidence of 6.20 cases per 100,000 (1,3). Compared with other types of cancer, HCC in China carried the worst prognosis between 2003 and 2005, with a 1‑year survival rate of <50% and a 5‑year‑survival rate of only 10.1% (4,5). Hepatitis B virus (HBV) infection is the primary cause of the high incidence of HCC in China (6). Given the poor prognosis of this disease, early HCC detection and treatment is of the utmost importance (7). Recent advances in genetic research have promoted a comprehensive understanding of the role of genetic mutations in HCC, allowing for the identification of diagnostic and prognostic HCC biomarkers (8).
Cysteine proteases are critical in promoting the progression of various types of tumor (9). There are eight subfamilies in the cystatin (CST) family group (Family 1, Family 2, Family 3, HRG, Fetuins, CRP, Spp24 and CRES) (10). Cysteine proteases are inhibited by CSTs (11) and are concentrated in the leading edge of tumor cells, where they dissolve extracellular matrix (ECM) proteins to promote invasion (12,13), thus enhancing tumor progression. Several types of CST have been discovered to possess significantly distinct expression profiles in HCC compared with their expression in healthy tissues. CST3, CSTA
Investigation of the clinical significance and prospective molecular mechanisms of cystatin genes in patients with
hepatitis B virus‑related hepatocellular carcinomaXIN ZHou1, XIANGkuN WANG1, kETuAN HuANG1, XIWEN LIAo1, CHENGkuN YANG1,
TINGdoNG Yu1, JuNqI LIu1, CHuANGYE HAN1, GuANGZHI ZHu1, HAo Su1, WEI qIN1, quANFA HAN1, ZHENGqIAN LIu1, JIANLV HuANG1,2, YIZHEN GoNG3, XINpING YE1 and TAO PENG1
1department of Hepatobiliary Surgery, The First Affiliated Hospital of Guangxi Medical university, Nanning, Guangxi Zhuang Autonomous Region 530021; 2department of Hepatobiliary Surgery,
The Third Affiliated Hospital of Guangxi Medical university, Nanning, Guangxi Zhuang Autonomous Region 530031; 3department of Colorectal and Anal Surgery, The First Affiliated Hospital of Guangxi Medical university,
Nanning, Guangxi Zhuang Autonomous Region 530021, p.R. China
Received February 2, 2019; Accepted May 2, 2019
doI: 10.3892/or.2019.7154
Correspondence to: professor Tao peng, department of Hepatobiliary Surgery, The First Affiliated Hospital of Guangxi Medical university, 6 Shuangyong Road, Nanning, Guangxi Zhuang Autonomous Region 530021, P.R. ChinaE‑mail: [email protected]
Key words: clinical significance, molecular mechanism, cystatin, hepatitis B virus, hepatocellular carcinoma

ZHou et al: CLINICAL SIGNIFICANCE ANd MoLECuLAR MECHANISMS oF CST GENES IN HBV‑RELATEd HCC190
and CSTB are significantly highly expressed in HCC tissue compared with in adjacent healthy tissue, and the expression levels of CSTA and CSTB are strongly associated with node metastasis for HCC (14,15). Additionally, it has been reported that CST3 and CSTB may function as serum markers for HCC (15,16). Therefore, further investigations into the role of CST genes in HCC are warranted. The present study aimed to uncover the prognostic and diagnostic values of Family 1 CSTs (CSTA and CSTB) and Family 2 CSTs (CST1, CST2, CST3, CST4, CST5, CST6, CST7 and CST8) in patients with HCC using freely available data derived from public genomic databases.
Materials and methods
Bioinformatics analysis of CST genes. database for Annotation, Visualization and Integrated discovery (dAVId, version 6.8; david.ncifcrf.gov/home.jsp) (17,18) was accessed on december 17, 2018 for kyoto Encyclopedia of Genes and Genomes (kEGG) pathway annotation, Gene ontology (Go) functional annotation and enrichment analysis of CST genes. An enrichment p<0.05 was considered to indicate a statistically significant difference. Gene‑gene interactions of CST genes were constructed using GeneMANIA (www.genemania.org, accessed december 17, 2018) (19,20), whereas protein‑protein interactions of CST genes were constructed using the Search Tool for the Retrieval of Interacting Genes/proteins (STRING; string‑db.org, accessed december 17, 2018) (21,22).
Data source. The GSE14520 dataset (www.ncbi.nlm.nih.gov/geo/query/acc.cgi?acc=GSE14520, accessed december 17, 2018), which comprises clinical data of patients with HBV-related HCC as well as their CST gene expression profiles, was extracted from the Gene Expression omnibus database (23‑25). due to multiple probe sets in GSE14520, the expression value of each gene was regarded as the average value corresponding to the same gene and was normalized using the limma package of the R platform (version 3.5.1.; www.r-project.org).
Analysis of gene association and assessment of diagnostic value. Correlations between the CST genes were analyzed using pearson's correlation coefficient and were depicted using the corrplot function of the R platform (version 3.5.1.; www.r‑project.org); p<0.05 as considered to indicate a statisti-cally significant difference. differential expression of the CST genes between healthy liver tissues and HCC tumor tissues were statistically analyzed using Student's t-test in SPSS software (version 22.0; IBM Corp.); p<0.05 as considered to indicate a statistically significant difference. Receiver oper-ating characteristic (ROC) curve analysis was used to assess the diagnostic value of CST genes in predicting HCC (26,27).
Survival analysis. Based on the median value of gene expression, patients were grouped into either the low or high gene expres-sion group. Each CST gene was analyzed for survival using kaplan‑Meier analysis with log‑rank test, and a Cox proportional hazards regression model was conducted to analyze the associa-tion of CST genes with clinical parameters that were strongly associated with oS (p<0.05). The CST genes associated with survival of patients with HCC (adjusted p<0.05) were analyzed
in combination to explore their joint effects on survival analysis using kaplan‑Meier analysis and log‑rank test, and Cox propor-tional hazards regression model. Nomograms based on biological and clinical variables were used to construct a statistical prog-nostic model of overall survival (oS) for HCC in accordance with survival analysis results and the Cox proportional hazards regression model (28). data processing and plot generation were conducted in R platform (version 3.5.1.; www.r‑project.org) with rms package. A scale that was marked on both ends of the line corresponding to each variable represented the value range of the variable, and the length of the line segment reflected the contribution of this factor to the outcome event.
Gene set enrichment analysis (GSEA). The biological path-ways targeted by CST genes were further explored with GSEA (accessed december 17, 2018) (29) using data derived from the Molecular Signatures database of c2 (c2.all.v6.1 symbols) and c5 (c5.all.v6.1 symbols) (30). GSEA‑derived gene enrichment sets that attained a false discovery rate (FdR) of <0.25 and p<0.05 were determined to confer statistical significance.
Statistical analysis. Statistical data processing was conducted using SpSS (version 22.0; IBM Corp.) and R (version 3.5.1.; www.r-project.org). The relative risk of patients with HCC based on CST gene expression was expressed in terms of 95% confidence intervals (CIs) and hazard ratios (HRs). univariate survival analysis of the CST genes and clinical parameters was performed using kaplan‑Meier analysis with log‑rank test. CST genes and patient clinical parameters that were strongly correlated with oS (p<0.05) were further subjected to a multi-variate Cox proportional hazards regression model. Pearson's correlation coefficient was used to assess the relationship between co‑expressed CST genes. p<0.05 was considered to indicate a statistically significant difference. FdR control of GSEA was achieved using the Benjamini‑Hochberg procedure and adjusted for multiple testing (31‑33).
Results
Bioinformatics analysis of CST genes. Biological functions (biological processes, cellular components and molecular functions) of CST1, CST2, CST3, CST4, CST5, CST6, CST7, CST8, CSTA and CSTB were subjected to a Go analysis using dAVId. Each of these genes was markedly enriched in ‘extra-cellular space’, ‘cysteine‑type endopeptidase inhibitor activity’ and ‘protease binding’ (Fig. 1). kEGG pathway analysis using dAVId suggested that CST1, CST2, CST3, CST4 and CST5 were involved in ‘salivary secretion’ (Fig. 1). CST1, CST2, CST4, CSTA and CSTB genes and proteins had significant co-expression relationships (Fig. 2B) and strong protein homology (Fig. 2A) with each other.
Data source. The present study derived its data only from the Affymetrix HT Human Genome u133A Array of GSE14520 in order to avoid a batch effect. The majority of subjects in this cohort had HBV‑related HCC, whereas the remainder of non-HBV-related cases and those with no survival data were eliminated. This resulted in data from 204 adjacent healthy liver tissues and 212 HBV‑related HCC tumor tissues. data regarding patient prognosis were available for all patients.

ONCOLOGY REPORTS 42: 189-201, 2019 191
Analysis of gene association and assessment of diagnostic value. CST gene co-expression in HCC neoplastic tissues
was analyzed using the pearson correlation coefficient. CST1, CST2 and CST4 were closely associated with each other in
Figure 2. Interaction and correlation analysis of CST genes, and the expression level of CST genes between HCC and normal tissues in the GSE14520 dataset. (A) STRING protein‑protein association networks of the CST genes. (B) GeneMANIA gene‑gene interaction networks of the CST genes. (C) Expression levels of CST genes between HCC and normal tissues in the GSE14520 dataset. (d) Matrix graphs of pearson correlation analysis of the CST genes in the GSE14520 dataset. *p<0.05. CST, cystatin; HCC, hepatocellular carcinoma.
Figure 1. kEGG pathway and Go term analysis of cystatin genes. Bp, biological process; CC, cellular component; Go, Gene ontology; kEGG, kyoto Encyclopedia of Genes and Genomes; MF, molecular function.

ZHou et al: CLINICAL SIGNIFICANCE ANd MoLECuLAR MECHANISMS oF CST GENES IN HBV‑RELATEd HCC192
GSE14520 (Fig. 2d). Furthermore, CST1, CST2, CST5, CSTA and CSTB expression levels were markedly increased in HCC tumor tissue in the GSE14520 dataset, whereas CST3 and CST7 expression levels were markedly decreased in HCC tumor tissue (Fig. 2C). There was no significant difference in the expression of CST4, CST6 and CST8 between HCC tumor tissues and healthy liver tissues.
RoC analysis of CST genes revealed that the expression levels of CST7 and CSTB had significant diagnostic values in differentiating between healthy and malignant hepatic tissues. The area under the RoC curves of CST7 and CSTB were 0.702 (95% CI: 0.651‑0.753; Fig. 3G) and 0.919 (95% CI: 0.891-0.948; Fig. 3J), respectively. The other CST genes did not exhibit significant diagnostic values.
Survival analysis. In GSE14520, patients with an advanced Barcelona Clinic Liver Cancer (BCLC) stage (34), larger tumor volume (diameter, >5 cm), higher serum α‑fetoprotein (AFp; >300 ng/ml) and cirrhosis were at high risk of death due to HBV‑related HCC (Table SI). Cirrhotic patients, males and those with advanced BCLC stages were also more at risk of recurrence of HBV‑related HCC (Table SI). No other clinical parameters were revealed to impact recurrence‑free survival (RFS) or OS.
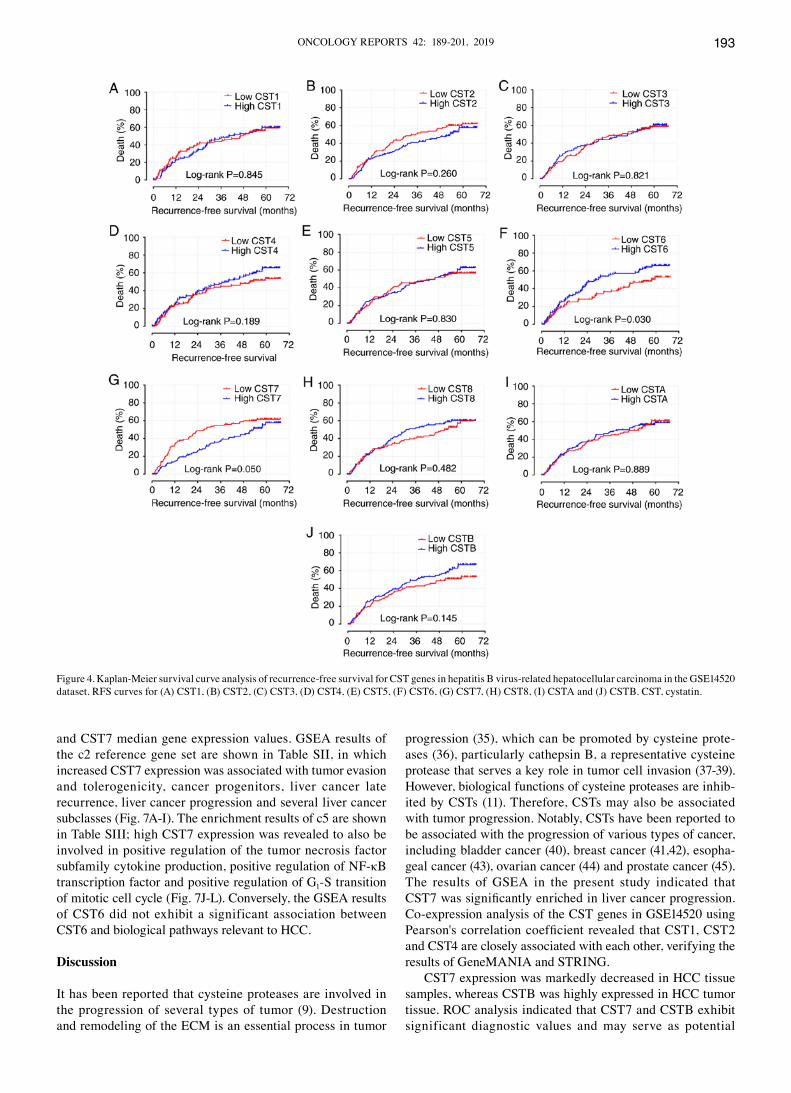
The results of survival analyses of the CST genes are presented in Figs. 4A‑J, 5A‑J and Table I. Low expression levels of CST6 (adjusted p=0.009; adjusted HR=1.651; 95% CI: 1.136‑2.398; Table I; Fig. 4F) and high expression levels of CST7 (adjusted p=0.048; adjusted HR=0.688; 95% CI: 0.475‑0.966; Table I; Fig. 4G) were strongly associated with the
increased RFS of patients with HBV‑related HCC, adjusted for sex, BCLC stage and cirrhosis. Low expression levels of CST6 (adjusted p=0.036; adjusted HR=1.618; 95% CI: 1.033‑2.533; Table I; Fig. 5F) and high expression levels of CST7 (adjusted p=0.014; adjusted HR=0.559; 95% CI: 0.351‑0.891; Table I; Fig. 5G) were also strongly associated with the increased OS of patients with HBV‑related HCC, adjusted for tumor size, AFP, BCLC stage and cirrhosis.
The results of CST gene survival analysis indicated that the expression levels of CST6 and CST7 may be significantly associated with the recurrence and mortality of patients with HBV‑related HCC. The combined impact of CST6 and CST7 on oS and RFS of patients with HBV‑related HCC was then further analyzed. patients were divided into four groups according to CST6 and CST7 expression: Group A, high CST6 and low CST7 expression; Group B, low CST6 and low CST7 expression; Group C, high CST6 and high CST7 expression; Group d, low CST6 and high CST7 expression. patients who had low CST6 expression and high CST7 expres-sion had a decreased risk of recurrence (adjusted p=0.003; adjusted HR=0.431; 95% CI: 0.264‑0.754; Table II; Fig. 6A) and mortality (adjusted p=0.001; adjusted HR=0.315; 95% CI: 0.115‑0.641; Table III; Fig. 6B) in HBV‑related HCC. In addi-tion, the nomogram indicated that both CST6 and CST7 may make a contribution to the prognosis of HCC (Fig. 6C).
GSEA. A CST genome‑wide RNA sequencing dataset was used for GSEA in order to uncover the potential biological mechanisms of CST6 and CST7 in HCC. The genome expres-sion profile in GSE14520 was categorized based on CST6
Figure 3. RoC curve analysis of the ability of CST genes to discriminate between hepatocellular carcinoma and adjacent healthy tissues in the GSE14520 dataset. RoC curves for (A) CST1, (B) CST2, (C) CST3, (d) CST4, (E) CST5, (F) CST6, (G) CST7, (H) CST8, (I) CSTA and (J) CSTB. AuC, area under the curve; CST, cystatin; ROC, receiver operating characteristic.
ONCOLOGY REPORTS 42: 189-201, 2019 193
and CST7 median gene expression values. GSEA results of the c2 reference gene set are shown in Table SII, in which increased CST7 expression was associated with tumor evasion and tolerogenicity, cancer progenitors, liver cancer late recurrence, liver cancer progression and several liver cancer subclasses (Fig. 7A‑I). The enrichment results of c5 are shown in Table SIII; high CST7 expression was revealed to also be involved in positive regulation of the tumor necrosis factor subfamily cytokine production, positive regulation of NF‑κB transcription factor and positive regulation of G1-S transition of mitotic cell cycle (Fig. 7J‑L). Conversely, the GSEA results of CST6 did not exhibit a significant association between CST6 and biological pathways relevant to HCC.
Discussion
It has been reported that cysteine proteases are involved in the progression of several types of tumor (9). destruction and remodeling of the ECM is an essential process in tumor
progression (35), which can be promoted by cysteine prote-ases (36), particularly cathepsin B, a representative cysteine protease that serves a key role in tumor cell invasion (37‑39). However, biological functions of cysteine proteases are inhib-ited by CSTs (11). Therefore, CSTs may also be associated with tumor progression. Notably, CSTs have been reported to be associated with the progression of various types of cancer, including bladder cancer (40), breast cancer (41,42), esopha-geal cancer (43), ovarian cancer (44) and prostate cancer (45). The results of GSEA in the present study indicated that CST7 was significantly enriched in liver cancer progression. Co‑expression analysis of the CST genes in GSE14520 using pearson's correlation coefficient revealed that CST1, CST2 and CST4 are closely associated with each other, verifying the results of GeneMANIA and STRING.
CST7 expression was markedly decreased in HCC tissue samples, whereas CSTB was highly expressed in HCC tumor tissue. RoC analysis indicated that CST7 and CSTB exhibit significant diagnostic values and may serve as potential
Figure 4. kaplan‑Meier survival curve analysis of recurrence‑free survival for CST genes in hepatitis B virus‑related hepatocellular carcinoma in the GSE14520 dataset. RFS curves for (A) CST1, (B) CST2, (C) CST3, (d) CST4, (E) CST5, (F) CST6, (G) CST7, (H) CST8, (I) CSTA and (J) CSTB. CST, cystatin.

ZHou et al: CLINICAL SIGNIFICANCE ANd MoLECuLAR MECHANISMS oF CST GENES IN HBV‑RELATEd HCC194
diagnostic biomarkers. The diagnostic value of CST genes has been reported in previous studies. Having higher expression in HCC compared with in adjacent healthy tissues, the diagnostic value of CSTB for HCC was reported in previous research, and the present investigation provided validation for this (14,16,46). In addition to HCC, the diagnostic value of CSTB has been reported in other tumor types. For example, compared with in normal bladder tissue, CSTB immunohistochemical staining is more intense in bladder cancer tissue (40). CSTB has also been demonstrated to be a diagnostic biomarker of ovarian clear cell carcinoma, due to its high expression in tumor cells based on the results of immunohistochemical analysis, reverse transcription‑pCR and western blot analysis (47).
The survival analysis of CST genes indicated that CST6 and CST7 may be strongly associated with the oS and RFS of patients with HBV‑related HCC. The combined effects survival analysis indicated that the risks of mortality and recurrence in patients with HBV-related HCC were lowest in those with increased expression of CST7 and attenuated expression of CST6. Therefore, CST7 and CST6 may function as prognostic
biomarkers for HCC. The prognostic value of CST genes has been reported across several malignancies. It has been reported that overexpression of CST6 promotes pancreatic cancer growth (48). The function of CST6 was revealed to be similar in the present study, where the survival analysis results indicated that high CST6 expression was associated with poor survival of patients with HCC. However, CST6 has also been reported to act as a human tumor suppressor gene in previous reports (45,49‑54). Therefore, these findings indicated that CST6 may exert distinct effects in different types of cancer. The similar role of CST6 in the liver and pancreas may be a result of the liver and pancreas stemming from a common progenitor at the embryo stage (55). The fact that the molecular mechanism of CST6 serves different roles in various types of cancer still requires further exploration. Although no significant association was detected between CSTB and the prognosis of patients with HCC, differences have been reported in the expression of CSTB between tumor tissues and adjacent healthy tissues (16,46,56). In addition, the prognostic value of CSTB has been demonstrated in several
Figure 5. kaplan‑Meier survival curve analysis of overall survival for CST genes in hepatitis B virus‑related hepatocellular carcinoma in the GSE14520 dataset. oS curves for (A) CST1, (B) CST2, (C) CST3, (d) CST4, (E) CST5, (F) CST6, (G) CST7, (H) CST8, (I) CSTA and (J) CSTB. CST, cystatin.

ONCOLOGY REPORTS 42: 189-201, 2019 195
Tabl
e I.
prog
nost
ic v
alue
s of C
ST g
ene
expr
essi
on in
pat
ient
s with
hep
atiti
s B v
irus‑
rela
ted
hepa
toce
llula
r car
cino
ma
from
the
GSE
1452
0 da
tase
t.
R
FS
OS
----
--------
--------
--------
--------
--------
--------
--------
--------
--------
--------
--------
--------
--------
--------
--------
--------
--------
--------
--------
--------
--------
----
--------
--------
--------
--------
--------
--------
--------
--------
--------
--------
--------
--------
--------
--------
--------
--------
--------
--------
--------
--------
--------
--------
Gen
e pa
tient
s N
o. o
f M
RT
Cru
de H
R
Cru
de
Adj
uste
d A
djus
ted
No.
of
MST
C
rude
HR
C
rude
A
djus
ted
Adj
uste
dex
pres
sion
(n
=212
) ev
ents
(m
onth
s)
(95%
CI)
p‑
valu
e H
R (9
5% C
I)
p‑va
luea
even
ts
(mon
ths)
(9
5% C
I)
p‑va
lue
HR
(95%
CI)
p‑
valu
eb
CST
1
L
ow
106
57
46
1
1
42
NA
1
1
Hig
h 10
6 59
40
0.
964
(0.6
70‑1
.388
) 0.
846
0.90
0 (0
.624
‑1.2
99)
0.57
5 40
N
A
0.87
8 (0
.569
‑1.3
54)
0.55
5 0.
931
(0.6
02‑1
.44)
0.
748
CST
2
L
ow
106
62
35
1
1
44
NA
1
1
Hig
h 10
6 54
53
0.
811
(0.5
63‑1
.169
) 0.
261
0.73
9 (0
.511
‑1.0
68)
0.10
8 38
N
A
0.81
3 (0
.527
‑1.2
56)
0.35
1 0.
768
(0.4
92‑1
.198
) 0.
244
CST
3
L
ow
106
57
43
1
1
42
NA
1
1
Hig
h 10
6 59
46
1.
043
(0.7
25‑1
.501
) 0.
821
0.94
0 (0
.647
‑1.3
65)
0.74
6 40
N
A
0.97
9 (0
.635
‑1.5
09)
0.92
3 0.
803
(0.5
13‑1
.259
) 0.
339
CST
4
L
ow
106
52
51
1
1
35
NA
1
1
Hig
h 10
6 64
40
1.
278
(0.8
86‑1
.843
) 0.
19
1.18
6 (0
.821
‑1.7
13)
0.36
5 47
60
1.
325
(0.8
55‑2
.054
) 0.
208
1.23
0 (0
.791
‑1.9
13)
0.35
7C
ST5
Low
10
6 57
46
1
1
41
N
A
1
1 H
igh
106
59
45
1.04
1 (0
.723
‑1.4
98)
0.83
1.
066
(0.7
38‑1
.539
0.
735
41
NA
1.
032
(0.6
99‑1
.591
) 0.
888
1.07
4 (0
.693
‑1.6
64)
0.75
CST
6
L
ow
106
55
57
1
1
35
NA
1
1
Hig
h 10
6 66
28
1.
499
(1.0
37‑2
.166
) 0.
031
1.65
1 (1
.136
‑2.3
98)
0.00
9 47
60
1.
459
(0.9
42‑2
.260
) 0.
091
1.61
8 (1
.033
‑2.5
33)
0.03
6C
ST7
Low
10
6 63
27
1
1
49
60
1
1
Hig
h 10
6 53
53
0.
695
(0.4
82‑1
.003
) 0.
052
0.68
8 (0
.475
‑0.9
66)
0.04
8 33
0.57
9 (0
.372
‑0.9
01)
0.01
6 0.
559
(0.3
51‑0
.891
) 0.
014
CST
8
L
ow
106
56
51
1
1
37
NA
1
1
Hig
h 10
6 60
30
1.
139
(0.7
91‑1
.641
) 0.
483
1.10
6 (0
.764
‑1.6
02)
0.59
2 45
N
A
1.29
0 (0
.835
‑1.9
94)
0.25
1 1.
382
(0.8
83‑2
.164
) 0.
157
CST
A
Low
10
6 59
46
1
1
38
N
A
1
1 H
igh
106
57
40
1.02
6 (0
.713
‑1.4
77)
0.88
9 1.
173
(0.8
11‑1
.696
) 0.
397
44
NA
1.
266
(0.8
20‑1
.955
) 0.
288
1.47
3 (0
.943
‑2.2
99)
0.08
8C
STB
L
ow
106
54
51
1
1
34
NA
1
1
Hig
h 10
6 62
36
1.
311
(0.9
10‑1
.889
) 0.
147
1.16
4 (0
.803
‑1.6
98)
0.42
3 48
53
1.
734
(1.1
15‑2
.694
) 0.
014
1.46
8 (0
.935
‑2.3
07)
0.09
6
a Adj
uste
d fo
r sex
, cirr
hosi
s and
BC
LC st
age
usin
g m
ultiv
aria
te C
ox p
ropo
rtion
al h
azar
ds re
gres
sion
mod
el; b ad
just
ed fo
r tum
or si
ze, c
irrho
sis,
BC
LC st
age
and
α‑fe
topr
otei
n us
ing
mul
tivar
iate
Cox
pro
porti
onal
haz
ards
regr
essi
on m
odel
. BC
LC,
Bar
celo
na C
linic
Liv
er C
ance
r; C
I, co
nfide
nce
inte
rval
; CST
cys
tatin
; HR
, haz
ard
ratio
; MRT
, med
ian
recu
rren
ce ti
me;
MST
, med
ian
surv
ival
tim
e; N
A, n
ot a
vaila
ble;
oS,
ove
rall
surv
ival
; RFS
, rec
urre
nce‑
free
surv
ival
.

ZHou et al: CLINICAL SIGNIFICANCE ANd MoLECuLAR MECHANISMS oF CST GENES IN HBV‑RELATEd HCC196
other tumors. For example, high CSTB expression is associated with a more favorable prognosis in lung cancer (57). A similar
scenario of CSTB functioning as a prognostic biomarker has been reported in gastric cancer, where it restrains tumor
Table III. Joint effects analysis of CST6 and CST7 expression in the overall survival of patients with hepatocellular carcinoma.
No. of MST Crude HR Crude Adjusted AdjustedGroup CST6 CST7 patients events (months) (95% CI) p‑value HR (95% CI) p‑valuea
A High Low 53 26 61 1 ‑ 1 ‑B Low Low 53 23 NA 0.849 (0.484‑1.488) 0.567 0.785 (0.447‑1.739) 0.399C High High 53 21 NA 0.723 (0.407‑1.286) 0.27 0.721 (0.396‑1.310) 0.283d Low High 53 12 NA 0.367 (0.185‑0.728) 0.004 0.315 (0.115‑0.641) 0.001
aAdjusted for tumor size, cirrhosis, Barcelona Clinic Liver Cancer stage and α‑fetoprotein in the GSE14520 cohort using multivariate Cox proportional hazards regression model. CI, confidence interval; CST, cystatin; HR, hazard ratio; MST, median survival time; NA, not available.
Table II. Joint effects analysis of CST6 and CST7 expression in the recurrence‑free survival of patients with hepatocellular carcinoma.
No. of MRT Crude HR Crude Adjusted AdjustedGroup CST6 CST7 patients events (months) (95% CI) p‑value HR (95% CI) p‑valuea
A High Low 53 34 22 1 - 1 -B Low Low 53 29 42 0.788 (0.480‑1.294) 0.48 0.753 (0.458‑1.237) 0.263C High High 53 32 36 0.815 (0.503‑1.322 0.408 0.880 (0.541‑1.4330) 0.608d Low High 53 21 NA 0.452 (0.262‑0.779) 0.004 0.431 (0.264‑0.754) 0.003
aAdjusted for sex, cirrhosis and Barcelona Clinic Liver Cancer stage in the GSE14520 cohort using multivariate Cox proportional hazards regression model. CI, confidence interval; CST, cystatin; HR, hazard ratio; MRT, median recurrence time; NA, not available.
Figure 6. Combined effect of CST6 and CST7 on the overall survival and recurrence‑free survival of patients, and nomogram for predicting 1‑, 2‑ and 3‑year events. (A) Recurrence‑free survival curves for the combined effect of CST6 and CST7; (B) overall survival curves for the combined effect of CST6 and CST7. Group A, high CST6 and low CST7 expression; Group B, low CST6 and low CST7 expression; Group C, high CST6 and high CST7 expression; Group d, low CST6 and high CST7 expression. (C) Nomogram for predicting 1‑, 2‑ and 3‑year events (death) that combine clinical data with CST6 and CST7 expression. AFP, α‑fetoprotein; BCLC, Barcelona Center Liver Cancer; CST, cystatin.

ONCOLOGY REPORTS 42: 189-201, 2019 197
Figure 7. GSEA results of CST7 in GSE14520. (A‑H) GSEA results of c2‑reference gene sets for groups with elevated CST7 expression.

ZHou et al: CLINICAL SIGNIFICANCE ANd MoLECuLAR MECHANISMS oF CST GENES IN HBV‑RELATEd HCC198
development by suppressing proliferation and migration of neoplastic cells (58). The present study did not determine a prognostic value of CST3 in HCC; however, CST3 has been demonstrated to act as a tumor suppresser that restrains tumor cell invasion in previous studies (56,59). A recent study reported that the rate of glomerular filtration of creatinine and CST3 may serve as potential predictors of oS in HCC (60). By reviewing these studies, the different roles of CST genes in numerous types of cancer can be identified. The present results corresponded with the results of previous studies. Although in the same subfamily, the expression levels and biological func-tions of each CST gene are not the same as those of others, even in different types of cancer. CST genes may also function as oncogenes; however, further studies are needed to validate the present findings.
The GSEA conducted in the present study revealed that CST7 was enriched in tumor evasion and tolerogenicity, cancer progenitors, liver cancer late recurrence, liver cancer progression, several liver cancer subclasses, tumor necrosis factor subfamily cytokine production, regulation of NF‑κB transcription factor and regulation of G1‑S transition of the
mitotic cell cycle. These results suggested that CST7 may be closely associated with liver cancer. However, the association between CST genes and HCC requires further validation in future studies. In addition, although GSEA of CST6 indicated that CST6 was not involved in any pathway or molecular mechanism associated with cancer, the effects of CST6 on different types of cancer have been confirmed by previous studies (45,49-54).
one limitation of the present study was that the sample size was insufficient, which could affect the validity of the results. Secondly, the clinical data obtained from the GSE14520 dataset are not complete, barring the opportunity to carry out a more comprehensive survival analysis using multivariate Cox proportional hazards regression model. In order to better evaluate the association between CST subfamily members and HCC prognosis, likely HCC risk factors, including the pres-ence of a tumor capsule and vascular invasion, Child‑pugh score and alcohol intake, should be taken into consideration. Thirdly, the current investigation only explored the relation-ship between CST gene mRNA expression and HCC prognosis and did not explore the effects of CST protein levels on HCC
Figure 7. Continued. GSEA results of CST7 in GSE14520. (I) GSEA results of c2‑reference gene sets for groups with elevated CST7 expression; (J‑L) GSEA results of c5‑reference gene sets for groups with elevated CST7 expression. CST7, cystatin 7; ES, enrichment score; FdR q‑val, false discovery rate q‑value; FWER p‑val, familywise‑error rate p‑value; GSEA, gene set enrichment analysis; NES, normalized enrichment score; NoM p‑val, nominal p‑value.

ONCOLOGY REPORTS 42: 189-201, 2019 199
prognosis. Finally, further studies are warranted to determine the effects of Family 3 and Family 4 CSTs on HCC.
Although there are several limitations to the present study, to the best of our knowledge, this is the first to discover the clinical significance of CST6 and CST7 in the prognosis of patients with HBV‑related HCC. In addition, our result verified the findings of previous reports and suggested that CSTB may act as a diagnostic biomarker for HCC. Furthermore, CST7 was discovered to be enriched in several tumor‑related signaling pathways and biological processes, including tumor evasion and tolerogenicity, cancer progenitors, liver cancer late recurrence, liver cancer progression, several liver cancer subclasses, tumor necrosis factor subfamily cytokine production, regulation of NF-κB transcription factor and regulation of G1‑S transition of the mitotic cell cycle. The prospective molecular mechanisms underlying the effects of CST7 gene expression on patients with HBV-related HCC were determined using GSEA.
In conclusion, the gene expression levels of CST1, CST2, CST5, CSTA and CSTB were significantly increased in HCC tissue, whereas CST3 and CST7 were overexpressed in normal tissue compared with in HCC tissue. Notably, the present study revealed that CST7 and CSTB may serve as diagnostic markers for HCC, and survival analysis of CST genes indicated that CST6 and CST7 expression levels may be closely associated with the oS and RFS of patients with HCC. However, this investigation requires further validation using a sufficient sample size spread across multiple geographical regions.
Acknowledgements
Not applicable.
Funding
This study was supported in part by the National Natural Science Foundation of China (grant nos. 81560535, 81802874, 81072321, 30760243, 30460143 and 30560133), the Natural Science Foundation of Guangxi province of China (grant no. 2017JJB140189y), the 2009 program for New Century Excellent Talents in university (NCET), Guangxi Natural Sciences Foundation (grant no. GuikeGong 1104003A‑7) and the Guangxi Health Ministry Medicine Grant (key Scientific Research Grant; grant no. Z201018). The present study was also partly supported by the Scientific Research Fund of the Health and Family planning Commission of Guangxi Zhuang Autonomous Region (grant no. Z2016318), the key Laboratory of High Incidence Tumor prevention & Treatment (Guangxi Medical university), Ministry of Education (grant no. GkE2018‑01), the Basic Ability Improvement project for Middle‑aged and Young Teachers in Colleges and universities in Guangxi (grant no. 2018kY0110), the Innovation project of Guangxi Graduate Education (grant no. JGY2018037) the 2018 Innovation project of Guangxi Graduate Education (grant no. YCBZ2018036), and the Research Institute of Innovative Think‑tank at Guangxi Medical university (the gene‑environment interaction in hepatocarcinogenesis in Guangxi HCCs and its translational applications in the HCC prevention). The authors would also like to acknowledge the support provided by the National key Clinical Specialty Programs (General Surgery & Oncology)
and the key Laboratory of Early prevention & Treatment for Regional High‑Incidence‑Tumor (Guangxi Medical university), Ministry of Education, China. This work was also supported in part by the Natural Science Foundation of Guangxi province of China (grant no. 2018GXNSFBA138013), the key Laboratory of High‑Incidence‑Tumor prevention & Treatment (Guangxi Medical university) and the Guangxi key R & d program (grant no. GkEAB18221019).
Availability of data and materials
The datasets used and/or analyzed during the current study are available from the corresponding author on reasonable request.
Authors' contributions
XZ and TP conceived and designed the study. XW, kH, XL, CY, TY, JL, CH, GZ, HS, Wq, qH, ZL, JH, YG, XY and TP acquired the data and performed data analyses. XZ wrote the manuscript, and TP guided and supervised the manuscript. All authors read and approved the final manuscript.
Ethics approval and consent to participate
Not applicable.
Patient consent for publication
Not applicable.
Competing interests
The authors declared that they have no competing interests.
References
1. Bray F, Ferlay J, Soerjomataram I, Siegel RL, Torre LA and Jemal A: Global cancer statistics 2018: GLoBoCAN estimates of incidence and mortality worldwide for 36 cancers in 185 coun-tries. CA Cancer J Clin 68: 394‑424, 2018.
2. Chen W, Zheng R, Baade pd, Zhang S, Zeng H, Bray F, Jemal A, Yu Xq and He J: Cancer statistics in China, 2015. CA Cancer J Clin 66: 115‑132, 2016.
3. Njei B, Rotman Y, ditah I and Lim Jk: Emerging trends in hepa-tocellular carcinoma incidence and mortality. Hepatology 61: 191-199, 2015.
4. Zeng H, Zheng R, Guo Y, Zhang S, Zou X, Wang N, Zhang L, Tang J, Chen J, Wei k, et al: Cancer survival in China, 2003-2005: A population‑based study. Int J Cancer 136: 1921‑1930, 2015.
5. Altekruse SF, McGlynn kA and Reichman ME: Hepatocellular carcinoma incidence, mortality, and survival trends in the united States from 1975 to 2005. J Clin oncol 27: 1485‑1491, 2009.
6. Torre LA, Bray F, Siegel RL, Ferlay J, Lortet-Tieulent J and Jemal A: Global cancer statistics, 2012. CA Cancer J Clin 65: 87‑108, 2015.
7. Volk ML and Marrero JA: Early detection of liver cancer: diagnosis and management. Curr Gastroenterol Rep 10: 60‑66, 2008.
8. Sawyers CL: The cancer biomarker problem. Nature 452: 548-552, 2008.
9. Gora J and Latajka R: Involvement of cysteine proteases in cancer. Curr Med Chem 22: 944-957, 2015.
10. ochieng J and Chaudhuri G: Cystatin superfamily. J Health Care poor underserved 21 (Suppl 1): S51-S70, 2010.
11. Turk V, Stoka V and Turk d: Cystatins: Biochemical and structural properties, and medical relevance. Front Biosci 13: 5406‑5420, 2008.
12. Sinha AA, Gleason dF, deleon oF, Wilson MJ and Sloane BF: Localization of a biotinylated cathepsin B oligonucleotide probe in human prostate including invasive cells and invasive edges by in situ hybridization. Anat Rec 235: 233‑240, 1993.

ZHou et al: CLINICAL SIGNIFICANCE ANd MoLECuLAR MECHANISMS oF CST GENES IN HBV‑RELATEd HCC200
13. Visscher dW, Sloane BF, Sameni M, Babiarz JW, Jacobson J and Crissman Jd: Clinicopathologic significance of cathepsin B immunostaining in transitional neoplasia. Mod pathol 7: 76‑81, 1994.
14. Lin YY, Chen ZW, Lin Zp, Lin LB, Yang XM, Xu LY and Xie q: Tissue levels of stefin A and stefin B in hepatocellular carcinoma. Anat Rec (Hoboken) 299: 428‑438, 2016.
15. Zinkin NT, Grall F, Bhaskar k, otu HH, Spentzos d, kalmowitz B, Wells M, Guerrero M, Asara JM, Libermann TA and Afdhal NH: Serum proteomics and biomarkers in hepatocel-lular carcinoma and chronic liver disease. Clin Cancer Res 14: 470-477, 2008.
16. Lee MJ, Yu GR, park SH, Cho BH, Ahn JS, park HJ, Song EY and kim dG: Identification of cystatin B as a potential serum marker in hepatocellular carcinoma. Clin Cancer Res 14: 1080-1089, 2008.
17. dennis G Jr, Sherman BT, Hosack dA, Yang J, Gao W, Lane HC and Lempicki RA: dAVId: database for annotation, visualiza-tion, and integrated discovery. Genome Biol 4: P3, 2003.
18. Huang dW, Sherman BT, Tan q, kir J, Liu d, Bryant d, Guo Y, Stephens R, Baseler MW, Lane HC and Lempicki RA: dAVId bioinformatics resources: Expanded annotation database and novel algorithms to better extract biology from large gene lists. Nucleic Acids Res 35 (Web Server issue): W169‑W175, 2007.
19. Warde‑Farley d, donaldson SL, Comes o, Zuberi k, Badrawi R, Chao p, Franz M, Grouios C, kazi F, Lopes CT, et al: The GeneMANIA prediction server: Biological network integration for gene prioritization and predicting gene function. Nucleic Acids Res 38 (Web Server issue): W214‑W220, 2010.
20. Montojo J, Zuberi k, Rodriguez H, Bader Gd and Morris q: GeneMANIA: Fast gene network construction and function prediction for Cytoscape. F1000Res 3: 153, 2014.
21. von Mering C, Huynen M, Jaeggi d, Schmidt S, Bork p and Snel B: STRING: A database of predicted functional associations between proteins. Nucleic Acids Res 31: 258‑261, 2003.
22. Szklarczyk d, Morris JH, Cook H, kuhn M, Wyder S, Simonovic M, Santos A, doncheva NT, Roth A, Bork p, et al: The STRING database in 2017: quality‑controlled protein‑protein association networks, made broadly accessible. Nucleic Acids Res 45: d362‑d368, 2017.
23. Cancer Genome Atlas Research Network. Electronic address: [email protected]; Cancer Genome AtlasResearch Network: Comprehensive and integrative genomic characterization of hepatocellular carcinoma. Cell 169: 1327‑1341.e23, 2017.
24. Liao X, Liu X, Yang C, Wang X, Yu T, Han C, Huang k, Zhu G, Su H, qin W, et al: distinct diagnostic and prognostic values of minichromosome maintenance gene expression in patients with hepatocellular carcinoma. J Cancer 9: 2357-2373, 2018.
25. Roessler S, Long EL, Budhu A, Chen Y, Zhao X, Ji J, Walker R, Jia HL, Ye qH, qin LX, et al: Integrative genomic identification of genes on 8p associated with hepatocellular carcinoma progres-sion and patient survival. Gastroenterology 142: 957‑966e12, 2012.
26. Hoo ZH, Candlish J and Teare d: What is an RoC curve? Emerg Med J 34: 357-359, 2017.
27. Ma H, Bandos AI, Rockette HE and Gur d: on use of partial area under the RoC curve for evaluation of diagnostic performance. Stat Med 32: 3449-3458, 2013.
28. Balachandran Vp, Gonen M, Smith JJ and deMatteo Rp: Nomograms in oncology: More than meets the eye. Lancet oncol 16: e173‑e180, 2015.
29. Subramanian A, Tamayo p, Mootha Vk, Mukherjee S, Ebert BL, Gillette MA, paulovich A, pomeroy SL, Golub TR, Lander ES and Mesirov JP: Gene set enrichment analysis: A knowledge‑based approach for interpreting genome‑wide expression profiles. proc Natl Acad Sci uSA 102: 15545‑15550, 2005.
30. Liberzon A, Birger C, Thorvaldsdóttir H, Ghandi M, Mesirov JP and Tamayo p: The molecular signatures database (MSigdB) hallmark gene set collection. Cell Syst 1: 417‑425, 2015.
31. François o, Martins H, Caye k and Schoville Sd: Controlling false discoveries in genome scans for selection. Mol Ecol 25: 454‑469, 2016.
32. Glickman ME, Rao SR and Schultz MR: False discovery rate control is a recommended alternative to Bonferroni‑type adjust-ments in health studies. J Clin Epidemiol 67: 850‑857, 2014.
33. Reiner A, Yekutieli d and Benjamini Y: Identifying differen-tially expressed genes using false discovery rate controlling procedures. Bioinformatics 19: 368‑375, 2003.
34. Llovet JM, Brú C and Bruix J: prognosis of hepatocellular carci-noma: The BCLC staging classification. Semin Liver dis 19: 329-338, 1999.
35. Liotta LA, Rao CN and Barsky SH: Tumor invasion and the extracellular matrix. Lab Invest 49: 636‑649, 1983.
36. Cudic M and Fields GB: Extracellular proteases as targets for drug development. Curr Protein Pept Sci 10: 297-307, 2009.
37. Yan S, Sameni M and Sloane BF: Cathepsin B and human tumor progression. Biol Chem 379: 113-123, 1998.
38. Mirković B, Markelc B, Butinar M, Mitrović A, Sosič I, Gobec S, Vasiljeva o, Turk B, Čemažar M, Serša G and kos J: Nitroxoline impairs tumor progression in vitro and in vivo by regulating cathepsin B activity. oncotarget 6: 19027‑19042, 2015.
39. Aggarwal N and Sloane BF: Cathepsin B: Multiple roles in cancer. Proteomics Clin Appl 8: 427-437, 2014.
40. Feldman AS, Banyard J, Wu CL, Mcdougal WS and Zetter BR: Cystatin B as a tissue and urinary biomarker of bladder cancer recurrence and disease progression. Clin Cancer Res 15: 1024-1031, 2009.
41. Leto G, Incorvaia L, Flandina C, Ancona C, Fulfaro F, Crescimanno M, Sepporta MV and Badalamenti G: Clinical impact of cystatin C/cathepsin L and follistatin/activin A systems in breast cancer progression: A preliminary report. Cancer Invest 34: 415‑423, 2016.
42. Ai L, kim WJ, kim TY, Fields CR, Massoll NA, Robertson kd and Brown kd: Epigenetic silencing of the tumor suppressor cystatin M occurs during breast cancer progression. Cancer Res 66: 7899‑7909, 2006.
43. Shiba d, Terayama M, Yamada k, Hagiwara T, Oyama C, Tamura‑Nakano M, Igari T, Yokoi C, Soma d, Nohara k, et al: Clinicopathological significance of cystatin A expression in progression of esophageal squamous cell carcinoma. Medicine (Baltimore) 97: e0357, 2018.
44. Wang X, Gui L, Zhang Y, Zhang J, Shi J and Xu G: Cystatin B is a progression marker of human epithelial ovarian tumors medi-ated by the TGF‑β signaling pathway. Int J oncol 44: 1099‑1106, 2014.
45. pulukuri SM, Gorantla B, knost JA and Rao JS: Frequent loss of cystatin E/M expression implicated in the progression of prostate cancer. Oncogene 28: 2829-2838, 2009.
46. unić A, derek L, duvnjak M, patrlj L, Rakić M, kujundžić M, Renjić V, Štoković N, dinjar p, Jukic A and Grgurević I: diagnostic specificity and sensitivity of pIVkAII, Gp3, CSTB, SCCA1 and HGF for the diagnosis of hepatocellular carcinoma in patients with alcoholic liver cirrhosis. Ann Clin Biochem 55: 355‑362, 2018.
47. Takaya A, peng WX, Ishino k, kudo M, Yamamoto T, Wada R, Takeshita T and Naito Z: Cystatin B as a potential diagnostic biomarker in ovarian clear cell carcinoma. Int J oncol 46: 1573-1581, 2015.
48. Li q, Zheng ZC, Ni CJ, Jin WX, Jin YX, Chen Y, Zhang XH, Chen Ed and Cai YF: Correlation of cystatin E/M with clini-copathological features and prognosis in triple‑negative breast cancer. Ann Clin Lab Sci 48: 40‑44, 2018.
49. Soh H, Venkatesan N, Veena MS, Ravichandran S, Zinabadi A, Basak Sk, parvatiyar k, Srivastava M, Liang LJ, Gjertson dW, et al: Cystatin E/M suppresses tumor cell growth through cytoplasmic retention of NF‑κB. Mol Cell Biol 36: 1776‑1792, 2016.
50. Shridhar R, Zhang J, Song J, Booth BA, kevil CG, Sotiropoulou G, Sloane BF and keppler d: Cystatin M suppresses the malignant phenotype of human MdA‑MB‑435S cells. oncogene 23: 2206‑2215, 2004.
51. kioulafa M, Balkouranidou I, Sotiropoulou G, kaklamanis L, Mavroudis d, Georgoulias V and Lianidou ES: Methylation of cystatin M promoter is associated with unfavorable prognosis in operable breast cancer. Int J Cancer 125: 2887‑2892, 2009.
52. Chen X, Cao X, dong W, Xia M, Luo S, Fan q and Xie J: Cystatin M expression is reduced in gastric carcinoma and is associated with promoter hypermethylation. Biochem Biophys Res Commun 391: 1070-1074, 2010.
53. qiu J, Ai L, Ramachandran C, Yao B, Gopalakrishnan S, Fields CR, delmas AL, dyer LM, Melnick SJ, Yachnis AT, et al: Invasion suppressor cystatin E/M (CST6): High‑level cell type‑specific expression in normal brain and epigenetic silencing in gliomas. Lab Invest 88: 910‑925, 2008.
54. Veena MS, Lee G, keppler d, Mendonca MS, Redpath JL, Stanbridge EJ, Wilczynski Sp and Srivatsan ES: Inactivation of the cystatin E/M tumor suppressor gene in cervical cancer. Genes Chromosomes Cancer 47: 740-754, 2008.
55. McCarthy dJ, Chen Y and Smyth Gk: differential expression analysis of multifactor RNA‑Seq experiments with respect to biological variation. Nucleic Acids Res 40: 4288‑4297, 2012.

ONCOLOGY REPORTS 42: 189-201, 2019 201
56. Ji NY, kang YH, park MY, Lee CI, kim Mk, kim dG, kim JW and Song EY: development of a f luorescent microsphere immunoassay for cystatin B (CSTB) in serum of patients with hepatocellular carcinoma. Clin Chem Lab Med 49: 151‑155, 2011.
57. Ma Y, Chen Y and petersen I: Expression and epigenetic regula-tion of cystatin B in lung cancer and colorectal cancer. pathol Res pract 213: 1568‑1574, 2017.
58. Zhang J, Shi Z, Huang J and Zou X: CSTB downregulation promotes cell proliferation and migration and suppresses apoptosis in gastric cancer SGC-7901 cell line. Oncol Res 24: 487‑494, 2016.
59. Coulibaly S, Schwihla H, Abrahamson M, Albini A, Cerni C, Clark JL, Ng kM, katunuma N, Schlappack o, Glössl J and Mach L: Modulation of invasive properties of murine squamous carcinoma cells by heterologous expression of cathepsin B and cystatin C. Int J Cancer 83: 526‑531, 1999.
60. Tamai Y, Iwasa M, kawasaki Y, Yoshizawa N, Ogura S, Sugimoto R, Eguchi A, Yamamoto N, Sugimoto k, Hasegawa H and Takei Y: Ratio between estimated glomerular filtration rates of creatinine and cystatin C predicts overall survival in patients with hepatocellular carcinoma. Hepatol Res 49: 153‑163, 2019.
This work is licensed under a Creative Commons Attribution-NonCommercial-NoDerivatives 4.0 International (CC BY-NC-ND 4.0) License.