investigating the performance of micropiled raft in
TRANSCRIPT

Draft
Investigating the performance of micropiled raft in
foundation of power transmission lines towers in cohesive soil: Experimental and numerical study
Journal: Canadian Geotechnical Journal
Manuscript ID cgj-2017-0027.R1
Manuscript Type: Article
Date Submitted by the Author: 10-May-2017
Complete List of Authors: Zekavati , Ali Asghar ; Niroo Research Institute, Structural Department
Khodaverdian, Alireza ; Niroo Research Institute, Structural Department Jafari, Mohamad ali; Niroo Research Institute, Structural Department Hosseini , Ahmad ; Iran University of Science and Technology,, School of Railway Engineering
Keyword: power transmission line, lattice tower, tensile behavior, micropiled-raft foundation, field loading test
https://mc06.manuscriptcentral.com/cgj-pubs
Canadian Geotechnical Journal

Draft
1
Title:
Investigating the performance of micropiled raft in foundation of power transmission lines
towers in cohesive soil: Experimental and numerical study
Authors:
Ali-Asghar Zekavati (a)
, Alireza khodaverdian (b)
, Mohammad-Ali Jafari* (c)
, Ahmad
Hosseini (d)
(a) Research Assistant, Structural Department of Transmission and Distribution research
center, Niroo Research Institute (NRI), Tehran, I. R. of Iran, E-mail:
(b) Research Engineer, Structural Department of Transmission and Distribution research
center, Niroo Research Institute (NRI), Tehran, I. R. of Iran, E-mail:
(c) Assistant Professor, Structural Department of Transmission and Distribution research
center, Niroo Research Institute (NRI), Tehran, I. R. of Iran, E-mail: [email protected]
(d) Research Engineer, School of Railway Engineering, Iran University of Science and
Technology, Tehran, I. R. of Iran, E-mail: [email protected]
* Corresponding author: Mohammad-Ali Jafari, Niroo Research Institute (NRI), Structural
Department of Transmission and Distribution research center, Address: Dadman Blvd.,
Shahrak Ghds (Gharb), Tehran, I. R. of Iran. Tel.: 00982188079400, Fax: 00982188574786,
E-mail Address: [email protected]
Page 1 of 50
https://mc06.manuscriptcentral.com/cgj-pubs
Canadian Geotechnical Journal

Draft
2
Abstract
This paper captures the behavior of micropiled raft in power transmission line tower
foundations in cohesive soil, concentrating on their uplift performance whether due to the
tower position along the line or under wind loading conditions. In this regard, first a number
of micropiles were driven into the ground of a project site at the ParehSar power plant, Gilan,
Iran. Compression and uplift loading tests were conducted according to relevant standards.
On the basis of the field data, a 3D finite-element model was developed and subsequently
calibrated and verified. The behavior of micropiled rafts subjected to uplift, which is a typical
type of loading in foundations of 230 kV four-circuit lattice towers, was then studied by
means of this model in terms of a wide-ranging parametric study. In the sensitivity analyses,
the impacts of various parameters, such as micropile spacing-to-diameter (s/d) and length-to-
diameter (l/d) ratios along with undrained shear strength of the soil have been investigated on
the uplift capacity of an individual micropile within and out of the group. Furthermore,
interaction factors were computed based on diverse values for undrained shear strength of the
soil, s/d ratio, l/d ratio, and grout-soil adhesion. From design and analysis perspectives, the
FEM outputs revealed that the efficiency coefficient of micropiled raft during uplift can be
considered equal to one. Moreover, it was found that not only does the behavior of micropiles
affect the neighboring micropiles immediately adjacent to the loaded one, it also influences
those in further rows, the result of which would be considering their significance as well.
Keywords: power transmission line; lattice tower; uplift behavior; micropiled-raft
foundation; field loading test; finite element method (FEM)
Page 2 of 50
https://mc06.manuscriptcentral.com/cgj-pubs
Canadian Geotechnical Journal

Draft
3
Introduction
With the rapid development of civil infrastructures and the associated consumption of
power energy, a momentous portion of financial budget of governments is allocated to the
construction of high-voltage transmission lines. In soft soils, the majority of this
manufacturing cost is devoted to the tower foundation. This issue is owing to the fact that the
foundation dimensions should generally be enlarged in order to increase the ultimate bearing
capacity and reduce the settlement. In addition, for prevention of uplift phenomenon and
provision of higher overburden, the foundations are built into deeper levels.
In this regard, implementing a new foundation system for obviating the abovementioned
drawbacks appears to be indispensable. Among the common approaches, micropile group has
progressively been employed for execution of foundations in problematic soils. The first
presentation of micropile alludes to the retrofitting and underpinning of structures in Italy
during World War II (FHWA 2000). Micropiles have been adopted in many engineering
applications to date (Huang et al. 2007; Luna et al. 2015; Thompson et al. 2009). As a result,
considerable research and studies have been designated to investigating the performance of
these slender elements, Table 1.
Dependent on the type of soil, construction technique, grouting method, dimension of
micropile, loading type (axial compression or tension, lateral and combination of loads), the
results of the research mentioned in Table 1 are noticeably different with each other. This is
even more highlighted in the case of micropile groups in comparison with a single micropile
on account of the interactions among micropiles, soil, and raft.
In this regard, a widespread investigation on micropiles within a micropiled raft needs to
be conducted. Since the design procedure in most foundations is performed in a way so that
they would not experience tensile stresses, the research works on micropile groups have thus
Page 3 of 50
https://mc06.manuscriptcentral.com/cgj-pubs
Canadian Geotechnical Journal

Draft
4
far been accomplished considering mostly compressive loadings. However, in the case of
foundations of lattice towers, one of the critical loads exerted is the uplift load due to typical
circumstances of these structures, particularly under wind loads. These loads could lead to the
entire uplift of the foundation, the result of which would be all its micropiles undergoing
uplift loading conditions. Taking such into account, in-depth analyses and studies of the
behavior of every single micropile located inside a group, as well as the raft global
performance have been carried out in this research.
In the current study, eight micropiles were driven and grouted (similar to the grouting
method type C) into the soft cohesive soil of ParehSar power plant. The site soil consists of
two clay layers overlain a sandy soil, and the area is surrounded by a significant number of
230 kV four-circuit transmission towers. After having implemented the test setup, a number
of axial compression, axial tension, and lateral load experiments were conducted on the
micropiles. On the basis of the experimental outputs, a three-dimensional finite element
model was developed, and the numerical results of an isolated micropile were calibrated.
Following its verification by field data published elsewhere, the numerical model was then
used to examine the uplift behavior of micropiled-raft foundation of tower.
According to the numerical analyses, the dimensions of tower foundation can considerably
diminish compared to the ordinary shallow foundation “pad and chimney.” Moreover, the
straightforwardness and speed of foundation execution highly improves in the case of
micropiled raft because of the reduction in earthwork operation and capability of construction
at levels above the water table.
Overall, the application of micropiles in foundation of transmission lines can be very
helpful from practical and technical points of view. For this reason, this study is devoted to
the behavior of micropiled raft foundations under uplift loadings, which also proves its
Page 4 of 50
https://mc06.manuscriptcentral.com/cgj-pubs
Canadian Geotechnical Journal

Draft
5
effectiveness in enhancing the bearing capacity and in declining the foundation uplift risk. In
this respect, an experimental program including the site conditions, test setup, and field
results, as well as numerical analysis on an individual micropile and micropiled raft has been
presented in next sections.
Experimental study
In the first phase of the investigations on the behavior of micropile groups in foundations
of transmission towers, a series of field loading tests was accomplished so as to calibrate a
numerical model of the micropiles. In this section, the circumstances and properties of the
project field and its soil layers are initially described. The method utilized for installing the
micropiles along with its procedure will then be elucidated. Subsequently, the loading setup
for compression and tension experiments in conjunction with their outputs will be
represented. To end with, four distinct failure criteria have been introduced, one of which was
used to determine the micropile ultimate uplift capacity.
Site conditions and soil characteristics
The location of experiments was chosen in the vicinity of a combined-cycle power plant,
known as ParehSar. With the electricity generation capacity of 900 MW, this powerhouse is
situated in the northern part of Iran, Gilan, Rezvanshahr. In order to transfer the electrical
energy generated by this power station, 230 kV four-circuit power transmission towers have
been utilized. Due to the soft soil of this region, large shallow foundations must be
constructed in most cases for overcoming the settlements and upward movements caused by
the existing demand loads from the towers.
Figure 1 displays the specifications of soil strata and the results of standard penetration
test (SPT) that belongs to a borehole nearby the implementation site of the micropiles. As
evidenced in Figure 1, the subsurface layers are constituted by a soft cohesive soil overlain a
Page 5 of 50
https://mc06.manuscriptcentral.com/cgj-pubs
Canadian Geotechnical Journal

Draft
6
dense sandy layer. The groundwater level has positioned adjacent to the ground surface on
account of the field’s close proximity to the coastline of the Caspian Sea. Tables 2-4 present
the outputs of the conducted field and laboratory experiments including grading, Atterberg
limits, consolidation, permeability and unconsolidated undrained (UU) triaxial tests on
various soil samples of the ParehSar site.
Micropile installation process
Execution of pilot micropiles in the field undoubtedly plays a constructive role in
simulating and predicting the performance of micropiles implemented beneath power
transmission towers. During the field tests, the conventional method in Iran, known as driven
micropile, was adopted, in which micropiles are driven and installed by a drop-hammer.
Using this technique, first a 230G-type perforated steel casing with the diameter of 76 mm
and thickness of 4 mm was rammed into the ground by means of a vertical sledge hammer,
Figure 2.
Depending on the borehole depth, the whole length is divided into a number of pieces for
ease of the task. It should be stated that the first piece of these two-meter casings does
possess a sharp tip so as to enable the other sections to be driven more conveniently into the
soil. After finishing each casing, the next one can be welded to the current one and the impact
process continues on the new segment. When the tip of the first casing reaches the target
depth, the grouting operation would commence by injecting grout through the micropile.
During the grouting process into the micropiles, inside of casing were located packings
with intervals of 2 m in order to have a uniform injection over the micropile. The volume of
the grout used for each micropile was 0.5 m3 on average. It should be mentioned that the
injection pressure during the process reached up to 1500 kPa. Afterwards, a 28-mm bar was
inserted into the final casing and also adjusted to be right in the middle of that. Eventually,
Page 6 of 50
https://mc06.manuscriptcentral.com/cgj-pubs
Canadian Geotechnical Journal

Draft
7
the bearing plate was welded onto the head of micropile. Figure 3 depicts the implementation
steps of these types of micropiles.
Given the variety of existing loadings imposed on transmission towers, all the three kinds
of testing including compression, tension (pull-out), and lateral were conducted on the
micropiles in this research. In this respect, eight micropiles were executed in the pilot area,
according to the arrangement shown in Figure 4. In compliance with the guidelines of
standard tests on micropiles, (ASTM-D1143/D1143M-07(2013); ASTM D3689/D3689M-
07(2013)e1), performing compressive and uplift experiments each requires three micropiles
while two would suffice for carrying out a lateral test. It should be noted that considerations
will be restricted to only compression and, in particular, uplift tests as the major scope of the
current paper.
Field load test
As illustrated in Figure 5 (a), a steel frame was utilized during the compressive and uplift
tests as a reaction beam. Two micropiles, placed in the distance of 2.13 m from both sides of
the test micropile, held this frame so that the reaction force required against the anticipated
loading would be provided. In order to fulfill the experiments on these micropiles, a 600-kN
hydraulic jack for recording the load and three displacement gauges with an accuracy of 0.01
mm for reading the displacement of the tip of micropile were employed, Figure 5 (b).
The loading process was performed via the “quick test” method in compliance with the
standards mentioned in subsection 2.2, which is applied for soft soils. In this test method, the
loading continues with the successive increasing steps of 5% until the failure of micropile. It
should be emphasized that the loading on the micropile at each stage prolonged for four
minutes, and the corresponding displacement was noted at the end of each loading step.
Page 7 of 50
https://mc06.manuscriptcentral.com/cgj-pubs
Canadian Geotechnical Journal

Draft
8
Upon achieving the target loading, the step-by-step unloading process could be initiated.
Unlike the loading process, each of the unloading stages continued for five minutes,
experiencing a load decrease of 20% in every phase. Considering the aforesaid conditions,
the compressive and uplift field loading and unloading tests were performed on the micropile
C1 and T1, whose outputs are respectively demonstrated in Figure 6 (a) and (b).
Failure criteria
According to (Fellenius 1996), describing the bearing capacity as a point for which rapid
displacement takes place due to a little increase in the loading is not an inclusive definition.
Alternatively, in many of research works, the bearing capacity considered is not equivalent to
the point at which the plunge failure occurs, either (Abd Elaziz and El Naggar 2014a;
Abdelrahman et al. 2003; Akgüner and Kirkit 2012; Décourt 2008; Elkasabgy and El Naggar
2014; Fellenius 1980; Gilchrist 1985).
On the basis of the graphs extracted from the loading experiments in the previous
subsection, calculating the ultimate uplift capacity of each micropile --provided the plunging
failure would not occur-- according to standard methodologies is greatly vital. Consequently,
four common and suitable approaches have been introduced to determine the uplift capacity
of micropiles from loading test results. Table 5 describes these methods along with presenting
approximate amplitudes of uplift and bearing capacities of the micropiles experimented at the
ParehSar site.
As can be seen in Table 5, the values of micropile ultimate uplift and bearing capacity
seem to be underestimated and overestimated, respectively by criteria (O'Neill et al. 1999)
and (Fuller and Hoy 1970). On the other hand, these figures are fairly close together
considering Davisson’s and Butler and Hoy’s criteria (Butler et al. 1976; Davisson 1972).
However, according to (Fellenius 1996), Davisson’s method is suitable and primarily adopted
Page 8 of 50
https://mc06.manuscriptcentral.com/cgj-pubs
Canadian Geotechnical Journal

Draft
9
for analyzing the results of driven piles tested as per quick methods. For this reason,
considering the resemblance between driven piles and the micropiles utilized in the current
study, Davisson’s method has been exploited for estimating the uplift capacity. It is
noteworthy that changing the micropile diameter from 76 mm to 200 mm had a maximum
influence of 6% on its uplift capacity proposed in Davisson’s method.
Numerical analysis
Given the goal of this paper, the numerical model is developed for two purposes. The first
is investigating the behavior and characteristics of the micropiles executed in the ParehSar
site, as well as determining the effective injection diameter by calibrating the results of the
micropile numerical model based on the field test data. Second, the micropile groups are
modeled as the foundation of power transmission lines towers, whose behavior will be
investigated as well. In order to perform modeling and achieve the aforementioned
objectives, the finite element software package, ABAQUS, has been used. In the following
subsections, different parts of numerical simulations comprising material and geometric
modeling, as well as model calibration and verification will be explained.
Material modeling
Three types of material participate in micropile modeling. These are steel, grout, and the
soil surrounding the micropile. To begin with, a linear elastic relation has been considered to
model the micropile casing. Additionally, for simulating the grout adjoining the micropile, a
tri-linear behavior has been presumed based on the results of cylinder compression tests,
Figure 7. As evidenced in this figure, the grout stress-strain diagram linearly moves until a
strain value less than 0.001, after which it nonlinearly reaches its climax at an almost strain
and stress of 0.002 and 35 MPa, and then the sample failure occurs. Finally, the soil was
modeled as an elastic-perfectly plastic continuum taking into account the failure criterion of
Mohr-Coulomb. The strata’s characteristics encompassing depth, type, density, elastic
Page 9 of 50
https://mc06.manuscriptcentral.com/cgj-pubs
Canadian Geotechnical Journal

Draft
10
modulus, cohesion, and internal friction angle are presented in Table 6. These parameters
have been determined using laboratory and in-situ tests.
To simulate their interface, the interaction between micropile and grout has been supposed
as a tie constraint. Besides, the behavior of interaction between the grout and the surrounding
soil was modeled in two different ways. In the former case, a tie behavior between the grout
and cohesive soil has been chosen. In this case, the master surface with higher stiffness is
completely constrained into the slave surface with less stiffness, and their degrees of freedom
are completely fixed together (Hibbett et al. 1998). A “hard” contact behavior, which limits
the penetration of the slave surface (soil) into the master surface (grout) and precludes the
formation of tension along their interface, was used to model the cohesive soil behavior.
In the latter one, on the other hand, normal and tangential frictional behaviors were
considered between the grout and granular soil. In order to model the tangential behavior of
soil-grout, the penalty method has been used for frictional behaviors based on the Coulomb
friction model. In this model, both the surfaces are capable of bearing shear stresses up to a
certain amount prior to their sliding threshold. It is necessary in modelling the penalty
behavior that the friction angle and the maximum shear stress prior to sliding would be
determined. It should be mentioned that the friction angle between the grout and the soil for
the granular layers in tension and compression were adopted as 29° and 39°, respectively.
Accordingly, the shear stress at the interface can be modeled using the following equations
(Hibbett et al. 1998):
τ�� = μp(1) where μ is friction coefficient and p, at initial stress conditions, equals to a normal stress
acting on the contact surface, both of which, in at-rest stress conditions, are computed as
follows:
Page 10 of 50
https://mc06.manuscriptcentral.com/cgj-pubs
Canadian Geotechnical Journal
Draft
11
p = k�σ�(2)
� = tan �(3)
in these equations, k� is the coefficient of horizontal soil pressure at rest, σ� is the effective
stress along the surface, and δ is the friction angle of contact surface.
Geometric modeling
Due to the fact that two types of loading (compression and tension) were conducted during
the field experiments, and because of the symmetry of the current model, a half-model was
considered for the calibration so as to reduce the computational cost. In the modeling process,
a total number of 84570 elements type C3D8R with an average size of 0.2 m have been used;
it is a hexahedral (with six sides and eight nodes) continuum stress-displacement element
with first-order interpolation. Furthermore, reduced-integration elements were used along
with hourglass control in order to decline the length of data processing.
For mesh generation and reduction of boundaries effects, the recommendation by
(Helwany 2007), which is used to model a pile, was considered. In this case, the soil element
will extend up to 30 times the pile diameter from both sides, as well as 0.75 times the pile
length from the micropile tip. The node movements normal to all boundary surfaces are
restricted except for those on the top surface. Moreover, the dimensions and the optimum
arrangement of the meshes have been computed by performing sensitivity analyses to
eliminate the influence of these parameters on the FEM results. Figure 8 indicates a
representation of the mesh configuration for the 3D model of the micropile.
Calibration for single micropile
As stated earlier, after driving a micropile into the ground by impact energy, the grouting
task has to be started. During and after this operation, the grout would exit through the holes
existing on the body of micropile, penetrate the soil surrounding the micropile, and lead to an
Page 11 of 50
https://mc06.manuscriptcentral.com/cgj-pubs
Canadian Geotechnical Journal

Draft
12
increase in the micropile diameter. The grout geometry adjacent to the micropile casing was
modeled based on the suggestion of (Abd Elaziz 2012).
According to him, the numerical model can be calibrated by accurately modeling the
micropile and the surrounding soil, altering the injection diameters of the model, and finally
comparing the outputs of each scenario to the field data. To this end, the following conditions
must be met so that the calibrated model would be acceptable, and the effective injection
diameter could precisely be determined (Abd Elaziz 2012) :
• The values of injection diameters are obligated to be the same for all the three
loaded micropiles.
• If the results for two injection diameters were equivalent, the smaller diameter
must be selected.
It is noteworthy with regard to the stratification of the ParehSar zone soil that because the
bottom section of the driven micropile is situated within a saturated sandy soil, it is
anticipated that the injection diameter in this layer would be greater than those in others.
Considering the statements mentioned above, the most appropriate injection diameter based
upon the calibration results are exemplified in Figure 9. The calibration results between the
field and numerical outputs can be observed in Figure 10. As depicted in this figure, the
numerical results are in good agreement with the field ones.
Verification for micropile group
Since no field tests on a micropiled raft were performed during the current research, it was
of great significance to verify the numerical model presented in the next section by the results
of a current experiment. Thus, due to an adequate resemblance between the conditions of the
present study and those of (Abd Elaziz 2012; Abd Elaziz and El Naggar 2014b), the outputs
of their field tests and numerical model have been selected as the relevant benchmarks.
Page 12 of 50
https://mc06.manuscriptcentral.com/cgj-pubs
Canadian Geotechnical Journal

Draft
13
In their field tests, two hollow-bar micropiles with the interval of 776 mm were installed
into the ground and subsequently loaded. In order to simulate the compressive loading test,
the soil was modeled as an isotropic elastic-perfectly plastic continuum with the failure load
defined by the Mohr-Coulomb yield criterion. Figures 11 shows the dimensions, boundaries
and 3D mesh generation of the model of the micropile group. The elements used in this
model were type linear hexahedral and 80873 by number. Figure 12 illustrates the results of
the field and numerical models, indicating the sufficient accuracy of the present model.
Parametric study
In this section, as the focus of the current research, the performance of micropiles under
uplift loads will be comprehensively investigated. As mentioned previously, the research and
studies carried out on micropile groups so far have mostly been limited to investigating their
behavior versus compressive loads. The reason is due to the fact that the design procedure in
many structures is performed in a way so as to virtually eliminate the risk of foundation
uplift.
In foundations of lattice towers, however, the foundation of each leg can predominantly be
subjected to the uplift or compressive loading due to various circumstances of wind blowing
or the location of tower within the transmission line. Accordingly, all the micropiles within
each foundation will also undergo pure uplift loads. In order to take this into account, in this
paper, the performance of a single micropile within groups utilized beneath 230 kV four-
circuit power transmission towers has been modeled and studied under uplift loads. In this
regard, the efforts are classified into two different parts: a) uplift capacity of individual
micropile within the group, and b) interaction of micropiles in group for calculating the
upward movement.
Capacity of single micropile in group
Page 13 of 50
https://mc06.manuscriptcentral.com/cgj-pubs
Canadian Geotechnical Journal

Draft
14
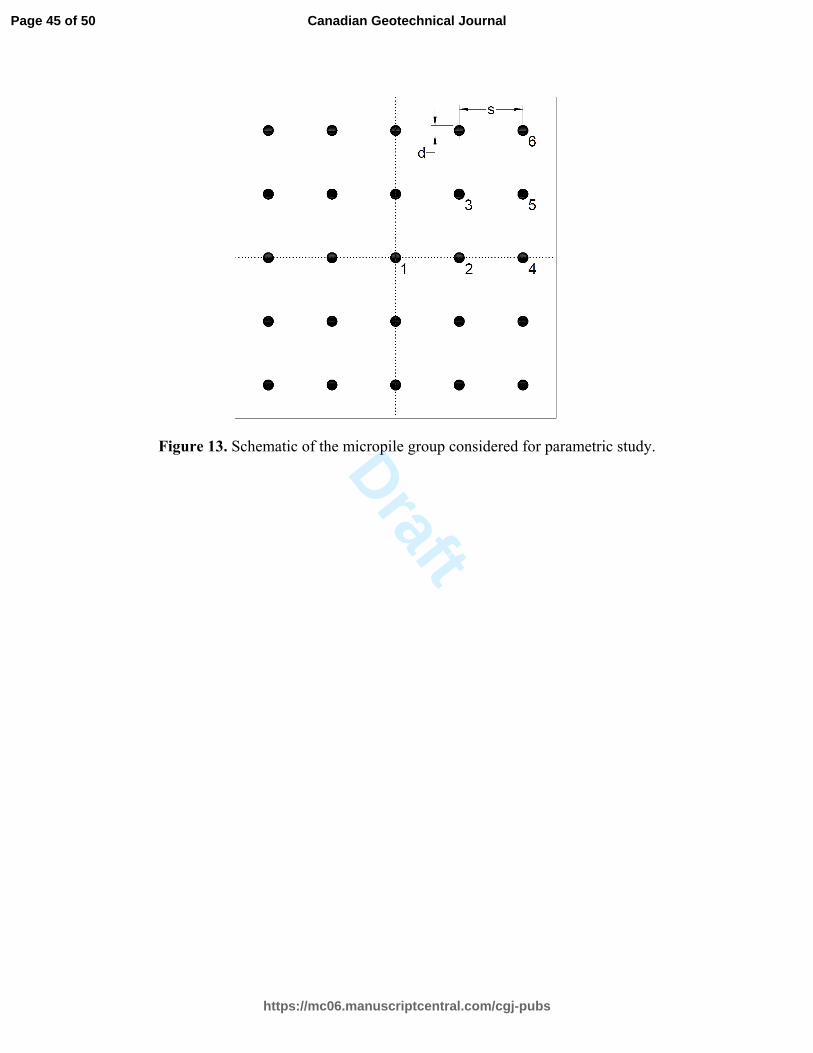
For investigation of the capacity of micropiled raft as the foundation of power
transmission towers, the configuration of micropiles in the raft has been assumed similar to
Figure 13. The reason hiding behind this arrangement is that the effect of micropiles in
adjacent rows on the results of analysis would be perceptible. As a consequence, to evaluate
the uplift capacity of each micropile, the micropile #1 is loaded in two separate conditions: a)
when the other micropiles are activated, and b) in the case where the other micropiles are
excluded. The aim of doing so is to compare the uplift capacity of micropiles in two cases of
within the group and out of it together. For the parametric study in this section, the space
between two micropiles (with diameter of d) is symbolized as s.
It should be remarked that on account of the symmetry of the micropile group, only a
quarter of Figure 13 has been modeled. There are two types of interactions for the raft of
micropiled foundations, raft-soil and raft-soil-micropile (Lee and Moon 2017). Due to the
fact that the raft in the current research undergoes merely uplift forces, and more importantly,
the raft cannot have any contributions in lowering the upward movement of the foundation in
terms of interaction with soil, its effect has been excluded from simulations similar to (Abd
Elaziz and El Naggar 2014b; Clancy and Randolph 1993; Mandolini and Viggiani 1997;
Poulos 1968; Poulos 1971,1979,1988; Sharnouby and Novak 1990). In addition, the
dimensions of the micropile and the grouted zone were determined in keeping with the results
of the micropile located inside the soft soil of ParehSar site. It was thus required to evaluate
the impact of major parameters on the FEM results, and hence various parametric studies
were completed based on two categories of the characteristics below.
• Properties of the surrounding soil: for evaluation of the effect of the cohesive soil
characteristics on the uplift capacity, three different types of soil with undrained shear
strength of 60, 90, and 120 kPa were adopted. In this survey, the length-to-diameter
ratio of micropile has consistently been considered as 160 for all the samples; and
Page 14 of 50
https://mc06.manuscriptcentral.com/cgj-pubs
Canadian Geotechnical Journal
Draft
15
• Length-to-diameter ratio: the magnitudes of this parameter were selected as 40, 80,
and 120, which are much applicable in actual projects. Furthermore, the undrained
shear strength of the soil for all simulations has been chosen as 60 kPa.
It is significant to state that during the course of parametric studies, keeping the other
parameters constant was of great importance so that the distinct effect of each factor would
be carefully assessed. In all the analyses, the Poisson’s ratio was considered as 0.499.
Moreover, the values of elastic modulus have been figured by considering the following
common equation with regard to normally-consolidated soils (Briaud 2013).
� = 500��(4)
Where E is soil elastic modulus, and Su is the undrained shear strength of soil.
Figure 14 (a)-(c) shows the semi-bilinear load-displacement graphs in relation to the
performance of a single micropile placed in the micropile group under uplift loading
conditions, respectively for three different spacing-to-diameter ratios (s/d) of 3, 4.5, and 6, as
well as three various soil undrained shear strength of 60, 90, and 120 kPa. Obviously, in all
these graphs, the uplift capacity of each loaded micropile in the group is approximately equal
to that of an isolated micropile out of the group.
It can be concluded from these graphs that in all cases, the effect of “s/d ratio” compared
to that of soil undrained shear strength on the failure load is practically negligible. For
instance, noting to Figure 14 (a), if the distance among the micropiles is multiplied by two,
the uplift capacity will be decreased within 5%. Intensifying the soil undrained shear strength
by the same amount, on the other hand, would result in a failure load nearly two times the
original one, Figure 14 (a) and (c). This reveals the significance of the interaction between
soil and the grout around the micropile. In other words, the more the soil shear strength, the
Page 15 of 50
https://mc06.manuscriptcentral.com/cgj-pubs
Canadian Geotechnical Journal

Draft
16
more the adhesion between the two contact surfaces, and as a result the more uplift capacity
will be obtained.
Moving to the second phase of parametric study of this part, the results of uplift loading on
micropile groups are illustrated in Figure 15. In this figure, substantial factors are three
different spacing-to-diameter ratios of 3, 4.5, and 6 in conjunction with three diverse length-
to-diameter ratios of 40, 80, and 120 to increase the practicality of the outputs. Similar to the
first case, the uplift capacity of an internal micropile (within the group) is equal to that of an
external one (isolated from the group).
It can thus be established that an efficiency coefficient equal to one could be designated to
the uplift capacity of a micropile within the group subjected to uplift loading conditions. It is
noteworthy that a similar conclusion has been drawn by (Abd Elaziz and El Naggar 2014b)
for the bearing capacity of micropile groups under compressive loading conditions.
According to the recommendation of existing standards such as (FHWA 2000), in the case
where the efficiency coefficient is greater than or equal to one, this coefficient must be
assumed equal to one.
In addition, the uplift capacity is not much influenced by the “s/d ratio” in various length-
to-diameter proportions. On the contrary, the latter ratio considerably affects the failure load
ranging from 8.6 to 340 kN corresponding to the length-to-diameter ratios of 40, 80, and 120,
respectively displayed in Figure 15 (a) to (c). The reason is that the effective length of
micropile would increase, leading to a better interaction of soil and grout with more plausible
failure sections.
Micropile performance in group
In order to have an inclusive understanding of the behavior of a single micropile in group
under uplift loading conditions, the interaction among them based on different values of
Page 16 of 50
https://mc06.manuscriptcentral.com/cgj-pubs
Canadian Geotechnical Journal

Draft
17
spacing should be of high priority. In other words, this section aims to deal with the upward
movement of each micropile within the group in terms of soil strength, arrangement of
micropiles and interaction parameters by using a concept called interaction factor. It should
be declared that only the impacts of the micropiles #1 to #6 depicted in Figure 13 will be
investigated on the numerical results. This is due to the fact that since there exists a symmetry
in the micropiled raft, the outputs of the other micropiles will ideally be the same.
In this regard, the parametric studies have been performed in the following situations:
• Characteristics of the surrounding soil: six different types of soil with undrained shear
strength of 20, 30, 60, 90, 120, and 150 kPa were studied to gain an insight into the
effect of this parameter on the generated interaction. In this investigation, the length-
to-diameter ratio of 160 as well as the tie constraint between soil and grout has been
considered for all the numerical models in a consistent manner;
• Ratio of length to diameter: three magnitudes of 40, 80, and 120, which are relatively
prominent in actual projects, were adopted. Similar to the upper item, the
characteristics of soil (Su=60 kPa) and fully bond grout-soil interface have been kept
constant for all the samples; and
• Interface specifications: three adhesion coefficients of � = 0.8,0.9"#$1.0 were
used. The length-to-diameter ratio of 160 and soil properties (Su=60 kPa) were
identical for every simulation.
For taking the adhesive behavior between soil and grout into consideration in parametric
studies, tangential and normal behaviors existing in ABAQUS software were utilized. In
order to model the normal behavior, a hard contact was defined so that the contact elements
would not interpenetrate. Furthermore, the stress limit has been used to simulate the adhesive
behavior in tangential direction (Kim et al. 2007; Theinat 2015). In this regard, the internal
Page 17 of 50
https://mc06.manuscriptcentral.com/cgj-pubs
Canadian Geotechnical Journal

Draft
18
friction angle must be considered a great number so as to completely replicate the adhesive
behavior in ABAQUS environment.
Equation (2), which is related to the displacement of a micropile group, has been used to
approximate the intensity of interactions in this research. The loading is exerted on the
micropile #1 (Figure 13), and the displacement of neighboring micropiles, #2 through #6, is
recorded at the ultimate load on the micropile #1. The ratio between the displacement of each
micropile due to the loaded micropile (#1 in this case) and that of itself alone under the same
load is considered as the interaction factor, αv. The simplified form of this parameter is (Abd
Elaziz and El Naggar 2014b):
�% = �&' ( �)*+
*,-(5)
Where �% and �&' are the upward movements of group and single micropile at the average
load applied to an individual micropile of group, respectively. The usage of the methodology
for calculating the settlement of pile groups has comprehensively been indicated by (Poulos
2006; Poulos and Davis 1980)
Figure 16 (a) to (e) exhibits the interaction factor in terms of the ratio s/d based on various
soil undrained shear strength for the micropiles #2 through #6. As shown in these graphs,
parallel to the improvement of soil shear strength, the interaction factor significantly
diminishes. Additionally, the variations of interaction factor in soft soils are steeper with
respect to that in soils with suitable strength characteristics. In fact, changing the spacing of
micropiles in stiff clay soils is not expected to cause so much discrepancy in the upward
movement of adjoining micropiles. Contrarily, in soft clay soils, the upward movement of
these micropiles is highly dependent on the spacing.
Page 18 of 50
https://mc06.manuscriptcentral.com/cgj-pubs
Canadian Geotechnical Journal

Draft
19
It can be observed in the graphs of Figure 16 that overall in the ratio s/d domain of 3-15,
the interaction factor alters in the range 0.025-0.375. Interestingly, this range has also nearly
been obtained by (Abd Elaziz and El Naggar 2014b) in the case of compression loading
imposing on a micropiled raft, while the s/d ratio varies between 2.5 and 15 for stiff to soft
soils. It is also understandable that the relationship between interaction factors and s/d ratio
seems to be linear for soils with undrained shear strength more than 60 kPa the less of which
devotes to the soils that this relationship for them is nonlinear.
The graphs represented in Figure 16 have been reproduced once more in Figure 17, but
this time based upon diverse length-to-diameter ratios. As can be seen in Figure 17 (a) to (e),
for example at the point of s=3d on the horizontal axis, the less the ratio of length to diameter
is, the more the interaction factor and the effective contact have been obtained. The reason
behind this behavior is due to the fact that the micropiles with less length reach their bearing
capacity at strains much less than larger ones do. Consequently, the soil surrounding shorter
micropiles still behaves elastically in many locations due to the induced smaller strains and,
as a result, will not enter into the plastic phase. Thus, since the soil in this case acts elastically
in many points, it is expected that the micropiles would have a more pronounced impact on
each other, and the values of interaction factor would be higher. However, in some cases such
as Figure 17 (e), this trend is absolutely changed by increasing the ratio s/d, and in some
others, the results converge, as shown in Figure 15 (b) to (d). It can be found that by choosing
an optimum spacing, the length of micropiles can be substantially reduced. While the
interaction factors, regardless of the soil strength, are different from 0.025 to 0.36 in Fig. 17,
it is noteworthy that (Abd Elaziz and El Naggar 2014b) have calculated this parameter
between 0.025 and almost 0.3 for stiff soil as well as 0.0375 and 0.375 for soft soil. Although
in their study, the trend of diagrams becomes completely reversed as the ratio s/d increases.
Moreover, the ratio l/d in their study varied from 30 to 75, whereas it has been considered a
Page 19 of 50
https://mc06.manuscriptcentral.com/cgj-pubs
Canadian Geotechnical Journal

Draft
20
variable between 40 and 160 in the current research. This difference is reasonable because of
the fact that the micropiles utilized in the present study were practically twice those utilized
by (Abd Elaziz and El Naggar 2014b) in terms of length.
Figure 18 illustrates the interaction factor versus the ratio s/d considering three different
values for grout-soil adhesion. It should be mentioned that in order to avoid generating
repetitive outputs, the numerical results of micropiles #5 and #6 were omitted. Moreover, a
proper linear equation can be fitted to the scattered data of these graphs, specifically up until
the point s=12d. The reason of interaction factors varying linearly with adhesion coefficients
is that the displacement generated at the element interface is negligible; because the grout and
soil have been clamped together virtually as a fixed constraint before the sliding threshold
occurs at the micropiles interaction. As the adhesion coefficient in the system modeled has
always been less than or equal to one, sliding along the micropile skin will take place prior to
when the soil reaches its plastic bearing capacity. Therefore, the critical shear stress will be
the determinant of bearing capacity and interaction factor, and it is expectable that it would
vary relatively linearly in terms of the adhesion coefficient. As shown in Figure 18 (a) to (c),
given the position of data points for each grout-soil adhesion, it is expected that the relation
between the interaction factor and this parameter would also be linear for different
amplitudes of spacing.
Generally, noting to Figures 15-17, the uplift capacity and upward movement of a
micropiled-raft foundation cannot be accurately determined by merely considering
neighboring micropiles of the first rows surrounding the loaded one, and the micropiles
located in next rows must also be taken into account in calculations. This is even more
significant especially in the case where the intervals among micropiles are relatively low. For
instance, according to Fig 16, in the micropile group with ./$ = 3 and undraind shear
strength of 20 kPa, the interaction factor for the micropiles #2 and #4 is 0.37 and 0.34,
Page 20 of 50
https://mc06.manuscriptcentral.com/cgj-pubs
Canadian Geotechnical Journal

Draft
21
respectively. The closeness of these values indicates that the next rows of micropiles have
considerable effect on the loaded micropile in the group. The interaction factors presented in
this section will obviate the need for performing time-consuming simulations and, as a result,
are beneficial for civil engineers to have an assessment of the upward movement difference
as well as uplift loading distribution among micropiles, respectively for foundations with
flexible and rigid caps. The whole settlement of groups with rigid caps can also be computed
using this approach.
Conclusions
As explained earlier, uplift loads prevail over the other loads in foundations of lattice
towers in power transmission lines, particularly under extreme wind loads conditions.
Nevertheless, the performance of micropiles under such loading circumstances has not
sufficiently been appreciated, especially in terms of a comprehensive parametric study.
In this research, due to the economical and practical benefits of micropiled raft respect to
pad and chimney foundations, field and numerical assessments were carried out on an
isolated micropile and a micropiled-raft foundation, respectively. First, a number of
micropiles were implemented into the project site in the vicinity of ParehSar power plant for
loading experimentation. In the next phases, a numerical model was developed, calibrated
and verified based on the outputs of the field tests of the current study and elsewhere along
with a detailed parametric study on important factors influencing the micropiled raft
behavior. The key outcomes of this study can be mentioned as follows:
1. Considering the cohesive soils with various strength conditions, the ultimate uplift
capacity of a single micropile inside the raft is greater or equal to that of an isolated
one. In other words, the value of efficiency coefficient of micropiles subjected to
uplift loads would be more than one in foundations of power transmission towers.
Page 21 of 50
https://mc06.manuscriptcentral.com/cgj-pubs
Canadian Geotechnical Journal

Draft
22
2. In different length-to-diameter ratios, the ultimate uplift capacity of an individual
micropile within the group is expected to be more than that of the same one outside
the raft. In the same way, it can be concluded that by changing the length-to-diameter
proportion in cohesive soil, the efficiency coefficient does not vary and can be
assumed equal to one.
3. The interaction factor of micropiles declines with the increase of spacing. This
reduction with regard to soft soils is remarkably larger than that in the case of stiff
cohesive soils. The reason for this refers to the ratio between the displacement
difference and spacing of two adjacent micropiles (deformed shape of soil media). As
the displacement difference in soft soils is more than that in stiff soils, the less
reduction rate of interaction factors in terms of spacing in stiff soils is justifiable.
4. With the improvement of strength characteristics of cohesive soil, the interaction
factor will decrease. This means that micropiles in stiffer soils have less influence on
their adjacent ones. This is because the bearing capacity of each micropile in terms of
soil interaction increases, making them less dependent on each other. In other words,
when soil becomes stiff, its impact on the additional settlement of a micropile due to
its neighbors will reduce significantly more than the case where that micropile is
loaded alone.
5. By growing the length-to-diameter ratio in low magnitudes of spacing, the interaction
factor is increased. However, in greater intervals, this proportion and the trend of
results would not remain constant.
6. The grout-soil adhesion has virtually a linear relationship with the interaction factor;
this fact has been demonstrated in all the adjacent micropiles.
7. According to the results of interaction factor in micropiles, it seems that in addition to
the micropiles adjoining the loaded one, those in the next rows must also be
Page 22 of 50
https://mc06.manuscriptcentral.com/cgj-pubs
Canadian Geotechnical Journal

Draft
23
considered when calculating the micropile ultimate uplift capacity and the raft uplift
movement.
Acknowledgment
The authors are grateful to the Thermal Power Plants Holding Company for their financial
support with regard to this research project. Thanks also go towards Dr. Ahmed Yehia Abd
Elaziz for his helpful comments regarding verifying the numerical model of the present study.
References
Abd Elaziz, A.Y. 2012. Performance of hollow bar micropiles under axial and lateral loads in
cohesive soils. The University of Western Ontario.
Abd Elaziz, A.Y., and El Naggar, M.H. 2014a. Geotechnical capacity of hollow-bar
micropiles in cohesive soils. Canadian Geotechnical Journal 51(10): 1123-1138.
Abd Elaziz, A.Y., and El Naggar, M.H. 2014b. Group behaviour of hollow-bar micropiles in
cohesive soils. Canadian Geotechnical Journal 51(10): 1139-1150.
Abdelrahman, G., Shaarawi, E., and Abouzaid, K. 2003. Interpretation of axial pile load test
results for continuous flight auger piles. In Emerging Technologies in Structural
Engineering, Proceedings of the 9th Arab Structural Engineering Conference, Abu
Dhabi. pp. 791-802.
Akgüner, C., and Kirkit, M. 2012. Axial bearing capacity of socketed single cast-in-place
piles. Soils and Foundations 52(1): 59-68.
Alnuaim, A., El Naggar, H., and El Naggar, M. 2014. Performance of micropiled raft in sand
subjected to vertical concentrated load: centrifuge modeling. Canadian Geotechnical
Journal 52(1): 33-45.
Alnuaim, A., El Naggar, M., and El Naggar, H. 2015. Performance of micropiled raft in clay
subjected to vertical concentrated load: centrifuge modeling. Canadian Geotechnical
Journal 52(12): 2017-2029.
Alnuaim, A.M., El Naggar, M.H., and El Naggar, H. 2016. Numerical investigation of the
performance of micropiled rafts in sand. Computers and Geotechnics 77: 91-105.
ASTM-D1143/D1143M-07(2013). Standard Test Methods for Deep Foundations Under
Static Axial Compressive Load, ASTM International, West Conshohocken, PA.
ASTM D3689/D3689M-07(2013)e1, S.T.M.f.D.F.U.S.A.T.L., ASTM International, West
Conshohocken, PA, 2013.
Benslimane, A., Juran, I., Hanna, S., Drabkin, S., Perlo, S., and Frank, R. 1998. Seismic
Retrofitting Using Micropile Systems Centrifugal Model Studies. In 4th International
Page 23 of 50
https://mc06.manuscriptcentral.com/cgj-pubs
Canadian Geotechnical Journal

Draft
24
Conference on Case Histories in Geotechnical Engineering. Missouri University of
Science and Technology, United States. pp. 1260-1268.
Briaud, J.L. 2013. Geotechnical Engineering: Unsaturated and Saturated Soils. Wiley.
Butler, H.D., Hoy, H.E., and Division, U.S.F.H.A.I. 1976. The Texas Quick-load Method for
Foundation Load Testing: Users Manual. Department of Transportation, Federal
Highway Administration, Offices of Research and Development, Implementation
Division.
Choi, C., and Cho, S.-D. 2010. Field verification study for micropile load capacity. In Proc.
of 10th ISM Workshop. pp. 1-10.
Clancy, P., and Randolph, M. 1993. An approximate analysis procedure for piled raft
foundations. International Journal for Numerical and Analytical Methods in
Geomechanics 17(12): 849-869.
Davisson, M. 1972. High capacity piles. Proceedings, Soil Mechanics Lecture Series on
Innovations in Foundation Construction: 81-112.
Décourt, L. 2008. Loading tests: interpretation and prediction of their results. In From
Research to Practice in Geotechnical Engineering. pp. 452-470.
Elkasabgy, M., and El Naggar, M.H. 2014. Axial compressive response of large-capacity
helical and driven steel piles in cohesive soil. Canadian Geotechnical Journal 52(2):
224-243.
Fellenius, B.H. 1980. The analysis of results from routine pile load tests. Ground Engineering
13(6): 19-31.
Fellenius, B.H. 1996. Basics of foundation design: a geotechnical textbook and a background
to the UniSoft programs. BiTech Publishers Ltd.
FHWA. 2000. Micropile Design and Construction Guidelines— Implementation Manual.
FHWA Publication No FHWA-SA-97-070, US Department of Transportation,
McLean, VA, p. 376.
Fuller, F.M., and Hoy, H.E. 1970. Pile load tests including quick-load test method,
conventional methods, and interpretations. Highway Research Record(333).
Gilchrist, J.M. 1985. Load tests on tubular piles in coralline strata. Journal of Geotechnical
Engineering 111(5): 641-655.
Helwany, S. 2007. Applied Soil Mechanics with ABAQUS Applications. John Wiley &
Sons.
Hibbett, Karlsson, and Sorensen. 1998. ABAQUS/standard: User's Manual. Hibbitt, Karlsson
& Sorensen.
Huang, Y., Hajduk, E.L., Lipka, D.S., and Adams, J.C. 2007. Micropile load testing and
installation monitoring at the CATS Vehicle Maintenance Facility. In Contemporary
Issues In Deep Foundations. ASCE. pp. 1-10.
Page 24 of 50
https://mc06.manuscriptcentral.com/cgj-pubs
Canadian Geotechnical Journal

Draft
25
Kershaw, K.A., and Luna, R. 2014. Full-Scale Field Testing of Micropiles in Stiff Clay
Subjected to Combined Axial and Lateral Loads. Journal of Geotechnical and
Geoenvironmental Engineering 140(1): 255-261. doi: doi:10.1061/(ASCE)GT.1943-
5606.0000968.
Kim, N.-K., Park, J.-S., and Kim, S.-K. 2007. Numerical simulation of ground anchors.
Computers and geotechnics 34(6): 498-507.
Lee, S., and Moon, J.-S. 2017. Effect of interactions between piled raft components and soil
on behavior of piled raft foundation. KSCE Journal of Civil Engineering 21(1): 243-
252.
Luna, R., Dixon, D.T., Kershaw, K.A., and Siegel, T.C. 2015. Monitoring Micropile
Foundations of Bridge during Construction. In IFCEE 2015.
Mandolini, A., and Viggiani, C. 1997. Settlement of piled foundations. Géotechnique 47(4):
791-816.
O'Neill, M.W., Reese, L.C., Infrastructure, U.S.F.H.A.O.o., and Soils, A.A. 1999. Drilled
Shafts: Construction Procedures and Design Methods. ADSC, the International
Association of Foundation Drilling.
Poulos, H. 1968. Analysis of the settlement of pile groups. Geotechnique 18(4): 449-471.
Poulos, H. 2006. Pile group settlement estimation—Research to practice. In Foundation
Analysis and Design: Innovative Methods. pp. 1-22.
Poulos, H.G. 1971. Behavior of laterally loaded piles II. Pile groups. Journal of Soil
Mechanics & Foundations Div.
Poulos, H.G. 1979. Group factors for pile-deflection estimation. Journal of Geotechnical and
Geoenvironmental Engineering 105(ASCE 15032).
Poulos, H.G. 1988. Modified calculation of pile-group settlement interaction. Journal of
geotechnical engineering 114(6): 697-706.
Poulos, H.G., and Davis, E.H. 1980. Pile Foundation Analysis and Design. Wiley.
Sadek, M., Shahrour, I., and Mroueh, H. 2006. Influence of micropile inclination on the
performance of a micropile network. Proceedings of the Institution of Civil Engineers
- Ground Improvement 10(4): 165-172.
Shahrour, I., and Juran, I. 2004. Seismic behaviour of micropile systems. Proceedings of the
Institution of Civil Engineers Ground Improvement 7(1): 1-12.
Sharnouby, B.E., and Novak, M. 1990. Stiffness constants and interaction factors for vertical
response of pile groups. Canadian geotechnical journal 27(6): 813-822.
Theinat, A.K. 2015. 3D numerical modelling of micropiles interaction with soil & rock.
Thompson, F., Salisbury, N., Khattak, A., Hastings, A., and Foster, M. 2009. Integration of
Optimum, High Voltage Transmission Line Foundations. Electrical Transmission and
Substation Structures 2009: Technology for the Next Generation: 94.
Page 25 of 50
https://mc06.manuscriptcentral.com/cgj-pubs
Canadian Geotechnical Journal

Draft
26
List of symbols
l = micropile length
d = micropile diameter
E = soil elastic modulus
s = space between two micropiles
�% = upward movement of group
�&' = upward movement of single micropile
Su = undrained shear strength of soil
α = grout-soil adhesion coefficient
αv = interaction factor among micropiles
µ = friction coefficient of the contact surface
δ = friction angle of the contact surface
τin = shear stress at soil-grout interface
p = normal stress acting on contact surface
k0 = coefficient of horizontal soil pressure at rest
σv = effective stress along the contact surface
Page 26 of 50
https://mc06.manuscriptcentral.com/cgj-pubs
Canadian Geotechnical Journal

Draft
27
List of Figure captions
Figure 1 Subsurface conditions of ParehSar power plant
Figure 2 Equipment required for micropile execution process
Figure 3 Phases of Installation of micropiles used in Iran
Figure 4 a) Schematic and b) photo indicating the arrangement of micropiles within their
implementation site
Figure 5 a) Typical test setup of a micropile experiment and b) hydraulic jack and
displacement gauges
Figure 6 The outputs of a) compressive and b) uplift loading experiments on the micropiles
C1 and T1, respectively
Figure 7 The compressive stress-strain relationship of the injected grout according to the
results cylinder compression tests along with its simplified form
Figure 8 A 3D mesh for the half model of the micropile in the ParehSar site
Figure 9 Dimensional characteristics of the micropile in the ParehSar site
Figure 10 Calibration results of the micropile numerical model and the field loading tests in
the ParehSar site: a) compression and b) uplift
Figure 11. a) 3D mesh generation along with distances towards the model adjacent
boundaries; b) general dimensions of micropile in the model
Figure 12. Verification of the present model by the field data of (Abd Elaziz and El Naggar
2014b) within the elastic phase under compression.
Figure 13 Schematic of the micropile group considered for parametric study
Page 27 of 50
https://mc06.manuscriptcentral.com/cgj-pubs
Canadian Geotechnical Journal

Draft
28
Figure 14 uplift load-displacement graphs for the micropiles located inside the soil with Su=
a) 60, b) 90, and c) 120 kPa
Figure 15 uplift load-displacement relationships for the micropiles with length-to-diameter
ratios of a) 40, b) 80, and c) 120 (Su = 60 kPa = constant)
Figure 16 Interaction factors at the uplift ultimate load of micropile #1 based upon different
soil cohesion coefficients for the micropiles a) #2, b) #3, c) #4, d) #5, and e) #6
Figure 17 Interaction factors at the uplift ultimate load of micropile #1 based on various
length-to-diameter ratios for the micropiles a) #2, b) #3, c) #4, d) #5, and e) #6
Figure 18 Interaction factors (�)) at the uplift ultimate load of micropile #1 based on various
magnitudes of adhesion (�) for the micropiles a) #2, b) #3, and c) #4
Page 28 of 50
https://mc06.manuscriptcentral.com/cgj-pubs
Canadian Geotechnical Journal

Draft
Table 1. Recent investigations regarding the performance of micropiles.
Year Researchers Details
1998 Benslimane
et al.
Summary: investigation of the earthquake loading response and soil-
micropile interaction behavior; centrifugal model tests on group and network
systems embedded in loose to medium dry sand; group effects were
investigated for different configurations and at different levels of loading.
Key consequences: the results indicate a positive group effect, which leads to
smaller bending moments and displacements in pile group compared to a
single micropile; fundamental frequency of micropile system is strongly
affected by the micropile system configuration.; the p-y curves for micropile
group obtained under strong shaking were found to be non-linear and with a
low damping.
2004 Shahrour
and Juran
Summary: numerical and experimental study of micropile seismic
performance; investigating the effect of the main controlling parameters of the
micropile–soil–structure system, such as the kinematic interaction, group
effect, influence of micropile inclination, and performance assessment of
micropile systems in liquefiable soils.
Key consequences: reduction in micropile bending moment in group
compared to a single micropile under seismic loading; improvement of group
performance including an increase in micropile systems stiffness and
reduction in shear and bending moment in raft using an inclined micropile
system.
2006 Sadek et al.
Summary: numerical modeling of micropile group under lateral and vertical
loads; the groups were constituted by two rows of micropile with opposite
inclination; finite-element analyses were carried out using PECPLAS code.
Key consequences: inclined micropiles lead to improvement of group
performance under both lateral and vertical loads; under lateral loading
conditions, the inclination of micropiles leads to sufficient mobilization of the
axial stiffness of micropiles, and subsequently results in an increase in the
lateral stiffness of the group as well as the reduction of both the shearing
forces and bending moments in micropiles.
2010 Choi and
Cho
Summary: Field verification study for micropile load capacity; two sets
(installed to the depth of soil and rock layers) of field compressive loading
test (loose silty sand for set 1 and loose silty sand and gravel to rock layer for
set 2); utilizing two micropiles with different types A and similar to C
(geotextile-pack-micropile).
Key consequences: More uniform distribution of unit frictional resistance at
soil layer in micropile type C than A; more bearing capacity (at least 20%) of
micropile type C than A. (A, B, C, D grouting types are determined according
to FHWA (2002) criteria. A: grout is placed under gravity head only, B:
pressure through casing, C: single global postgrout, D: multiple repeatable
postgrout).
2014 Kershaw
and Luna
Summary: Full-scale field testing (two axial-compression, two lateral-load,
and four combined-load tests) of micropiles type A in stiff-to-hard clay
underlain by weathered silty/sandy shale; applying a static axial load (half of
the ultimate failure load) and incrementally increasing the lateral load until
the maximum lateral deflection of 63 mm corresponding to the ratio of 0.6
between the lateral and axial load.
Key consequences: The ultimate axial and lateral capacity of micropiles;
applying a static axial load has a minimum impact on the micropile lateral
behavior in stiff clay soil.
2014a
Abd Elaziz
and El
Naggar
Summary: Full-scale field (stiff to very stiff silty clay to clayey silt underlain
by a sandy layer with traces of silt) testing (three compression and two
tension monotonic axial tests on four micropiles type B) and numerical
analysis (A two-dimensional axisymmetric finite element (FE) model);
calibrating the model by the experimental results leading to an appropriate
failure criterion for micropiles; performing a parametric study to investigate
the effect of some important parameters on the micropile capacity.
Key consequences:
�� = �0.91� �����1 + 0.35����� + 9 ������ for compressive loading;
�� = �0.91� �����1 + 0.0.275����� + 9 ����� for uplift loading.
PG: geotechnical capacity of micropile, cu: undrained shear strength of the
soil, d: micropile diameter, L: micropile length, Vinc: percentage increase in
micropile volume, Ainc: percentage increase in micropile cross section.
Page 29 of 50
https://mc06.manuscriptcentral.com/cgj-pubs
Canadian Geotechnical Journal

Draft
2014b
Abd Elaziz
and El
Naggar
Summary: Full-scale field study (four axial monotonic tests) on single
micropile and micropile group in stiff silty clay deposit as well as numerical
investigation using 3D FE analysis and calibrate-verify the model;
performing a parametric study to characterize the capacity and performance
of micropile groups.
Key consequences: Establishing the group efficiency of one and interaction
factor curves for evaluation of micropiles group capacity and response
(settlement) under vertical loading as well as the interaction between two
micropiles considering the spacing between them, the soil and pile properties,
and the slenderness ratio of micropile.
2014 Alnuaim et
al.
Summary: Five centrifuge tests at 50g acceleration on micropiled raft
located inside a sandy soil under a vertical point load; investigating the
impact of raft flexibility on its behavior by changing its thickness.
Key consequences: raft global and local settlements, raft contact pressure
and bending moment, raft-micropiles load shearing; 37% to 48% load bearing
of micropiles (reduction of raft contact pressure); applicability of Poulos-
Davis-Randolph (PDR) method for relatively stiff rafts, but not for flexible
ones (need correction factor).
2015 Alnuaim et
al.
Summary: Three centrifuge tests at 50g acceleration to assess the
performance of micropiled raft subjected to a concentrated vertical load in a
clayey soil (single micropile and single raft).
Key consequences: initial outputs similar to (Abd Elaziz and El Naggar
2014); considerable influence of micropiled raft on system axial stiffness
with respect to an isolated raft; reasonable accuracy of PDR method
prediction of axial stiffness of the relatively rigid raft (flexible rafts need
separate evaluation); converging the micropiled raft behavior to an isolated
raft as the ultimate load approaches its maximum value.
2016 Alnuaim et
al.
Summary: Conducting a numerical study including 78 FE analyses in order
to evaluate the performance of micropiled rafts located inside sand;
calibration and verification of the model by employing the results of
centrifuge tests; studying the effects of micropile spacing, raft thickness, sand
density, and loading type on the bearing pressure tolerable for the raft, its
axial stiffness, differential settlement, load shearing, bending moment, as
well as micropile skin friction.
Key consequences: Suitable capability of PDR method to predict the
stiffness of a rigid raft with up to 3% error of the calibrated FEA results
(adjustment factor has been introduced for flexible rafts); differential
settlement reduction of 20-40% for micropile spacing-to-diameter ratios less
than 10; higher impacts of micropiles on a flexible raft in the case of loadings
with uniform distribution.
Page 30 of 50
https://mc06.manuscriptcentral.com/cgj-pubs
Canadian Geotechnical Journal

Draft
Table 2. PSD properties and Atterberg limits of the soil at the ParehSar site.
Depth (m) Sample type
Classification
Particle size distribution (% passing) Atterberg limits (%)
76
mm
4.8
mm
0.075
mm
0.002
mm LL PL PI
2.5 Core sample 100 100 89 11
4 Undisturbed sample 48.6 27.5 21.1
7 Core sample 100 100 92 19
10 Core sample 100 100 86 15
13 Core sample 100 100 7 0
16 Core sample 100 100 25 4 36.5 25.3 11.2
Table 3. The results of consolidation and permeability tests on the soil at the ParehSar area.
Consolidation
Permeability (cm/s) Pressure range
(kg/cm2)
Coefficient of volume
compressibility
(cm2/kg×0.01)
Coefficient of consolidation
(cm2/s×0.001)
Pˊ mv cv k
0.25-0.5 5.0×10⁻² 1.2×10⁻³ 6.3×10⁻⁶
0.5-1 4.5×10⁻² 1.3×10⁻³ 6.0×10⁻⁶
1-2 3.1×10⁻² 1.2×10⁻³ 4.0×10⁻⁶
2-4 1.7×10⁻² 1.5×10⁻³ 2.6×10⁻⁶
4-8 9.0×10⁻² 2.0×10⁻³ 1.8×10⁻⁶
8-16 4.7×10⁻² 2.4×10⁻³ 1.1×10⁻⁶
Table 4. The results of UU triaxial tests on the soil at the ParehSar site.
Depth (m) Undrained shear
strength, su (kPa)
Undrained tangent
modulus, Eui (MPa)
Undrained secant
modulus, Eus (MPa)
2.5 19 16 7
7 18 32 20
10 20 26 11
Page 31 of 50
https://mc06.manuscriptcentral.com/cgj-pubs
Canadian Geotechnical Journal

Draft
Table 5. Failure criteria for determining the uplift and bearing capacity of micropiles.
Failure criterion Failure load definition Remark Uplift (kN) Compression (kN)
Davisson’s offset
limit
1972
Load corresponding to total settlement
at the pile head =!"
#$+
%
&'(+ 4�**�
P: applied load, L: micropile length,
A: section area of micropile, E: elastic
modulus, d: micropile diameter.
Davisson
(1972) 166 295
Reese and O’Neil
1988
Load corresponding to total
displacement = 5% d. FHWA (1988) 134 225
Butler and Hoy
1977
Load at the intersection of tangent
sloping at 0.14mm/kN and tangent to
initial straight portion of total
settlement curve.
NYSDOT
(2008) 148 284
Fuller and Hoy
1970
Minimum load for a rate of total
settlement of 0.14 mm/kN. FHWA (2005) 172 391
Table 6. Geotechnical properties of soil strata at the ParehSar area.
Depth (m) Soil type* Density
(kN/m3)
Elastic
modulus
(MPa)
Poisson’s
ratio
Cohesion
(kPa)
Internal
friction
angle (°)
Dilation
angle (°)
0-6.5 CL 19 20 0.45 17.5 2 0
6.5-11 CL 19 30 0.45 18 5 0
11-12 SM 20 50 0.35 10 35 5
12> SP-SM 20 60 0.3 1 40 10
*soil types have been categorized according to Unified Soil Classification System (USCS), CL: Lean clay, SM:
silty sand, SP -SM: poorly graded sand with silt.
Page 32 of 50
https://mc06.manuscriptcentral.com/cgj-pubs
Canadian Geotechnical Journal

Draft
Figure 1. Subsurface conditions of ParehSar power plant.
Page 33 of 50
https://mc06.manuscriptcentral.com/cgj-pubs
Canadian Geotechnical Journal

Draft
Figure 2. Equipment required for micropile execution process.
Driving equipment
Page 34 of 50
https://mc06.manuscriptcentral.com/cgj-pubs
Canadian Geotechnical Journal

Draft
Figure 3. Phases of Installation of micropiles used in Iran.
Page 35 of 50
https://mc06.manuscriptcentral.com/cgj-pubs
Canadian Geotechnical Journal

Draft
Figure 4. a) Schematic and b) photo indicating the arrangement of micropiles within their implementation site.
(a)
(b)
T1
Page 36 of 50
https://mc06.manuscriptcentral.com/cgj-pubs
Canadian Geotechnical Journal

Draft
Figure 5. a) Typical test setup of a micropile experiment and b) hydraulic jack and displacement gauges.
Page 37 of 50
https://mc06.manuscriptcentral.com/cgj-pubs
Canadian Geotechnical Journal

Draft
Figure 6. The outputs of a) compressive and b) uplift loading experiments on the micropiles C1 and T1, respectively.
(a) (b)
Page 38 of 50
https://mc06.manuscriptcentral.com/cgj-pubs
Canadian Geotechnical Journal

Draft
Figure 7. The compressive stress-strain relationship of the injected grout according to the results of cylinder compression tests along with its simplified form.
0
5
10
15
20
25
30
35
0 0.0005 0.001 0.0015 0.002 0.0025 0.003
Axia
l str
ess (
MPa
)
StrainTri-linear relationship Laboratory data
Page 39 of 50
https://mc06.manuscriptcentral.com/cgj-pubs
Canadian Geotechnical Journal

Draft
Figure 8. A 3D mesh for the half model of the micropile in the ParehSar site.
Page 40 of 50
https://mc06.manuscriptcentral.com/cgj-pubs
Canadian Geotechnical Journal

Draft
Figure 9. Dimensional characteristics of the micropile in the ParehSar site.
Page 41 of 50
https://mc06.manuscriptcentral.com/cgj-pubs
Canadian Geotechnical Journal

Draft
Figure 10. Calibration results of the micropile numerical model and the field loading tests in the ParehSar site: a) compression and b) uplift.
(a) (b)
Page 42 of 50
https://mc06.manuscriptcentral.com/cgj-pubs
Canadian Geotechnical Journal

Draft
Figure 11. a) 3D mesh generation along with distances towards the model adjacent boundaries; b) general dimensions of micropile in the model
(a) (b)
Page 43 of 50
https://mc06.manuscriptcentral.com/cgj-pubs
Canadian Geotechnical Journal

Draft
Figure 12. Verification of the present model by the field data of (Abd Elaziz and El Naggar 2014b) within the elastic phase under compression.
0
200
400
600
800
1000
1200
1400
1600
1800
0 5 10 15 20 25 30
Load
(kN
)
Group displacement (mm)
FE model (Abd Elaziz and El Naggar (2014b)) FE model (current research) Field data
Page 44 of 50
https://mc06.manuscriptcentral.com/cgj-pubs
Canadian Geotechnical Journal
Draft
Figure 13. Schematic of the micropile group considered for parametric study.
Page 45 of 50
https://mc06.manuscriptcentral.com/cgj-pubs
Canadian Geotechnical Journal

Draft
Figure 1
14. Uplift loa
ad-displacem
ment graphs 60, b) 90
for the micr0, and c) 120
ropiles locate0 kPa.
ed inside thee soil with Suu= a)
Page 46 of 50
https://mc06.manuscriptcentral.com/cgj-pubs
Canadian Geotechnical Journal

Draft
Figure
e 15. Uplift lraload-displacatios of a) 40
cement relati0, b) 80, and
onships for td c) 120 (Su =
the micropil= 60 kPa = c
les with lengconstant).
gth-to-diame
eter
Page 47 of 50
https://mc06.manuscriptcentral.com/cgj-pubs
Canadian Geotechnical Journal

Draft
Figure 1
16. Interactiocohesion c
on factors at coefficients
the uplift ulfor the micr
timate load opiles a) #2,
of micropile, b) #3, c) #4
e #1 based up4, d) #5, and
pon differend e) #6.
nt soil
Page 48 of 50
https://mc06.manuscriptcentral.com/cgj-pubs
Canadian Geotechnical Journal

Draft
Figure 1
17. Interactioto-diame
on factors at eter ratios fo
the uplift ulor the microp
ltimate load piles a) #2, b
of micropileb) #3, c) #4,
e #1 based ond) #5, and e
n various len) #6.
ngth-
Page 49 of 50
https://mc06.manuscriptcentral.com/cgj-pubs
Canadian Geotechnical Journal

DraftFigure 18. Interactmagnit
tion factors (tudes of adhe
( ) at the upesion ( ) for
plift ultimater the microp
e load of micpiles a) #2, b)
cropile #1 b) #3, and c)
ased on vari#4.
ious
Page 50 of 50
https://mc06.manuscriptcentral.com/cgj-pubs
Canadian Geotechnical Journal