performance of a semi-rigid raft foundation on soft ground
TRANSCRIPT

PAPER
'er 'orgiIance o'segIIi-ri~ i( ra I:
'oun( a:ion onseI:c roun( un( erwet:ica oa(By RC Chown and MS Crilly, Centre for Ground Engineering
and Remediation, Building Research Establishment
Research into construction on soft ground has historically tended toaddress the behaviour and performance of relatively heavily loadedstructures, such as embankments, multistorey buildings or the use ofdeep foundations. Little research work has been carried out thatspecifically addresses the use of raft foundations for low-rise buildingon soft, natural ground.
Partly as a consequence, published UK guidance on the design of lightrafts for low-rise buildings tends to be conservative, and is found in adiverse range of publications which are sometimes contradictory. Forthis and other reasons, mostly related to uncertainties in performance,raft foundations are not frequently used for low-rise developments onsoft ground; a piled foundation solution usually being preferred. This isdespite it being generally accepted that raft foundations provide goodcompliance with services such as drainage, and gas and water supplies,unlike deep foundations, where the settlement of ancillary servicescommonly exceed both the rate and magnitude of settlement of thefoundations.
To help to address these difficulties, a full-scale downstand edge-beamraft foundation has been built and loaded to typical domestic serviceloads at the EPSRC soft clay test bed site at Bothkennar, Scotland. Theprimary objectives of the full-scale experiment are to:~ provide a benchmark for comparative field and numerical studies~ investigate current design philosophies and design tools and issueguidance on their applicability~ address concerns over performance and cost
SynopsisLittle research work has been carried out on the behaviour andperformance of light raft foundations for low-rise buildings on softground. This has in part led UK guidance on the design of such rafts tobeconservative and, occasionally, contradictory.
This paper describes the results of an experiment on a full-scaledownstand edge-beam raft foundation built at the Engineering andPhysical Sciences Research Council soft clay test site at Bothkennar inScotland. The raft was loaded around its perimeter in two stages: todesign load and then to 33% overstress. Results obtained from settlementpoints on the raft, contact pressure cells under the raft and fromextensometers and piezometers installed in the ground under the raftare described.
Measurements showed that a significant proportion of the appliedload was taken by the slab. At design loading, the raft's performance wascomfortably within criteria for acceptable performance. It is concludedthat design methods that allow only for the width of the downstand toresist wall loading are likely to be very conservative.
IntrodnolonIncreasing environmental and demographic pressures areconcentrating many new developments in the UK into areas of landpreviously considered as marginal; either because of cost or becauseeconomic construction technologies were not available. Soft, naturalground, such as alluvial clays and peat deposits form one such area.
This paper describes the planning, design and long term performanceresults from the foundation loading experiment.
Planning, design and conshuetlon
Site selection and ground conditionsThe Bothkennar site was chosen for the experiment for a number ofreasons, but principally because it is one of the most widely investigatedand characterised sites in the UK. The ground conditions and propertiesof the soft clay at Bothkennar have been extensively reported elsewhere(by, inter alia, Nash and Lloyd, 1989,Hawkins et al, 1989and Nash et al,1992).The 8th Geotechnique Symposium in Print (Institution of CivilEngineers, 1992) gives comprehensive descriptions of the site and itscharacterisation, sampling and testing.
These investigations found that, beneath a relatively thin desiccatedcrust (about 1.5m thick), the Bothkennar site is underlain by soft,normally consolidated clay, broadly consistent across the site, varyingin thickness between 12m and 22m, overlying gravel. Towards the base ofthe crust, there is a layer of shells in silty clay that is relatively free-draining. The soft clay has an undrained shear strength (c„)that showssigns of increasing linearly from about 18kPa just below the desiccatedcrust to 55kPa at depth (measured using insitu vane). Bothkennar clayhas a low permeability (around 1(Vm/s), moderate sensitivity (typically5), possibly as a result of inorganic and organic cements, and a PlasticityIndex typically of 40%.Figure 1 shows a geotechnical profile from Nash
essrfipgon 0Firm dark grey/brown silty clay
~ Shells in silty day2 - Soft brown grey silty clay/
2 dayey silt with shells 1-Soft very dark grey silty clay/clayey silt
4 grey mottling, sometimes micaceous.Some silt laminations
6 8 Soft to firm dark grey silty clay with
0 small holes and some mottling
'P 8-Soft dark grey silty day/dayey silt withfaint laminations. Some mottling
10-0
o 14-Finn dark grey silty day/dayey siltwith some mottling and laminations.
16 - Slightly micaceous, with occasionalshells below 15m
18-
20 - Coarse silty sand with broken shells
Moisture content andAttefberg limits (%)
10 20 80 40 50 60 70 80 00100~I
2 ~
s2 ~
2
1W WWr
Unit weighis(kg/ms)
1600 1800 2000
4 IProfile used4 4 in this paper
44
-4 Piston
4Detff
Pottiokt sizedistnttugon(%)
tfr s ~
~ e~ s ~
I I~ f
I III II I
~ s ~I I
\ I~ ~
s ~
I I
Iri(s ~
Iesses ea4I Ds c 0
Du 2Or2
ignition (%)0 5 10 0 50 100 150 200
ig 8)
effectivestress in-situ
o'ndrained
shearstrength (kN/m2)
0 26 50
Rsafo 1:Nofhktsators -Wftrefsoforsoffofaydosefafotattfaaoaottt-- —.—.~(ansr Nash sfal,1$$2).
GROUND ENGINEERING MARCH 2000

PAPER
8.1m+ Settlement points ~ Contact pressure cells ~ Piezometers
A A
v"
Plan view of foundation
175mm 300mm
40mm concretecover to all
reinforcement
125mm
) 150mm
A252 meshRguro 3:Plan showing posigon of leveeing points, contact pressure cells andplezo meters.
the raft is at about ground level; therefore the foundation partly exploitsthe strength of the desiccated crust.
450mm
~ a
550mm 150mm
Section A-A showing dwarf walls and reinforcement details
Rgura 2:Plan of foundation(IOP); BELOW, Section A-A showing dwarf walls andreinforcement detag.
et al (1992)that is consistent with the ground conditions under the raft.
InstrumentatlonInstrumentation was selected in order to monitor the followingthroughout the experiment:~ the transfer of load from the raft into the soil~ changes in total vertical and horizontal stress in the soil~ changes in pore water pressure~ vertical movement of the raft and the surrounding ground~ vertical movement of the soil profile beneath and immediatelyadjacent to the raft~ horizontal movement of the soil profile adjacent to the raft~ strain in the raft concrete
Raft designTwo types of raft foundation are commonly used for low-rise buildingsin the UK: plane slab and stiffened edge-beam (or 'semi-rigid') rafts.Plane slab rafts are not widely used except in ground conditions thatshow little variation in material properties or have a very thindesiccated crust, such as Canvey Island, Essex. Semi-rigid rafts typicallycomprise a reinforced, thickened edge-beam running around theperimeter of the foundation and under load-bearing walls, tied togetherusing a reinforced concrete slab typically 150mm to 200mm thick. Thesemi-rigid raft is more commonly used because of its suitability in arange of ground conditions, including soft ground with widely varyingsoil properties; because of their more widespread use, a downstandedge-beam raft was chosen for the experiment described here.
The design of the experimental raft had to strike a balance betweentwo conflicting requirements: to realistically represent a low-risebuilding foundation and yet be geometrically simple enough to allowanalysis, economic instrumentation and interpretation of the results. Asimple geometry was selected for the experimental raft, since relativelycomplex shapes and forms are being investigated through case studies ofreal buildings.
The experimental raft is an 8.1m by 8.1m square foundation with athickened edge-beam around its perimeter. As mentioned above, thereare different approaches to the structural design of such rafts. Atkinson(1993)describes one such design procedure where the full wall loads arecarried by the downstand edge-beams. An alternative and moreeconomic approach is that described by Curtin et al (1994)which allowsfor spread of the load across some of the slab area. For the purposes ofthis experiment, the slab was designed using the approach of Curtin et al(1994)with a design edge loading of 37.5kN/m (selected from Cement ILConcrete Association (1981) for typical two storey property (gable endwall)). Using C35 OPC concrete, this results in the cross-section shown inFigure 2, with A252 mesh reinforcement in the slab and three 16mmdiameter high tensile steel bars top and bottom in the downstand edge-beams, tied together using shear links at 200mm centres. The surface of
This paper concentrates on the response of the raft to vertical loading,primarily in terms of vertical displacement, but also in terms ofchanges in pore pressure and contact pressures beneath the raft.
Vertical movement pointsThirty-nine stainless steel domed nuts, either screwed onto a threadedbar embedded into the raft or stuck directly onto the slab using epoxyresin adhesive, were installed in a grid pattern (Figure 3) for use aslevelling points. Vertical movements are monitored relative to a deepdatum by precise levelling. In addition to the slab levelling points,surface settlement rods were installed around the perimeter of the raft(600mm long rods driven into 50mm diameter hand augered holesapproximately 350mm deep, sleeved and backfilled with a drysand/cement mixture).
Changes in pore water pressureFive pneumatic piezometers were installed beneath one quadrant of theraft at 1.5m, 3m and 5m depths (Figure 3).Any changes in the pore waterpressure detected by these instruments can be compared to a remotestandpipe piezometer installed at 3m depth some 25m away from the raft.
Changes in contact earth pressureEleven vibrating wire (VW) embedment type earth pressure cells (Tyler,1976)were installed at various locations over one half of the raft (Figure3) prior to the concrete blinding being poured. All changes describedhere were measured relative to the "locked-in" pressures measuredimmediately prior to the first stage loading being applied.
Construction and loadingThe raft foundation was constructed between 10-20 March 1997.Once theraft had been completed the instruments were monitored atapproximately fortnightly intervals until first loading on 4 June 1997,when 104.5t of concrete kentledge was loaded around the perimeter ofthe raft. The kentledge was placed on top of dwarf walls, built near the
GROUND ENGINEERING MARCH 2000 37
PAPER
,~ j eaa,,0.01 0.10
Time since stage 1 loading (days)
1 10 100 1000
Ftgum 4:Qage t leading applied(342tdl/mrun).
;ill II 'I P
EE
-8-
0—Min—Ave—Ave— - Average settlement
Average outer edge of slab—Average wall centre lines-- Maximum-16-
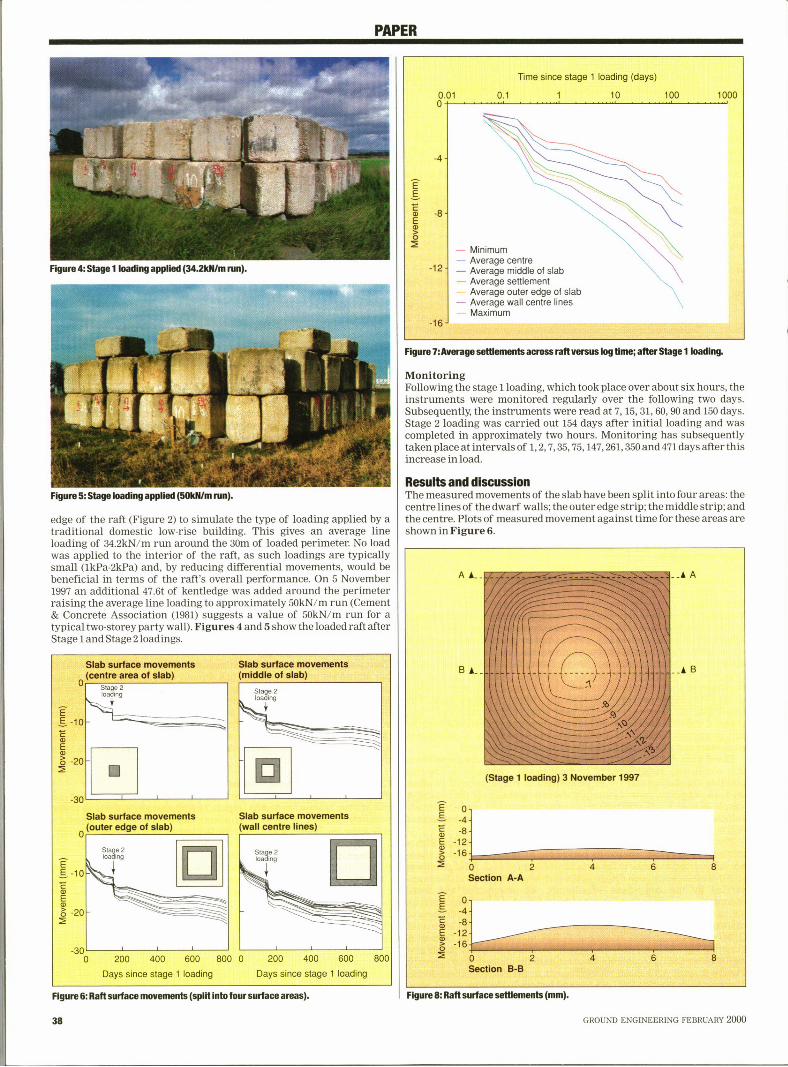
Figure 7:Average setgements across raft versus log bme; after Stage 1 loading.
MonitoringFollowing the stage 1 loading, which took place over about six hours, theinstruments were monitored regularly over the following two days.Subsequently, the instruments were read at 7, 15, 31, 60, 90 and 150 days.Stage 2 loading was carried out 154 days after initial loading and wascompleted in approximately two hours. Monitoring has subsequentlytaken place at intervals of 1,2, 7, 35, 75, 147, 261, 350 and 471 days after thisincrease in load.
Figure 5:Qage loading appged(ggtdt/mrna).
edge of the raft (Figure 2) to simulate the type of loading applied by atraditional domestic low-rise building. This gives an average lineloading of 34.2kN/m run around the 30m of loaded perimeter. No loadwas applied to the interior of the raft, as such loadings are typicallysmall (1kPa-2kPa) and, by reducing differential movements, would bebeneficial in terms of the raft's overall performance. On 5 November1997 an additional 47.6t of kentledge was added around the perimeterraising the average line loading to approximately 50kN/m run (Cement& Concrete Association (1981) suggests a value of 50kN/m run for atypical two-storey party wall). Figures 4 and 5 show the loaded raft afterStage 1 and Stage 2 load ings.
A J LA
Results and discussionThe measured movements of the slab have been split into four areas: thecentre lines of the dwarf walls; the outer edge strip; the middle strip; andthe centre. Plots of measured movement against time for these areas areshown in Figure 6.
Slab surface movements(conbe area of slab)
Stage 2loading
EE -1O
Etg
o -20-
Qab surface movements(middle of slab)
Stage 2loading
Ba
(Stage 1 loading) 3 November 1997
SB
-30
Slab surface movements
0(outer edge of slab)
Slab surface movements(wall centre lines)
EE -1O
o) -2O
Stage 2loading
Stage 2(j
Days since stage 1 loading Days since stage 1 loading
-300 200 400 600 800 0 200 400 600 800
E p--4-E
Eo-8.E -12.
-16.op 2Section A-A
EE p.
-4.-8.
E -12.-16
p 2Section B-B
Figure 6:Raft surface movements (spat Into four surface areas). Figure 8:Raft surface setgements (mm).
38 GROUND ENGINEERING FEBRUARY 2000

PAPER
o0E 2.3
1.9—(0
60—~ Piezo A (1.5m) ~ Piezo B (3.0m) ~ Piezo C (5.0m) ~ Piezo D {1.5m) ~ Piezo E (3.0m)
LEFT Figure g:Measured pore waterpressure (PWP) and ground water losel(GWL) llucluagons (at time of Sage 1
loading).
BELOW Ffgure1g: Coslact pressuredistrlbugon(kpa) Immediate(FalterStage1 loading.
50-
40—Q.
30—
20
I
lOO
CU
IP«n
'0—
0-30 -20 -10 10 20 30
Elapsed days since load 1 applied
40 50 60
Stage 1 loadingStage 1 loading on the raft is effectively design loading; the appliedperimeter load of 34.2kN/m being very close to the design load of37.5kN/m.
Average movements for the four areas described above, together withmaximum and minimum movements of any of the points on the raft, areshown, to a log scale, in Figure 7. It is clear from the results shown inFigure 7 that, in general, about 50% of the raft movement took placewithin two days of loading. About one quarter of the raft movementduring Stage 1 had occurred by the time the loading was complete, aboutfive hours after the start of loading. While much of this movement willhave been undrained settlement, the rapidity of settlement is also, inpart, due to the relatively free draining shelly layer; piezometers at 1.5mbelow ground level barely registered the effects of loading. Bearing inmind that the "total" settlement measured during the Stage 1loading is alower bound, since settlements had not ceased at the start of Stage 2loading, it is clear that the "immediate" undrained settlement is arelatively small proportion of the total settlement, perhaps of the orderof 15% to 20%.
While it is clear that movement is ongoing right up until Stage 2loading, the rate of movement has slowed significantly. At this time theperformance of the raft can be judged in terms of total and differentialsettlement and distortion. Figure 8 shows contours of settlement of theraft, together with sections through the centre of the raft and along theedge. The raft has settled in a markedly symmetrical manner, withmaximum settlements around the edges, particularly towards thecorners.
Maximum and minimum measured settlements of 15mm and 6.5mmrespectively have been measured, giving a maximum differentialsettlement of 8.5mm. This is well within acceptable levels for non-sensitive structures; for example, Eurocode 7 (CEN, 1995) suggests thattotal and differential settlements of more than 50mm and 20mmrespectively may be acceptable provided relative rotations remainwithin acceptable limits. Across a diagonal, the raft has undergone amaximum relative rotation of about 1/680; this is significantly less thanthe suggested limit of 1/500.
While piezometers A and D measured only very small increases inpressure, probably due to the changes in groundwater level, rather thanthe increases in pore pressure due to foundation loading (Figure 9),piezometers B and E measured increases of 7.5kPa and piezometer Cmeasured a peak increase immediately after loading of 5kPa. Thischange in pore water pressure immediately after loading represents theundrained condition. These changes are comparable to average verticalstress increases calculated assuming a simple 45'oad spread from theunderside of the raft. This suggests that the raft is effective indistributing the load.
Almost all of the VW earth pressure cells registered an increase inpressure due to the foundation loading. The exceptions were cells 9701and 9703. Cell 9701 is located in the centre of the raft where it is possiblethat hogging of the foundation due to perimeter loading caused theresultant reduction in pressure. Before loading commenced it wasknown that cell 9703 was showing wildly fluctuating and inconsistentresults. As a consequence all results from cell 9703 have been ignored.Figure 10 shows contour plots of the change in contact pressures
4 —M Earth pressure cell 971025kPa chango N coiltactpressure due to stage 1 loading
3
5 i15 25 35
0 1 2 3 4 5 6 7 8
between the raft and ground immediately after loading. The overalltrend is a symmetrical pressure distribution, with a concentratedpressure zone at the corner where there is an intersection of load fromtwo directions and the highest pressure changes occurring mid-side.
Stage 2 loadingFigure 11 shows the settlement versus time relationship over theduration of the project. The increase in settlement due to the Stage 2loading can clearly be seen by the acceleration in settlements around 154days. As before about 50% of the raft movement due to the Stage 2loading occurred within several days. In the longer term it is alsoevident that the differential settlement across the raft is slowlyincreasing with time, with maximum and minimum settlements of24mm and 9mm respectively being measured. Applying the sameperformance criteria as before, these values are well within acceptablelimits defined by Eurocode 7.
However the maximum relative rotation across a diagonal is nowapproximately 1/400. This is greater than the Eurocode limit of 1/500,though it is reasonable to assume that in a real situation, the stiffeningeffect of the superstructure would be significant, resulting in smallerrelative rotations.
Both the piezometers and VW earth pressure cells responded in asimilar manner to that experienced in the stage 1 loading. Figures 12and 13 show changes in pore pressure and the contour plots of thechange in contact pressures between the raft and ground respectively.
GROUND ENGINEERING FEBRUARY 2000 39

PAPER
ConclusionIt is concluded that:~ There has been significant redistribution of stresses unde th ft.
ntact pressures, it is estimated that about 40% of the appliedload has been carried by the downstand beams, the remainder beinresisted by ground under the slab.
earns, e remainder being
~ Under design loading, the raft's performance was comfortably withincriteria for acceptable performance. At 33% overstress, the raft shows no
settlement c'igns
of structural distress, and acceptable total d diffcriteria are comfortably satisfied. However, the raft'
o a an 'rential
rotation was sli htlr, e r 'sre ative
'g y greater than the Eurocode 7 suggested limit of
~ Thof the foundati
heamountof stressredistributionandth t' tesa is ac oryperformanceo e oun ation under design load suggest that a design using only thedownstandtoresistthewallloadingislik I t b
'y o everyconservative.
at the Bothkene experiment described here forms part f '
o a series o experimentse o ennar site (Ground Engineering January 1999),in which the
performance of different shallow foundation t es forbuildin s will be a
' 'assessed. In parallel with the work described h
similar raft has been built on ground incorporating stone columns. Thecri e ere, a
next phase of the research programme involves the construction of aplane slab raft. The work described in
th'rogrammeof research funded by the Department of the Env'rTransport and the Regions.
en o e nvironment,
-5.Stage 2 loading
EE -10-
-15.
-20-—Minimum—Average centre—Average middle of slab
-25- Average settlementAverage outer edge of slab—Average wall centre linesMaximum
-30-
Time since stage 1 loading (days)
0 100 200 300 400 500 600 700 800
8c3 27
E 2,3—
1.9—
60~ Piezo A (1.5m) ~ Piezo B (3.0m) ~ Piezo C (5.0m) ~ Piezo D (1.5m) ~ Piezo E (3.0m)
ABOVE: Flgure11:Average raftsetgemente versus time; from start ofloading.
LEFT:Flgure12: Measured pore waterpressure (PWP) and ground water level
(BWL) fluctuations (at Bme of Stage 2
loading.
50—
40—uo
30—
20—
rD Iid0
(U I
ei'li
ill
ui,
10—
065 85 105 125 145 165 185 205 225 245
Elapsed days since load 1 applied
265 285 305 325 345
References). ral foundations manual for Iow-rise buildings. E&FN Spon,Atkinson MF (1993).Structura
Cement & Concrete Association (1981).House founouse oundations for the builder and building
Curtin WG, Shaw G, Parkinson GI and Goldin JM 199g ( .4). Structural foundattondestgners'uropean
Committee for Standardisation (CEN) (1995) ENV 1997-1. EurGeotechn ical des ign - Part I; General rules. BSI,London.Hawkins AB, Larnach WJ, Lloyd I M and Nash DFT (1989 . Selectiinitial investigation of the SERC soft clay test bedday test bed site. Quart riy Io alof E~gi~~~~i~g
Institution of Civil Engineers (1992).8th Geotechni ue S m o i8 I t t I Il t t
m m'c arac erisation and lessons learned. Geotechnique, 42, 159 378,
ardine RJ, Lehane BM, Smith PR and Gildea PA (1995).Vertical Ioadin ex
Nash DFT arigid pad foundations at Both kennar. G
'hn ar. eotec nique, 45, 573-597.
ash DFT and Lloyd IM (1989).SERC soft clay test bed site, Bothkennar. Re ortdescriptions andphotograph .Report UBCE-SM-8 - .
'y.
Nash DFT, Powell JJM and Lloyd IM (1992). Initial investigations of tBothk G t h i 42 241-256TylerRG(1976).Avibratin wiresoi
' 'il pressure gauge. Tunnels and Tunnelling, 8(7), 73-78.
4 —~ Earth pressure cell 97107kPa change in contactpressure due to stage 2 loading
3—
- 8---
6 ...4
0,
N
AcknowledgementsThe authors would like to thank EPSRC for the f th B he use o e Bothkennar
out for DETc ay est site. The research described in this pa h bpaper as een carriedor R under the Technology and Performance Business Plan.
00 1 2 3 4 5 6 7 8
Figure 13:Increases In contact pressure (BPa) Immediately fter Staa ge2loadlng.
GROUND ENGINEERING MARCH 2000