product development time performance: investigating the
TRANSCRIPT
African Journal of Business Management Vol.6 (46), pp. 11480-11494, 21 November 2012 Available online at http://www.academicjournals.org/AJBM Doi: 10.5897/AJBM12.1011 ISSN 1993-8233©2012 Academic Journals
Full Length Research Paper
Product development time performance: Investigating the uncertainties on product conceptualization phase
and the influence on time to market
Marcos Vinícius de Barros*, Osmar Possamai, Luis Veriano Oliveira Dalla Valentina and Marco Aurélio de Oliveira
1Departamento de Engenharia de Producão e Sistemas, Universidade Federal de Santa Catarina, Florianópolis, Brazil.
2Departamento de Engenharia Mecanica, Universidade do Estado de Santa Catarina, Joinville, Brazil.
Accepted 20 September, 2012
This empirical study identifies the main uncertainties present in the conceptualization phase of a new product development and their effect on time to market. In a previous study, 15 senior project leaders involved in the development of new products at a home appliance industry in Brazil were interviewed. In the study, the main uncertainty factors experienced by the project team where of the concept generation phase of a new product, was identified. Aiming at validating the uncertainty factors identified in the previous research, and also at identifying their influence on the timing of new product development of other categories of products, a field research has been carried out involving the new product development (NPD) of three different organizations leaders in their segments in Brazil: the home appliance industry, the hermetic compressor industry and the plastic transformation industry in Brazil. In that second study, NPD project senior leaders were interviewed about projects already carried out, and about the influence of uncertainty factors on the development time of those projects. With the data collected in the second research, a forecast model to calculate the average time of project development up to the launching of the end product for the NPDs analyzed was developed. Key words: Time-to-market, fuzzy-front-end, product development.
INTRODUCTION The search for differentiated products and for the best cost has led to the reduction of product life and to rethinking product design. This context creates a new challenge to companies, that is, to get competitive
*Corresponding author. E-mail: [email protected].
Abbreviations: TtM, Time to market; Tcet, conceptualization time; NPD, new product development; CAF, commitment of functional areas to project objectives; TDT, impact (time) on
development of new product technology and/or reprocess within project; CMP, project team member competence; CL, leader competence to manage activities; CME, project scope clearness and maintenance; CDP, project demands conciliation; DR, resources availability; B2C, business to consumer; B2B, business to business; R&D, Research and Development; DOE, design of experiments; FMEA, failure methods engineering
analysis.
advantage generated by launching new products to the market. In this strategy, companies need be unique to reduce the number of direct competitors and to avoid price erosion, traditional in a competitive market. Having that differentiation and using it by making products available to the market before competitors do, is the strategic objective of most companies. Earlier availability of a product to the market may increase the profitability of a company due to the extension of its sales life, and also to the qualification of their NPD area to launch products within the timing required by the market. Fast development of a product leads to superior performance according to empirical studies (Griffin, 1997; Ittner and Larcker, 1997).
A well known factor of NPD within organizations is that the degree of uncertainty at the beginning of a new product development process tends to be high. As the design team evolves in the development of the project, that degree of uncertainty is expected to decrease.

However, it is at the beginning of the new project where most constructive solutions are defined. Decisions between alternatives at the beginning of the development cycle are responsible for 85% of the cost of the end product. Cost and time-to-market (TtM) may increase due to the need to change the project along the development cycle as each change made may invalidate a great number of decisions taken. (Rozenfeld et al., 2006)
Smith and Reinertsen (1997) calls fuzzy front end the initial development phase or the new product concept generation phase, mentioning the lack of attention of managers to that initial phase as it does not have the traditional management control, that is, neither time scale nor established goals. Therefore, it is not possible to detect whether actions are deviating from the plan in the fuzzy front end. Also, the lack of controlling mechanisms is aggravated by the fact that most managers only pay partial attention to that phase. As managers are more involved with finances, they tend to ignore that phase as it seems to have a fuzzy financial impact. Consequently, improving decisions at the fuzzy front end of a project through knowledge and the treatment of uncertainties inherent to that step will allow the design team to develop the concept of a new product more clearly, concisely and objectively. As a result, improvement in the speed to develop a new product is expected as well as the possibility to achieve an adequate (TtM) through greater efficiency of the design team as a consequence of rework reduction caused by late definitions or lack of definitions.
The development speed of a new product in the NPD is linked to the time a new product is made available to the marker. (TtM) expresses the speed a company moves from the concept of a product to initial market sales. The time to market is defined as the total development time of a new product. It is obtained by adding the concept generation time (Tcet) to the conversion time (drawings/prototypes/tests) and to the execution time (making of moulds and tools) of a product. The speed of new product development has become important to manage innovation in businesses where changes are fast due to continuous reduction of product life cycle, an increase of competition in terms of technological advances and globalization (Chen et al., 2012).
To Mascitelli (2006), in the past, the TtM was less important than innovation and the cost of new products. However, in the last decade, speed and efficiency have been considered to be at the same level of priority as price and cost. Actually, today, many companies clearly know the difference in the total profit generated by being the first to launch a product. Although many companies use the fast follower strategy for a product already launched in the market, one should observe that an excellent TtM usually offers profitability gains for having a differentiated product before their competitors.
Bayus (1997) says that an organization must decide whether it speeds up its efforts to catch up with a competitor who has just launched a new product or not.
Barros et al. 11481 To the author, the analysis of trade-offs in the various parameters of new product development (NPD) of a model suggests that the quick development of low performance products is optimized within the following conditions: a relatively small opportunity of a market window, a weak competitor and relatively high develop-ment costs, that is, there is no need of high performance levels to allow an organization to reduce its time-to-market safely. Within the same scenario, the author points out that if an organization decides to be the first to market a high performance product, the analysis of various trade-offs of the models studied suggests that to be the first the following conditions should be observed: a relative opportunity of a long market window, relatively high sales and relatively low development costs. Products of long life cycle, stable margins and high sales will generate enough income to cover for expenses originated from development speed-up. It can be observed that the new product developments researched fall within the second category, that is, the renewal of the products researched (e.g. refrigerators, ranges, hermetic compressors and pipes and fittings) takes place between three and five years or more. During that time interval complementary products or face-lifts may be generated so platforms are updated with relatively low development costs.
In their writings, Mcnally et al. (2011) point out a concern with the acceleration of product development time: the extreme acceleration of product development time may negatively influence the quality of the product to be launched. The same authors point out that focus on speed-to-market and quality of a product increase profitability of the end product. A studied carried out by the same authors showed that some trade-offs are done within the time, quality and expenses of the several steps of NPD to achieve the (TtM).
Given the aforementioned scenario, the fact of having an excellent (TtM) increases the strategic advantage of an organization. However, there is the concern that this (TtM) may be negatively affected due to the uncertainties experienced by the project team in the concept generation phase of a new product. The present study tries to help the NPD of organizations as to how to manage this problem. It is organized as follows: the first section is made a theoretical review of how (NPD) reference models approach the fuzzy front end. In the second section, a theoretical construct is made to understand the cause-effect relations of the uncertainties identified in the project performance (TtM). In the third section is described: a)- the methodology proposed by this study in order to identify the main uncertainties in the fuzzy front end, b)- the process to simulate (Tcet) and (TtM), c)- solution to solve the causes found. In the fourth section, is showed the application of the model proposed to three different new product developments with two purposes: to validate the uncertainties identified in the previous research and to understand the influence of the
11482 Afr. J. Bus. Manage. uncertainties on the TtM of the projects developed in these three models of NPD. In the fifth section, empiric data are analyzed through the use of linear regression to probabilistically determine concept generation times (Tcet) and the time to market (TtM). The last part of this study shows the results found, limitations and implications of the study and the final conclusion. Literature review New product development models (NPD) and their approach towards the fuzzy front end Discussions about difficulties in managing projects at the fuzzy front end may be found in writings by Smith and Reinertsen (1997), Clark and Fujimoto (1991), Cusumano and Nobeoka (1998), Clark and Wheelwright (1993), and Cooper and Kleinschmidt (1995). According to Kerzner (2003) “the high proportion of changes in technology and in the current market has required great efforts from traditional management models which do not respond quickly enough to an environment in constant transformation”. In the research done by Rozenfeld et al. (2006), PMBOK (2004), Mascitelli (2006), Back et al. (2008), Clark and Whellwright (1993), Cooper et al. (1986), Crawford (1994), Clark and Fujimoto (1991) and Whirlpool (2008), one can observe the emphasis given to the treatment of information within a project, to the adoption of development flows in steps that allow decisions to be taken, and to simultaneous engineering as an integration, agility and speed tool. Although literature encourages such actions, in project practice one can observe that the formal beginning of a project happens without a thorough discussion of the set of information essential to the other activities and without an agreement among all people involved.
Lynn et al. (1996b) developed a successful model for NPD using the new bench casing technique, which consists of sending knowledgeable informant a series of cases and asking them to identify key factors. This paper has identified ten successful key factors for NPD. The factors include (1) having a structured (NPD); (2) team clear and shared vision; (3) developing and launching products within the proper time frame; (4) refining a product after launching and having long term view; (5) having optimal team skills; (6) understanding market and its dynamics; (7) top management support to development team and team’s vision; (8) applying lessons learnt from past projects; (9) securing good team chemistry; and (10) retaining team members with relevant experience.
Whirlpool (2008) and Mascitelli (2006) describe mana-gement of innovation introduction into a new product through the development of concepts prior to the project as an assertiveness opportunity in the development and speed to launch a new product.
Stefanovitz et al. (2010) talking about how more radical projects are, the greater the creative intensity in the divergent phase is, because they require continuous rethinking of frontiers between what exists and what is possible to be developed. Furthermore, throughout all the phases of the development process, teams deal directly with unknown and unpredictable situations which require new ways of solving problems and making decisions. Although, different models of reference define best practices to manage the concept of a new product, one can also observe that the main initiatives used to reduce uncertainties in the fuzzy front end are concentrated on stimulating the work of multifunctional teams and on a strategy that anticipates the most relevant information to the development of a product concept. According to Brown and Eisenhardt (1995), the main factors that affect the performance of (NPD) are project team, project leader, role of managers and involvement of suppliers and customers during the execution of new product projects. NPD organizational aspects and the role of their actors are approached by the author again, but the fuzzy front end and its uncertainties are not pointed out. Cooper and Kleinschmidt (1995) recommend that attention should be given to pre-development activities, especially to the execution of market technical studies and to the analysis of feasibility which help to reduce the uncertainties in the fuzzy front end. Cooper and Kleinschmidt (1995) also stated that the level of abilities of the areas involved in NPD has been correlated with either the success or failure of new products, citing the technical capability of the teams involved in the project. The approach of the authors is related to the quality of execution of tasks, through the ability of engineers, but not to the complex points inherent to the fuzzy front end such as doubts generated when taking decisions due to lack of information. Griffin (1997) emphasizes the need of quality in the generation activities, in the analysis of ideas, technical development and introduction to the market. Again, the focus of the study is on the qualification of the team, not on the aspects inherent to uncertainties and their influence on the time to market. Poolton and Barclay (1998) suggest separating factors critical to success in NPD into strategically and tactical factors. The effectiveness of tactical factors (good internal and external communication, customer satis-faction, management quality and quality in the execution of tasks) depends on the construction of a favorable environment obtained with the correct use of strategic factors: support of senior management, strategic vision focused on innovation, commitment to the most important projects, flexibility, risk acceptance and incentive to entrepreneurial culture. However, according to the authors, the adoption of some of the aforementioned factors, said to be successful, has not led to the desired effectiveness, resulting in discredit in terms of their potential. Studies and publications generated a wide range of practices (best practices) or factors associated

with the success of new products, among them (Cooper and Kleinschmidt, 1995; Griffin, 1997; Cooper et al., 2004a, 2004b, 2004c). Generally speaking, the authors cited reviewed studies about factors that were determinant to the performance of new products, and concluded that each of those studies tried to identify a factor that improves the success of NPD. However, the factors proposed by those studies are not exactly the same, which makes it difficult to reach consensus about what the critical factors to the success of NPD are, and also makes it difficult to generate factors of successful NPD for a specific industry.
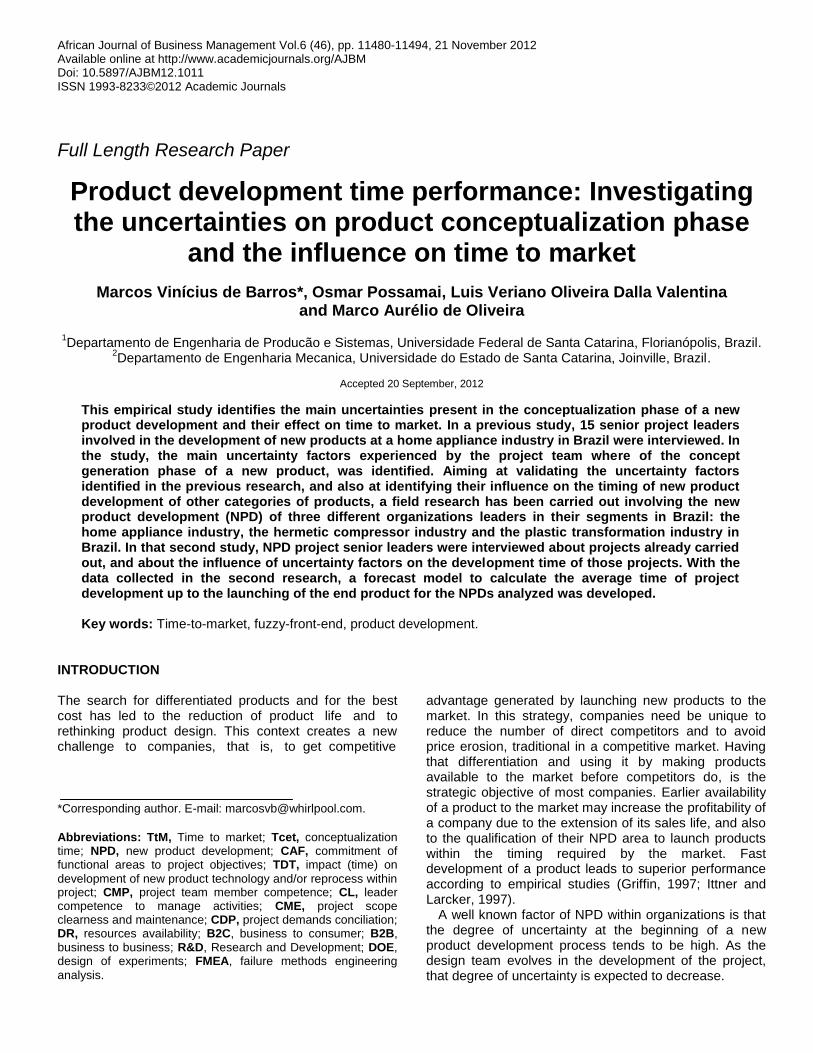
Within the risk management area, more specifically, within the area of decision-making in a risky environment and measurement of uncertainties and their influence on health, investment, production and psychology fields, studies by Ward and Chapman (2003), Dawson and Dawson (1998), Yen-Chuan Chen and Hwong-Wen (2007), Terje and Zio (2010), Rezaie et al. (2007), Sassi et al. (2006), Corotis (2008), Soung-Hie Kim and Byeong-Seok Ahn (1997) and Montgomery et al. (1986) stands out. In the environmental uncertainty context, according to Harrison (2003), despite the great importance of the environmental uncertainty concept for the organizations, not much attention has been given by researchers to the aspects regarding measurement and validation. Uncertainty management is not only about managing perceived threats, opportunities and their implications, but also the identification and management of all sources of uncertainties (Ward and Chapman, 2003). Theoretical construct Information, organizational structure, uncertainties and their influence on project performance To understand the variables to be analyzed, it is important to show the relationship among information, organizational structure, project uncertainties and performance (TtM) within the context of an organizational environment. This relationship is shown in Figure 1.
Figure 1 shows the relation of the four blocks. The pieces of information are considered inputs, and will be represented by pertinent information and the concept of a new product. Project performance, or time to market (TtM), are the outputs, the final objective of the proposal, and will be measured in months. The organizational structure follows Albrecht’s (1992) triangle model, and influences project uncertainties and performance. The organizational structure comprises (1) people, in this case the project team, (2) the processes used in the development of a project and (3) strategy which, in this case, follows Porter’s (1992) proposal and aims at obtaining competitive advantage against competitors, being the first to launch a product in the market. Uncertainties are the means, and follow the approach
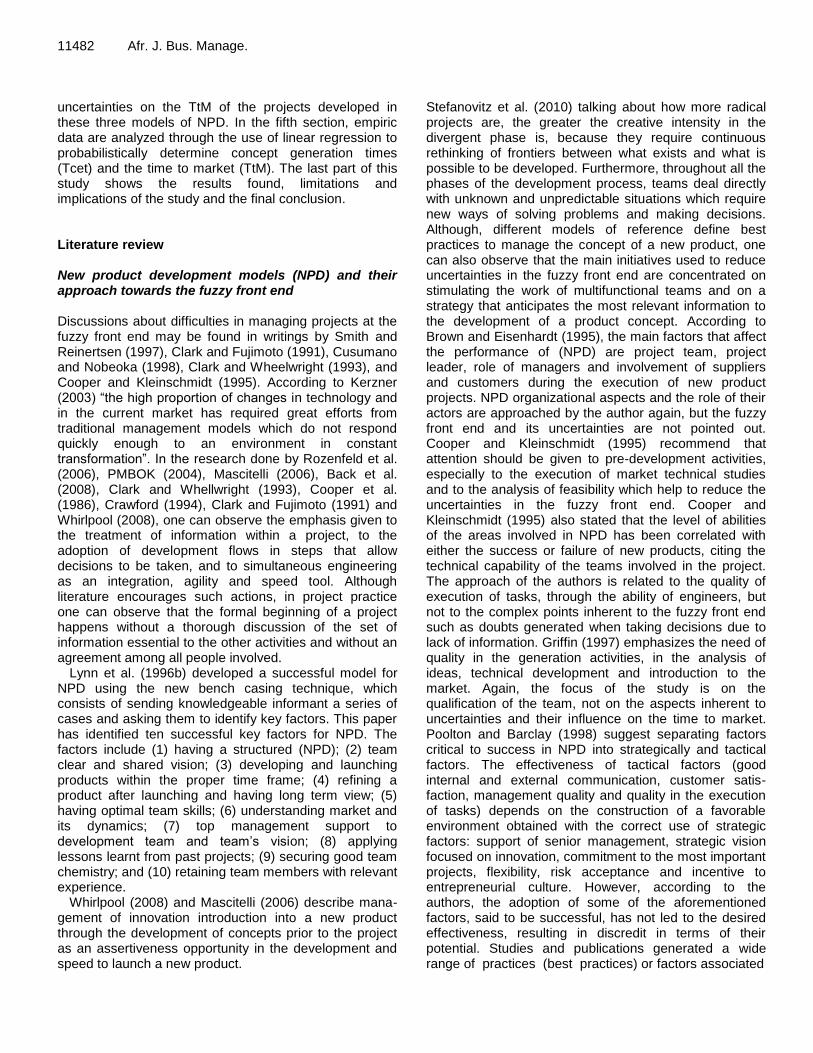
Barros et al. 11483 that uncertainties will occur due to the lack of clear information, general uncertainty of casual relations and to the time amplitude of feedback results (Lawrence and Lorsh, 1986; Duncan, 1972; Milliken, 1987). The organi-zational environment of the context follows Dess and Beard’s (1984) approach, here defined as competitive environment, which forces direct impact on the results of the company. METHODOLOGY Model proposed to identify uncertainties in the project of a new product In order to identify the degree of probability to achieve the TtM, Figure 2 shows a flow of steps that have to be carried out to identify and format data in order to make a TtM simulation for a given project. This simulation will allow the project team to understand the probability the project has to be launched within the foreseen time. The proposed model identifies the uncertainties in the project of a new product. Step 1: Creation of work team Work starts with the selection of the professionals who will implant the model proposed. A selective team, comprised of skilled people with compatible professional education, experience and knowledge of new product development process (NPD) are extremely important in achieving the desired results. The skills and qualification of the professionals who will take part in the team result in the best stratification of the needs necessary for the best development of a project, and appreciation of the indicators with greatest potential to meet the TtM. The successful definition of the variables (uncertainties) of the business model and the application of the model proposed, thus, is the result of the team’s good qualification and capacitation. Step 2: Project characterization This activity consists of identifying the types of projects being carried out in the company, and later classification is based on four project dimensions: pace – level of urgency, novelty – purpose uncertainties; technology – technological uncertainties; complexity – measurement of product, task and organization complexity, considering the dimensions of the product and process. Basic processes are those processes that do not offer competitive advantage. Core processes are those processes that define a competitive advantage. Distinct processes are those processes that offer great competitive advantage in the field of the company analyzed. Breakthrough or radical projects are those that involve significant change in the project of a product, and which are likely to create a new family or new category of products for the organization. Platform or next generation projects are those that present significant changes in the project of the product, with no introduction of new technologies or materials, but that represent a new system of solutions to the customer. This new system may represent a new generation of products or family of products to the company. Incremental or derivative projects create derivative or hybrid products with small changes in the existing projects. These projects include cost-reduction versions of a product and project, with incremental innovations in the products. Since they are derived from existing projects, they usually require less resource (Clarck
11484 Afr. J. Bus. Manage.
Figure 1. Theoretical construct: uncertainty factors in the organizational environment.
Figure 2. Flowchart of problem resolution model steps.
and Wheelwright, 1993).
Step 3: Evaluate uncertainties present at the fuzzy front end This step of the model proposes an evaluation through a quantitative research that comprises issues regarding the difficulties found in concept generation. The procedure involves asking
questions to project members to identify the main uncertainties in the project.
Step 4: Causal map of project concept generation phase The purpose of this step is to establish causal relations among information, organizational factors, uncertainties and project

Barros et al. 11485
Novelty of information
Relevance of information
Required estimate Variation
(+) ( - )
( - )
( - )
Non-existence of
objective value
Existence of objective value
Completeness/ Certitude of information
Novelty
(+)
( - )
( - )
(+)
UNCERTAINTIES
INFORMATION Input factors
( - )
Risk
Solution development smaller response time)
Understanding
Project performance ( Tcet and TtM)
(+)
( - )
(+)
( - )
( - )
(+)
Figure 3. Causal map showing relations among information, uncertainty and project performance.
performance. Once those relations are characterized, the causal map is created.
Figure 3 shows a causal map of the influence of uncertainties on the performance of the project. The theoretical construct of the process to be analyzed will provide the causal relations among information, uncertainties and project performance, as shown in Figure 1. Knowing the uncertainties, it is possible to complete the causal map, naming uncertainty factors at the beginning of the project and showing their influence on the project performance.
In the causal map, uncertainties depend on the characteristics of the information made available to the project in question so that, for example, the decision to introduce a greater innovation to the project, either a new technology for products or manufacturing processes (TDT), will exert a contrary influence on the expectation of the result foreseen. That is, the greater the precision required from the result, the greater the influence on uncertainty will be. On the other hand, the greater the variation of the limit of the purpose to be delivered the greater the uncertainty. Demir and Bostanci (2010) tells in their studies that information is useful, but insufficient in terms of risk analysis. Decision-makers rightly require further information on the probability of various scenarios. This demand can be met by developing a probability profile of the appraisal indicators such as net current value or internal rate of return. In order to produce a risk profile, it is necessary to carry out a risk
simulation. Uncertainties exert a contrary influence on the certitude of information so that, the greater the uncertainty present, the smaller the certitude of the information available. The greater the certitude and completeness of the information available, the smaller the doubts and the greater the propensity for risk by the project team. On the other hand, the smaller the doubts about the information available, the greater the understanding of what has to be done, and the greater the easiness to find a solution in a smaller period of time. Step 5: Probabilistic determination of project Tcet and TtM in the NPDs of three different models of organizations In this step, a mathematical modeling of the system is made, as shown in Figure 4. Linear regression and variance analysis are used as a modeling tool, with software JMP/ANOVA (2011). They were chosen because they allow forecast and sensibility analysis between the variables involved in the process. The application of the linear regression and variance analysis methodologies, made from the data obtained in a questionnaire applied to the project team, is suggested in this activity. The linear regression analysis aims at defining the linear equation to make the (TtM) simulation. The quantification of the impact of each variable (uncertainty) on

11486 Afr. J. Bus. Manage.
Figure 4. Flowchart to identify Tcet and TtM of new projects.
PLAN PROJECT BUILT TEST REVISION
•Define
objectives
•Identify sub-systems
and critical
componentss
•Sketches •Assesment •Sumarize learnings
•Define
questions
•Verify the inter-
actions of the systems
•Prototypes •Equations •Capture known
(template)
•Define tasks •Define the method
for questions
elaboration
•Models •Models •Measure new
concepts
•Refine requirements •Simulation by computer •Revisions •Manage the
moment
•Generate concepts
throught the insigths
obtained
•Sub-systems •Simulations
•Physical Tests
Learning Cicles 3 or 4 weeks
Figure 5. Fast learning proposal for the project team.
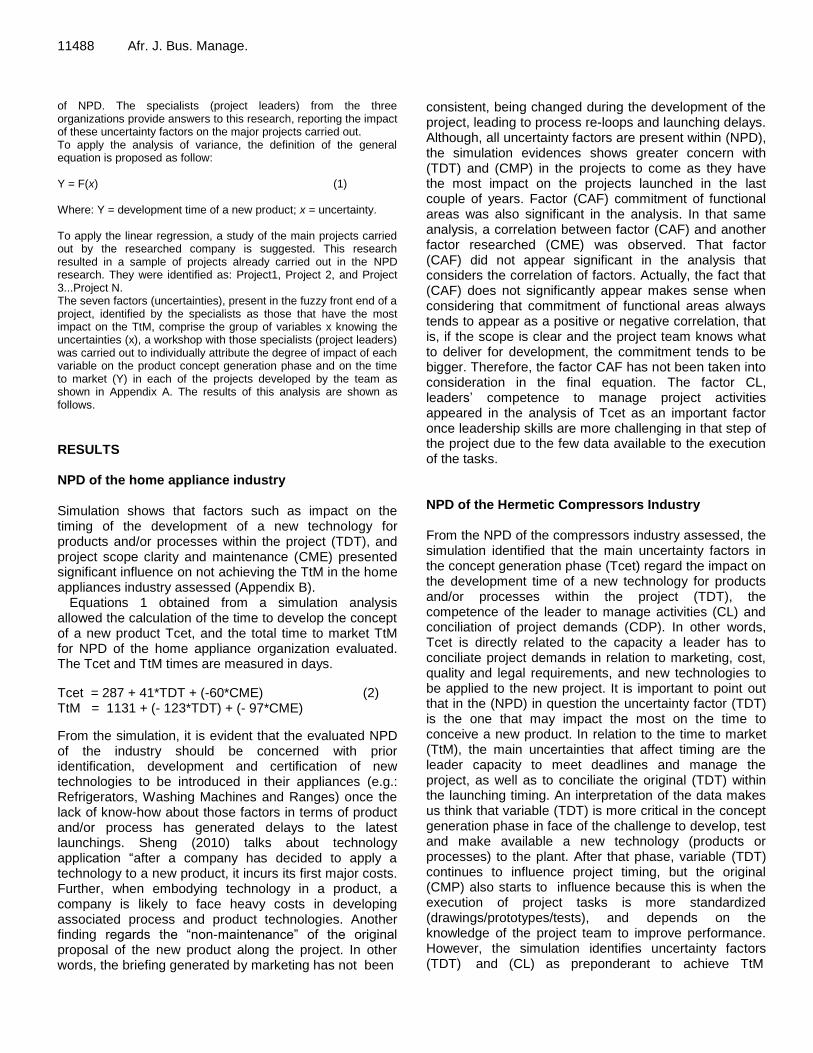
the development time of a project is expected, as well as getting a general equation that represents the impact of a set of variables on the total development time of a product. The simulation allows the identification of the variables (uncertainties) that have the most influence on the TtM. One of the products of the simulation is the evaluation of whether the process analyzed suffers linear variation. From Box and Cox (1964)’s analysis, one can define whether the analysis is linear or exponential. Step 6: Develop solutions to solve the causes found In the search for a solution for the uncertainties or problematic variables identified in the simulation (described in step 5), that affect the TtM, Figure 5 shows, in detail, a proposal to generate the solutions to improve the performance of the project. The proposal aims at developing a learning cycle or plan, which will have to be developed in three or four weeks for the discussion and solution of the uncertainty factor or problematic variable identified in the simulation. The learning cycle model follows the fast learning model proposed by Schipper and Swets (2011). Step 6 suggests mapping the learning cycle at the concept generation phase of a new product. Every journey starts with a plan or map, and in the case of the learning cycle, it is not different.
Planning of learning goals is a cross-functional activity in which all subjects will be represented by the project team members. This also includes customer’s voice, which will be critical to the identification of the true requirements for the projects, and which will help when the team has to decide among alternatives to meet specifications. The planning has to be done on the first day of the learning cycle. The team has to first capture the key goal of the expected learning; in this case the uncertainties are identified by the simulation. For each learning goal, the team must make questions to be answered in order to determine what the project team does not know. These questions must close the gap between where the group is and where the group wants to go to deliver the project within the defined time frame. The members of the team also plan the tasks that need to be completed to answer the questions. Those tasks will be the responsibility of the group. The project goals, questions and tasks must be entirely aligned. Application of the model proposed to three different NPDs Execution of steps 1, 2 and 3 To better understand the reality of a project environment submitted to the pressures of a competitive market, an interview was made

Barros et al. 11487
Project leader/Project team
members competence
Project scope clearness
and maintenance
Resources availability
Commitment of functional areas
Impact on develop new
product /process
Project demands
conciliation
Project performance
Understanding
Development of solutions
(smaller response time)
Risk
(+)
(+)
(+)
(+)
(+)
(+)
( - )
(+)
(+)
(+)
(+)
(+)
(+)
(+)
(+)
(+)
(+)
(+)
(+)
UNCERTAINTIES
( - )
Figure 6. Causal map showing the relation among uncertainty factors and project performance.
with a group of people who work with NPD at a big multinational company, leader in the home appliance sector in Brazil. The target public of the research is exclusively made of project leaders and specialists, highly experienced in the development of new products. Therefore, in this research, a sampling of intentional character was used with a group of 15 professionals of accumulated experience in leading projects between 5 and 25 years. The objective was to obtain the main perceptions of those specialists in terms of causes and factors that generate delays within a project, and that compromise the TtM. It was assumed that the public interviewed is skilled and competent enough to carry out a specific project task within a deadline once they are provided with the proper means to do it. The following are the uncertainty factors identified: 1. Commitment of functional areas (CAF) to project objectives; 2. Impact (time) on development of new product technology and/or reprocess within project (TDT); 3. Project team member competence (CMP); 4. Leader competence (CL) to manage activities; 5. Project scope clearness and maintenance (CME); 6. Project demands conciliation (marketing requirements, TtM, cost, quality and legal requirements) (CDP); - Resources availability (DR) (people/investment/budget). Although the results of this research cannot be generalized to all project realities in various companies, it could be observed that elements such as completeness and imprecision of the information available are the main causes of task delivery delays by the project
team. Likewise, it was not the intent of the research to evaluate whether the information available affected or not the quality of the results delivered by the designers during the execution of their activities. It is assumed that, in the search for better project solutions, even a competent team would need more time than the planned time to deal with incomplete information. In that case, it is estimated that, in the presence of doubts, there is less result efficiency because besides the greater time required to carry out the activities, the chances of rework and adjustments to the end product also increase. Execution of step 4 Knowing the uncertainties, it is possible to complete the causal map shown in Figure 6, naming the uncertainty factors at the initial phase of the project, and showing their influence on the performance of the project. Execution of step 5 Using the flowchart for the simulation of the time to market, a second research has been made involving three models of different organizations. The models of NPDs chosen comprise projects of home appliance, compressor and pipes and fittings industries. The purpose of the second research was to validate the uncertainty factors identified in the previous research, and to understand their influence on the TtM of the projects developed in the three models
11488 Afr. J. Bus. Manage. of NPD. The specialists (project leaders) from the three organizations provide answers to this research, reporting the impact of these uncertainty factors on the major projects carried out. To apply the analysis of variance, the definition of the general equation is proposed as follow: Y = F(x) (1) Where: Y = development time of a new product; x = uncertainty. To apply the linear regression, a study of the main projects carried out by the researched company is suggested. This research resulted in a sample of projects already carried out in the NPD research. They were identified as: Project1, Project 2, and Project 3...Project N. The seven factors (uncertainties), present in the fuzzy front end of a project, identified by the specialists as those that have the most impact on the TtM, comprise the group of variables x knowing the uncertainties (x), a workshop with those specialists (project leaders) was carried out to individually attribute the degree of impact of each variable on the product concept generation phase and on the time to market (Y) in each of the projects developed by the team as shown in Appendix A. The results of this analysis are shown as follows.
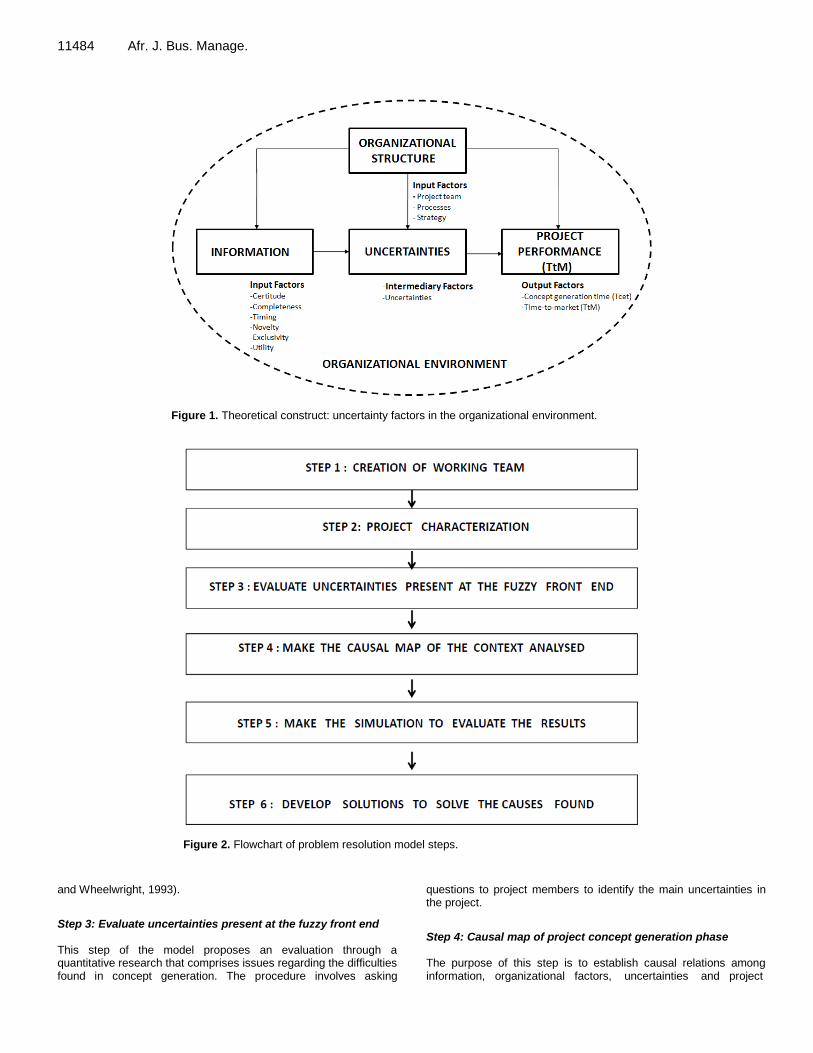
RESULTS NPD of the home appliance industry Simulation shows that factors such as impact on the timing of the development of a new technology for products and/or processes within the project (TDT), and project scope clarity and maintenance (CME) presented significant influence on not achieving the TtM in the home appliances industry assessed (Appendix B).
Equations 1 obtained from a simulation analysis allowed the calculation of the time to develop the concept of a new product Tcet, and the total time to market TtM for NPD of the home appliance organization evaluated. The Tcet and TtM times are measured in days.
Tcet = 287 + 41*TDT + (-60*CME) (2) TtM = 1131 + (- 123*TDT) + (- 97*CME)
From the simulation, it is evident that the evaluated NPD of the industry should be concerned with prior identification, development and certification of new technologies to be introduced in their appliances (e.g.: Refrigerators, Washing Machines and Ranges) once the lack of know-how about those factors in terms of product and/or process has generated delays to the latest launchings. Sheng (2010) talks about technology application “after a company has decided to apply a technology to a new product, it incurs its first major costs. Further, when embodying technology in a product, a company is likely to face heavy costs in developing associated process and product technologies. Another finding regards the “non-maintenance” of the original proposal of the new product along the project. In other words, the briefing generated by marketing has not been
consistent, being changed during the development of the project, leading to process re-loops and launching delays. Although, all uncertainty factors are present within (NPD), the simulation evidences shows greater concern with (TDT) and (CMP) in the projects to come as they have the most impact on the projects launched in the last couple of years. Factor (CAF) commitment of functional areas was also significant in the analysis. In that same analysis, a correlation between factor (CAF) and another factor researched (CME) was observed. That factor (CAF) did not appear significant in the analysis that considers the correlation of factors. Actually, the fact that (CAF) does not significantly appear makes sense when considering that commitment of functional areas always tends to appear as a positive or negative correlation, that is, if the scope is clear and the project team knows what to deliver for development, the commitment tends to be bigger. Therefore, the factor CAF has not been taken into consideration in the final equation. The factor CL, leaders’ competence to manage project activities appeared in the analysis of Tcet as an important factor once leadership skills are more challenging in that step of the project due to the few data available to the execution of the tasks. NPD of the Hermetic Compressors Industry From the NPD of the compressors industry assessed, the simulation identified that the main uncertainty factors in the concept generation phase (Tcet) regard the impact on the development time of a new technology for products and/or processes within the project (TDT), the competence of the leader to manage activities (CL) and conciliation of project demands (CDP). In other words, Tcet is directly related to the capacity a leader has to conciliate project demands in relation to marketing, cost, quality and legal requirements, and new technologies to be applied to the new project. It is important to point out that in the (NPD) in question the uncertainty factor (TDT) is the one that may impact the most on the time to conceive a new product. In relation to the time to market (TtM), the main uncertainties that affect timing are the leader capacity to meet deadlines and manage the project, as well as to conciliate the original (TDT) within the launching timing. An interpretation of the data makes us think that variable (TDT) is more critical in the concept generation phase in face of the challenge to develop, test and make available a new technology (products or processes) to the plant. After that phase, variable (TDT) continues to influence project timing, but the original (CMP) also starts to influence because this is when the execution of project tasks is more standardized (drawings/prototypes/tests), and depends on the knowledge of the project team to improve performance. However, the simulation identifies uncertainty factors (TDT) and (CL) as preponderant to achieve TtM
(Appendix C).
The research identified difficulties with the uncertainty factor regarding (CDP) project demand conciliation therefore we consider it important to understand more deeply which of the issues related to that complexity are the most important. For that purpose, an analysis of which project characterization factors mostly impact the TtM has been made, and one of the findings was that the adaptation of the new product to the manufacturing process is very critical in that type of industry. Being it a scale industry, manufacturing investments in automation are big, and a new product may require huge investment in manufacturing automation. Another perception was that as this company is an organization that develops state-of-the-art technology, its (R&D) team is already structured and has the goal to develop, test, certify and make new technologies available prior to the definition of a new product. Therefore, factor (TDT) appears less intensively, negatively influencing the (TtM) of a new product when compared to the research made in the home appliance industry. Other uncertainty factors highlighted in the research are related to the uncertainties regarding final cost which may be the uncertainty of a new technology (TDT) or the conciliation of project demands (CDP), or great dependency on plant approval of pilot lots which may be associated with the commitment of functional areas to project goals (CAF). Tcet and TtM for the compressor company is defined by equations (2) Tcet = 1166 + (- 105*TDT) + (-64*CDP) + (-109*CL) (3) TtM = 2131 + (-200*TDT) + (-285*CL) NPD of the plastic components industry The simulation is made taking into consideration the fact that the data originated from the research with NPD of the plastic components company. This shows that the uncertainty factors that most influenced time to market (TtM) were commitment of functional areas (CAF) and impact on the development of a new technology for products and/or processes within the project (TDT) (Appendix D). Also, the influence of project members competence (CMP) on the concept generation phase of a new project was pointed out. What is evidenced is that the greatest complexity lies on the amplitude of the project, that is, what portion of the product will be redesigned or what percentage of novelty will be designed, as well as the degree of interdependence between the new product and the process. Another uncertainty present in the research is related to the approval of new compounds that meet established standards (CDP). Knowledge of international market requirements has also been approached in the research (CDP). The equation that rules the (TtM) (in days) in this
Barros et al. 11489 company is shown in (3). Tcet = 78 + 163*CAF + (-90*TDT) + (-58*CMP) (4) TtM = 577 + 167*CAF + (-237*TDT) DISCUSSION AND IMPLICATIONS The results of this study suggest that time performance in new product development is linked to a complex set of uncertainties: Commitment of functional areas (CAF) to project objectives; Impact (time) on development of new product technology and/or reprocess within project (TDT); - Project team members competence (CMP); - Leader competence (CL) to manage activities; - Project scope clearness and maintenance (CME); - Project demands conciliation (CDP); - Resources availability (DR). Not clarifying or removing this doubts caused by this set of uncertainties during the conceptualization phase could affect the time performance. These findings offer new insights both for academics and for (NPD) managers. Also, the conclusions and comments reflect the associative and exploratory nature of the study.
Also the results showed that NPD from B2B organizations (in our example, the hermetic compressors and pipes and fittings) is less dependent on the uncertainty factor clarity and maintenance of project scope (CME) once market standards for components limit variation, allowing greater clarity of what has to be developed, with no constant changes to the initial proposal. Another finding was that in organizations that use high technology to compete, through a well-structured R&D, the uncertainty factor (TDT) tends to impact less on the TtM due to previous developments and know-how in new technologies. Analyzing the results of the simulation made with home appliances regarding the calculation of Tcet and TtM, it can be said that projects that have low uncertainty for factor (TDT) probably the application of technologies already tested in new products and mastered, and high clarity for project proposal (CME), that is, no changes to the scope of the new product, conceiving times (Tcet) and launching times (TtM) tend to be the smallest. This makes sense as projects called incremental, or facelift, which purpose is the improvement of a platform without great investments, follow that proposal. On the other hand, evidence shows that in the simulation analysis of NPD of home appliances projects said to be a breakthrough, as defined by Clark and Wheelwright (1993), where usually new technologies are incorporated both to the product and to the process of a new product. A high TDT and small clarity for factor (CME) tends to be the most critical situation for Tcet and TtM because the project team does not master these technologies, and at the same time, the project suffers changes to the scope by the marketing area, which may

11490 Afr. J. Bus. Manage. cause delays to its development. Between these two extreme examples, we have projects that present moderate levels of TDT and CME, which are called new platform projects by Clark and Wheelwright (1993), and which present intermediary Tcet and TtM when compared to the extreme examples analyzed.
For the software, JMP simulation, we need to validate the linearity of the context under study. Linearity of the model analyzed was confirmed through the analysis of linearity proposed by Box and Cox (1964).
LIMITATIONS AND FUTURE RESEARCH The important point to consider from the organization assessment is the level of NPD standardization. With the objective to have high degree of reliability on the analysis, the organization must have a standardization (NPD) process or a defined process, from the ideation to product launch with very clear steps for each phase of development and clear stage gates as explicit decision points. Also a clear definition when the project starts and where it ends and a project leader named since the project start until the launching time should be stated.
For other side it is not possible to make a single equation in order to establish the generation time of a new product (Tcet) or the time to market (TtM) a new product to all fields of (NPD) as each has different levels of: (1) maturity of the engineers involved, (2) organizational culture, (3) organization and leaders competence, (4) (NPD) process structure. Regarding engineers, one has to take into consideration their skills and previous experience in other projects. As to the organizational culture, one has to take into account the ability to work in teams and the reference model of product development used in the company researched. Therefore each (NPD) must have a characteristic equation to define their TtM. The final equation provided by the method cannot be generalized, but the model proposed to define the equation may be generalized once it uses the database of projects already carried out by the company researched, which denotes that each company may have its own equation to foresee the time to market a product. As this equation is based on a moment of the organization, in terms of maturity of its employees and skills of the product development area if one of those competences are lost for some reason, the equation may not reflect that reality. Therefore, the proposed model must be repeated every three years to validate possible evolutions or involutions of the company regarding its time-to-market.
Conclusions A scientific contribution of the present study is to help analyze new product projects right at the beginning, through the use of simulation and to identify the main
uncertainty factors present in that stage. When identifying the uncertainty factors that present the greatest influence on achieving Tcet and TtM in the development of products, we provide knowledge for the prior under-standing of when a project is mature to be carried on, with no uncertainties that may generate delays, no stops and constant re-loops. Early identification of which is the main uncertainty factor will allow the organization to evaluate that factor and to establish a mitigation plan at the beginning of the project. A consequence of that knowledge will be better management of resources for projects in the pipeline, that is, projects may be cancelled or put on hold until variables (uncertainties) are under control.
The theoretical contribution expected is the isolation of the uncertainty factors that may delay the development of a new product, to establish better management of those factors as well as the identification of the importance of each of those indicators to the improvement of speed performance and assertiveness in concept generation of a new product. It is understood that the indication of those factors represents a practical contribution to increase company competitiveness through the effective-ness of their NDPs. Preparing and making a manage-ment model available to new product projects, in their initial phase, is a solution to handle the uncertainties of the fuzzy front end in order to better achieve the TtM. The importance of simulating the probable TtM right at the beginning of a project will help companies to more consistently manage the resources to be made available to NPD. Another important contribution of the study is to improve the decision-making process in terms of going ahead or not with the new project, based on the simulation of the Tcet and TtM. This simulation contribute to find what kind of uncertainties factors need to be submitted for fast learning cycle per project team with the objective to understand the uncertainties and fixed it to return to NPD process. Strong effectiveness done during the conceptualization phase help to guarantee the success of a new product launched. REFERENCES
Albrecht K (1992). How your company can join the customer service
revolution. 3° ed. São Paulo Pioneira. Back N, Ogliari A, Acires D (2008). Projeto integrado de produtos:
planejamento, concepção e modelagem. Barueri, SP, Editora Manole.
Bayus BL (1997). Speed-to-market and new product performance trade-offs. J. Prod. Innov. Manag. 14:485-497.
Box GEP, Cox DR (1964). "An analysis of transformations". Journal of the Royal Statistical Society.
Brown SL, Eisenhardt KM (1995). Product development: Past Research, Present findings and future directions. Acad. Manag. Rev. 20(2):343-378.
Chen J, Reilly RR, Lynn GS (2012). New product development speed: too much of a good thing? J. Prod. Innov. Manag. 29(2): 288-303.
Clark KB, Fujimoto T (1991). Product development performance: strategy, organization and management in the world auto industry. Boston Harvard Business School Press.

Clark KB, Wheelwright SC (1993). Managing new product and process
development. New York The Free Press p.896. Crawford CM (1994). New products management. 4
th edition. Irwin Burr
Ridge IL. Cooper RG, Scott E, Kleinschimidt E, Elko J (2004a). Benchmarking:
best NPD practices - I. Res. Technol. Manag. 47(1):31-43. Cooper RG, Scott E, Kleinschimidt E, Elko J (2004b). Benchmarking:
best NPD practices - II. Res. Technol. Manag. 47(3):50-59. Cooper RG, Scott E, Kleinschimidt E, Elko J (2004c). Benchmarking:
best NPD practices - III. Res. Technol. Manag. 47(6):43-55. Cooper RG, Crawford CM, Hustad TP (1986). Winning at new products.
J. Prod. Innov. Manag. 3(4):307-308. Cooper RG, Kleinschmidt EJ (1995). An investigation into the new
product process: steps, deficiencies, and impact. J. Prod. Innov. Manag. 3:71-85.
Corotis RB (2008). Risk communication with generalized uncertainty and linguistics. Department of Civil, Environmental and Architectural Engineering, University of Colorado Boulder, USA. Elsevier Ltd.
Cusumano MA, Nobeoka K (1998). Thinking beyond lean: how multi-project management is transforming product development at Toyota and other companies. New York. Simon and Schuster Publishers p.245.
Dawson RJ, Dawson CW (1998). Practical proposals for managing uncertainty and risk in project planning. Int. J. Proj. Manag. 16(5):299-310, Elsevier Science Ltd and IPMA.
Dess GG, Beard DW (1984). Dimensions of organizational task environments. Adm. Sci. Q. 29(1):52-73.
Demir H, Bostanci B (2010). Decision-support analysis for risk management. Afr. J. Bus. Manag. 4(8):1586-1604.
Duncan RB (1972). Characteristics of organizational environments and perceived environmental uncertainty.administrative. Sci. Q. 17(3):313-327.
Griffin A (1997). PDMA research on new product development practices: updating trends and benchmarking best practices. J. Prod. Innov. Manag. Manch. 14:429-458.
Harrison JL (2003). Perceived environmental uncertainty: validation of measure from the accounting literature. http://www.scu.edu.au/ajbsi/papers/vol1/harrison.pdf.
Ittner CD, Larcker DF (1997). Product development cycle-time and organizational performance. J. Mark. Res. 34 (1):13-23.
JMP/ANOVA (2011). SAS Campus Drive. Building T Cary. NC, 27513 Copyright, SAS Institute Inc.
Kerzner H (2003). Project management: a systems approach to planning, scheduling and controlling. 8. ed. Hoboken: Wiley Publishing p.891.
Lawrence PR, Lorsh JW (1986). Organization and environment: managing differentiation and integration. Boston: Harvard Business School Press p.279.
Lynn GS, Valentine W, Wright R (1996b). A Bench casing study of new product and process development. Eng. Manag. J. 8:5-14.
McNally RC, Akdeniz MB, Calantone RJ (2011). New product development processes and new product profitability: exploring the mediating role of speed to market and product quality. J. Prod. Innov. Manag. 28:63-77.
Mascitelli R (2006). The lean product development guidebook, Everything your design team needs to improve efficiency and slash time-to-market. The Lean Guidebook series.
Milliken FJ (1987). Three types of perceived uncertainty about of environment; State, effect and response uncertainty. Acad. Manag. Rev. 12(1):133-143.
Barros et al. 11491 Montgomery DC, Peck EA, Vining GG (1986). Introduction to linear
regression analysis, 4th Edition. Arizona State Univ, The Coca-Cola Company, Virginia Polytechnic and State Univ. Project Management Institute (2004). A guide to the project management body of knowledge (PMBOK guide). Pennsylvania.
Poolton J, Barclay I (1998). New product development from past research to future application. Ind. Mark. Manag. 27(3):197-212.
Porter ME (1992). Vantagem Competitiva, criando e sustentando um desempenho superior, Rio de Janeiro, Campus.
Rezaie KA, Amalnik MS, Gereie A, Ostadi B, Shakhseniaee M (2007). Using extended Monte Carlo simulation method for the improvement of risk management: Consideration of relationships between uncertainties. Appl. Math. Comput. 190(2):1492-1501.
Rozenfeld H Forcellini F, Amaral DC, Toledo JC, Silva SL, Alliprandini DH (2006). Gestão de desenvolvimento de produtos: uma referência para melhoria do processo. São Paulo: Saraiva.
Sassi G, Magnetti VA, Ruggeri B (2006). Quantitative estimation of uncertainty in human risk analysis. B. J. Hazard. Mater. 145(1-2):296-304.
Schipper T, Swets M (2011). Innovative lean development: How to create, implement and maintain a learning culture using fast learning cycles. New York Productivity Press.
Sheng H (2010). An analysis of technology market from the perspective of technology life cycle. Afr. J. Bus. Manag. 4(17):3641-3654.
Smith PG, Reinertsen DG (1997). Desenvolvendo produtos na metade do tempo. Editora: Futura, 358f.
Soung-Hie K, Byeong-Seok A (1997). Group decision making procedure considering preference strength under incomplete information. Graduate School of Management, Korea Advanced Institute of Science and Technology, Cheongryangri, Dongdaemoon, Seoul. Elsevier Science Ltd.
Stefanovitz JP, Nagano MS, Santos FCA (2010). Influence of the technological innovation degree on knowledge creation: Evidence from a Brazilian firm. Afr. J. Bus. Manag. 4(5):631-643.
Terje A, Zio E (2010). Some considerations on the treatment of uncertainties in risk assessment for practical decision making. University of Stavanger, 4036 Stavanger. Norway, Ecole Centrale Paris-Supelec, Paris, France. Dipartimento di Energia, Politecnico di Milano, Milano, Italy. Elsevier.
Yen-Chuan Chen, Hwong-Wen M (2007). Combining the cost of reducing uncertainty with the selection of risk assessment models for remediation decision of site contamination. Graduate Institute of Environmental Engineering, National Taiwan University, 71 Chou-Sam Road, Taipei, 106, Taiwan.
Ward S, Chapman CB (2003). Transformation project risk management into project uncertainty management. Int. J. Project Manag. 21(2):97-105.
Whirlpool (2008). Projeto Time-to-Market, Whirlpool.

11492 Afr. J. Bus. Manage.
Appendix A. Example of the questionnaire used to collect data.
Uncertanties
Please rank the following questions using the suggested score below
Commitment of functional areas to project objectives (CAF)
Related to the qualification of professionals available by functional areas to participate on the project team
Regarding the sponsor' s involvement and participation on the project
Regarding the assiduity of the participants on the project review meetings
Regarding the resources (headcount ) available for the project
Impact (time) on development of new product technology and /or a new process within project (TDT)
Regarding the interdependence between the parts of the product or process
About the product technology feasibility applied in the new product
About the process technology feasibility in the new product
About the complexity related the number of new/ existing items in the new product
Project team members competent (CMP)
About the previous experience of the members of project team
About the technical skills of the members of project team
Project leader competence to manage activities (CL)
About the ability of project leader to motivate the team
About the previous experience of project leader
About the performance of project leader
About managerial capacity of the project leader
Project scope clearness and maintenance (CME)
About the understanding of project scope
Regarding the number of modifications done on the project scope
Regarding the maintenance of original scope proposal for the project
Project demands conciliation (marketing requirements, ttm, cost, quality and legal requirements (CDP)
Regarding the impact of new aesthetics proposed on the manufacturing processes
Regarding the impact of the target cost for the new product
About the impact of the quality targets for the new product
Regarding the legal requirements for the new product
Resources availability (people, investment and budget) (DR)
About the budget available for the project
About the investments available for the project
About the facilities (laboratories, equipments, etc.) Available for the project
Answer options: dissatisfied (1); less satisfied (2); satisfied with restrictions (3); satisfied (4); very satisfied (5).

Barros et al. 11493
Appendix B. Results for NPD home appliance industry simulation.
Appendix C. Results for NPD Hermetic compressors industry simulation.

11494 Afr. J. Bus. Manage.
Appendix D. Results for NPD plastics pipes and fittings industry simulation.