invesco real estate income trust inc
TRANSCRIPT

INREIT: Invesco Real Estate Income Trust Inc.Investing where we consume, live, innovate, and connect
NOT FOR DISTRIBUTION TO FINANCIAL PROFESSIONALS OR INVESTORS IN THE STATES OF NEW JERSEY,
OHIO, AND WASHINGTON.
Not a Deposit | Not FDIC Insured | Not Guaranteed by the Bank | May Lose Value | Not Insured by any Federal Government Agency
This literature must be preceded or accompanied by a prospectus for Invesco Real Estate Income Trust Inc. (INREIT). This literature is neither an offer to sell nor a solicitation of an offer to buy securities. An offering is made only by the prospectus. This literature must be read in conjunction with the prospectus in order to fully understand all of the implications and risks of the offering of securities to which the prospectus relates. A copy of the prospectus must be made available to you in connection with any offering. No offering is made except by a prospectus filed with the Department of Law of the State of New York. Neither the Securities and Exchange Commission, the Attorney General of the State of New York nor any other state securities regulator has approved or disapproved of these securities, determined if the prospectus is truthful or complete or determined whether the offering can be sold in compliance with any existing or future suitability or conduct standards, including the Regulation Best Interest standard, to any or all purchasers. Any representation to the contrary is a criminal offense. Invesco Distributors, Inc. (member FINRA/SIPC) is the dealer manager for the INREIT offering. INREIT-PPT-1 NA5241 05/21

Summary of risk factors:
Invesco Real Estate Income Trust Inc. (INREIT) is a non-listed REIT that invests in stabilized, income-oriented commercial real estate in the United States. To a lesser extent, INREIT also invests in real estate-related securities to provide current income and a source of liquidity for its share repurchase plan, cash management and other purposes. This investment involves a high degree of risk and is intended only for investors with a long-term investment horizon and who do not require immediate liquidity or guaranteed income. If INREIT is unable to effectively manage the impact of the risks inherent in its business, it may not meet its investment objectives. You should only invest in INREIT if you can afford a complete loss of your investment. You should read the Prospectus carefully for a description of the risks associated with an investment in INREIT. The principal risks relating to an investment in INREIT include, but are not limited to the following:
• INREIT has a limited prior operating history, and there is no assurance that it will successfully achieve its investment objectives.
• INREIT has made limited investments to date and you will not have the opportunity to evaluate INREIT’s future investments before it makes them, which makes your investment more speculative.
• Since there is no public trading market for shares of INREIT’s common stock, repurchase of shares by INREIT will likely be the only way to dispose of your shares. INREIT’s share repurchase plan will provide stockholders with the opportunity to request that INREIT repurchases their shares on a monthly basis, but INREIT is not obligated to repurchase any shares and may choose to repurchase only some, or even none, of the shares that have been requested to be repurchased in any month. In addition, repurchases will be subject to available liquidity and other significant restrictions. Further, INREIT’s board of directors may make exceptions to, modify, or suspend its share repurchase plan. As a result, INREIT’s shares should be considered as having only limited liquidity and at times may be illiquid. Your ability to have your shares repurchased through INREIT’s share repurchase plan is limited, and if you do sell your shares to INREIT, you may receive less than the price you paid.
• INREIT cannot guarantee that it will make distributions, and if it does it may fund such distributions from sources other than cash flow from operations, including, without limitation, the sale of or repayments under INREIT’s assets, borrowings, or offering proceeds, and INREIT has no limits on the amounts it may pay from such sources.
• The purchase price and repurchase price for shares of INREIT’s common stock will generally be based on the prior month’s NAV and will not be based on any public trading market. While there will be independent valuations of INREIT’s properties quarterly, the valuation of properties is inherently subjective, and INREIT’s
NAV may not accurately reflect the actual price at which its properties could be liquidated on any given day.
• INREIT has no employees and is dependent on Invesco Advisers, Inc. (“Adviser”) to conduct its operations. The Adviser will face conflicts of interest as a result of, among other things, the allocation of investment opportunities among INREIT and Other Invesco Accounts (as defined in the Prospectus), the allocation of time of its investment professionals and the substantial fees that INREIT will pay to the Adviser.
• INREIT is conducting a “best efforts” offering. If INREIT is not able to raise a substantial amount of capital on an ongoing basis, its ability to achieve its investment objectives could be adversely affected.
• Principal and interest payments on any borrowings will reduce the amount of funds available for distribution or investment in additional real estate assets.
• There are limits on the ownership and transferability of INREIT’s shares. See “Description of Capital Stock –Restrictions on Ownership and Transfer” in the Prospectus for more information.
• INREIT does not own the Invesco name, but is permitted to use it as part of INREIT’s corporate name pursuant to a trademark license agreement with an affiliate of Invesco. Use of the name by other parties or the termination of INREIT’s trademark license agreement may harm its business.
• If INREIT fails to qualify as a REIT and no relief provisions apply, its NAV and cash available for distribution to its stockholders could materially decrease.
• Events or the conditions beyond INREIT’s control, including outbreaks of contagious disease such as the global pandemic of the novel coronavirus that causes the disease known as coronavirus disease 2019 (“COVID-19”), may have an adverse impact on INREIT’s NAV, results of operations and cash flows and INREIT’s ability to source investments, obtain financing, fund distributions and satisfy repurchase requests.
• Accurate valuations are more difficult to obtain in times of low transaction volumes due to fewer market transactions that can be considered in the context of the appraisal. There will be no retroactive adjustment in the valuation of assets, INREIT’s offering price of its common stock shares, the price INREIT paid to repurchase its common stock or NAV-based fees INREIT paid to the Adviser and the Dealer Manager to the extent valuations prove to not accurately reflect the realizable value of INREIT’s assets. The price you will pay for shares of INREIT’s common stock and the price at which shares may be repurchased will generally be based on the prior month’s NAV per share. As a result, you may pay more than realizable value or receive less than realizable value for your investment.
Important information
2

Forward-looking statement disclosure
This material contains forward-looking statements about INREIT’s business, including, in particular, statements
about its plans, strategies and objectives. You can generally identify forward-looking statements by the use of
forward-looking terminology such as “may,” “will,” “expect,” “intend,” “anticipate,” “estimate,” “believe,”
“continue” or other similar words. These statements include INREIT’s plans and objectives for future
operations, including plans and objectives relating to future growth and availability of funds, and are based on
current expectations that involve numerous risks and uncertainties. Assumptions relating to these statements
involve judgments with respect to, among other things, future economic, competitive and market conditions and
future business decisions, all of which are difficult or impossible to accurately predict and many of which are
beyond INREIT’s control. Although INREIT believes the assumptions underlying the forward-looking
statements, and the forward-looking statements themselves, are reasonable, any of the assumptions could be
inaccurate and, therefore, there can be no assurance that these forward-looking statements will prove to be
accurate, and INREIT’s actual results, performance and achievements may be materially different from that
expressed or implied by these forward-looking statements. In light of the significant uncertainties inherent in
these forward-looking statements, the inclusion of this information should not be regarded as a representation
by INREIT or any other person that INREIT’s objectives and plans, which are considered to be reasonable, will
be achieved.
Additional information about INREIT
An investment in INREIT is not a direct investment in real estate and has material differences from a direct
investment in real estate, including those related to fees and expenses, liquidity and tax treatment. INREIT’s
share price is subject to less volatility because its per share NAV is based on the value of real estate it owns
and is not subject to market pricing forces as are the prices of public REITs. Although INREIT’s share price is
subject to less volatility, INREIT shares are significantly less liquid than these asset classes and are not
immune to fluctuation. Private real estate is not traded on an exchange and will have less liquidity and price
transparency. The value of private real estate may fluctuate and may be worth less than was initially paid for it.
The volatility and risk profile of the indexes presented is likely to be different from that of INREIT including
those related to vehicle structure, investment objectives, costs and expenses, liquidity, safety, guarantees or
insurance, fluctuation of principal or return and tax features. In addition, the indexes employ different
investment guidelines and criteria than INREIT; as a result, the holdings in INREIT may differ significantly from
the holdings of the securities that comprise the indexes. The indexes are not subject to costs or expenses and
it may not be possible to invest in the indexes. The performance of the indexes has been selected to represent
an appropriate benchmark to compare to INREIT’s performance, but rather is disclosed to allow for comparison
of INREIT’s performance to that of well-known and widely recognized indexes. In the case of equity indexes,
performance of indexes reflects the reinvestment of dividends.
INREIT does not trade on a national exchange, and therefore, is generally illiquid. Your ability to redeem
shares in INREIT through INREIT’s repurchase plan is subject to significant limitations, and fees associated
with the sale of these products can be higher than other asset classes. In some cases, periodic distributions
may be subsidized by borrowed funds and include a return of investor principal. This is in contrast to
distributions investors receive from large corporate stocks that trade on national exchanges, which are typically
derived solely from earnings. Investors typically seek income from distributions over a period of 10 years. Upon
liquidation, return of capital may be more or less than the original investment depending upon the value of
assets.
An investment in INREIT is not an investment in fixed income. Fixed income has material differences from an
investment in a non-listed REIT, including those related to vehicle structure, investment objectives and
restrictions, risks, fluctuation of principal, safety, guarantees or insurance, fees and expenses, liquidity and tax
treatment.
About other Invesco Real Estate investments
This material includes information related to prior investments Invesco Real Estate has made, in which INREIT will not have any interest. While the investment programs of other Invesco real estate accounts and INREIT’s investment strategy each involve real estate-related investments and overlapping personnel, each of the accounts and strategies has distinct investment activities, including but not limited to, objectives, costs and expenses, tax features and leverage policies. Invesco Real Estate’s experience in managing other Invesco real estate accounts and other Invesco accounts is not necessarily applicable to INREIT. There can be no assurance that INREIT will be able to successfully identify, make and realize any particular investment or generate returns for its investors.
Important information
3
Important Index Information:
The following indexes represent investments with material differences from an
investment in non-traded REITs, such as INREIT, including related vehicle structure,
investment objectives and restrictions, risks, fluctuation of principal, safety,
guarantees or insurance, fees and expenses, liquidity, and tax treatment. An
investment in INREIT is not a direct investment in real estate and has material
differences from a direct investment in real estate, including those related to fees
and expenses, liquidity, and tax treatment.
US Private Real Estate is represented by the NCREIF Property Index (the “NPI”) on the basis that the NPI is the
broadest measure of private real estate index returns. The NPI is published by the National Council of Real
Estate Investment Fiduciaries and is a quarterly, composite total return (based on appraisal values) for private
commercial real estate properties held for investment purposes including fund expenses but excluding leverage
and management and advisory fees. The NPI excludes leverage and therefore is less volatile than real estate
vehicles such as INREIT, which employ leverage. All properties in the NPI have been acquired, at least in part,
on behalf of tax-exempt institutional investors and held in a fiduciary environment. NCREIF data reflects the
returns of a blended portfolio of institutional quality real estate and does not reflect the use of leverage or the
impact of management and advisory fees. US Equities are represented by the S&P 500 Index, an unmanaged
index of the 500 largest stocks, weighted by market capitalization and considered representative of the broader
stock market. The Russell 3000 Index is an unmanaged index that measures the performance of the largest
3,000 US companies representing approximately 98% of the investable US equity market. The Russell 3000
Index is constructed to provide a comprehensive, unbiased and stable barometer of the broad market and is
completely reconstituted annually to ensure new and growing equities are included. Both the S&P 500 Index and
Russell 3000 Index are subject to market risk. US Fixed Income is represented by the Bloomberg Barclays US
Aggregate Bond Index, an index of securities that covers the US investment grade fixed rate bond market, with
index components for government and corporate securities, mortgage pass-through securities and asset-backed
securities; and is subject to credit risk. US REITs are represented by the FTSE NAREIT All Equity REITs Index
(“NAREIT Index”), which is a free-float adjusted, market capitalization-weighted index of publicly traded US
equity REITs. The NAREIT Index is utilized as an institutional real estate performance benchmark. Constituents
of the NARIET Index include all tax-qualified publicly traded US REITs with more than 50% of total assets in
qualifying real estate assets other than mortgages secured by real property. Non-US equity is represented by the
MSCI All Country World Index ex-USA (“ACWI ex-USA Index”), which is a market-capitalization weighted index
designed to provide broad measure of stock performance throughout the world, with the exception of US-based
companies. The ACWI ex-USA Index includes both developing and emerging markets and provided a way to
monitor international exposure apart from US investments. The ACWI ex-USA Index is subject to foreign and
currency exchange rate risk. Foreign risk, including emerging and developing markets, can include fluctuations in
foreign currencies, political and economic instability, and foreign taxation issues. With currency exchange rate
risk, the dollar value of foreign investments will be affected by changes in the exchange rates between the dollar
and the currencies in which those investments are traded. Public real estate, bonds, equities, and non-equities
provide ready liquidity and are easily traded. The S&P 500 Index, Russell 300 Index, Bloomberg Barclays US
Aggregate Bond Index, NARIET Index, and ACWI ex-USA Index are meant to illustrate general market
performance; it is not possible to invest directly in an index. An investment in INREIT’s shares is different from a
direct investment in the commercial real estate properties represented by the NPI or US private real estate.
An investment in US private real estate differs from the (i) S&P 500 Index and the Russell 3000 Index in that US
private real estate investments are not large or mid cap stock indexes; (ii) Bloomberg Barclays US Aggerate
Bond Index in that US private real estate investments are not fixed-rate debt instruments, such as bonds that
represent debt issued by corporations across a variety of issuers with varying pricing, terms and conditions; (iii)
NARIET Index in that US private real estate investments are not publicly traded US equity REITs; (iv) ACWI ex-
USA Index in that US private real estate investments are not large or mid cap stock indexes nor do US private
real estate invest in foreign markets. These indexes are used in comparison to the NPI in order to illustrate the
differences in historical total returns generated by US private real estate, US equities, non-US equity and US
fixed income. The prices of securities represented by these indexes may change in response to factors including:
the historical and prospective earnings of the issuer, the value of its assets, general economic conditions, interest
rates and investor perceptions. All indexes are unmanaged and do not include the impact of fees and expenses.
Comparisons shown are for illustrative purposes only and do not represent specific investments or the
performance of INREIT.
Non-traded REITs do not trade on a national securities exchange, and therefore, are generally illiquid. Early
redemption of non-traded REIT shares is often very limited, and fees associated with the sale of these products
can be higher than other asset classes. In some cases, periodic distributions may be subsidized by borrowed
funds and include a return of investor principal. This is in contrast to the distributions investors receive from large
corporate stocks that trade on national exchanges, which are typically derived solely from earnings. Investors
typically seek income from non-traded REIT distributions over a period of years. Upon liquidation, return of
capital may be more or less than the original investment depending on the value of assets. INREIT shares may
be significantly less liquid than shares of publicly traded securities, and are not immune to fluctuations, including
downward fluctuations. Additionally, the value of INREIT’s underlying property holdings will fluctuate and be
Important information
4
worth more or less than the acquisition cost when sold. Investors are advised to consider the limitations on
liquidity of INREIT shares when also evaluating the volatility of its stock price as compared to that of the stock
prices of publicly traded securities.
Distributions received from a REIT, including distributions that are reinvested pursuant to a distribution
reinvestment plan, will generally be taxed as ordinary dividend income to the extent they are paid out of current
or accumulated earnings and profits. The current maximum US federal income tax rate for distributions payable
by corporations to domestic stockholders that are individuals, trusts, or estates is 20% (plus a 3.8% “Medicare
tax” surcharge). Distributions payable by REITs, however, generally are taxed at the ordinary income tax rate
applicable to the individual recipient, rather than the maximum 20% income tax rate, subject to certain applicable
deductions. However, if a long-term capital gain is recognized upon the sale of an asset, a portion of distributions
may be designated and treated as a long-term capital gain. In addition, some portion of distributions may not be
subject to tax in the year received due to the fact that depreciation expense reduces earnings and profits but
does not reduce cash available for distribution. Amounts distributed in excess of earnings and profits will reduce
the tax basis of an investment and will not be taxable to the extent thereof on a current basis, and distributions in
excess of tax basis will be taxable as an amount realized from the sale of shares of common stock. This, in
effect, would defer a portion of taxes payable until the investment is sold or the REIT is liquidated, at which time
one may be taxed at capital gains rates. However, each investor’s tax considerations are different and consulting
a tax advisor is recommended. Any of the data provided herein should not be construed as investment, tax,
accounting or legal advice. Fixed income securities are subject to interest rate, inflation, credit and default risk.
As interest rates rise, bond prices usually fall, and vice versa. Prices may decline if an issuer fails to make timely
payments or its credit strength weakens.
Other important information
The opinions expressed are those of INREIT as of the date appearing in the materials, are based on current market conditions and are subject to change without notice. These opinions may differ from those of other Invesco investment professionals. Stockholders, financial professionals and prospective investors should not rely solely upon the information presented when making an investment decision and should review the Prospectus. Certain information contained in the materials discusses general market activity, industry or sector trends, or other broad-based economic, market or political conditions and should not be construed as research or investment advice. The information contained herein does not constitute a recommendation of any investment strategy or product for a particular investor. Investors should consult a financial professional before making any investment decisions.
Invesco Advisers, Inc. is the investment adviser for INREIT; it provides investment advisory services to individual and institutional clients and does not sell securities. Invesco Distributors, Inc. (member FINRA/SIPC) is the dealer manager for the INREIT offering. Both entities are indirect, wholly owned subsidiaries of Invesco Ltd.
Invesco Real Estate is the real estate investment center of INREIT’s sponsor Invesco Ltd., a leading global investment firm (“Invesco”). The Adviser uses the personnel and global resources of Invesco Real Estate to provide investment management services to INREIT. Information regarding Invesco and Invesco Real Estate is included to provide information regarding the experience of INREIT’s adviser and its affiliates. An investment in INREIT is not an investment in our adviser or Invesco, as INREIT is a separate and distinct legal entity.
Important term definitions
Performance participation allocation
The Special Limited Partner will hold a performance participation interest in INREIT’s Operating Partnership that
entitles it to receive an allocation from the Operating Partnership equal to 12.5% of the Total Return, subject to a
6% Hurdle Amount and a High-Water Mark, with a Catch-Up (each term as defined below). Such allocation will
be made annually and accrue monthly.
“Total Return” for any period since the end of the prior calendar year shall equal the sum of: (1) all
distributions accrued or paid (without duplication) on the Operating Partnership units outstanding at the end of
such period since the beginning of the then-current calendar year, plus (2) the change in aggregate NAV of such
units since the beginning of the year, before giving effect to (x) changes resulting solely from the proceeds of
issuances of Operating Partnership units, (y) any allocation/accrual to the Performance Participation and (z)
applicable stockholder servicing fee expenses (including any payments made to us for payment of such
expenses). For the avoidance of doubt, the calculation of Total Return will (i) include any appreciation or
depreciation in the NAV of units issued during the then-current calendar year but (ii) exclude the proceeds from
the initial issuance of such units.
Specifically, the Special Limited Partner will be allocated a performance participation in an amount equal to:
• First, if the Total Return for the applicable period exceeds the sum of (1) the Hurdle Amount for that period
and (2) the Loss Carryforward Amount (any such excess, “Excess Profits”), 100% of such Excess Profits until
the total amount allocated to the Special Limited Partner equals 12.5% of the sum of (x) the Hurdle Amount
for that period and (y) any amount allocated to the Special Limited Partner pursuant to this clause (this is
commonly referred to as a “Catch-Up”); and
• Second, to the extent there are remaining Excess Profits, 12.5% of such remaining Excess Profits.
Important information
5

“Hurdle Amount” for any period during a calendar year means that amount that results in a 6% annualized
internal rate of return on the NAV of the Operating Partnership units (other than Class N units and Class E
units) outstanding at the beginning of the then-current calendar year and all Operating Partnership units (other
than Class N units and Class E units) issued since the beginning of the then-current calendar year, taking into
account the timing and amount of all distributions accrued or paid (without duplication) on all such units and all
issuances of Operating Partnership units over the period and calculated in accordance with recognized industry
practices. The ending NAV of the Operating Partnership units used in calculating the internal rate of return will
be calculated before giving effect to any allocation/accrual to the Performance Participation and applicable
stockholder servicing fee expenses, provided that the calculation of the Hurdle Amount for any period will
exclude any Operating Partnership units repurchased during such period, which units will be subject to the
Performance Participation upon repurchase as described below. Except as described below in regards to Loss
Carryforward Amounts, any amount by which Total Return falls below the Hurdle Amount will not be carried
forward to subsequent periods.
“Loss Carryforward Amount” shall initially equal zero and shall cumulatively increase by the absolute value
of any negative annual Total Return and decrease by any positive annual Total Return, provided that the Loss
Carryforward Amount shall at no time be less than zero and provided further that the calculation of the Loss
Carry forward Amount will exclude the Total Return related to any Operating Partnership units (other than
Class N units and Class E units) repurchased during such year, which units will be subject to the Performance
Participation upon repurchase as described below. The effect of the Loss Carryforward Amount is that the
recoupment of past annual Total Return losses will offset the positive annual Total Return for purposes of the
calculation of the Performance Participation. This is referred to as a “High-Water Mark.”
Correlation: A statistical measure of how two securities move in relation to each other. The higher the
coefficient (1.00 is the maximum), the greater the correlation between the two assets or markets.
Global Real Estate Sustainability Benchmark (GRESB): The environmental, social and governance
benchmark for real assets.
Leverage ratio: Leverage ratio is measured by dividing (i) consolidated property-level and entity-level debt net
of cash and loan-related restricted cash, by (ii) the asset value of real estate investments (measured using the
greater of fair market value and cost) plus the equity in INREIT’s settled real estate debt investments.
Indebtedness incurred (i) in connection with funding a deposit in advance of the closing of an investment or (ii)
as other working capital advances will not be included as part of the calculation above. The leverage ratio
would be higher if the indebtedness on INREIT’s real estate debt investments and the pro rata share of debt
within INREIT’s unconsolidated investments were taken into account.
Principles for responsible investments: The UN Principles for Responsible Investment (PRI) is an
international organization that works to promote the incorporation of environmental, social and corporate
governance factors (ESG) into investment decision-making.
Risk-adjusted return: A calculation of the profit or potential profit from an investment that takes into account
the degree of risk that must be accepted in order to achieve it.
Standard deviation: Measures the degree to which the performance of a portfolio varies from its average
performance during a specialized period.
Important term definitions
6

The potential benefits of private real estate
7
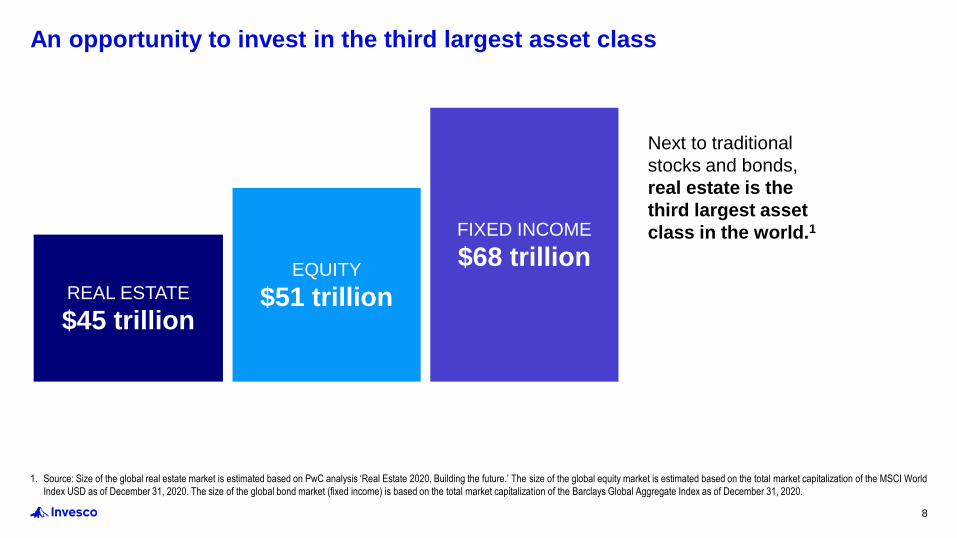
1. Source: Size of the global real estate market is estimated based on PwC analysis ‘Real Estate 2020, Building the future.’ The size of the global equity market is estimated based on the total market capitalization of the MSCI World
Index USD as of December 31, 2020. The size of the global bond market (fixed income) is based on the total market capitalization of the Barclays Global Aggregate Index as of December 31, 2020.
An opportunity to invest in the third largest asset class
REAL ESTATE
$45 trillion
EQUITY
$51 trillion
FIXED INCOME
$68 trillion
Next to traditional
stocks and bonds,
real estate is the
third largest asset
class in the world.1
8

There may be material differences in the investment goals, liquidity needs, and investment horizons of individual and institutional investors. Investors should consult with a
financial professional regarding their own situation and risk tolerance before making any investment decisions.
1. Source: DC Plans: PSCA, 62nd Annual Survey Reflecting 2018 Plan Experience, plans with 5,000+ participants: Corporate Defined Benefit Plans/Sovereign Wealth Funds/Endowment & Foundation/Public DB Plans: Cornell
University and Hodes Weill Associates. “2019 Institutional Real Estate Allocations Monitor” (data represents average target real estate allocation among survey respondents, representing 212 institutions in 24 countries, with total
assets under management of more than US$12.3 trillion and portfolio investments in real estate totaling approximately US$1.1 trillion); Target Date Funds: Morningstar, based on 20 largest 2030/2035 mutual funds. Data as of
12/30/2019. Most recent data available.
Real estate investing gap between institutional and individual investors
Institutional investors have
long understood the merits of
real estate and have
historically devoted a larger
portion of their portfolios to
this important asset class, but
retail investors have typically
committed much lower
portfolio allocations and may
be missing out.
11.2%
8.2% 8.0%
6.1%
2.0%
0.4%
0%
2%
4%
6%
8%
10%
12%
Public definedbenefit (DB)
plans
CorporateDB plans
Sovereignwealth funds
Endowmentand
foundation
Targetdate funds
Definedcontribution(DC) plans
Retail investors
Institutional investors
Average real estate allocations1
9

1. There is no guarantee that INREIT will provide diversification. Diversification does not guarantee a profit or eliminate the risk of loss.
2. The is no guarantee that INREIT income will provide a hedge against inflation or keep pace with inflation.
3. There is no assurance INREIT will pay distributions in any particular amount, if at all. Distributions may be modified and are at the discretion of the board of directors. Distributions may be funded from sources other than cash flow
from operations, including, without limitation, the sale of assets, borrowings, return of capital or offering proceeds, and there are no limits on the amounts that may be paid from such sources.
In a continued market environment of low yields and economic uncertainty, private real estate offers investors
a distinct opportunity to realize several potential benefits:
Real estate may deliver key benefits where investors need them most
DIVERSIFICATION1
Private real estate markets have
historically been uncorrelated with
stocks and bonds, helping
investors diversify their portfolio
and potential sources of income.
INFLATION HEDGE2
Income generated by real estate
has historically kept pace with
inflation.
TAX ADVANTAGES Private real estate may benefit
from tax efficiencies.
DURABLE INCOME3
Income in the private real estate
markets has been historically
higher than traditional stocks and
bonds.
10

The indexes noted below represent investments with material differences from an investment in INREIT, including related vehicle structure, investment objectives and
restrictions, risks, fluctuation of principal, safety, guarantees or insurance, fees, and expenses, liquidity and tax treatment. An investment in INREIT is not a direct investment
in real estate and has material differences from a direct investment in real estate, including those related to fees and expenses, liquidity, and tax treatment. For more
information about the indexes, please see “Important Index Information” at the beginning of this presentation.Source: Invesco Real Estate January 2000– December 2020. Volatility is represented by standard deviation, which is a statistical measure of risk quantifying the dispersion of returns. Equity is represented by S&P 500 Index; bonds
are represented by Bloomberg Barclays US Aggregate Bond Index and private US Real Estate is represented by NCREIF Property Index. You cannot invest directly in an index. NCREIF data reflects the returns of a blended portfolio
of institutional quality real estate and does not reflect the use of leverage or the impact of management and advisory fees. Index performance does not represent INREIT performance and an investment in INREIT is not an investment
in any index. The allocations shown above are for illustrative purposes only and should not be seen as recommendations. The performance results shown are hypothetical (not real) and were achieved by means of the retroactive
application of the statistical model. It may not be possible to replicate the hypothetical results. Please discuss your investment portfolio, and whether or not investment in real estate makes sense for you, with your financial adviser.
Historical events and past performance may not be indicative of future results as current investment opportunities may differ.
An opportunity to thoughtfully diversify portfolios
Adding private real estate to a traditional 60% equity/40% fixed income portfolio has historically increased returns and
reduced volatility over a 20-year period (January 2000 – December 2020).
TRADITIONAL 60/40 PORTFOLIO60% Equity
40% Fixed income
6.44%Return
13.36%Volatility
6.54%Return
13.18%Volatility
+10%PRIVATE REAL ESTATE ALLOCATION55% Equity
35% Fixed income
10% Private real estate
Equities
Fixed Income
Private Real Estate
Equities
Fixed Income
11

The indexes noted below represent investments with material differences from an investment in INREIT, including related vehicle structure, investment objectives and
restrictions, risks, fluctuation of principal, safety, guarantees or insurance, fees and expenses, liquidity, and tax treatment. An investment in INREIT is not a direct investment
in real estate and has material differences from a direct investment in real estate, including those related to fees and expenses, liquidity, and tax treatment. For more
information about the indexes, please see “Important Index Information” at the beginning of this presentation.Figures are annualized for the 20-year period ended December 31, 2020. Sharpe ratio is a measure of risk-adjusted returns. Volatility is measured by standard deviation. Correlation is a statistical measure of how two assets move in
relation to each other. The higher the coefficient (1.00 is the maximum and would indicate perfect correlation), the greater the correlation between the two assets. The following indexes were used to represent major asset classes:
NCREIF Property Index (private real estate), Barclays US Aggregate Total Return (US fixed income), FTSE Nareit All Equity REITs (US REITs), Russell 3000 (US equity), MSCI ACWI ex USA (non-US equity). It is not possible to
invest directly in an index. Index performance does not represent INREIT performance and an investment in INREIT is not an investment in any index. There is no guarantee that INREIT will provide diversification. Diversification does
not guarantee a profit or eliminate the risk of loss. Past performance does not guarantee future results.
An opportunity to thoughtfully diversify portfolios
Private real estate US fixed income US REITs US equity Non-US equity
Total return % 8.19 4.83 10.02 7.82 5.69
Standard deviation % 4.61 3.37 21.27 17.77 19.88
Sharpe ratio 1.47 1.01 0.40 0.36 0.21
Private real estate US fixed income US REITs US equity Non-US equity
Private real estate (NCREIF) 1.00 0.16 0.24 0.14 0.12
US fixed income 1.00 0.03 -0.32 -0.22
US REITs 1.00 0.71 0.66
US equity 1.00 0.90
Non-US equity 1.00
Correlations between private real estate and major asset classes for 20-year period, ended December 31, 2020
Annualized performance, volatility and risk-adjusted returns for 20-year period, ended December 31, 2020
12
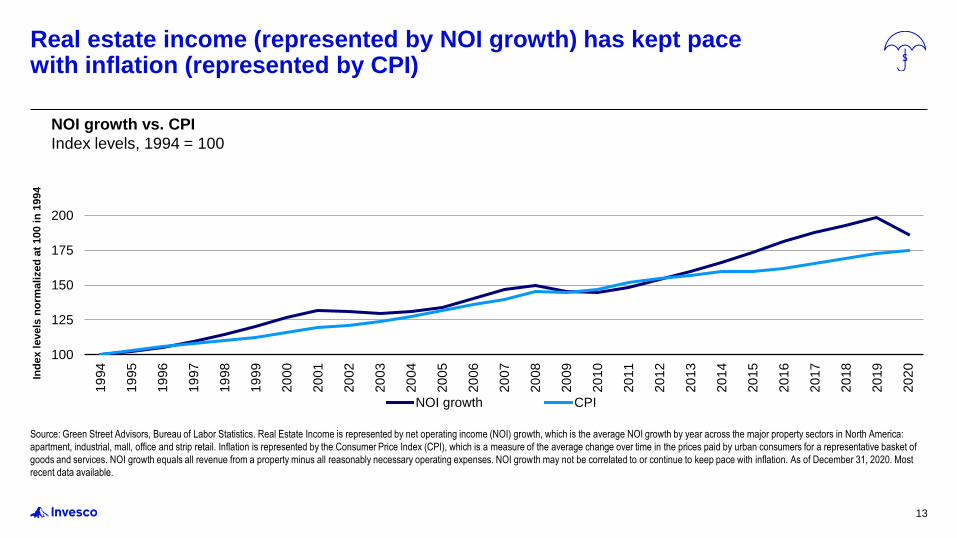
Source: Green Street Advisors, Bureau of Labor Statistics. Real Estate Income is represented by net operating income (NOI) growth, which is the average NOI growth by year across the major property sectors in North America:
apartment, industrial, mall, office and strip retail. Inflation is represented by the Consumer Price Index (CPI), which is a measure of the average change over time in the prices paid by urban consumers for a representative basket of
goods and services. NOI growth equals all revenue from a property minus all reasonably necessary operating expenses. NOI growth may not be correlated to or continue to keep pace with inflation. As of December 31, 2020. Most
recent data available.
100
125
150
175
200
19
94
19
95
19
96
19
97
19
98
19
99
20
00
20
01
20
02
20
03
20
04
20
05
20
06
20
07
20
08
20
09
20
10
20
11
20
12
20
13
20
14
20
15
20
16
20
17
20
18
20
19
20
20
NOI growth CPI
NOI growth vs. CPI
Index levels, 1994 = 100
Real estate income (represented by NOI growth) has kept pace with inflation (represented by CPI)
13
Ind
ex l
evels
no
rmali
zed
at
100 i
n 1
994
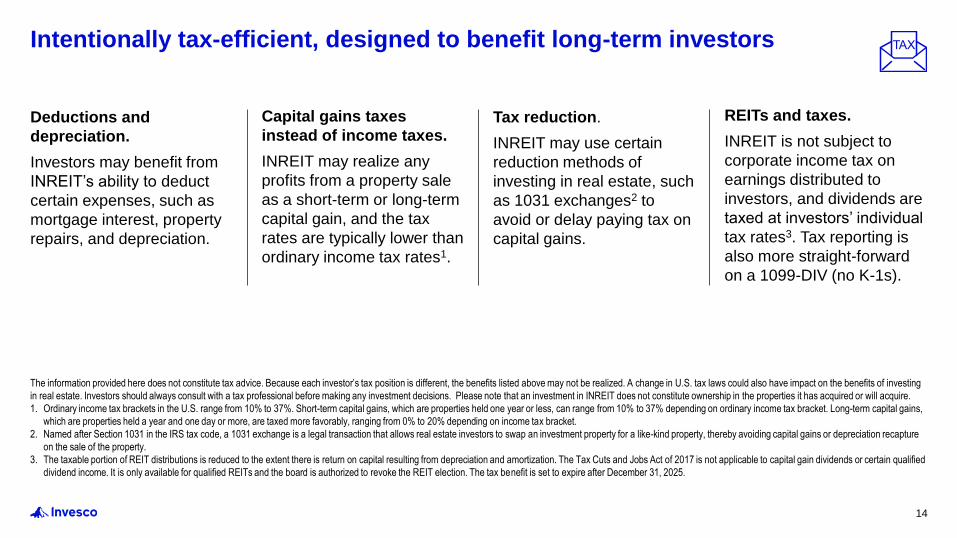
The information provided here does not constitute tax advice. Because each investor’s tax position is different, the benefits listed above may not be realized. A change in U.S. tax laws could also have impact on the benefits of investing
in real estate. Investors should always consult with a tax professional before making any investment decisions. Please note that an investment in INREIT does not constitute ownership in the properties it has acquired or will acquire.
1. Ordinary income tax brackets in the U.S. range from 10% to 37%. Short-term capital gains, which are properties held one year or less, can range from 10% to 37% depending on ordinary income tax bracket. Long-term capital gains,
which are properties held a year and one day or more, are taxed more favorably, ranging from 0% to 20% depending on income tax bracket.
2. Named after Section 1031 in the IRS tax code, a 1031 exchange is a legal transaction that allows real estate investors to swap an investment property for a like-kind property, thereby avoiding capital gains or depreciation recapture
on the sale of the property.
3. The taxable portion of REIT distributions is reduced to the extent there is return on capital resulting from depreciation and amortization. The Tax Cuts and Jobs Act of 2017 is not applicable to capital gain dividends or certain qualified
dividend income. It is only available for qualified REITs and the board is authorized to revoke the REIT election. The tax benefit is set to expire after December 31, 2025.
Capital gains taxes
instead of income taxes.
INREIT may realize any
profits from a property sale
as a short-term or long-term
capital gain, and the tax
rates are typically lower than
ordinary income tax rates1.
Deductions and
depreciation.
Investors may benefit from
INREI ’s ability to deduct
certain expenses, such as
mortgage interest, property
repairs, and depreciation.
Tax reduction.
INREIT may use certain
reduction methods of
investing in real estate, such
as 1031 exchanges2 to
avoid or delay paying tax on
capital gains.
REITs and taxes.
INREIT is not subject to
corporate income tax on
earnings distributed to
investors, and dividends are
taxed at investors’ individual
tax rates3. Tax reporting is
also more straight-forward
on a 1099-DIV (no K-1s).
Intentionally tax-efficient, designed to benefit long-term investors
14

The indexes noted below represent investments with material differences from an investment in INREIT, including related vehicle structure, investment objectives and
restrictions, risks, fluctuation of principal, safety, guarantees or insurance, fees and expenses, liquidity, and tax treatment. An investment in INREIT is not a direct investment
in real estate and has material differences from a direct investment in real estate, including those related to fees and expenses, liquidity, and tax treatment. For more
information about the indexes, please see “Important Index Information” at the beginning of this presentation.Source: Morningstar Direct. 20-year average income return is as of December 31, 2020. US private real estate is represented by NCREIF Property Index; US equity is represented by S&P 500 Index; US fixed income is represented
by Bloomberg Barclays US Aggregate Bond Index. You cannot invest directly in an index. Index performance does not represent INREIT performance, and an investment in INREIT is not an investment in any index. Past performance
is not indicative of future results. There is no guarantee that any trends shown herein will continue. There is no assurance INREIT will pay distributions in any particular amount, if at all. Distributions may be modified and are at the
discretion of the board of directors.
Private real estate income and appreciation returns
Durable income return potential
20–year average
income return6.11%
PRIVATE REAL ESTATE
3.69%FIXED INCOME
1.88%EQUITY
15
-25%-20%-15%-10%
-5%0%5%
10%15%20%25%
2000 2001 2002 2003 2004 2005 2006 2007 2008 2009 2010 2011 2012 2013 2014 2015 2016 2017 2018 2019 2020
Annual re
turn
s
Income return Appreciation return (loss)

The Invesco Real Estate advantage
16

Source: Invesco Real Estate as of December 31, 2020. Invesco Real Estate's assets under management (AUM) represents $63.505 billion in direct real estate and $19.257 billion in listed real assets offered through various vehicles
and/or affiliates of Invesco Distributors, Inc.
2020 Assessment Reports for Invesco Ltd., PRI. The investment categories are evaluated using six performance bands (A+, A, B, C, D, and E), where A+ distinguishes the top scoring signatories, representing a score of 95% or
above and A distinguishes a score of 75% or above. Any reference to a ranking, a rating or an award provides no guarantee for future performance results and is not constant over time. For more information about PRI and GRESB,
please see the other definitions page near the end of this presentation.
GLOBAL
PLATFORM
• An industry-leading real estate investing firm with global resources and scale
• Global footprint with local-market expertise and execution; 21 offices in 16 countries, 589 real estate professionals
INVESTMENT
EXPERTISE
• 38 years of investing our clients’ capital across the globe with $82.8 billion under UM
• All, private and listed, investment capabilities are managed in-house through our expert team
• More than 80% of direct Invesco Real Estate assets are in core and core plus (income) strategies
PROOF IN
PERFORMANCE
• Proven track record of investing through market cycles
• Robust sourcing and deal flow pipelines
COMMITMENT TO
SUSTAINABILITY
• Firm commitment to employing responsible investment practices
• “ ” rating: Principles for Responsible Investment score
• Green Star rating by GRESB for eight consecutive years
Invesco Real Estate has a deep history of serving our clients’ investment needs
17

Source: Invesco Real Estate as of December 31, 2020. Invesco Real Estate's assets under management (AUM) represents $63.505 billion in direct real estate and $19.257 billion in listed real assets offered through various vehicles
and/or affiliates of Invesco Distributors, Inc.
Global reach and local expertise
$82.8 billionUnder management globally
38 yearsTrack record
27 yearsManaging directors’
average experience
589Real estate professionals
18
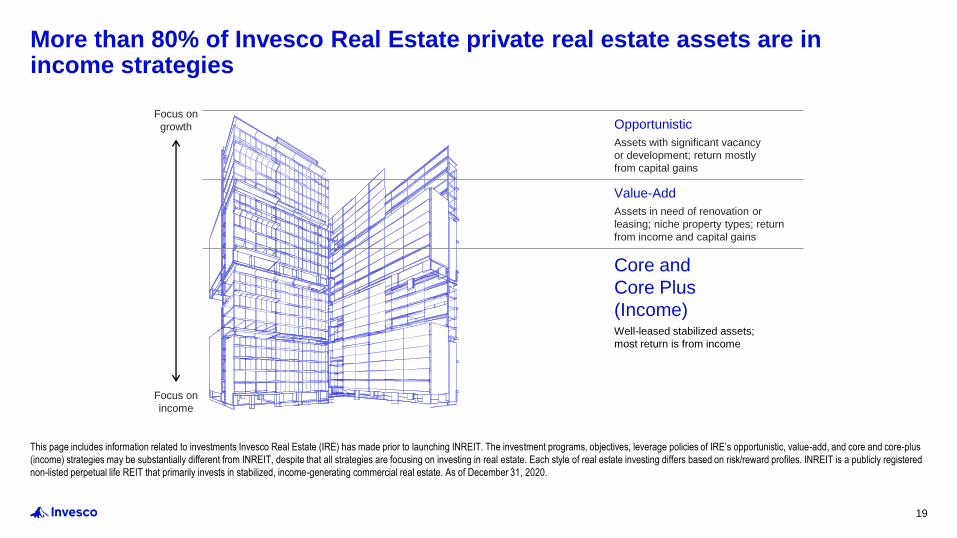
This page includes information related to investments Invesco Real Estate (IRE) has made prior to launching INREIT. The investment programs, objectives, leverage policies of IRE’s opportunistic, value-add, and core and core-plus
(income) strategies may be substantially different from INREIT, despite that all strategies are focusing on investing in real estate. Each style of real estate investing differs based on risk/reward profiles. INREIT is a publicly registered
non-listed perpetual life REIT that primarily invests in stabilized, income-generating commercial real estate. As of December 31, 2020.
More than 80% of Invesco Real Estate private real estate assets are in income strategies
Core and
Core Plus
(Income)Well-leased stabilized assets;
most return is from income
Opportunistic
Assets with significant vacancy
or development; return mostly
from capital gains
Value-Add
Assets in need of renovation or
leasing; niche property types; return
from income and capital gains
Focus on
growth
Focus on
income
19

Data as of December 31, 2020. The performance information for “IRE Core Ex Gateway Leveraged (Gross)” composite was derived from the Invesco Core Real Estate Composite, a non-compliant supplemental portfolio to the Invesco North America Direct Real Estate Composite, by excluding six gateway markets represented by the New York City, Washington DC, San Francisco, Los Angeles, Boston and Seattle MSAs and recalculating the composite. The returns are quarterly time weighted total returns calculated in compliance with PREA Reporting Standards. Returns are leveraged, property level, and gross of fees. Leverage for the composite was estimated to be approx. 29.26%. The composite consists of property level returns of core properties held in separate accounts and fund vehicles under Invesco Real Estate’s management whose fees vary by client and vehicle. The returns are shown here gross of fees, in line with the benchmark data, and would be lower when reduced by the advisory fees and any other expenses incurred in the management of an investment advisory account. For example, an account with an assumed growth rate of 10% would realize a net of fees annualized return of 8.91% after three years, assuming a 1% management fee.The NFI-ODCE (Equal Weighted) index reflects investment level returns on a leveraged basis, gross of fees. Leverage for the index was estimated to be approx. 24.70%. The NFI-ODCE index includes gateway markets. Therefore, the IRE Core Ex Gateway composite returns are not entirely comparable to the NFI-ODCE index returns. An investment cannot be made directly in an index.All data was compiled from sources believed to be reliable, but accuracy cannot be guaranteed. Past performance is not indicative of future results. Investors should not assume that investment decisions made in the future will be profitable or will equal the investment performance of the past. Index performance does not represent INREIT performance, and an investment in INREIT is not an investment in any index.
Invesco Real Estate Core Ex Gateway Composite – Total Returns
Invesco Core Real Estate Composite has historically delivered strong performance over the long term
Annual re
turn
s (
%)
20

Data as of December 31, 2020. The performance information for “IRE Core Ex Gateway-Income Return” is the income component of “IRE Core Ex Gateway Leveraged (Gross)” total return index, which was derived from the Invesco Core Real Estate Composite, a non-compliant supplemental portfolio to the Invesco North America Direct Real Estate Composite, by excluding six gateway markets represented by the New York City, Washington DC, San Francisco, Los Angeles, Boston and Seattle MSAs and recalculating the composite. Invesco Real Estate Core Ex Gateway Composite consists of property level returns of core properties held in separate accounts and fund vehicles under Invesco Real Estate’s management whose fees vary by client and vehicle. The NFI-ODCE (Equal Weighted)-Income Return reflects income component of NFI-ODCE (Equal Weighted) total return index calculated on a leveraged basis and gross of fees. Leverage for the index was estimated to be approx. 24.70%. The NFI-ODCE index includes gateway markets. Therefore, the IRE Core Ex Gateway composite returns are not entirely comparable to the NFI-ODCE index returns. An investment cannot be made directly in an index.All data was compiled from sources believed to be reliable, but accuracy cannot be guaranteed. Past performance is not indicative of future results. Investors should not assume that investment decisions made in the future will be profitable or will equal the investment performance of the past. Index performance does not represent INREIT performance, and an investment in INREIT is not an investment in any index.
Invesco Real Estate Core Ex Gateway Composite – Income Return
Invesco Core Real Estate Composite has historically delivered higher income return
5.9% IRE Core Ex Gateway
5.1% NFI-ODCE EW
15-year average
annual income:
21

About INREIT
22

INREIT has a limited prior operating history, and there is no assurance it will achieve its investment objectives or provide the outcomes discussed in this material.
1. There is no assurance INREIT will pay distributions in any particular amount, if at all. Distributions may be modified and are at the discretion of the board of directors. Distributions may be funded from sources other than cash flow
from operations, including, without limitation, the sale of assets, borrowings, return of capital or offering proceeds, and there are no limits on the amounts that may be paid from such sources.
2. Invesco does not offer tax advice. Please consult your tax professional for information regarding your own personal tax situation. See page 14 for important tax information.
INREIT provides access to the private real estate market in a vehicle designed to help meet investors’ needs
Unique strategy
• Heightened focus on structural
growth assets
• Ability to invest globally in the future
• Careful use of leverage
• Immediate investment in portfolio
backed by institutional investors
• Advantageous timing due to launch
date
Attractive terms
• Low investment minimums
• Monthly subscriptions and
redemptions
• Monthly distributions1
• Multiple share classes
• Competitive fees
• No lock-up period
Tax-smart vehicle2
• REIT structure
• Simple tax reporting 1099-Div (no K-
1s)
• Current income tax minimization
• Estate tax minimization
23

Source: Invesco Real Estate. For illustrative purposes only.
Rethinking real estate investments
24
Where we consume
Industrial
Retail
Self-storage
Hotels
Medical offices
Where we live
Apartments
Single-family rentals
Senior housing
Manufactured housing
Student housing
Where we innovate
Office
Life science
How we connect
Infrastructure
Data centers
How we connect
Where we innovate
Where we consume
Where we live
For illustrative purposes only.
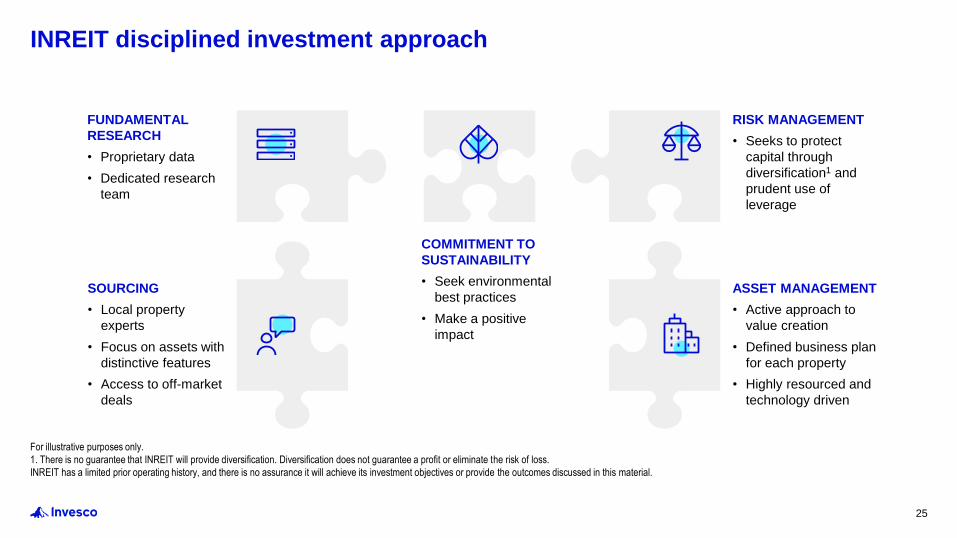
1. There is no guarantee that INREIT will provide diversification. Diversification does not guarantee a profit or eliminate the risk of loss.
INREIT has a limited prior operating history, and there is no assurance it will achieve its investment objectives or provide the outcomes discussed in this material.
INREIT disciplined investment approach
FUNDAMENTAL
RESEARCH
• Proprietary data
• Dedicated research
team
RISK MANAGEMENT
• Seeks to protect
capital through
diversification1 and
prudent use of
leverage
COMMITMENT TO
SUSTAINABILITY
• Seek environmental
best practices
• Make a positive
impact
SOURCING
• Local property
experts
• Focus on assets with
distinctive features
• Access to off-market
deals
ASSET MANAGEMENT
• Active approach to
value creation
• Defined business plan
for each property
• Highly resourced and
technology driven
25
1. INREIT has a limited prior operating history, and there is no assurance it will achieve its investment objectives or provide the outcomes discussed in this material.
2. There is no assurance INREIT will pay distributions in any particular amount, if at all. Distributions may be modified and are at the discretion of the board of directors. Distributions may be funded from sources other than cash flow
from operations, including, without limitation, the sale of assets, borrowings, return of capital or offering proceeds, and there are no limits on the amounts that may be paid from such sources.
3. There is no guarantee that INREIT will provide diversification. Diversification does not guarantee a profit or eliminate the risk of loss.
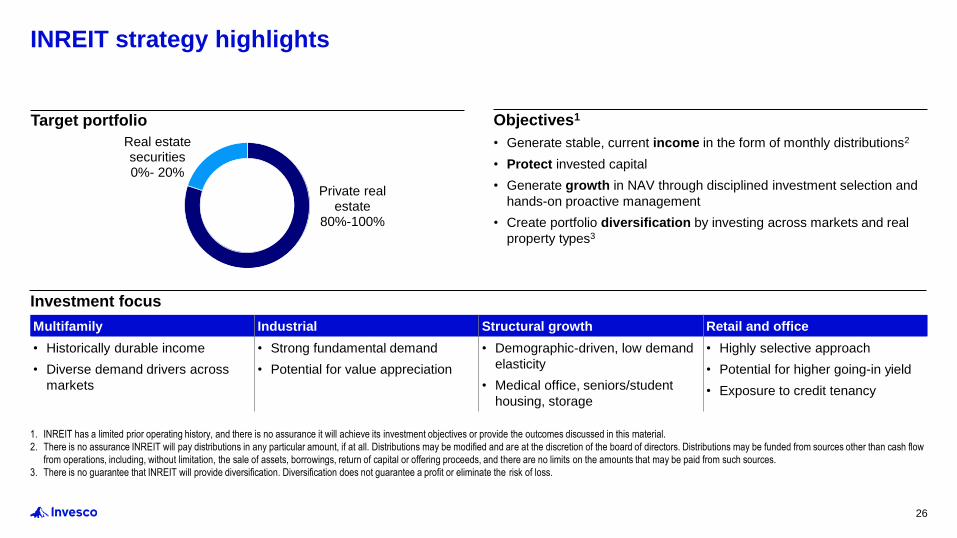
INREIT strategy highlights
Private real estate
80%-100%
Real estate securities0%- 20%
Investment focus
Multifamily Industrial Structural growth Retail and office
• Historically durable income
• Diverse demand drivers across
markets
• Strong fundamental demand
• Potential for value appreciation
• Demographic-driven, low demand
elasticity
• Medical office, seniors/student
housing, storage
• Highly selective approach
• Potential for higher going-in yield
• Exposure to credit tenancy
Target portfolio Objectives1
• Generate stable, current income in the form of monthly distributions2
• Protect invested capital
• Generate growth in NAV through disciplined investment selection and
hands-on proactive management
• Create portfolio diversification by investing across markets and real
property types3
26

1. Terms summarized herein are for informational purposes and qualified in their entirety by the more detailed information in the Prospectus. You should read the Prospectus carefully prior to making an investment.
2. INREIT may offer shares based on an offering price that INREIT believes reflects the NAV per share more appropriately than the prior month’s NAV per share, including by updating a previously disclosed transaction price, in
cases where INREIT believes there has been a material change (positive or negative) to its NAV per share since the end of the prior month.
3. There is no assurance INREIT will pay distributions in any particular amount, if at all. Distributions may be modified and are at the discretion of the board of directors. Distributions may be funded from sources other than cash flow
from operations, including, without limitation, the sale of assets, borrowings, return of capital or offering proceeds, and there are no limits on the amounts that may be paid from such sources.
4. For additional information, see “Share Repurchases” in the Prospectus.
INREIT offering terms
Key terms1
Structure Non-exchange-listed, perpetual-life real estate investment trust (REIT)
Offering price2 Generally equal to INREIT's prior month's NAV per share for its respective class as of the last calendar day of such month, plus applicable selling commissions and dealer manager fees.
Subscriptions MonthlySubscriptions are executed on the first calendar day of each month. Subscription requests must be received in good order at least five business days prior to the first calendar day of the month.
NAV MonthlyNAV per share will generally be calculated within 15 calendar days of month end and made available on www.inreit.com, via our toll-free telephone number at (833) 834-4924 and in prospectus supplements.
Distributions3 Monthly Not guaranteed, subject to board approval.
Repurchases4 MonthlyRepurchases are executed on the last day of each month. Requests must be received in good order at least two business days before month end. Total repurchases are limited to 2% of aggregate NAV per month and 5% per calendar quarter. There is no lock up period, however, shares not held for at least 12 months will be repurchased at 95% of NAV. The share repurchase plan is subject to other limitations and INREI ’s board may make exceptions to, modify, or suspend the plan.
Tax reporting Form 1099-DIV
27

1. See Important term definitions in the beginning of this material for a detailed explanation of Performance participation allocation.
2. For purposes of determining whether you satisfy the standards above, your net worth is calculated excluding the value of your home, home furnishings and automobiles. Select broker-dealers may have different suitability
standards, may not offer all share classes, and/or may offer INREIT at a higher minimum initial investment. With respect to Class T shares, the amounts of upfront selling commissions and upfront dealer manager fees may vary at
certain broker-dealers, provided the sum not exceed 3.5% of the transaction price. Advisor and dealer stockholder servicing fee for Class T shares may also vary at select broker-dealers, provided the sum of such fees will always
equal 0.85% per annum of the NAV of such shares. Broker-dealers may also charge additional fees for certain accounts, such as wrap accounts.
3. Select broker-dealers may offer INREIT at higher minimums. The minimum subsequent investment does not apply to purchases made under INREIT's distribution reinvestment plan.
INREIT offering terms (continued)
Share class-specific fees2 Class I Class D Class S Class T
Suitability standards Purchaser must have either (1) a net worth of at least $250,000 or (2) a gross annual income of at least $70,000 and a net
worth of at least $70,000. Certain states have additional suitability standards. See the Prospectus for more information.
Availability Through fee-based (wrap) programs, registered investment
advisors, and other institutional and fiduciary accounts
Through transactional/brokerage accounts
Minimum initial investment $1,000,000 $2,500 $2,500 $2,500
Subsequent investment3 $500 $500 $500 $500
Selling commissions (upfront) None Up to 1.5% Up to 3.5% Up to 3.0%
Dealer-manager fee (upfront) None None None 0.50%
Stockholder servicing fees
(per annum, payable monthly) (ongoing)
None 0.25% 0.85% 0.65% Advisor
0.20% Dealer
Advisor fees
Management fee 1% per annum of NAV, payable monthly
Performance participation allocation1 12.5% of the annual total return, subject to a 6% annual hurdle amount and a high-water mark, with a catch up, payable
annually and accruing monthly
28
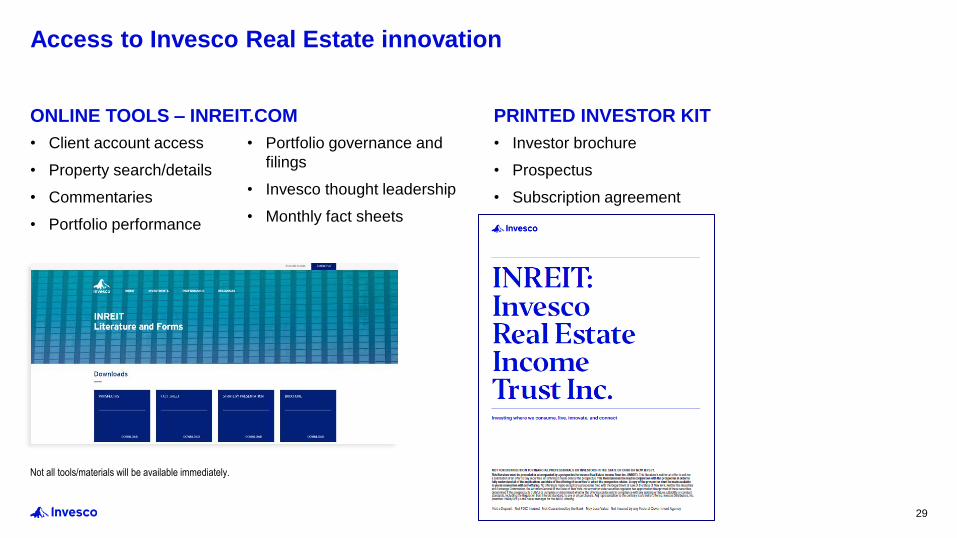
Not all tools/materials will be available immediately.
• Client account access
• Property search/details
• Commentaries
• Portfolio performance
• Portfolio governance and
filings
• Invesco thought leadership
• Monthly fact sheets
• Investor brochure
• Prospectus
• Subscription agreement
ONLINE TOOLS – INREIT.COM PRINTED INVESTOR KIT
Access to Invesco Real Estate innovation
29
