introduction - eprints.soton.ac.uk€¦ · web viewword count 3892. background. intensive ......
TRANSCRIPT

A randomised controlled trial of a web-based intervention (POWeR+) with brief nurse support to
manage obesity in primary care.
Professor Paul Little FMedSci1 Beth Stuart PhD1, Professor FD Richard Hobbs FMedSci,3 Jo Kelly
BSc1, Emily R Smith,PhD 2 Katherine J Bradbury PhD, 2 Stephanie Hughes BA1, Professor Peter WF
Smith PhD,4 Professor Michael V Moore FRCGP, 1 Professor Mike EJ Lean MD,6 Professor Barrie M
Margetts PhD, 1 Professor Chris D Byrne PhD,7 Professor Simon Griffin MD,8 Mina Davoudianfar BA3,
Julie Hooper BA1, Associate Professor Guiqing Yao PhD,5 Shihua Zhu PhD,5 Professor James Raftery
PhD 5 Professor Lucy Yardley PhD2
1. Primary Care and Population Sciences Unit, Faculty of Medicine, University of Southampton,
Southampton, UK.
2. Centre for Applications of Health Psychology (CAHP), Faculty of Social and Human Sciences,
University of Southampton, Southampton, UK.
3. Nuffield Department of Primary Care Health Sciences, University of Oxford,
4. Southampton Statistical Sciences Research Institute, University of Southampton, Southampton, UK
5. Health Economic Analyses Team (HEAT), Primary Care and Population Sciences Unit, University of
Southampton.
6. Human Nutrition, School of Medicine,University of Glasgow, Glasgow, UK.
7. Southampton National Institute for Health Research (NIHR) Biomedical Research Centre, University
Hospital Southampton and University of Southampton, Southampton, UK.
8. Cambridge MRC Epidemiology Unit, University of Cambridge School of Clinical Medicine, Box 285
Institute of Metabolic Science, Cambridge Biomedical Campus,
Cambridge CB2 0QQ
Word count 3892
1

Background. Intensive behavioural counselling is effective for obesity, but resource requirements
severely limit widespread implementation in primary care. We aimed to estimate the effectiveness and
cost-effectiveness of an internet-based behavioural intervention with brief practice nurse support.
Methods. POWeR+ is a 24 session web-based weight management intervention lasting 6 months. Adults
with BMI>=30 (or >=28 with additional risk factors) were identified from UK GP records and sent postal
invitations. Following online registration with POWeR+, patients were randomly allocated using
computer generated random numbers by the website to either: 1) Control. An intervention which had
previously demonstrated effectiveness: brief web-based information which minimised pressure to reduce
foods, instead encouraging swaps to healthier choices and increasing fruit and vegetables, plus 6-monthly
nurse weighing, or 2) POWeR+Face-to-face (POWeR+F) with face-to-face nurse-support (<=7
contacts/6 months), or 3) POWeR+Remote (POWeR+R) with remote nurse-support (<=5 emails or brief
phone calls/6 months).
Findings. Weight loss averaged over 12 months (the primary outcome) was documented among
666/818 (81%) participants. Analysis was intention to treat analysis using multiple imputation for
missing data. The control group lost nearly 3 Kg (baseline 104.4, 6 months 101.9, 12 months 101.7).
Compared with the control group POWeR+F achieved additional weight reduction of 1.5kg averaged
over 12 months (95% confidence intervals 0.6 to 2.4, p=0.001) and 1.3kg for POWeR+R (0.34 to 2.2,
p=0.007). By 12 months 20.8% of the control group had maintained a clinically important 5% weight
reduction, POWeR+F 29.2% (Risk ratio 1.56, 0.96 to 2.51, p=0.070), and POWeR+R 32.4% (1.82, 1.31
to 2.74 ,p=0.004). Health service costs of the intervention were low, and the incremental overall cost per
kg weight lost compared to the control group was £18 (-129 to 195) for POWeR+F and -£25 (-268 to
157) for POWeR+R. The probability of being cost-effective at a threshold of £100/kg lost was 88% and
98% respectively. No adverse events were reported.
Interpretation. Weight loss was maintained for some individuals by promoting novel written materials
with occasional brief nurse follow-up. However, more can maintain clinically important and cost-
effective weight reduction with a web-based behavioural programme and brief remote follow-up.
This work was funded by the Health Technology Assessment (HTA) Programme of the National Institute
for Health Research (NIHR). ISRCTN21244703
2

Background
Obesity is a major threat to public health, the prevalence is rising1-3 and the vast majority of patients are
managed in primary care4. Systematic reviews5, including from NICE4, advocate dietary and physical
activity intervention supported by intensive behavioural techniques. The limited availability of high level
dietetic and behavior-change expertise, nor time available for counselling and follow-up, make this
challenging in the progressively resource–constrained primary care environment6. A review of
controlled trials in primary care (but excluding those with >30% attrition at 12 months, which is
common in studies of obesity) found little evidence of appropriately intensive behavioural counselling
and suggested trained interventionists7.
An alternative to a cadre of highly trained interventionists is to use the internet to help support behaviour
change. Reviews suggest that automated interactive web-interventions without human input can achieve
weight loss greater than no treatment or minimal interventions, but with too many small, short-term trials
in volunteer samples, arguing the need for large, pragmatic trials with at least one year follow-up and
assessing cost-effectiveness8 9. The trials identified by NICE mostly had expert lifestyle and behavioural
input, and followed up patients intensively - on average 13 times per year during the first 12 months4.
NICE found that estimates of cost-effectiveness were very sensitive to whether weight loss was
maintained, but estimated that any intervention which cost less than £100 per kg lost if maintained in the
longer term was likely to be cost effective. Automated interventions may be enhanced by human
support, but while intensive support improves web-based weight management10 we are aware of no
studies examining the effectiveness of the brief support by primary care staff that is likely to be both
more feasible and cost-effective. A recent review identified 9 studies comparing internet support with
minimal intervention, but 2 had unusual populations (University staff; lactating women), and the only
study to report fewer than 10 contacts by behavioural counsellors documented less than 1.5Kg weight
loss and high attrition at 12 months with only 49% of individuals followed-up11.
Our objective was to perform a parallel group pragmatic randomised primary care trial to estimate the
effectiveness and cost-effectiveness of a web-based behavioural weight management intervention
(POWeR+) with either brief face-to-face nurse support or brief remote nurse support for obese patients
managed in UK primary care. To minimise drop-out we chose an active control group promoting
healthy eating that had previously been shown to result in modest weight loss (2%) compared to a generic
advice booklet12. The primary outcome was weight reduction averaged over 12 months and a secondary
weight outcome the proportion achieving a clinically important 5% reduction in weight.
3

Research methods
Participants.
Practices in Central and South England (around Southampton and Oxford) identified participants from
their routine electronic records. Up to 100 patients from each practice were randomly chosen, and invited to
a screening appointment. Patients could also be referred opportunistically from routine practice
appointments.
Inclusion criteria.
Patients with BMI >=30 kg/m2 (or >=28 kg/m2 with hypertension or hypercholesterolaemia) documented in
the GP case records4 were eligible.
Exclusion criteria: major mental problems e.g. psychosis (difficulty completing outcomes); too ill or unable
to change diet (e.g. severe LVF); pregnancy; breast feeding; or perceived inability to walk 100 metres
(physical activity difficult); another member of the household taking part, no regular access to the internet.
.
The POWeR+ web-based intervention
POWeR+ is a theory and evidence-based intervention to teach patients self-regulation and cognitive-
behavioural techniques to form sustainable eating and physical activity habits for long-term weight
management in a series of 24 web-based sessions designed to be used over 6 months with novel content,
links to external content and email reminders. Patients initially choose either a low calorie eating plan or
a low carbohydrate eating plan, but could change plans at any stage if they wished. (see Appendix 1 for
full details).
Randomisation in main trial, informed consent.
During the screening appointment, informed written consent was taken. Participants were given details of
how to login and register, whereupon participants were presented with baseline questionnaires, upon
completion of which they were automatically randomised by the website using computer generated random
numbers to one of three intervention arms:
1) Control group: evidence-based dietetic advice and 6 monthly nurse follow-up. Participants were
taken to a set of 2 printable web-based pages with brief structured advice. This intervention was active
since it was intended to help weight-loss: the materials were developed by the Institute of Food Research
to provide attractive strategies to minimise the pressure to cut down favourite foods, but instead to swap
less healthy foods for healthier choices (healthy foods swap sheet), or to increase fruit and vegetables (we
used the NHS 5-a-day sheet). Our previous trial documented 1.2 Kg weight loss among patients with
hypertension when compared with a generic advice booklet11. To enhance retention participants were
informed that this intervention had supported weight loss. Nurses arranged brief follow-up (5-10 minute
4

appointments) with sufficient time to measure weight at 6 months and 12 months, but not to provide
explicit counselling.
2) POWeR+F. Web-based intervention and face-to-face nurse support. The rationale for this
intervention was to provide automated behavioural counselling, with just three scheduled (and four
optional) face-to-face nurse support sessions, thus requiring substantially less health professional skill
and time than the evidence based lifestyle interventions documented in the NICE review4 and hence
much easier to implement in the NHS. In addition to 6 monthly weighing, as in the control group,
participants had 3 scheduled face-to-face appointments in the first 3 months and then up to 4 more during
a further 3 months if needed (i.e. 6 months in total). Weight gain on two consecutive logins triggered an
automated email to the nurse advising that the patient required further support, or patients could request
additional support.
3) POWeR+R: Web intervention and remote support. The rationale here was to test whether even
briefer professional support for the web intervention could be effective. Patients could access the same
web-based intervention as in the face-to-face group. In addition to 6 monthly weighing, as in the control
group, participants had 3 scheduled phone or email contacts and up to 2 optional phone/email contacts in
the first 6 months (triggered by weight gain or patient request as in the face to face group).
Changes to the protocol.
The Trial Steering Committee (TSC) advised an increased the sample size to allow for clustering which
required an extension to the planned recruitment period. To avoid losing data a repeated measures
ANOVA for the principal continuous outcome (i.e. weight) was changed to mixed multivariable
regression modelling. Actiheart monitors were planned for a randomised subset, but organising this at a
time of intensive final follow-up became too difficult. Piloting suggested that intensive follow-up for
anything but the primary outcome would increase drop-out, so efforts concentrated on weight. The final
analysis plan, matching the clinical rationale for our original sample size, included a secondary weight
outcome - the proportion maintaining 5% weight loss. This is very important clinically13 14 and facilitated
direct comparison with a previous UK primary care trial15 which published after our study commenced.
Outcome measures
Primary outcome (specified in the funding protocol): Weight loss averaged over a 12 month period,
measured lightly clothed, without shoes, where possible at the same time each day, using automated Tanita
digital scales.
Secondary weight outcome: maintenance of 5% weight loss.
Other outcomes. There was no explicit measurement of the ‘work’ of participants when, but we report
health service resource use, usage of the website (pages accessed and time taken, recorded automatically by
the website), and how enabled patients felt (using the modified Patient enablement instrument16), and the
additional activities participants used to help lose weight. A range of other secondary measures were also
5

documented (waist measurement, blood pressure, HBA1C, liver function tests; self-report measures of
physical activity, diet, see Appendix 4 for detail).
Outcomes/data collection (at baseline and unless specified at 6 and 12 months). Participants had
appointments for weight measurement with the practice nurse at baseline and 6 months, and at 12 months an
appointment or home visit by a nurse researcher blinded to group. Where a blinded weight measurement
could not be obtained we used practice nurses’ recorded weights, and where that was not possible we used
participants’ reported weight. For self-report measures there were three emails prompting online completion
followed by a postal version of the questionnaire.
Sample size.
We compared each of the intervention groups primarily with control but also potentially with each other
so allowed for alpha=0.017 (i.e. 0.05/3). For the primary outcome (weight) we estimated that a
standardised effect size of 0.33 (equivalent to 2-3 kg difference assuming an SD of change of 6.5-7.5
kg17 18) and 80% power required 174 patients per group with complete data, or 654 patients in total
allowing for 20% loss to follow-up. Following liaison with both the funder (HTA) and the TSC the power
calculation was revised to allow for modest clustering at practice level if significant clustering was found.
We assumed recruitment of 18 patients per practice to achieve 15 patients at follow-up, of whom roughly
5-6 would be in each of the two intervention groups at follow-up. Assuming 5 per group in each practice
for an ICC (intra-cluster correlation) of 0.05 i.e. a design effect 1.2 (1+ ((5-1)x0.05)) this resulted in a
minimum of 654*1.2=785 patients.
Statistical analysis.
The primary analysis. Mixed multivariate regression models were chosen to enable data to be used from
anyone who had 6 months or 12 months data. We modelled the risk ratios compared with the control
group for the number achieving 5% weight loss. All regression models controlled for weight at baseline,
sex, age, smoking, diabetes, medications (including Orlistat used at baseline), any comorbidities,
deprivation (IMD2010) and any clustering by practice. No interim analyses were undertaken as per the
approved study protocol.
Missing data. Loss to follow-up was fairly similar between arms which reduces the potential impact of
data not following the missing at random assumption. Nevertheless, intention to treat analysis used both
measured and reported weights in a multiply-imputed data set (based on 50 replications). Secondary
analyses were of complete cases, and also just using measured weights – both of which analyses
documented slightly larger effect sizes.
Subgroup analyses: We explored whether there was significant effect modification in subgroups using
interaction terms in the models. Key subgroups identified in advance were: baseline waist measurement
(high or very high waist vs low waist: men high 94cm, very high 102cm; women high 80cm, very high
88cm), and the presence of the metabolic syndrome (syndrome vs no syndrome). The metabolic
syndrome19 was defined as 3 out of 5 of elevated waist circumference (<94cm for men, 80 for women), TG
6

>=1.7 mmol/l, reduced HDL-cholesterol (<1.00 mmol/L in males <1.3 mmol/l in females) BP (SPB >130 or
diastolic >85, or treatment of high BP) elevated fasting glucose >= 5.6 mmol/l.20 We also explored
outcomes according to the type of diet chosen by patients.
Economic evaluation
Health service resource use data (see Appendix 2 for more detail) were collected through case notes
review covering medication, primary care visits, outpatient consultant, A+E and hospital admissions
associated with obesity (the management of obesity, and conditions affected by obesity such as
cardiovascular disease, control of asthma, and musculoskeletal problems (hip, back and knee)). Outcomes
were measured as incremental costs per Kg weight loss. We have applied multiple imputation for missing
values and applied bootstrapping to the imputed data to produce confidence intervals for the cost-
effectiveness analyses.
Trial registration and ethics
The trial was registered on 16/3/12 as an International Standard Randomised Controlled Trial
(ISRCTN21244703) and ethics approval given by NRES Committee South Central Southampton B First
MREC (approval date 19/12/2011, reference: 11/SC/0455). A £10 gift voucher was sent out with the 12
month appointment notification letter as a thank you for participation irrespective of whether an
appointment was made.
Role of the funding sourceThis project was funded by the Health Technology Assessment (HTA) Programme of the NIHR (study
reference 09/12/19, 11939). FDRH was part-supported by the NIHR School for Primary Care Research,
NIHR Oxford Biomedical Research Centre, and NIHR Collaboration for Leadership in Applied Health
Research and Care Oxford. CDB is part-funded by the Southampton NIHR Biomedical Research Centre.
The University of Southampton was the Sponsor, but neither the funder nor the sponsor had roles in the
running of the study, the analysis, the write-up, nor the interpretation of the results.
7

Results
818 eligible individuals from 56 practices were randomised from January 2013 to March 2014. Of these,
407 had a weight recorded at the 6 month follow up and 666 had a weight recorded at 12 months. Of the
666, 510 (76.7%) were blinded weights, 28 (4.2%) unblinded weights and 128 (19.2%) reported weights.
The number with reported weights were similar in each group (Control n=40, POWeR+F n=48,
POWeR+R n=40). Table1 shows the baseline characteristics of the groups, which were mostly well
balanced. The practice intra-cluster correlation (icc) for weight in the repeated measures analysis was
0.01 (95% confidence intervals 0.003 to 0.09) when controlling for baseline weight.
Intervention receipt.
Of the 539 participants randomised to the POWER+ intervention groups, 524 started the first session and
404 completed all 3 core sessions (196 of the remote support group and 208 of the Face-to-face support
group). Participants completed an average of 10.97 (SD=12.65) weight and goal reviews (range 0-52);
the average was 10.16 (SD=11.92) in the Face-to-face group and 11.85 (SD=13.38) in the Remote
support group. The median number of nurse contacts was 4 (range 0 to 7) in both intervention groups,
with a median of 2 face to face, 1 phone and 1 email contact in the POWeR+F group, and a median of 1
phone call and 3 emails in the POWeR+R group. There was around 2-2.5 kg difference in weight
reduction for those who completed more than the first basic stage of the Programme.
Outcomes
Mean weight reduction: The active control group maintained a weight loss of nearly 3 kg over 12
months (baseline 104.4 Kg (n=279), 6 months 101.9 Kg (n=136), 12 months 101.7 Kg (n=227) (Table 2).
The primary imputed analysis (Table3) documented that compared to the control group the face to face
support group achieved an estimated additional 1.5 kg reduction averaged over the 12 months period (-
2.4 to -0.6, p=0.001) and the remote group an additional 1.3kg reduction (-2.3 to -0.3, p=0.005). A
secondary analysis of just the complete cases over 12 months documented greater weight reduction
compared to the control group: Face-to-face -1.78 kg (-2.8 to -0.8), Remote -1.6 kg (-2.6 to -0.6) (see
Tables 8 and 9, Appendix 3).
Clinically important weight maintenance: By 12 months using data from complete cases 18.5% (42/227)
of the control group had maintained a 5% or more reduction in weight, POWeR+Face-to-face 28.1%
(62/221) and POWeR+Remote 31.7% (69/218). The imputed estimates were respectively 20.8%, 29.2%,
and 32.4% (Table 4).
NHS resource use and other activities.
753 casenotes were reviewed from the GP electronic records for 12 months after recruitment. The mean
intervention costs per person using the services were low (£22 for POWeR+F and POWeR+R £12), or
for all participants in each group £17 and £9 respectively. Adding the estimated cost of the web raised
8

these to £18 and £10 respectively. Bigger differences in costs were found in estimating overall NHS
resource use related to obesity (see Table 7b). If bootstrapping is used the estimate of the differences in
costs compared with the control group for POWeR+ Face-to Face is £23 (-105 to 152) and for
POWeR+Remote -£36 (-154 to 81). None of these differences were statistically significant. The
estimated incremental overall NHS cost per kg weight loss was £18 (-129 to 195) for POWeR+F, and -
£25 (-268 to 157) for POWeR+R. i.e. POWeR+R dominated the control group since it was more effective
and cost less (see Table 5). The cost-effectiveness acceptability curves put the probability of being cost
effective at well over 80% for both interventions (88% and 98% respectively) compared with the control
group (see Appendix 2 for more details).
For those returning the final questionnaire almost half the people in the control group (47.1%; 64/136)
were doing something else to help lose weight as opposed to 37.2% (51/137) in the Face-to-Face group
and only 26.7% (40/150) in the Remote group (Table 6). Participants also felt more enabled to manage
their weight problem in the POWeR+ groups (Table 6).
Subgroups
There was some evidence of a lesser effect of the POWeR+F group at 6 months among participants with
the metabolic syndrome, but no significant impact of type of diet chosen (see Appendix 3 for more
detail).
Secondary outcomes
Due to the priority to obtain follow-up for weights, and the clear feedback from piloting that pressurising
participants to have blood taken was off-putting, achieving high follow-up for blood samples was
necessarily a secondary priority for the trial team, and so a minority of participants had follow-up blood
measurements. As a result, even though estimates use multiple imputation, the results for blood samples
must be interpreted cautiously. What results are available suggest generally positive directions of
outcomes in the POWeR+ groups, albeit mostly not statistically significant (raised HDL cholesterol,
lower AST and ALT, lower HbA1C; see Appendix 4 tables 10 to 12). The low completion rate for EQ5D
makes this data less reliable, so the interpretation of the direction of change of EQ5D is difficult to
interpret, particularly as the estimate of the direction of change varies depending on whether baseline
values are controlled for (tables 17 and 18).
Fat mass and blood pressure were recorded in the majority of participants at follow-up (in both cases
more than 450 individuals) and although there were no consistent changes in blood pressure, fat mass
reduced slightly in both POWeR+ groups (Appendix 4 table 13).
Harms. No harms were reported during the study
9

Table 1. Baseline characteristics*
Control group:
Brief verbal and online
healthy eating advice
POWeR+ Face-to-face
(Access to website and
brief face to face support)
POWeR+ remote:
(Access to website and
brief remote support)
Female (n) (%) 185/279 (66.31%) 175/269 (65.06%) 160/269 (59.48%)
Age (y) 52.69 (13.25) 53.70 (13.21) 54.74 (12.95)
Smoker (n) (%) 24/279 (8.6%) 21/269 (7.81%) 25/269 (9.29%)
Diabetes (n) (%) 48/279 (17.20%) 46/268 (17.16%) 42/270 (15.56%)
Orlistat use (n) (%) 3/270 (1.11%) 5/262 (1.91%) 5/266 (1.88%)
Comorbid condition (n)
(%)
48/281 (17.08%) 55/269 (20.45%) 55/272 (20.22%)
Deprivation score (Index
of Material Deprivation
score 2010)
14.32 (10.45) 13.73 (10.28) 13.29 (10.17)
Weight (kg) 104.38 (21.11) 102.40 (16.87) 102.93 (18.26)
Body Mass Index (kg/m2) 37.10 (5.97) 36.66 (5.36) 36.28 (5.65)*Mean (S.D.) unless indicated
Table 2. Crude mean weights for complete cases at baseline, 6 and 12 months
Mean weight in kg (s.d.)
Baseline 6 months 12 months
Control group:Brief online and verbal healthy eating advice
104.38 (21.11) n=279 101.91 (19.35) n=136 101.73 (19.57) n=227
POWeR+Face-to-face(Access to website and face to face support)
102.40 (16.87) n=269 97.55 (15.99) n=148 98.56 (15.95) n=221
POWeR+Remote:(Access to website and brief remote support)
102.93 (18.26) n=270 98.30 (18.34) n=155 99.72 (18.88) n=218
Table 3. Imputed data based on 50 imputations – difference in weight loss (kg) compared to control
group
Difference in weight loss compared to the control group (95% confidence intervals)
6 months 12 months Over study period (repeated
measures)
Face-to-face -2.54 (-3.66, -1.42; p<0.001) -0.37 (-1.66, 0.92; p=0.566) -1.49 (-2.41, -0.58; p=0.001)
Remote -1.97 (-3.18, -0.76; p=0.002) -0.58 (-1.88, 0.72; p=0.375) -1.27 (-2.19, -0.34; p=0.007)
10

Table 4. Proportions maintaining at least 5% weight loss at 6 and 12 months
Proportion losing at least 5% of baseline weight or more – compete cases
Risk ratio of achieving weight loss of 5% of baseline weight or more compared to the Control group – complete cases
Proportion losing at least 5% of baseline weight or more – imputed data
Risk ratio of achieving weight loss of 5% of baseline weight or more compared to the Control group – imputed data
6 months 12
months
6 months 12
months
6 months 12
months
6 months 12
months
Control 16/136
(11.8%)
42/227
(18.5%)
1.00 1,00 15.9% 20.8% 1.00 1.00
POWeR+
F
59/148
(39.9%)
62/221
(28.1%)
3.42
(2.10,
5.56;
p<0.001)
1.46
(1.02,
2.08;
p=0.036)
36.8% 29.2% 3.10
(1.85,
5.18;
p<0.001)
1.56
(0.96,
2.51;
p=0.070)
POWeR+
R
55/155
(35.5%)
69/218
(31.7%)
3.02
(1.89,
4.83;
p<0.001)
1.67
(1.17,
2.37;
p=0.004)
33.7% 32.4% 2.64
(1.60,
4.36;
p<0.001)
1.82
(1.21,
2.74;
p=0.004)
Table 5. Incremental overall NHS cost per Kg weight lost (ICER) compared with the control group based on the imputed data using repeated measurement
Group vs. group Mean difference of costs in £(95% CI)
Mean of weight lost (kg) (95% CI)
Incremental cost (£) per weight lost (95% CI)
POWeR+F vs. Control group
23 (-105, 152) 1.49 (0.58, 2.41) 18 (-129, 195)
POWeR+R vs. Control group
-36 (-154, 81) 1.27 (0.34, 2.19) -25(-268, 157)
11

Table 6. Additional activities undertaken over 12 months, and patient enablement in managing
their weight
Control
(n (%))
Face-to-face
(n (%))
Remote
(n (%))
Additional activitiesTake part in regular activity long enough
to work up a sweat
- Rarely 50/135 (37.0%) 38/134 (28.4%) 39/146 (26.7%)
- Sometimes 57/135 (42.2%) 69/134 (51.5%) 77/146 (52.7%)
- Often 28/135 (20.7%) 27/134 (20.2%) 30/146 (20.6%)
Take part in another weight loss activity 64/136 (47.1%) 51/137 (37.2%) 40/150 (26.7%)
Of these the reported activities were:
Weightwatchers/Slimming World (or
similar) meetings
23/136 (16.9%) 22/137 (16.1%) 14/150 (9.3%)
Another weight management website 0/135 (0.0%) 4/136 (2.9%) 4/150 (2.7%)
Phone app 13/136 (9.6%) 8/136 (5.9%) 10/149 (6.7%)
Weight loss pills 5/136 (3.7%) 4/137 (2.9%) 2/150 (1.3%)
Health trainer program 4/136 (2.9%) 2/136 (1.5%) 3/148 (2.0%)
Exercise referral scheme 4/136 (2.9%) 7/137 (5.1%) 4/148 (2.7%)
Another weight loss scheme 8/136 (5.9%) 13/136 (9.6%) 8/149 (5.4%)
Any other weight management method 22/97 (22.7%) 13/87 (14.9%) 8/103 (7.8%)
Patient enablementMean Item score at baseline (SD) 3.19 (1.27) 3.42 (1.19) 3.31 (1.26)
Mean Item score at 12 months (SD) 3.23 (1.57) 4.10 (1.28) 3.85 (1.35)
Difference in enablement score
compared to control group
(95% confidence intervals)
0.70 (0.39, 1.01;
p<0.001)
0.54 (0.24, 0.85;
p<0.001)
12
Discussion.
This is one of few studies comparing simple weight management interventions using primary care staff
for support to manage obesity. Clinically important weight loss was achieved by some participants in the
active control group, and the mean weight reduction at the end of 12 months was not significantly less
than the POWeR+ behavioural web-based intervention groups. However in the POWeR+ groups
significantly more weight loss occurred averaged over 12 months, by 12 months more participants
maintained clinically important weight reduction, and more patients felt enabled to manage their weight.
With brief nurse remote support for POWeR+ this was achieved without increasing health service costs.
Strengths and limitations.
The individuals who take part in trials are likely to be a relatively well-motivated group, but this is also
the intended target group where intervention is most likely to be helpful. The study was large and
pragmatic, mimicking the everyday conditions in primary care settings, which had the disadvantage that
the control group were not closely controlled, and so they undertook other activities to lose weight. This
is also a strength as estimates are more realistic - since this would happen in practice. Participants with
obesity in primary care settings are notoriously difficult to follow-up, but we achieved follow-up of more
than 80% of individuals at 12 months. Loss to follow-up was similar between arms, which reduces the
impact of missing data. Furthermore, we have reported the primary analysis using the imputed data,
which provides more conservative (i.e. smaller) estimates of effectiveness than complete cases. However,
in practice multiple imputation modified the estimates only slightly - which suggests that attrition bias
was not a major issue. Based on the experience of piloting, where pressure to achieve follow-up of both
primary and secondary outcomes resulted in participants dropping out, our effort concentrated on
maximising the primary outcome, which resulted in fewer secondary outcomes being available. The fact
that we found significant weight loss irrespective of the method of specifying the weight outcome
(average reduction over 12 months as specified in the funding application, or clinically important weight
loss at 6 or 12 months), and that most secondary outcomes also changed in positive directions albeit
mostly not significantly, makes selective reporting and type I error less likely.
Main findings put in context of existing literature.
Our observation of 3% loss in weight in the active control group, and the maintenance of clinically
important weight loss in 11.8% and 18.5% of participants at 6 and 12 months respectively, was consistent
with our previous findings12 – i.e. that a brief intervention promoting the use of simple sheets for food
swaps and five-a-day fruit and vegetable consumption helps with weight control. Some of the effective
weight management in this group may also be due to the motivational effects of regular follow-up
weighing by the nurse, and undertaking other activities to help themselves (which about 50% did). In
13

contrast, fewer individuals offered the POWeR+ interventions undertook other activities, and they felt
significantly more enabled to manage their weight.
Systematic reviews of interventions in other settings and primary care suggest that both intensive dietetic
behavioural counselling and intensive follow-up are usually necessary to achieve effective weight
reduction4 7 21. In contrast, we found that a behavioural web-based intervention such as POWeR+ was
effective with just a few brief phone calls and emails plus 6 monthly weighing. The weight loss achieved
with POWeR+ compares favourably with other internet-based interventions, which on average22 (albeit
with high heterogeneity) have led to only short term weight loss, of less than 1kG weight loss compared
to no treatment controls, or less than 2KG if combined with face-to-face support - based on a review of
predominantly motivated volunteer samples22. Better weight management results using an internet-based
programme (around 5Kg) have only been achieved with much more intensive human support (for
example, weekly 20 minute contact for 12 weeks, and then monthly up to 24 month follow-up109).
Encouragingly, the weight loss achieved by POWeR+ was comparable to the best performing
interventions15 23 evaluated over 12 months in a primary care setting, including those produced by face-to-
face commercial programmes. Controlling for deprivation made no difference to the estimates and there
was also no interaction with deprivation.
The estimates of resource use suggest that both interventions were not very resource intensive.
Considering overall NHS costs, fewer NHS resources were used in the Remote group, mainly due to
reduced primary care costs. Given the variability of cost estimates, these results must be treated with
some caution, but it seems unlikely that health service costs will be significantly increased with the
Remote intervention. We also found that POWeR+ users felt significantly more enabled to manage their
condition, so it is plausible that if individuals can be enabled to manage their own condition without
needing significant face-to-face contact, this could empower self-management more generally. Previous
modelling by NICE demonstrated that cost-effectiveness is very sensitive to whether weight loss is
maintained but that at least a 1 kg per head weight loss among overweight or obese adults is likely to be
cost effective if is maintained, provided that the cost per person of intervening is less than £100. The
current results suggests that irrespective of whether intervention costs or overall costs are used both
interventions achieve weight losses at a cost per kg below that required by NICE4. The POWeR+
intervention was for 6 months but the number maintaining clinically important weight loss remained
steady to 1 year which suggests longer term benefit could be achieved. However, since weight loss may
not be maintained after 1 year, future research should assess the extent to which clinically important
weight loss can be maintained beyond one year.
Conclusion. A web-based behavioural weight management programme (POWeR+) with brief remote
follow-up is effective, helps participants feel more enabled to manage their weight, provides comparable
results to the best performing interventions evaluated in primary care settings including commercial
programmes, and is likely to be cost-effective.
14

.
.Research in context.
Previous evidence. The most recent systematic review published by Hutcheson et al included studies of
adults aged ≥18 years assessing weight loss or weight maintenance interventions using an e-Health
component. Eight databases were searched (The Cochrane Library, MEDLINE/PREMEDLINE,
EMBASE, CINAHL, Web of Science,Scopus, PubMed, and PsycINFO) from 1995 to 17 September
2014. The search terms were obesity/ or obesity, abdominal/ or obesity, orbid/Overweight/Adiposity/
obese.mp.ehealth.mp. or telemedicine/ telehealth.mp.Text Messaging/mhealth.mp.Computers, Handheld/
(tablet* and (mac or ipad or android* or microsoft or windows)).mp. [mp=title, abstract, original title,
name of substance word, subject heading word, keyword heading word, protocol supplementary concept,
rare disease supplementary concept, unique identifier]exp Internet/world wide web.mp.web based.mp.
((web* or remote or online) adj3 deliver*).mp. [mp=title, abstract, original title, name of substance word,
subject heading word, keyword heading word, protocol supplementary concept, rare disease
supplementary concept, unique identifier]website*.mp.online.ab,ti.smart phone*.mp.digital
game*.mp.smartphone*.mp.Computer Simulation/ or virtual reality.mp. exp diet/healthy
eating.tw.nutrition.tw.physical activity.tw.exp exercise/*motor activity/*Physical Fitness.
The quality (risk of bias) for twenty-three (27.4%) of studies were classified as higher quality, 67.9% (n =
57) moderate quality and 10.7%(n = 9) lower quality.
Meta-analysis demonstrated significantly greater weight loss (kg) in eHealth weight loss interventions
compared with minimal interventions (MD−1.40 [−1.98,−0.82], P < 0.001. However, of the 9 studies, 2
had unusual populations (University staff; lactating women), and the only study to report fewer than 10
contacts by behavioural counsellors documented less than 1.5Kg weight loss and high attrition at 12
months with only 49% of individuals followed-up. Thus there is poor evidence for the effectiveness for
internet interventions utilising brief behavioural support in a primary care setting.
What this study adds. Our results fill this gap by demonstrating that clinically important weight
reduction is possible with a web-based behavioural programme lasting 6 months combined with brief
remote follow-up (achieving approximately 1.5 Kg more weight loss than an active control intervention
and 30% maintaining 5% weight loss by 12 months), with less recourse to other weight loss activities
and is likely to be cost-effective.
Implications of all the available evidence. The weight loss achieved by POWeR+ was comparable
to the best performing interventions evaluated in a primary care setting over a 12 month period, including
those produced by face-to-face commercial programmes.
Implications for practice. The POWeR+ Programme when combined with very brief staff support could
be feasibly used in most practices and make a clinically important contribution to the management of
obesity.
Future research. Since weight loss may not be maintained after 1 year, future research should assess the
extent to which clinically important weight loss can be maintained beyond one year.
15

Figure 1. CONSORT Diagram
16

Competing Interests. All authors have completed the Unified Competing Interest form at http://www.icmje.org/coi_disclosure.pdf (available on request from the corresponding author) and declare: no support from any organisation for the submitted work ; no financial relationships with any organisations that might have an interest in the submitted work in the previous three years, no other relationships or activities that could appear to have influenced the submitted work. Data sharing: there is no further data available.
The views expressed in this publication are those of the authors and not necessarily those of the HTA, NHS, NIHR or the Department of Health. PL affirms that the manuscript is an honest, accurate, and transparent account of the study being reported; that no important aspects of the study have been omitted; and that any discrepancies from the study as planned (and, if relevant, registered) have been explained. The corresponding author (PL) has final responsibility for the manuscript.
Contributorship: Paul Little (GP and Professor of Primary Care Research, University of Southampton) had the original idea for the protocol, led protocol development and the funding application, supervised the running of the lead study centre and coordination of centres, contributed to the analysis, led the drafting of the paper. F.D.R. Hobbs (GP and Professor of Primary Care, University of Oxford, and Professorial Fellow at Harris Manchester College) developed the protocol for funding, contributed to management of the study, supervised the Oxford study centre and contributed to the drafting of the paper. Jo Kelly and Emily Smith (senior trial managers, University of Southampton) developed the protocol, provided day to day overall management of the study, coordinated recruitment in the lead study centre and coordination of other centre, and commented on drafts of the paper. Mina Davoudianfar coordinated the Oxford study centre. Julie Hooper provided coordination and data management for the Southampton study centre. Guiqing Yao and Shihua Zhu with Professor James Raftery (Health Economists) developed the protocol for analysis of the notes review data, analysed the resource use data, and contributed to the drafting of the paper. James Raftery contributed to the management of the study, and supervised the analysis of resource use data. Katherine Bradbury, assisted by Stephanie Hughes (Health Psychologists, University of Southampton), contributed to protocol development, were responsible for the day to day development and piloting of the intervention, and commented on drafts of the paper. Michael Moore (GP and Professor in Primary Care, University of Southampton), developed the protocol for funding, contributed to the management of the study, contributed to the analysis and to the drafting of the paper. J David Turner (UEA) helped develop the protocol for funding. Beth Stuart. (Study Statistician, University of Southampton) with Peter Smith (Professor of Statistics, University of Southampton) developed the analysis protocol, performed the quantitative analysis, and contributed to drafting of the paper. Lucy Yardley (Professor of Health Psychology, University of Southampton) developed the protocol and funding application with PL, led the development of the intervention, contributed to daily supervision of website issues, contributed to broader study management, and contributed to drafting the paper. Professors Mike Lean, Barrie Margetts, and Chris Byrne developed the protocol for funding, contributed to management of the study, and contributed to the drafting of the paper.
AcknowledgementsThis study was funded by the NIHR. FDRH is part funded by NIHR SPCR, NIHR CLAHRC Oxford, NIHR Oxford BRC. We are grateful to all the patients and Health Care Professions who have contributed their time and effort and helpful insights to make POWeR+ possible. We are grateful to the TSC for their support and advice throughout the study. We are grateful to the following for technological support for POWeR+ and for assistance with the development: Jin Zhang, Matthew Taylor, Mark Weal, Rosie Jones. We are grateful to Catherine Brant for help in developing the complex intervention. We are grateful to Weight Concern for their input into the original application and in the development of the intervention.
17

Appendix 1Intervention description: POWeR+
Positive Online Weight Management Plus (POWeR+) is an automated online intervention to support weight management over one year. POWeR+ was developed from the initial 12 session POWeR intervention, which was subject to a feasibility trial24. It was adapted from an earlier version (POWeR) which was extensively trialled and shown to improve weight loss. Development was informed by the Person-Based Approach (PBA)25 which employs an iterative process of in-depth qualitative user testing, and a theoretical basis involving the principles of self-determination theory28 and techniques from cognitive behavioural theory26. The Person-Based Approach was used for development to maximise acceptability, feasibility and engagement 25 27 28.
POWeR+ was designed to provide support for sustainable long-term self-management of weight. Patients choose either a low calorie eating plan (a reduction of around 600 calories a day) or a low carbohydrate eating plan (a carbohydrate limit of 50g a day). Users can base their eating plan on a traffic light system that categorises foods into those that could be eaten freely (‘green’), in moderation (‘orange’) or very sparingly (‘red’). The low carbohydrate eating plan categorises most vegetables and some fruits as ‘green’ and only categorises very high sugar and starchy foods as ‘red’ and is therefore compatible with a sustainable healthy diet. Patients are also encouraged to increase their physical activity levels by choosing either a walking plan (in which case they can request a pedometer) or a self-selected mixture of other physical activities.
POWeR+ focuses principally on fostering users’ self-regulation skills for autonomously self-managing their weight, rather than providing detailed dietetic advice. Throughout POWeR+, users are taught active cognitive and behavioural self-regulation techniques (‘POWeR tools’) to overcome problems such as low motivation, confidence or relapse. Evidence is provided for the effectiveness of these techniques and examples given of how others have successfully used them (‘POWeR stories’). POWeR+ emphasises forming healthy eating and physical activity habits that should become non-intrusive and require little effort to sustain. POWeR+ is tailored by gender, using language and ‘POWeR stories’ designed to appeal to men and women.
The intervention was developed based on behavioural theory and evidence from existing successful interventions, with very extensive iterative qualitative piloting with a wide range of users from the target population to check usability, accessibility and acceptability and to elicit and respond to user views. Further details of the intervention development and early evaluation are given elsewhere 24 27 29-31. Aspects of POWeR+ that were modified from the original POWeR intervention included; use of game-based techniques (i.e. sessions grouped into stages that the user advances through), addition of extensive novel content (extra sessions to maintain interest for a longer period), shorter sessions (to enhance engagement), and improvements to usability and navigation.
Participants were encouraged to continue to use the website weekly to track their weight, set and review eating and physical activity goals, and receive personalised advice. After entering their weight and whether they had achieved the goals they had set themselves the previous week, patients received tailored feedback giving encouragement if maintaining weight loss (e.g. reminders of health benefits accrued) and meeting goals. Weight gain and failing to meet goals triggered automated personalised advice such as appropriate goal-setting and planning, boosting motivation, overcoming difficulties, recovering from lapses.
18

Overview of the 4 stages of POWeR+
Stage 1: Users are tunnelled (i.e. they cannot proceed to a session until they have completed the previous session) through 3 core sessions introducing them to POWeR and guiding them through the process of setting and reviewing weekly goals (see figure 1). There are 3 components to the goal review:
- Recording weight- Choosing an eating plan from:
o A low calorie dieto A low carbohydrate diet
- Choosing a PA plano Increasing walking using a provided pedometer and recording the weekly step count. o Choosing any other physical activity and setting weekly goals
Participants may opt to change their plans after their weekly goal review at any point during the intervention.
Stage 2: Users have free choice access (i.e. they can access the sessions in any order) of sessions 4-10. Goals can now be reviewed weekly and users can view their progress on a graph. If a user misses a week of goal review, they may still review their goals the following week. After all sessions are completed or a period of 7 weeks has passed since the stage was started, stage 3 sessions become available.
Stage 3: Users have free choice access to sessions 11-17 and continue complete weekly goal reviews. After all sessions are completed or a period of 7 weeks has passed since the stage was started, stage 4 sessions become available.
Stage 4: Users have free choice access to sessions 18 – 25 and continue to complete weekly goal reviews. Throughout the intervention, weekly emails are sent to remind users to complete their goal review. Set periods of inactivity at various points during the intervention also trigger emails prompting users to return to either complete sessions or their goal review.
19

Overview of POWeR+ stages and session titles
Stage 1 (user is tunnelled through these sessions)Session 1 pt 1 Introduction to POWeRSession 1 pt 2 Introduction to goal setting and weekly weighingSession 2 Getting support from other peopleSession 3 Physical activityStage 2 (free choice sessions. These are unlocked once user completes session 3)Session 4 Setting the strongest plans – mini sessionSession 5 Controlling your cravingsSession 6 Stretching your physical activitySession 7 Setting up your environment to help you lose weightSession 8 Dealing with slip upsSession 9 How to break bad habits – mini sessionSession 10 How to develop your new healthy identity – mini sessionStage 3 (free choice sessions unlocked once user completes stage 2 or after 7 weeks)Session 11 Eating when times are toughSession 12 Eating outSession 13 Being drink awareSession 14 Take on a physical activity challenge – mini sessionSession 15 A quiz to show you which tricky situations you are best at dealing with, and which
you still need to work on – mini sessionSession 16 Winning against temptations – mini sessionSession 17 When losing weight gets hard – mini sessionStage 4 (free choice sessions unlocked once user completes stage 3 or after 7 weeks)Session 18 Using mindfulness to help you lose weightSession 19 Getting support from your family – mini sessionSession 20 Have you made your changes into habits? Take this quiz to find out – mini sessionSession 21 Make new habits easier, by linking them to things you already do – mini sessionSession 22 A quick, easy tool to stop stress spoiling your weight loss – mini sessionSession 23 Busy livesSession 24 Maintaining your weight loss – we recommend you complete this session lastSession 25 Successful celebrations(only available from the ‘tools’ page)
20

Figure 1: Overview of weekly goal review
21
Appendix 2.
The costing (summarised in Table 7) comprised two elements: one measuring the intervention cost alone,
based on the cost of internet plus that of nurse support. The other was total cost i.e. the cost of the
intervention plus differences in cost of NHS services related to obesity. The perspective was that of the
NHS and personal social services. The time horizon was 12 months.
The main costs of the intervention were nurse supporting time in terms of face to face consultations,
telephone or email contact. The cost of nurse support was based on trial data on the number of contacts by
type (face-to-face, telephone and email, all with the practice nurse). Face-to-face contacts linked to the
trial interventions were planned to last half as long as normal visits. These were assumed to cost 50% of
standard practice nurse consultations1.The time taken for telephone contacts relative to face to face to
visits was based on the split provided for GPs between face to face and other contacts in PSSRU unit
costs. The time taken for email contacts was set at 50% that of telephone contacts. These were all costed
using national costs per consultation for a practice nurse (PSSRU, 2013/14). The unit costs used in costing
the intervention are shown in the table below.
The cost of the intervention comprised the cost of the web site and the support offered to users. The
development costs of providing a web intervention that could be used very widely would be spread
among thousands of individuals. We estimated the cost of the website at £1 per person using it, mainly
due to the cost of providing and maintaining the website. No cost has been applied to those using the site,
but not having access to the intervention. Although pedometers were offered to participants in the
POWeR+ groups (costing £10), the impact was modest, and since starting the study pedometer apps for
mobile phones have become widely available for the target population. Thus we anticipate that in
implementing the intervention no offer of pedometers would be made, hence our base case assumption
does not allow for the cost of pedometers. Even if we assume that the additional £10 is a necessary part of
the intervention this would still leave the intervention costs per Kg lost at well under £100/kg, and so
does not alter the inferences.
The cost of the control group with brief verbal intervention and supporting advice sheets was not costed
specifically but assumed to be part of primary care consultations. Resource use data were extracted from
GP case-notes 12 months after recruitment covering medication, primary care visits, outpatient consultant,
A&E attendance and hospital admission. Intervention-specific resource use was recorded by study nurse.
Data collected covered medications plausibly associated with obesity: diabetes, blood pressure,
clotting/antiplatelet, diabetes, musculo-sekeletal problems (back, hip and knee pain), lipid lowering and
weight management. The names of these medications, dosage, and days of use were recorded. Prices
were the listed pack price, the cost to the NHS. If a drug was started before the trial starting data and
when no ending date was recorded, we assumed that the duration of such use as the length of the trial (12
months). For rest of the medications, if no duration of use was available, the actual and recommended
22

duration the number of packs was estimated from the starting data of the medication. The unit costs of
medications were obtained from the British National Formulary (BNF) in 2013-2014 prices (British
National Formulary http://www.bnf.org).Consultations in primary care, walking in centre, A&E and
outpatient attendances were recorded and priced using PSSRU 2013/4 unit costs.
Data on all hospital admissions were also extracted. We used HRG cost per episode for hospitalisation-
specific causes of admission 2013/4 (Department of Health (2014) NHS Reference Costs 2013 to 2014.
https://www.gov.uk/government/publications/nhs-reference-costs-2013-to-2014). Data on these unit costs
and those for medications are available on request.
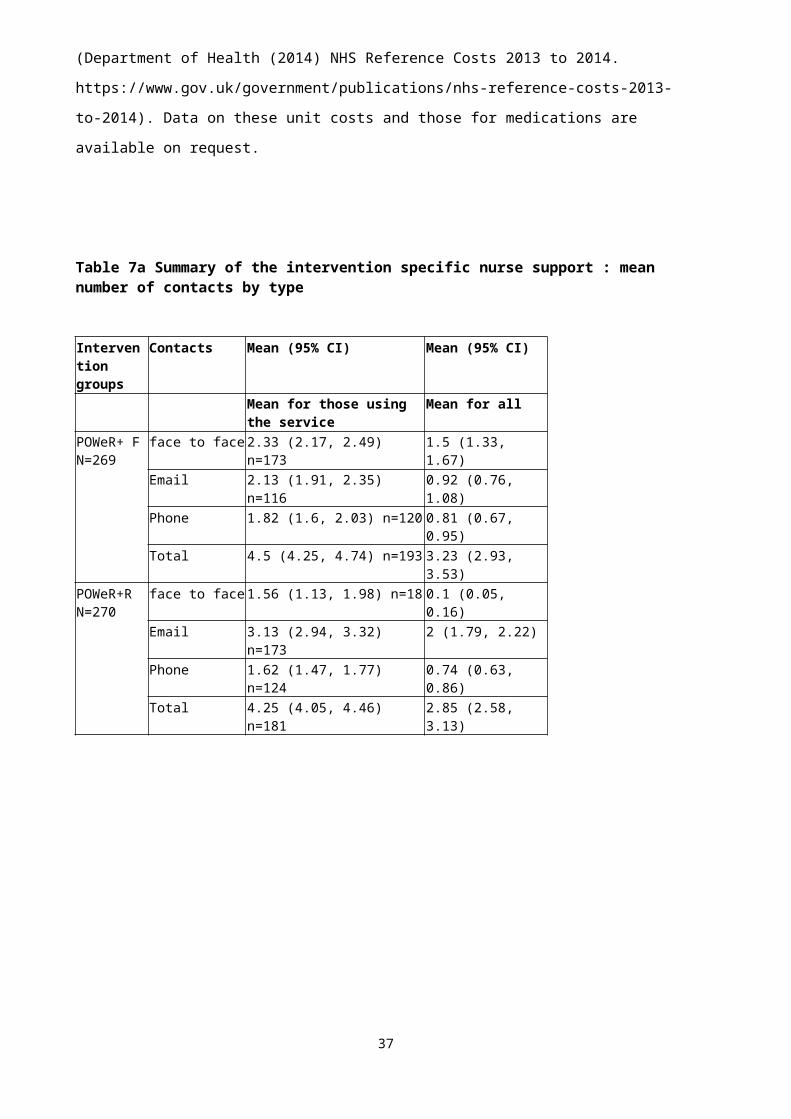
Table 7a Summary of the intervention specific nurse support : mean number of contacts by type
Intervention groups
Contacts Mean (95% CI) Mean (95% CI)
Mean for those using the service
Mean for all
POWeR+ F N=269
face to face 2.33 (2.17, 2.49) n=173 1.5 (1.33, 1.67)Email 2.13 (1.91, 2.35) n=116 0.92 (0.76, 1.08)Phone 1.82 (1.6, 2.03) n=120 0.81 (0.67, 0.95)Total 4.5 (4.25, 4.74) n=193 3.23 (2.93, 3.53)
POWeR+R N=270
face to face 1.56 (1.13, 1.98) n=18 0.1 (0.05, 0.16)
Email 3.13 (2.94, 3.32) n=173 2 (1.79, 2.22)Phone 1.62 (1.47, 1.77) n=124 0.74 (0.63, 0.86)Total 4.25 (4.05, 4.46) n=181 2.85 (2.58, 3.13)
23

Table 7b Mean obesity-related NHS resource use in each group (2013/2014 prices)
Groups Categories Means (95% CI ) for those using service
Mean for All (95% CI )
Control group N=259
Cost (£) All costs 428 (320, 537) n=259 428(320, 537)Medication 271 (191, 350) n=119 124(85, 164)GP consultation 72 (60, 83) n=142 39(32, 47)Outpatient attendance
548 (388, 709) n=49 104(64, 143)
Hospital admission 2569 (1158, 39805) n=11 109(28, 190)Number of cases
Medication usage 3.23 (2.84, 3.62) n=119 1.48(1.22, 1.75)GP consultation 2.68 (2.33, 3.03) n=142 1.47(1.22, 1.72)Outpatient attendance
4.06 (2.87, 5.25) n=49 0.77(0.48, 1.06)
Hospital admission 1 (1, 1) n=11 0.04(0.02, 0.07)POWeR+F N=250
Cost (£) All costs 431 (319, 543) n=250 431(319, 543)Medication 191 (150, 232) n=140 107(81, 133)GP consultation 83 (67, 97) n=148 49(39, 59)Outpatient attendance
534 (373, 695) n=47 100(61, 140)
Hospital admission 3986 (1840, 6132) n=7 112(18, 205)Nurse support 22 (21, 23) n=193 17(15, 18)
Number of cases
Medication usage 2.84 (2.55, 3.13) n=140 1.59(1.35, 1.83)GP consultation 2.74 (2.37, 3.11) n=149 1.63(1.36, 1.91)Outpatient attendance
3.96 (2.76, 5.15) n=47 0.74(0.45, 1.03)
Hospital admission 1.43 (0.7, 2.16) n=7 0.04(0.01, 0.07)Nurse support 4.5 (4.25, 4.74) n=193 3.47(3.17, 3.77)
POWeR+R N=244
Cost (£) All costs 386 (296, 477) n=244 386(296, 477)Medication 215 (150, 279) n=122 107(73, 142)GP consultation 63 (53, 73) n=126 33(26, 39)Outpatient attendance
530 (375, 684) n=52 113(71, 155)
Hospital admission 2794 (997, 4591) n=6 69(6, 132)Nurse support 12 (11, 13) n=181 9(8, 10)
Number of cases
Medication usage 3.17 (2.8, 3.55) n=122 1.59(1.31, 1.86)GP consultation 2.55 (2.2, 2.91) n=127 1.33(1.08, 1.57)Outpatient attendance
3.92 (2.78, 5.07) n=52 0.84(0.52, 1.15)
Hospital admission 1.33 (0.48, 2.19) n=6 0.03(0, 0.06)Nurse support 4.25 (4.05, 4.46) n=181 3.16(2.88, 3.43)
Notes: All costs comprise the total of all costs incurred. The main components of all costs were GP consultations, medications, outpatient attendance, hospital admissions and nurse support contacts.
The intervention cost (under “Nurse Support” in Table 7b) was £17 (15 to 18) in the POWER+F group
and £9 (8 to 10) in the POWER+R group. Total mean NHS obesity related cost by arm (“All Costs” in
Table 7b), including “nurse support” in each intervention arm, was £428 (320 to 537) in the control
group, £431 (319 to 543) in the POWeR+ Face-to Face and lower in the POWeR+Remote arm at £386
(296 to 477). If bootstrapping is used these estimates are £424 (338, 515) in the control group, £447
(358, 544) in the POWeR+ Face-to Face and lower in the POWeR+Remote arm at £388 (315, 468), with
24

difference to the control group for POWeR+ Face-to Face of 23 (-105 to 152) and POWeR+Remote -36
(-154 to 81). These cost differences were not statistically significant.
Cost effectiveness acceptability curves
The cost effectiveness acceptability curves (Figures 2, and 3) for weight loss show the probability of each
of the comparisons being cost effective in terms of levels of willingness to pay per kilogram lost. These
put the probability of being cost effective at well over 80% for both interventions compared with the
control group. There was little difference between the two intervention groups in terms of incremental
cost per kg lost.
Figure 2 Cost effectiveness acceptability curve of POWeR+F compared with control group based on weight loss from baseline (kg) over 12 months
25

Figure 3 Cost effectiveness acceptability curve of POWeR+R compared with control group based on weight loss from baseline (kg) over 12 months
26

Appendix 3:
Sub-group analysis
Metabolic syndrome: The interaction term for those having the metabolic syndrome at 6 months was
3.04 (95% CI 0.33, 5.74; p=0.028) for the Face-to-face group and 1.26 (95% CI -1.37, 3.88; p=0.348) for
the Remote group, i.e. the Face-to-face intervention was more effective in those not having the metabolic
syndrome, but this was only evident in the short term. At 12 months, the interaction terms were 0.58 (-
2.42, 3.57; p=0.707) for the Face-to-face group and 0.45 (-2.51, 3.41; p=0.765) for the Remote group.
Waist circumference: We originally specified high waist measurements as a possible subgroup but since
only 5 of the trial cohort had low waist measurements this was not possible.
Choice of diet: Among participants who initially chose the low carbohydrate diet compared to a low
calorie diet: weight reduction was not significantly greater at 6 months (interaction term -0.77 (-2.09,
0.56; p=0.258) nor 12 months (-0.46 (-1.95, 0.84; p=0.489); there was no differential effect on lipids; and
ferritin was slightly higher at 12 months (+24.3,95% CI 0.90 to 47.61, p=0.042).
Analysis using measured weights only:
Table 8. Complete cases–measured weight only
Mean kg (SD) at 6
months
Mean Kg (SD) at
12 months
Control 101.86 (19.95) 101.02 (18.26)
Face-to-face 98.58 (17.65) 98.19 (16.10)
Remote 97.18 (16.67) 99.02 (18.13)
Table 9. Complete cases– estimated differences in weight (kg) compared to monitoring group
based on measured weight only
Difference compared to the control group
6 months 12 months Over study period
(repeated measures)
POWeR+:Face- to-
face
-3.20 (-5.00, -1.39;
p=0.001)
-1.02
(-2.27, 0.22;
p=0.107)
-1.78 (-2.81, -0.76;
p=0.001)
POWeR+: Remote -3.22 (-5.03, 1.41;
p<0.001)
-0.96
(-2.21, 0.29;
p=0.134)
-1.60 (-2.63, 0.57;
p=0.002)
27

28

Appendix 4. Other secondary measures
Physical activity: The validated Godin leisure time physical activity questionnaire.
Food and drink consumption: Using validated brief Food Frequency Questionanires (FFQs) for major
food groups and also alcohol
Indices of the metabolic syndrome 3 out of 5 of elevated waist circumference (<94cm for men, 80 for
women), TG >=1.7 mmol/l, reduced HDLcholesterol (<1.00 mmol/L in males <1.3 mmol/l in females) BP
(SPB >130 or diastolic >85, or treatment of high BP) elevated fasting glucose >= 5.6 mmol/l. Individuals
with the metabolic syndrome are at particular risk. We report the number (%) in each group using a
definition of 3 out of 5 of high measurements30
Waist: nurses measured waist midway between the lower ribs and the iliac crests31 and height to allow
estimation of BMI; fat mass was measured using Tanita scales;
Blood pressure (BP): Measured 3 times (after 5 min) using a validated OMRON;
Serum measures: Liver function tests, serum cholesterol/HDL/LDL/triglyceride (TG) glucose, HbA1c ;
also ferritin (important to measure due to reducing cereals (a key source of iron) in the low carbohydrate
diet)
EuroQol (EQ-5D): the EuroQol provided a measure of quality of life for economic analysis;
29

Table 10a. Liver function tests. Crude data: mean (s.d.) (complete cases)
ALT Units/l
(n=329)
AST Units/l
(n=303)
GammaGT
Units/l (n=319)
Baseline 12
months
Baseline 12
months
Baseline 12
months
Control 30.17
(16.62)
30.23
(15.33)
30.99
(14.26)
29.38
(10.96)
39.18
(35.20)
38.65
(31.01)
POWeR:Face-
to-face
31.41
(17.48)
27.26
(14.06)
31.80
(13.79)
27.15
(9.36)
43.76
(46.55)
35.40
(26.10)
POWeR:
Remote
31.26
(17.57)
27.68
(16.97)
30.73
(13.69)
27.80
(9.27)
38.04
(30.85)
40.19
(40.47)
Table 10b. Liver function tests: estimated differences using multiple imputation compared
to control group (95 % confidence intervals)
Liver function – Difference compared to control group at 12 months
ALT Units/l AST units/l GammaGT Units/l
POWeR:Face
- to-face
-3.01
(-6.59, 0.57; p=0.093)
-2.21
(-4.77, 0.35; p=0.087)
-3.06
(-9.87, 3.74; p=0.356)
POWeR:
Remote
-2.72
(-6.08, 0.64; p=0.107)
-2.02
(-4.38, 0.34; p=0.090)
2.03
(-5.24, 9.32; p=0.568)
30
Table11a. Glucose, HBa1c and Ferritin (mean, s.d.) (complete cases)
Table11b. Glucose, HBa1c and Ferritin: estimated difference using multiple imputation
compared to control group (95 % confidence intervals)
Difference compared to control group at 12 months
Glucose mmol/l HbA1C mmol/l Ferritin ug/l
POWeR:Face-
to-face
-0.20
(-0.66, 0.26; p=0.375)
-3.15
(-8.01, 1.72; p=0.192)
-4.69
(-23.78, 14.40; p=0.616)
POWeR:
Remote
-0.32
(-0.79, 0.15; p=0.176)
-2.96
(-7.74, 1.83; p=0.213)
5.86
(-12.63, 24.36;
p=0.516)
31
Glucose mmol/l
(n=338)
HbA1C mmol/l
(n=330)
Ferritin ug/l
(n=362)
Baseline 12
months
Baseline 12
months
Baseline 12 months
Control 5.68
(1.88)
5.88
(1.94)
40.49
(10.42)
41.09
(28.68)
N/A 95.73
(94.77)
POWeR:Face-
to-face
5.91
(2.53)
5.83
(2.67)
42.00
(13.09)
38.78
(11.39)
N/A 95.47
(84.16)
POWeR:
Remote
5.64
(1.93)
5.64
(1.99)
40.07
(11.60)
38.74
(12.79)
N/A 103.78
(76.24)

Table 12a. Cholesterol means (s.d.) (complete cases)
Total (n=346)
mmol/l
HDL (n=348)
mmol/l
LDL (n=218)
mmol/l
Triglycerides
(n=286)
mmol/l
Baseline 12
months
Baseline 12
months
Baseline 12
months
Baseline 12
months
Control 5.30
(1.24)
5.05
(1.26)
1.43
(0.37)
1.37
(0.32)
3.12
(1.03)
2.97
(0.98)
1.74
(0.96)
1.72
(0.82)
POWeR:Face-
to-face
5.19
(1.19)
5.18
(1.18)
1.40
(0.33)
1.47
(0.35)
3.02
(0.96)
2.94
(0.98)
1.72
(0.85)
1.75
(1.04)
POWeR:
Remote
5.35
(1.33)
5.33
(1.20)
1.41
(0.36)
1.50
(0.38)
3.11
(1.05)
3.08
(1.10)
1.89
(1.59)
1.78
(1.49)
Table 12b. Cholesterol: estimated differences using multiple imputation compared with the
control group
Cholesterol – Difference compared to the control group at 12 months
Total
mmol/l
HDL
mmol/l
LDL
mmol/l
Triglycerides
mmol/l
POWeR:Face-
to-face
0.11 (-0.92,
0.31; p=0.270)
0.08 (0.02,
0.15; p=0.010)
0.01 (-0.19,
0.22; p=0.894)
0.03 (-0.28,
0.34; p=0.826)
POWeR:
Remote
0.14 (-0.08,
0.35; p=0.204)
0.10 (0.03,
0.17; p=0.006)
0.06 (-0.16,
0.28; p=0.572)
0.01 (-0.30,
0.32; p=0.937)
32

Table 13a Body fat percentage and blood pressure mean(s.d.) (complete cases)
Body fat percentage
(n=454)
SBP (n=494)
mm Hg
DBP (n=494)
mm Hg
Baseline 12 months Baseline 12 months Baseline 12 months
Control 43.59 (7.08) 42.71
(7.20)
133.78
(17.84)
133.11
(18.61)
81.17
(10.64)
79.10
(10.79)
POWeR:Face- to-
face
43.86 (8.00) 41.40
(8.81)
132.28
(15.81)
133.31
(15.70)
80.97 (9.37) 79.89
(9.20)
POWeR: Remote 42.18 (7.79) 40.53
(8.42)
134.17
(17.00)
132.11
(17.08)
80.71
(10.00)
78.92
(9.710
Table 13b Estimated differences in body fat percentage and systolic (SBP) and diastolic
(DBP) blood pressure using multiple imputation compared with the control group Body fat percentage Blood Pressure
SBP mm Hg DBP mm Hg
POWeR:Face-
to-face
-0.96 (-1.83, -0.08;
p=0.033)
0.05 (-2.76, 2.86;
p=0.973)
0.67 (-1.12, 2.46; p=0.461)
POWeR:
Remote
-0.53 (-1.47, 0.42;
p=0.274)
-2.72 (-5.56, 0.12;
p=0.061)
0.02 (-1.64, 1.68; p=0.979)
Table 14. Comparison of weights (Kg) according to diet chosen by the participant
(complete cases)Mean Kg (SD) at
baseline (n=510)
Mean KG (SD) at 6
months (n=303)
Mean Kg (SD) at 12
months (n=392)
Low calorie diet 102.68 (17.35) 98.12 (17.00) 99.25 (17.65)
Low carbohydrate
diet
102.57 (18.00) 97.30 (17.86) 98.37 (17.46)
Table 15. Physical activity – Godin questionnaire at 12 months(complete cases)
Median physical
activity score
(n=348)
Difference compared to
control group
Control group 20 (11,33)
POWeR+F 25 (12,41) 2.49
(-2.72, 7.70; p=0.348)
POWeR+R 21 (13,45) -0.90
(-5.97, 4.17; p=0.728)
33

Table 16a Mean portions (s.d.) of foods eaten per day (complete cases)
Control Power Face-to-Face Power RemoteBaseline 12 months Baseline 12 months Baseline 12 months
Sweets 1.14 (1.33) 0.89 (0.87) 1.39 (1.66) 0.71 (0.98) 1.24 (1.61) 0.86 (1.32)
Cereals 1.92 (1.17) 1.67 (0.98) 2.02 (1.26) 1.45 (0.97) 1.97 (1.43) 1.40 (0.90)
Fatty Foods 2.72 (1.85) 2.15 (1.67) 2.86 (2.01) 2.06 (1.45) 2.65 (1.83) 1.97 (1.32)
Salty snacks 0.33 (0.62) 0.19 (0.31) 0.33 (0.54) 0.16 (0.23) 0.31 (0.54) 0.15 (0.22)
Sweet drinks 0.49 (1.20) 0.22 (0.59) 0.38 (0.88) 0.11 (0.30) 0.48 (1.17) 0.24 (0.63)
Fruit and veg
3.70 (2.28) 4.63 (2.70) 4.02 (2.57) 4.46 (2.55) 3.85 (2.22) 4.63 (2.40)
Low fat dairy
1.29 (1.44) 1.23 (1.36) 1.64 (1.51) 1.45 (1.53) 1.43 (1.64) 1.53 (1.54)
High to low fat ratio
2.66 (8.27) 1.54 (8.00) 1.52 (6.41) 1.43 (5.53) 2.39 (7.74) 1.39 (4.59)
Table 16b Estimated differences in mean (SD) portions of foods eaten per day (imputed
data)
Difference compared to control group at 12 monthsSweets Cereals Fatty
FoodsSalty snacks
Sweet drinks Fruit and veg
Low fat dairy
Power+F -0.18 (-0.37, 0.02; p=0.072)
-0.21 (-0.44, 0.02; p=0.072)
-0.06(-0.40, 0.28; p=0.722)
-0.03 (-0.09, 0.03; p=0.357)
-0.09(-0.22, 0.04; p=0.165)
-0.04 (-0.67, 0.58; p=0.888)
0.14(-0.21, 0.48; p=0.432)
Power+R -0.13(-0.32, 0.06; p=0.161)
-0.23 (-0.46, 0.01; p=0.057)
-0.19 (-0.52, 0.15; p=0.270)
-0.04(-0.09, 0.02; p=0.203)
0.02(-0.10, 0.14; p=0.769)
0.17(-0.43, 0.76; p=0.570)
0.27(-0.09, 0.64; p=0.138)
Table 17. Mean EQ5D scores over 12 months in each group based on complete data
Groups Time Mean score in EQ5D (SD), n
95%CI for Mean
POWeR+FN=267
Baseline 0.824 (0.169) n =267 (0.804, 0.845)months 0.823 (0.207) n=169 (0.791, 0.854)
12 months 0.82 (0.207) n=139 (0.786, 0.855)POWeR+R:
N=267Baseline 0.816 (0.212) n=267 (0.759, 0.841)6 months 0.822 (0.2337) n=177 (0.764, 0.857)Baseline 0.811 (0.253) n=151 (0.742, 0.851)
Control group:N=276
Baseline 0.786 (0.232) n=276 (0.813, 0.814)6months 0.799 (0.234) n=168 (0.829, 0.835)
12 months 0.783 (0.239) n=134 (0.82, 0.824)
34

Table 18 EQ5D changes using bootstrap methods in imputed data
QALYs Difference (vs. control)
Control 0.791 (0.769, 0.813)POWeR+F 0.823 (0.805, 0.841) 0.032 (0.003, 0.059)POWeR+R 0.809 (0.787, 0.83) 0.017 (-0.014, 0.048)POWeR+F vs. POWeR+R 0.014 (-0.013, 0.042)
QALYs adjusted baseline QoL
Difference (vs. control)
Control 0.005 (-0.007, 0.018)POWeR+F -0.002 (-0.013, 0.009) -0.007 (-0.024, 0.009)POWeR+R -0.008 (-0.02, 0.004) -0.013 (-0.031, 0.004)POWeR+F vs. POWeR+R 0.006 (-0.01, 0.023)
35

References
1. Troiano. The relationship between body weight and mortality: a quantitative analysis of combined information from existing studies. Int J Obes Rel Metabol Dis 1996;20:63-75.
2. NIH. The National Heart Lung and Blood Institute. Clinical Guidelines on the identification and treatment of overweight and obesity in adults. Bethesda, MD, USA: NIH, 1998.
3. Health Do. Health survey for England - trends. London: Stationery Office, 2005.
4. National Institute for Health and Clinical Excellence: Obesity full guideline. Nice org 2006;http://guidance.nice.org.uk/CG43/guidance; Health Economic Modelling https://www.nice.org.uk/guidance/ng7/evidence/report-1-cost-effectiveness-considerations-from-a-population-modelling-viewpoint-8735005).
5. Avenell A, Broom J, Brown T, et al. Systematic review of the long term effects and economic consequences of treatment for obesity and the implications for health improvement. HTA monograph 2004.
6. Smith JH, H.; Edwards, N.; Maybin,J.; Parker, H.; Rosen,R.; Walsh,N. Securing the future of general practice, 2013.
7. Wadden T, Butryn M, Hong P, et al. Behavioral Treatment of Obesity in Patients Encountered in Primary Care Settings: A Systematic Review. JAMA 2014;Nov 5; 312(17): 1779-1791.doi: 10.1001/jama.2014.1417.
8. Wieland L, Falzon L, Sciamanna Cea. Interactive computer-based interventions for weight loss or weight maintenance in overweight or obese people. Cochrane Database of Systematic Reviews 2012;8:CD007675 doi: 10.1002/14651858.CD007675.pub2.
9. Tang J, Abraham C, Greaves C, et al. Self-directed interventions to promote weight loss: a systematic review of reviews. J Med Internet Res 2014;16(2):e58.
10. Appel L, Clark J, Yeh H, et al. Comparative effectiveness of weight-loss interventions in clinical practice. N Eng J Med 2011;365:1959-68.
11. Hutchesson M, Rollo M, Krukowski R, et al. eHealth interventions for the prevention and treatment of overweight and obesity in adults: a systematic review with meta-analysis. obesity reviews 2015;DOI: 10.1111/obr.12268.
12. Little P, Kelly J, Barnett J, et al. Randomised controlled factorial trial of dietary advice for patients with a single high blood pressure reading in primary care. BMJ 2004;328:1054-60.
13. Knowler W, Barrett-Connor E, Fowler S, et al. Reduction in the incidence of type 2 diabetes with lifestyle intervention or metformin. N Eng J Med 2002;346:393-403.
14. Tuomilehto J, Lindstrom J, Eriksson J, et al. Prevention of type 2 diabetes mellitus by changes in lifestyle among subjects with impaired glucose tolerance. N Eng J Med 2001;344:1343-50.
15. Jolly K, Lewis A, Beach J, et al. Comparison of range of commercial or primarycare led weight reduction programmes with minimal intervention control for weight loss in obesity:LightenUp randomised controlled trial. BMJ 2011;343:d6500 doi: 10.1136/bmj.d6500.
16. Little P, Lewith G, Webley F, et al. Randomised controlled trial of Alexander technique lessons, exercise, and massage (ATEAM) for chronic and recurrent back pain. BMJ 2008;337: doi: 10.1136/bmj.a884.
17. Sjostrom L, Rissanen A, Andersen T, et al. Randomised placebo-controlled trial of orlistat for weight loss and prevention of weight regain in obese patients. European Multicentre Orlistat Study Group. Lancet 1998;352:167-72.
18. Rothert K, Strecher V, Doyle L, et al. Web-based Weight Management Programs in an Integrated Health Care Setting: A Randomized, Controlled Trial. Obesity 2006;14:266-72.
36
19. Alberti K, Eckel R, Grundy S, et al. Harmonizing the Metabolic SyndromeA Joint Interim Statement of the International Diabetes Federation TaskForce on Epidemiology and Prevention; National Heart, Lung, and BloodInstitute; American Heart Association; World Heart Federation;International Atherosclerosis Society; and International Association for the Study of Obesity. Circulation 2009;120:1640-45.
20. Consensus statement International Diabetes Federation (IDF), the National Heart, Lung, and Blood Institute (NHLBI), the World Heart Federation, the International Atherosclerosis Society, and the American Heart Association (AHA). Circulation 2009;120:1640-45.
21. Neve M, Morgan P, Jones P, et al. Effectiveness of web-based interventions in achieving weight loss and weight loss maintenance in overweight and obese adults: a systematic review with meta-analysis. obesity reviews 2010;11:306-21.
22. Kodama S, Siato K, Tanaka S, et al. Effect of Web-based lifestyle modification on weight control: a meta-analysis. Int J Obes 2012;36:675-85.
23. Hartmann-Boyce J, Johns D, Jebb S, et al. Behavioural weight management programmes for adults assessed by trials conducted in everyday contexts: systematic review and meta-analysis. Obese Rev 2014;15:920-32.
24. Yardley L, Ware L, Smith E, et al. Randomised controlled feasibility trial of a web-based weight management intervention with nurse support for obese patients in primary care. The international journal of behavioral nutrition and physical activity 2014;11:67 doi: 10.1186/479-5868-11-67.
25. Yardley L, Morrison L, Bradbury K, et al. The Person-Based Approach to Intervention Development: Application to Digital Health-Related Behavior Change Interventions. J Med Internet Res 2015;17(1):e30.26. Beck J. The Beck Diet Solution. 1 ed. Birmingham: Oxmoor House, 2008.
27. Bradbury K, Dennison L, Little P, et al. Using mixed methods to develop and evaluate an online weight management intervention. British Journal of Health Psychology 2015;20(1):45-55 doi: 10 1111/bjhp 12125[published Online First: Epub Date]| 2015;20(1) doi: 10.1111/bjhp.12125:44-55.
28. Ware L, Williams S, Bradbury Kea. Exploring weight loss services in primary care and staff views on using a web-based programme. Informatics in primary care 2012;20(4):283-88.
29. Yardley L, Williams S, Bradbury Kea. Integrating user perspectives into the development of a web-based weight management intervention. Clinical Obesity 2012;2:132-41 2012;2:132-41.
30. Greenfield S, Kaplan S, Ware J, et al. Patients' participation in medical care: effects on blood sugar control and quality of life. J Gen Int Med 1988;3:448-57.
31. Renouf S, Bradbury K, Yardley L, et al. The role of nurse support within an Internet-delivered weight management intervention: A qualitative study. Psychology, Health & Medicine 2015;20 doi: 10.1080/13548506.2014.986138:963-71.
37