introduction to matlab - halvorsen.blog · introduction to matlab hans-petter halvorsen quick start...
TRANSCRIPT

Introduction to MATLABHans-Petter Halvorsen
https://www.halvorsen.blog
Quick Start Tutorial

What is MATLAB?
• MATLAB is a tool for technical computing, computation and visualization in an integrated environment.
• MATLAB is an abbreviation for MATrix LABoratory
• It is well suited for Matrix manipulation and problem solving related to Linear Algebra, Modelling, Simulation and Control Applications
• Popular in Universities, Teaching and Research

MATLAB Syntax - Exampleclear
clc
close all
x=[0, 1, 2, 3, 4 ,5];
y=[15, 10, 9, 6, 2 ,0];
for n=1:6 % n = model order
p = polyfit(x,y,n)
ymodel = polyval(p,x);
subplot(3,2,n)
plot(x,y,'o',x,ymodel)
title(sprintf('Model order %d', n));
end
For Loop
Built-in Functions
Defining Vectors

Lessons1. The MATLAB Environment (IDE)
2. MATLAB Basics
3. Vectors and Matrices
4. Plotting
5. Scripts (m-files)
6. User-defined Functions
7. Flow Control (if...elseif...else, while, switch...case)
Lesson 1
• The MATLAB Environment (IDE)
• MATLAB Basics

Working in the Development Environment
http://www.mathworks.com/videos/working-in-the-development-environment-69021.html
The MATLAB Environment (IDE)

The MATLAB Environment (IDE)
Command Window
Script Editor
WorkspaceCurrent Folder
Plot Window

Getting Started with MATLAB
http://www.mathworks.com/videos/getting-started-with-matlab-68985.html
MATLAB Basics
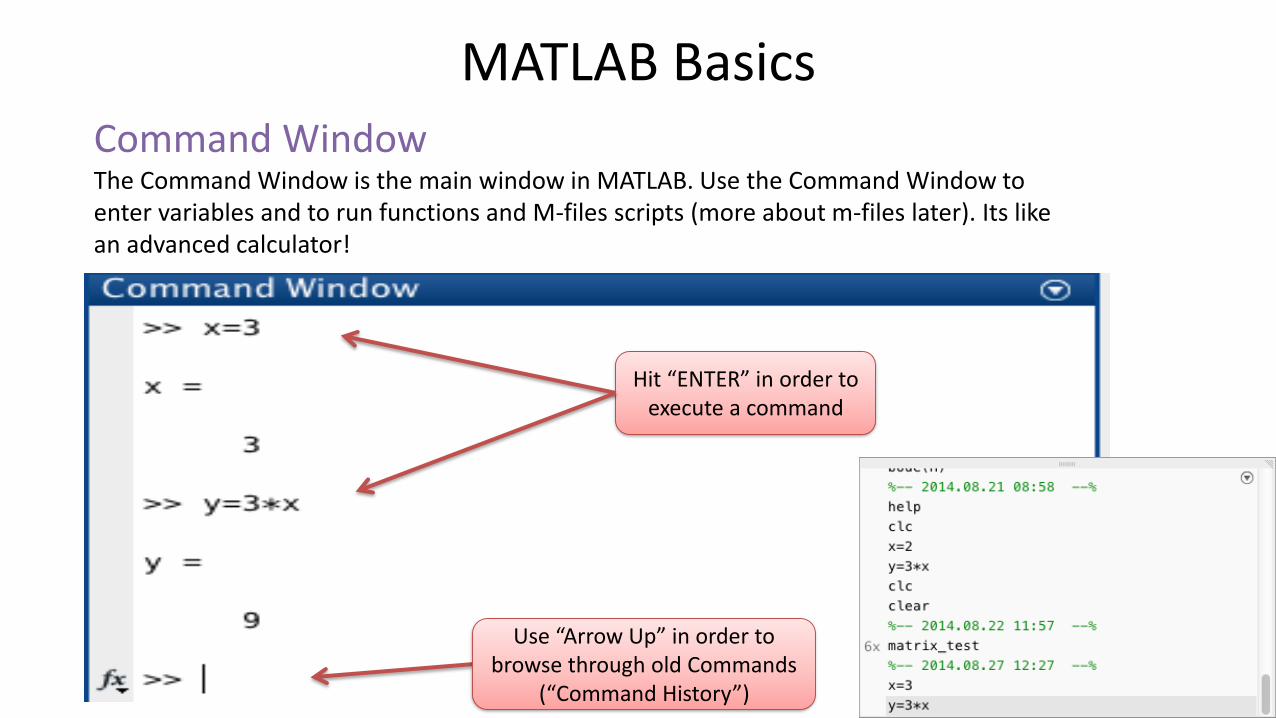
MATLAB BasicsCommand WindowThe Command Window is the main window in MATLAB. Use the Command Window to enter variables and to run functions and M-files scripts (more about m-files later). Its like an advanced calculator!
Hit “ENTER” in order to execute a command
Use “Arrow Up” in order to browse through old Commands
(“Command History”)

MATLAB Basics
MATLAB is case sensitive! The variables x and X are not the same.
>> x=3
x =
3
>> y=4;
>>
>> x=5;
>> X=6;
>> x+X
ans =
11
Unlike many other languages, where the semicolon is used to terminate commands, in MATLAB the semicolon serves to suppress the output of the line that it concludes.
Students: Try these examples
MATLAB Basics
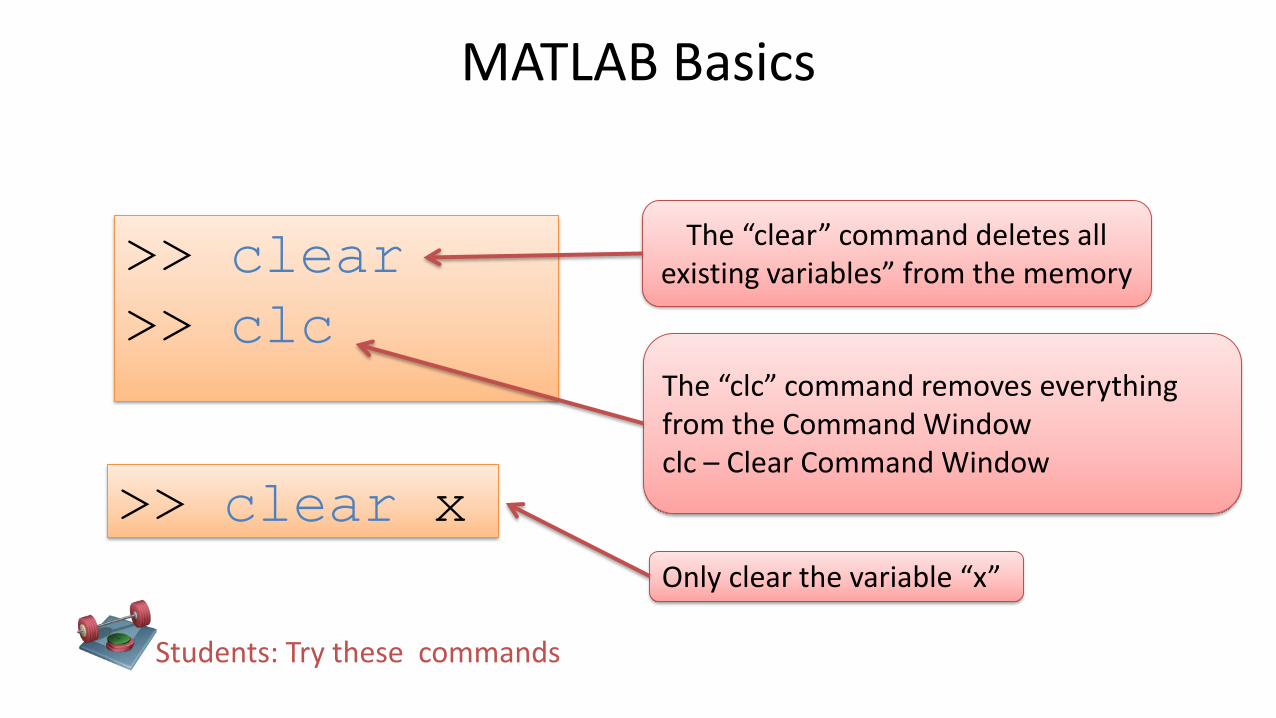
>> clear
>> clc
The “clear” command deletes all existing variables” from the memory
The “clc” command removes everything from the Command Windowclc – Clear Command Window
Students: Try these commands
>> clear x
Only clear the variable “x”

MATLAB Basics
>> r=5;
>> A=pi*r^2
A =
78.5398
Students: Try these examples
Name Description
i, j Used for complex numbers, e.g., z=2+4i
pi π
inf ∞, Infinity
NaN Not A Number. If you, e.g., divide by zero,
you get NaN
Built-in constants
>> z1=3+3i;
>> z2=3+5i;
>> z = z1+z2
z =
6.0000 + 8.0000i
>> a=2;
>> b=0;
>> a/b

MATLAB Basics
Students: Calculate this expression, try with different values for x and y
MATLAB
log(x)
log10(x)
sqrt(x)
exp(x)
x^2
Mathematical Expressions
>> x=2;
>> y=3*x+2/2
y =
7
>> y=(3*x+2)/2
y =
4 Which are correct?
Students: Try this example

MATLAB Basics
Students: Calculate this expression, try with different values for 𝑥 and 𝑦
Solutions:
>> x=2;, y=2
>> z = 3*x^2 + sqrt(x^2 + y^2) + exp(log(x))
ans =
16.8284
...

MATLAB Basics
Students: Use MATLAB in order to find the surface area (𝐴) of a cylinder based on the height (ℎ) and the radius (𝑟) of the cylinder
𝐴 =?
𝑟 = 3
ℎ = 8

MATLAB BasicsStudents: Find the surface area of a cylinder based on the height (ℎ) and the radius (𝑟) of the cylinder
Solutions:
>> h=8
>> r=3
>> A = 2*pi*r^2 +2*pi*r*h;
A =
207.3451
Whats next?
Self-paced Tutorials with lots of Exercises and Video resources
Do as many Exercises as possible! The only way to learn MATLAB is by doing Exercises and hands-on Coding!!!
Learning by Doing!
Lesson 2
• Vectors & Matrices
• Plotting

Working with Arrays
http://www.mathworks.com/videos/working-with-arrays-in-matlab-69022.html
Vectors & Matrices

Vectors & Matrices• Matrices and vectors (Linear Algebra) are the basic elements in MATLAB
and also the basic elements in control design theory, etc.• All variables in MATLAB is a matrix (but with different dimensions)• So it is important you know how to handle vectors and matrices in
MATLAB and in general
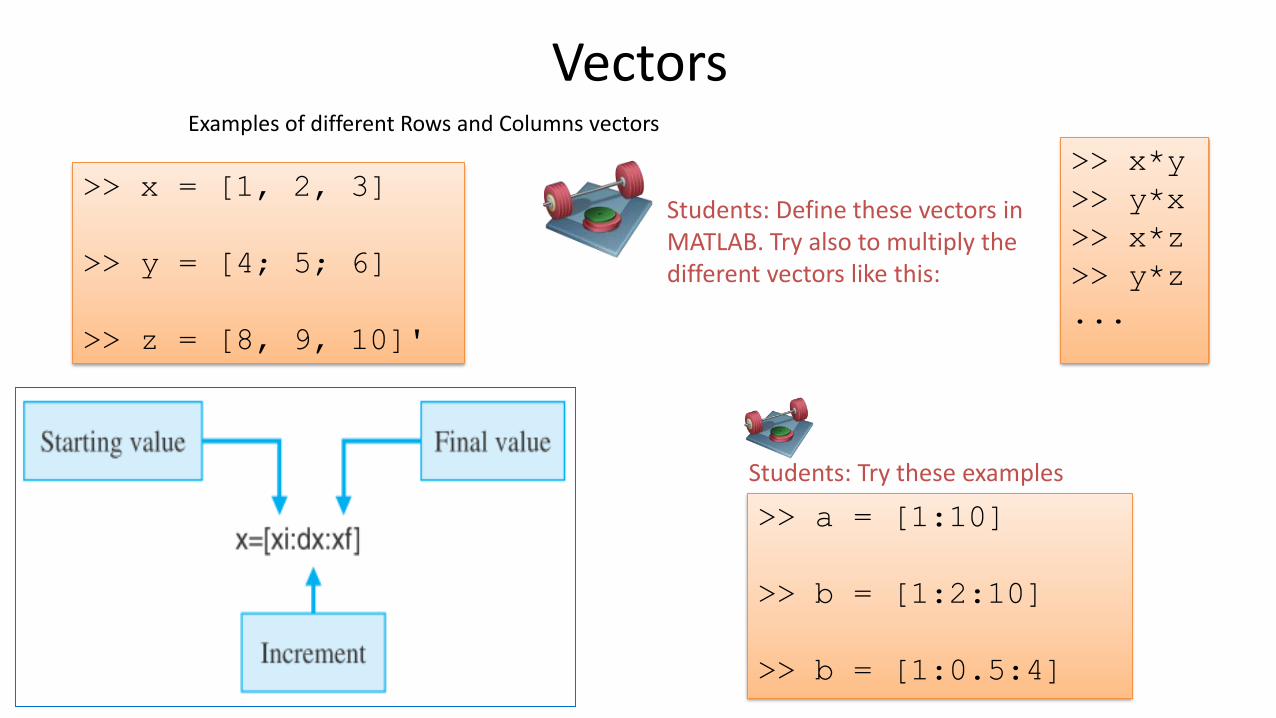
Vectors
>> x = [1, 2, 3]
>> y = [4; 5; 6]
>> z = [8, 9, 10]'
Examples of different Rows and Columns vectors
Students: Define these vectors in MATLAB. Try also to multiply the different vectors like this:
>> x*y
>> y*x
>> x*z
>> y*z
...
>> a = [1:10]
>> b = [1:2:10]
>> b = [1:0.5:4]
Students: Try these examples

VectorsGiven the following Rain Data for a given Week (Monday to Sunday):
>> x = [2.1, 10, 9.7, 6.2, 2.5, 0, 8.5]
We define the Data in MATLAB like this:
Students: Try these examples
Day Rain
Amount
Monday 2,1 mm
Tuesday 10 mm
Wednesday 9,7 mm
Thursday 6,2 mm
Friday 2,5 mm
Saturday 0 mm
Sunday 8,3 mm
>> x(1)
ans = 2.1000
If we are only interested in the Rain Amount on Monday:
Rain Amount on Friday:
>> x(5)
ans = 2.5000
Etc.

VectorsGiven the following Rain Data for a given Week (Monday to Sunday):
>> x = [2.1, 10, 9.7, 6.2, 2.5, 0, 8.5]
We define the Data in MATLAB like this:
Students: Try these examples
Day Rain Amount
Monday 2,1 mm
Tuesday 10 mm
Wednesday 9,7 mm
Thursday 6,2 mm
Friday 2,5 mm
Saturday 0 mm
Sunday 8,3 mm
What is the Average Rain Amount this Week?
>> mean(x)
ans = 5.5714
In MATLAB we can use the ”mean” function:
We can define a variable, e.g.:
>> mean_value_week = mean(x)
mean_value_week = 5.5714

VectorsGiven the following function:
>> x=-10:10
>> y=2.*x.^2 + 3.*x + 1
y =
171 136 105 78
55 36 21 10 3
0 1 6 15 28
45 66 91 120 153
190 231
𝑦 𝑥 = 2𝑥2 + 3𝑥 + 1
Students: Try these examples
−10 ≤ 𝑥 ≤ 10
Note how we have used .* and .^
.* each element-wise Multiplication
.^ each element-wise Power
What is 𝑦 3 =?
>> y(14)
ans = 28
We can also do like this:
>> x = 3;
>> y = 2*x^2 + 3*x + 1
y = 28
Index x y(x)
1 -10 171
2 -9 136
3 -8 105
4 -7 78
5 -6 55
6 -5 36
7 -4 21
8 -3 10
9 -2 3
10 -1 0
11 0 1
12 1 6
13 2 15
14 3 28
15 4 45
16 5 66
17 6 91
18 7 120
19 8 153
20 9 190
21 10 231
where:
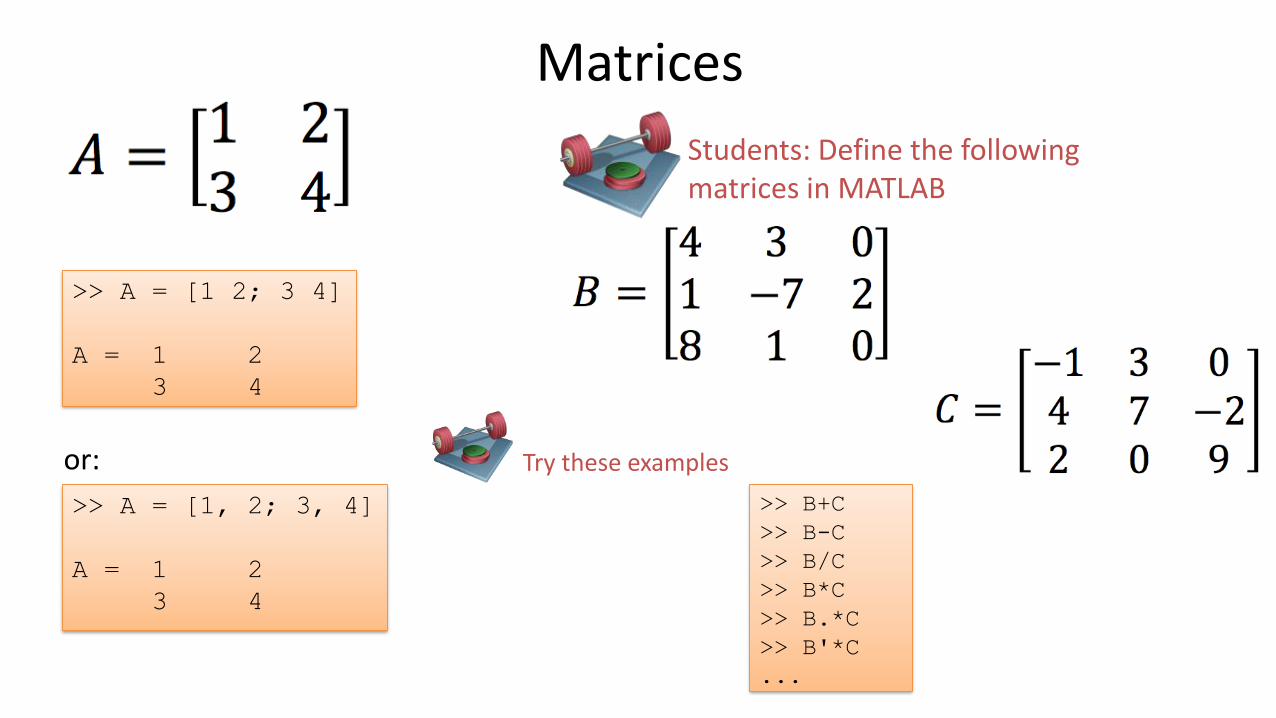
Matrices
>> A = [1 2; 3 4]
A = 1 2
3 4
>> A = [1, 2; 3, 4]
A = 1 2
3 4
or:
Students: Define the following matrices in MATLAB
>> B+C
>> B-C
>> B/C
>> B*C
>> B.*C
>> B'*C
...
Try these examples

MatricesGiven the following matrices:
>> A*B
>> B*A
>> A+B
>> B'
>> B'*C
>> A*B'
>> A'*B’
>> A.*B
...
Define the matrices and try these examples
>> rank(A)
>> det(A)
>> inv(A)
>> inv(B)
>> eig(A)
>> inv(A)
>> inv(B)
>> diag(A)
>> inv(A)*A
>> A*inv(A)
...
>> A*(B*C)
>> (A*B)*C
>> (A+B)*C
>> A*C + C*B
>> (A+inv(B))*C
...

Plotting
Using Basic Plotting Functions
http://www.mathworks.com/videos/using-basic-plotting-functions-69018.html

Plotting
>> x = 0:0.1:2*pi;
>> y = sin(x);
>> plot(x,y)
Students: Try this example
Students: Try also these examples:
>> x = 0:0.1:2*pi;
>> y = sin(x);
>> y2 = cos(x);
>> plot(x,y, x,y2)
...
>> plot(x,y,'r*', x,y2,'g+')

Plotting
Name Description
plot Create a Plot
figure Define a new Figure/Plot window
grid on/off Create Grid lines in a plot
title Add Title to current plot
xlabel Add a Label on the x-axis
ylabel Add a Label on the x-axis
axis Set xmin,xmax,ymin,ymax
hold on/off Add several plots in the same Figure
legend Create a legend in the corner (or at a
specified position) of the plot
subplot Divide a Figure into several Subplots
>> x=0:0.1:2*pi;
>> y=sin(x);
>> plot(x,y)
>> title('Plot Example')
>> xlabel('x')
>> ylabel('y=sin(x)')
>> grid on
>> axis([0,2*pi,-1,1])
>> legend(’Temperature')
Plotting functions:Students: Try this example
Students: Try also to change some of the commands and see what happens with the plot

Plotting
Students: Plot these Values
Day Rain Amount
Monday 2,1 mm
Tuesday 10 mm
Wednesday 9,7 mm
Thursday 6,2 mm
Friday 2,5 mm
Saturday 0 mm
Sunday 8,3 mm
Given the following Rain Data for a given Week (Monday to Sunday):
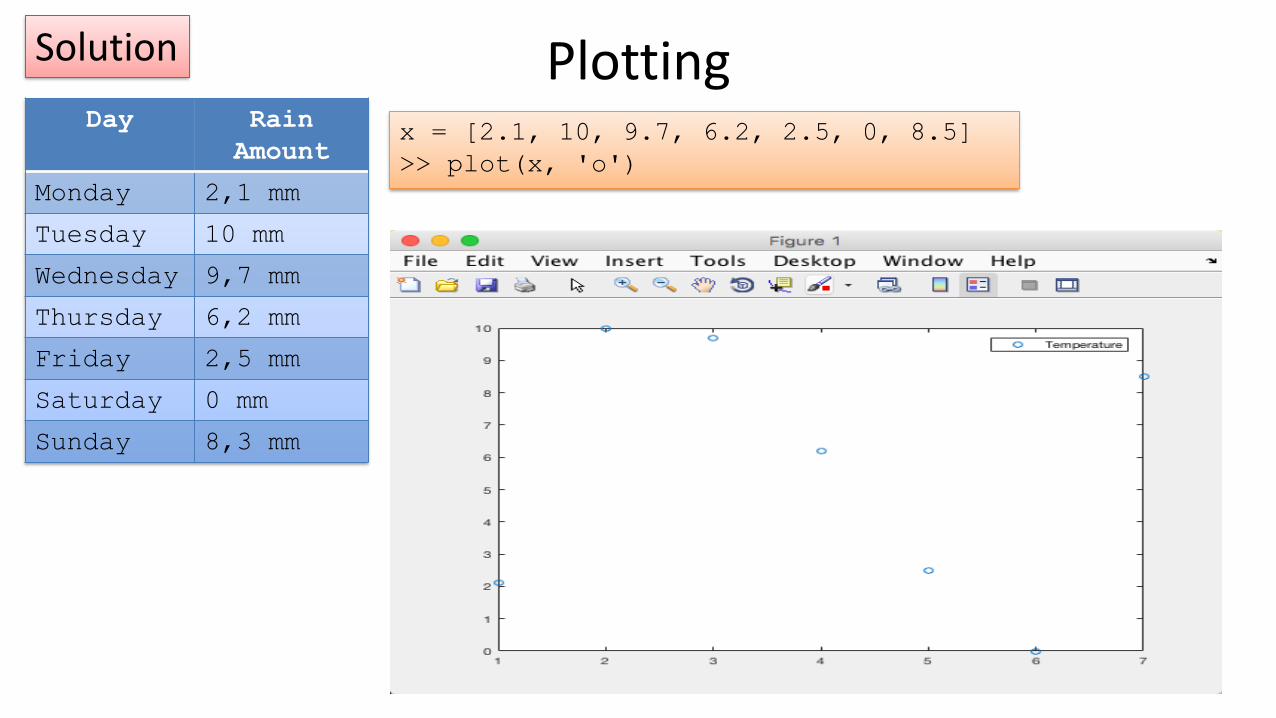
PlottingDay Rain
Amount
Monday 2,1 mm
Tuesday 10 mm
Wednesday 9,7 mm
Thursday 6,2 mm
Friday 2,5 mm
Saturday 0 mm
Sunday 8,3 mm
x = [2.1, 10, 9.7, 6.2, 2.5, 0, 8.5]
>> plot(x, 'o')
Solution
Plotting
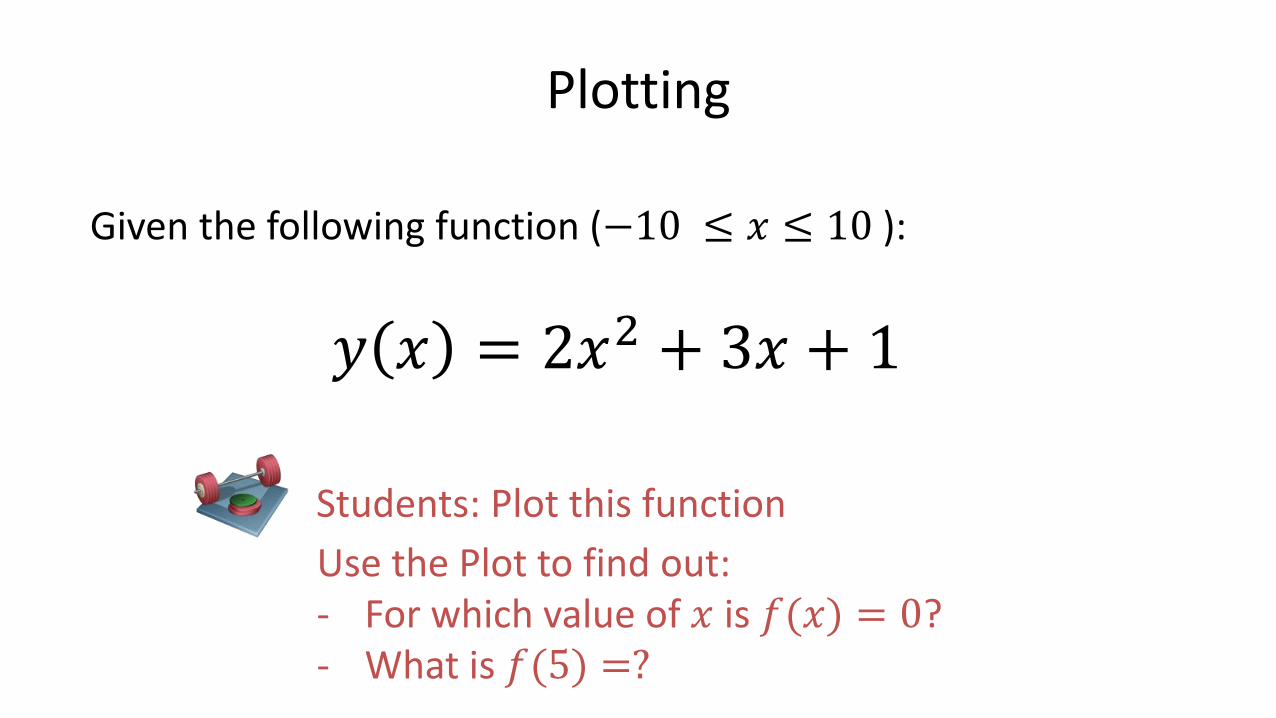
Given the following function (−10 ≤ 𝑥 ≤ 10 ):
𝑦 𝑥 = 2𝑥2 + 3𝑥 + 1
Students: Plot this function
Use the Plot to find out:- For which value of 𝑥 is 𝑓(𝑥) = 0?- What is 𝑓(5) =?

Plotting
>> x=0:0.1:2*pi;
>> y=sin(x);
>> y2=cos(x);
>> subplot(2,1,1)
>> plot(x,y)
>> subplot(2,1,2)
>> plot(x,y2)
Subplot >> x=0:0.1:2*pi;
>> y=sin(x);
>> y2=cos(x);
>> y3=tan(x);
>> subplot(3,1,1)
>> plot(x,y)
>> subplot(3,1,2)
>> plot(x,y2)
>> subplot(3,1,3)
>> plot(x,y3)
>> x=0:0.1:2*pi;
>> y=sin(x);
>> y2=cos(x);
>> y3=tan(x);
>> y4=atan(x);
>> subplot(2,2,1)
>> plot(x,y)
>> subplot(2,2,2)
>> plot(x,y2)
>> subplot(2,2,3)
>> plot(x,y3)
>> subplot(2,2,4)
>> plot(x,y4)
Students: Try these examples

Whats next?
Self-paced Tutorials with lots of Exercises and Video resources
Do as many Exercises as possible! The only way to learn MATLAB is by doing Exercises and hands-on Coding!!!
Learning by Doing!
Lesson 3
• Scripts (m-files)
•User-defined Functions

Writing a MATLAB Program
http://www.mathworks.com/videos/writing-a-matlab-program-69023.html
Scripts (m-files)

Scripts (m-files)Script Editor When using the Script Editor, you may create several lines of code and execute
all in one batch. You can easily do changes in your code, create comments, etc.
Run the Script
Students: Try this example
clear
clc
x=0:0.1:2*pi;
y=sin(x);
y2=cos(x);
y3=tan(x);
y4=atan(x);
%plotting sin(x)
subplot(2,2,1)
plot(x,y)
%plotting cos(x)
subplot(2,2,2)
plot(x,y2)
%plotting tan(x)
subplot(2,2,3)
plot(x,y3)
%plotting atan(x)
subplot(2,2,4)
plot(x,y4)
MATLAB Scripts are saved as so-called .m files (file extension is .m)

User-defined Functions
Students: Try this example
You Create the Function in the Editor
MATLAB contains hundreds of built-in functions, but very often you need to create your own functions
You Use the Function in the Command Window or in a Script
Input
Return value
function output = function_name(input)

User-defined Functions
>> Tc = 20;
>> Tf =
fahrenheit(Tc)
Tf =
68
Example: Convert from Celsius to Fahrenheit
Students: Create a User-defined Function that converts from Temperature in Celsius to Temperature in Fahrenheit
Try the function in the Command window like this:
Try the function in a Script like this:
You need to create this function

User-defined FunctionsSolutions: Convert from Celsius to Fahrenheit
function Tf = fahrenheit(Tc)% This function converts a temperature from celsius to
fahrenheit
Tf = (9/5)*Tc + 32;
clear
clc
t = 0:0.1:24;
Tc = (sin(t)+1)*20;
Tf = fahrenheit(Tc);
plot(t,Tc, t,Tf)
title('Temperature Simulation')
xlabel('t')
ylabel('Temperature')
grid on
axis([0,24, 0,120]);
legend('Celcius', 'Fahrenheit')

Whats next?
Self-paced Tutorials with lots of Exercises and Video resources
Do as many Exercises as possible! The only way to learn MATLAB is by doing Exercises and hands-on Coding!!!
Learning by Doing!
Lesson 4
• Flow Control
–if...elseif...else
–while
–switch...case

Flow ControlFlow Control:• if-elseif-else statement• switch-case-otherwise statementLoops:• for Loop• while Loop
The behavior is the same as in other programming languages. It is assumed you know about For Loops, While Loops, If-Else and Switch statements from other programming languages, so we will briefly show the syntax used in MATLAB and go through some simple examples.
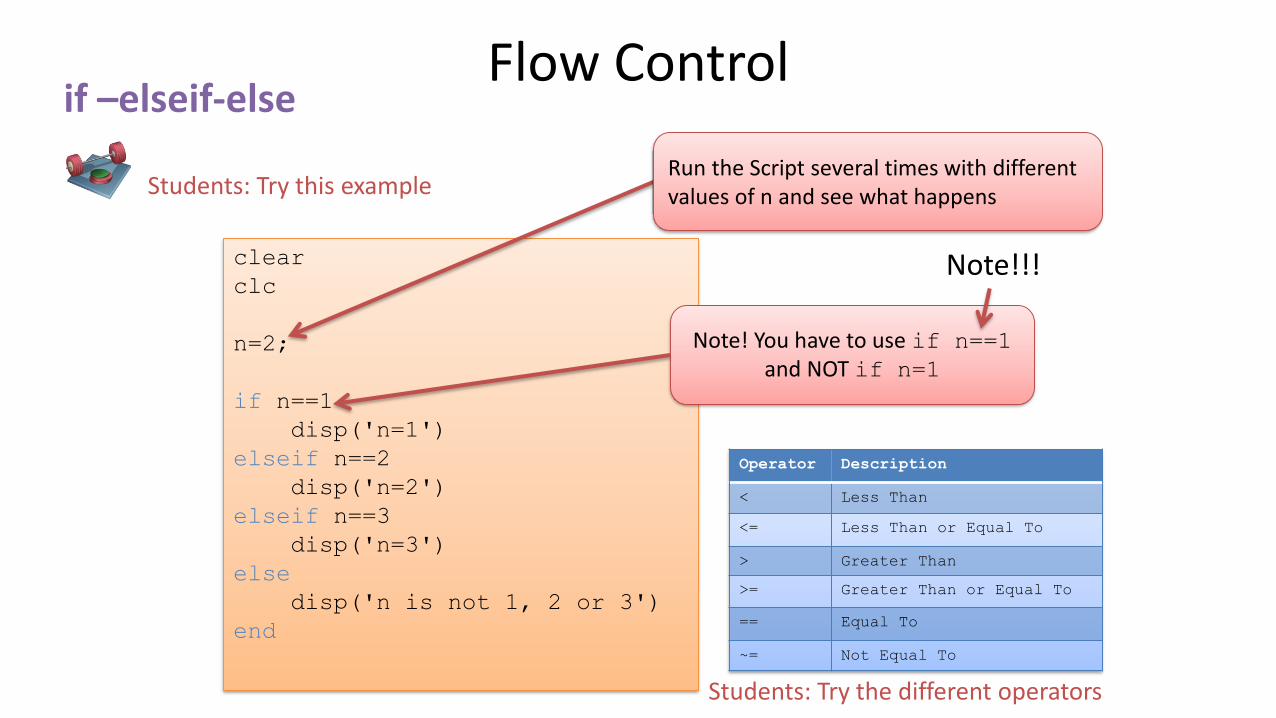
Flow Control
clear
clc
n=2;
if n==1
disp('n=1')
elseif n==2
disp('n=2')
elseif n==3
disp('n=3')
else
disp('n is not 1, 2 or 3')
end
if –elseif-else
Students: Try this exampleRun the Script several times with different values of n and see what happens
Note! You have to use if n==1and NOT if n=1
Note!!!
Operator Description
< Less Than
<= Less Than or Equal To
> Greater Than
>= Greater Than or Equal To
== Equal To
~= Not Equal To
Students: Try the different operators

Flow Control
clear
clc
n=1;
switch(n)
case 1
disp('n=1')
case 2
disp('n=2')
case 3
disp('n=3')
otherwise
disp('n is not 1, 2 or 3')
end
switch-case-otherwise
Students: Try this exampleRun the Script several times with different values of n and see what happens
“if-elseif-else” and “switch-case-otherwise” is very similar in use

Flow Control
clear
clc
x = [4, 6, 3, 9, 22, 11];
N = length(x);
for i=1:N
x(i)
end
for loop
Students: Try this exampleStudents: Create a script that sums all the numbers in a vector (array)
clear
clc
x = [4, 6, 3, 9, 22, 11];
N = length(x);
total = 0;
for i=1:N
total = total + x(i)
end
Solution:
Students: Try with different x vectors

Flow Control
clear
clc
x = -20:0.1:20;
y = 2.*x.^2 + 20.*x - 22;
plot(x,y)
grid
i=1;
while ( y(i) > y(i+1) )
i = i + 1;
end
x(i)
y(i)
while loop
Students: Try this example.Try also with other 2.degree functions
The minimum of the function
(-5,72)
We want to find for what value of x the function has its minimum value
Element-wise multiplication

Whats next?
Self-paced Tutorials with lots of Exercises and Video resources
Do as many Exercises as possible! The only way to learn MATLAB is by doing Exercises and hands-on Coding!!!
Learning by Doing!
Tips & Tricks

Tips & Tricks% This is a comment
x=2; % Comment2
y=3*x % Comment3
Decimal sign: Use ”.”– NOT ”,” ! i.e. y=3.2 – not y=3,2
Use Comments (%)
DO NOT use ”spaces” in Filename or names thatare similiar to built-in functions in MATLAB!
Use the arrows keys to ”browse” in previous commands used in the Command Window
Functions:• Only ONE function in each File!• The Filename (.m) AND the Name of the Function MUST be
the same!
Use english names on variables, functions, files, etc. This is common practice in programming!Use always variables – Do not use numbers directly in the expressions!
a=2;
b=4;
y=a+b
y=2+4
Yes:
No:
clear
clc
close all
…
Always include these lines in your Script:
- but they have to make sense!

Tips & Tricks
Mathematical expressions: The following applies in MATLAB
A Golden Rule: One Task – one m file, i.e. DON’T put all the Tasks in one single m file!!
x = 2;
y = 2;
z = 3*x^2 + sqrt(x^2 + y^2)+ exp(log(x))
Use help in order to find out howto use a function in MATLAB. In order to get help for the tffunction, type the following in theCommand window:
>>help tf

Hans-Petter Halvorsen
University of South-Eastern Norway
www.usn.no
E-mail: [email protected]
Web: https://www.halvorsen.blog