international student achievement in reading · international student achievement in reading...
TRANSCRIPT

Chapter 1International Student Achievement in Reading
Chapter 1 presents the reading comprehension achievement results for students in their fourth year of formal schooling for the 40 countries, including Belgium with 2 education systems and Canada with 5 provinces, that participated in PIRLS 2006 (45 participants in total). The chapter begins with a discussion of students’ achievement in PIRLS 2006, and then presents changes in achievement over the past 5-year period for those countries that also participated in PIRLS 2001. The reading comprehension achievement results for 2006 and changes from 2001 also are provided by gender. Next, the chapter presents the corresponding achievement results for the reading purposes and processes of reading comprehension described in the PIRLS 2006 Assessment Framework and Specifications.� The two reading purposes are Literary and Informational. Achievement in the processes of reading comprehension is reported for two categories: (1) Retrieving and straightforward inferencing and (2) Interpreting, integrating, and evaluating.
How Do Countries Differ in Reading Achievement?
Exhibit 1.1 displays the distributions of achievement for PIRLS 2006 for 40 participating countries, including Belgium with 2 education systems and Canada with 5 provinces. Historically, because they have separately administered education systems, England and Scotland, as well as Hong Kong, prior to becoming a Special Administrative Region (SAR) of the People’s Republic of China, have participated separately in IEA studies and
� Mullis,I.V.S.,Kennedy,A.M.,Martin,M.O.,&Sainsbury,M.(2006).PIRLS 2006 assessment framework and specifications, (2nded.).ChestnutHill,MA:BostonCollege.
36 chapter 1: international student achievement in reading
this practice continues in TIMSS and PIRLS to monitor trends and have comparability between the two studies. For the purposes of this report, these three education systems are treated as countries. Since Belgium has two education systems, one administered by the French-speaking community and the other by the Dutch-speaking community, the two education systems traditionally have participated separately in IEA studies, so again, this practice has been kept and two sets of data are reported for Belgium. The five Canadian provinces represent 88 percent of the student population in Canada, but preferred to participate in PIRLS 2006 separately but not collectively as a country. Thus, as a compromise, their results are reported in italics together with the other participants. Altogether, then, the tables in the PIRLS 2006 International Report typically contain results for the 45 participants in PIRLS 2006. For their own purposes as an additional effort, Iceland and Norway administered PIRLS 2006 to small samples of their fifth-grade students, and these results are presented in Appendix F.
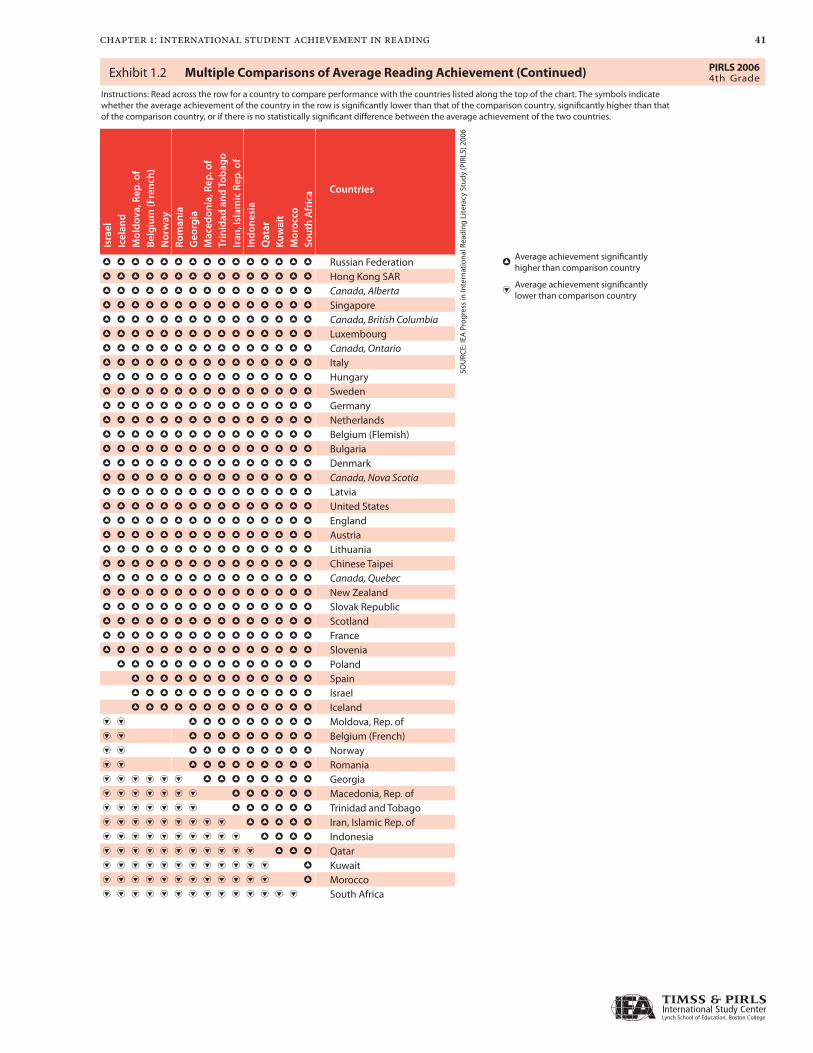
In Exhibit 1.1, the 45 participants are shown in descending order of average reading achievement. Each participant’s average score on the PIRLS achievement scale (with its 95% confidence interval) is shown graphically on the participant’s achievement distribution, and listed (together with its standard error) in the first column in the table. Because there often are relatively small differences between participants in average achievement, Exhibit 1.2 shows whether or not the differences in average achievement are statistically significant.
The highest achieving participants in PIRLS 2006 represent different regions of the world geographically, including Eastern Europe (the Russian Federation, Hungary, and Bulgaria), Asia (Hong Kong SAR and Singapore), Canada (Alberta, British Columbia, and Ontario), Italy in Southern Europe, Western Europe (Luxembourg, Germany, the Netherlands, and Belgium (Flemish)), and Scandinavia (Sweden and Denmark). The PIRLS reading achievement scale was established in PIRLS 2001 to have a mean of 500 and a standard deviation of 100,2 and was designed to remain constant from assessment to assessment. There is an indication by a participant’s average
2 PIRLSusesitemresponsetheoryscaling(IRT)methodstosummarizeachievementresultsonascalewithameanof500andastandarddeviationof100.Formoreinformation,seethe“IRTScalingandDataAnalysis”sectionofAppendixA.

37chapter 1: international student achievement in reading
Exhibit 1.1: Distribution of Reading Achievement
Countries Reading Achievement Distribution AverageScale Score
Years of Formal
Schooling*
AverageAge
HumanDevelopment
Index**
2a Russian Federation h 565 (3.4) 4 10.8 0.797Hong Kong SAR h 564 (2.4) 4 10.0 0.927
2a Canada, Alberta h 560 (2.4) 4 9.9 0.950Singapore h 558 (2.9) 4 10.4 0.916
2a Canada, British Columbia h 558 (2.6) 4 9.8 0.950Luxembourg h 557 (1.1) 5 11.4 0.945
2a Canada, Ontario h 555 (2.7) 4 9.8 0.950Italy h 551 (2.9) 4 9.7 0.940Hungary h 551 (3.0) 4 10.7 0.869Sweden h 549 (2.3) 4 10.9 0.951Germany h 548 (2.2) 4 10.5 0.932
† Netherlands h 547 (1.5) 4 10.3 0.947†2a Belgium (Flemish) h 547 (2.0) 4 10.0 0.945
2a Bulgaria h 547 (4.4) 4 10.9 0.8162a Denmark h 546 (2.3) 4 10.9 0.943
Canada, Nova Scotia h 542 (2.2) 4 10.0 0.950Latvia h 541 (2.3) 4 11.0 0.845
†2a United States h 540 (3.5) 4 10.1 0.948England h 539 (2.6) 5 10.3 0.940Austria h 538 (2.2) 4 10.3 0.944Lithuania h 537 (1.6) 4 10.7 0.857Chinese Taipei h 535 (2.0) 4 10.1 0.910Canada, Quebec h 533 (2.8) 4 10.1 0.950New Zealand h 532 (2.0) 4.5 – 5.5 10.0 0.936Slovak Republic h 531 (2.8) 4 10.4 0.856
† Scotland h 527 (2.8) 5 9.9 0.940France h 522 (2.1) 4 10.0 0.942Slovenia h 522 (2.1) 3 or 4 9.9 0.910Poland h 519 (2.4) 4 9.9 0.862Spain h 513 (2.5) 4 9.9 0.938
2b Israel h 512 (3.3) 4 10.1 0.927Iceland h 511 (1.3) 4 9.8 0.960PIRLS Scale Avg. 500 – – –Moldova, Rep. of 500 (3.0) 4 10.9 0.694Belgium (French) 500 (2.6) 4 9.9 0.945
‡ Norway 498 (2.6) 4 9.8 0.965Romania i 489 (5.0) 4 10.9 0.805
2a Georgia i 471 (3.1) 4 10.1 0.743Macedonia, Rep. of i 442 (4.1) 4 10.6 0.796Trinidad and Tobago i 436 (4.9) 5 10.1 0.809Iran, Islamic Rep. of i 421 (3.1) 4 10.2 0.746Indonesia i 405 (4.1) 4 10.4 0.711Qatar i 353 (1.1) 4 9.8 0.844Kuwait i 330 (4.2) 4 9.8 0.871Morocco i 323 (5.9) 4 10.8 0.640South Africa i 302 (5.6) 5 11.9 0.653
* Represents years of schooling counting from the first yearof ISCED level 1.
** Taken from United Nations Development Programme’s Human Development Report 2006, p. 283–286, except for Chinese Taipei taken from Directorate General of Budget, Accounting and Statistics, Executive Yuan, R.O.C. Statistical Yearbook 2005. Data for Belgium (Flemish) and Belgium (French) are for the entire country of Belgium. Data for England and Scotland are for the United Kingdom.
† Met guidelines for sample participation rates only after replacement schools were included (see Exhibit A.7).
‡ Nearly satisfying guidelines for sample participation rates after replacement schools were included (see Exhibit A.7).
2a National Defined Population covers less than 95% of National Desired Population (see Exhibit A.4).
2b National Defined Population covers less than 80% of National Desired Population (see Exhibit A.4).
( ) Standard errors appear in parentheses. Because results are rounded to the nearest whole number, some totals may appear inconsistent.
NOTE: See Exhibit C.1 for percentiles of achievement in reading.
SOU
RCE:
IEA
Pro
gres
s in
Inte
rnat
iona
l Rea
ding
Lite
racy
Stu
dy (P
IRLS
) 200
6
Exhibit 1.1 Distribution of Reading Achievement PIRLS 20064th Grade
100 200 300 400 500 600 700
5th 75th 95th25th
95% Confidence Interval for Average (±2SE)
Percentiles of Performance hCountry average significantly higher than PIRLS scale average
iCountry average significantly lower than PIRLS scale average
38 chapter 1: international student achievement in reading
scale score, if the average achievement is significantly higher (up arrow) or lower (down arrow) than the scale average of 500.
The graph of the achievement distributions indicates the ranges in performance for the middle half of students (25th to 75th percentiles) and the extremes (5th and 95th percentiles). Although it was to a differing degree from country to country, by the fourth year of schooling, every PIRLS 2006 participant had some percentage of students who were good readers and some percentage of students who demonstrated difficulties. The majority of countries had approximately a 250-point difference between the 5th and 95th percentiles of achievement, although some had larger differences and others had more homogeneity in performance. It is important to note that the range in achievement in most countries is comparable to the difference in average achievement (263 points) between the highest performing country, the Russian Federation, and lowest performing country, South Africa.
PIRLS devoted considerable energy to maximizing comparability across the grades and ages tested, but this is difficult considering the variation internationally in many educational policies, such as school entry ages and the number of languages of instruction. Exhibit 1.1 shows that, in accordance with the PIRLS guidelines, most countries assessed students in their fourth year of formal schooling. Thus, for convenience in this report, the students will be referred to as fourth-grade students even though several countries did not assess students in the fourth grade. In consultation with the PIRLS sampling specialists, Slovenia included some students in third grade because the country is in transition toward having students start school at a younger age so they will have 4 years of primary schooling instead of 3 years, but the transition is not complete. Also, in accordance with PIRLS guidelines, since their students start school at a very early age and otherwise would have been very young, four countries (England, New Zealand, Scotland, and Trinidad and Tobago) tested the fifth year of schooling. Two other countries also tested the fifth year because of challenges concerning the language(s) of instruction (Luxembourg and South Africa), which resulted in their students being older, on average, than the rest of the students tested.
39chapter 1: international student achievement in reading
Given that students are in their fourth year of schooling and the majority begin school at age 6, as presented in Exhibit 3, they are expected to be approximately 10 years old. Typically, as was the case in most of the countries (and all provinces), students would average from 9.7 to 10.6 years old, depending on whether they started school at age 6 or 7 and when during the calendar year they started school (January, the beginning of the school year, or some other time). In a few countries, primarily in Eastern Europe, students do not start school until age 7 and consequently were a little older (10.7 to 11 years old). As would be anticipated in PIRLS with a wide range of cultural and economic diversity, higher performing countries included those with younger and older students, on average, and lower performing countries also had students averaging from the youngest to the oldest.
To provide some context about the economic and educational development of the PIRLS 2006 participants, Exhibit 1.1 also includes each one’s value on the Human Development Index� provided by the United Nations Development Programme. The index has a minimum value of 0.0 and a maximum of 1.0. Countries with high values on the index have a long life expectancy, high levels of school enrollment and adult literacy, and a good standard of living, as measured by per capita Gross Domestic Product. The majority of the PIRLS 2006 participants had index values greater than 0.9, and most with values this high performed above the 500 scale average, except Belgium (French) and Norway that were approximately at the average. The countries with averages significantly below 500 all had values lower than 0.9 (.653 to .871) and the two lowest performing countries, Morocco and South Africa, had the lowest values (.640 and .653). However, it is important to note that some countries with reading achievement significantly above the 500 average had indices ranging from .797 to .869, including the top-achieving Russian Federation, as well as Hungary, Latvia, the Slovak Republic, and Poland.
Exhibit 1.2 depicts whether or not the differences in average achievement between pairs of countries and/or Canadian provinces are statistically significant. Selecting a PIRLS 2006 participant of interest and reading across the table, a circle with a triangle pointing up indicates significantly higher performance than the comparison country listed across the top. Absence of
� ThevaluefortheUnitedKingdomisgivenforEnglandandScotland,Belgium’svalueisgivenforbothFlemishandFrencheducationsystems,andCanada’svalueisgivenforeachofthefiveprovinces.

40 chapter 1: international student achievement in reading
Exhibit 1.2: Multiple Comparisons of Average Reading Achievement
Instructions: Read across the row for a country to compare performance with the countries listed along the top of the chart. The symbols indicate whether the average achievement of the country in the row is significantly lower than that of the comparison country, significantly higher than that of the comparison country, or if there is no statistically significant difference between the average achievement of the two countries.
Countries
Russ
ian
Fed
erat
ion
H
ong
Kon
g S
AR
Cana
da, A
lber
ta
Sin
gap
ore
Cana
da, B
riti
sh C
olum
bia
Luxe
mb
ourg
Ca
nada
, Ont
ario
It
aly
Hun
gar
y Sw
eden
G
erm
any
Net
her
lan
ds
Bel
gium
(Fle
mis
h)
Bul
gar
iaD
enm
ark
Cana
da, N
ova
Scot
ia
Latv
ia
Un
ited
Sta
tes
Eng
lan
dA
ustr
ia
Lith
uan
iaC
hin
ese
Taip
ei
Cana
da, Q
uebe
c N
ew Z
eala
nd
Sl
ovak
Rep
ublic
Sc
otla
nd
Fr
ance
Sl
oven
ia
Pola
nd
Sp
ain
Russian Federation h h h h h h h h h h h h h h h h h h h h h h h h h
Hong Kong SAR h h h h h h h h h h h h h h h h h h h h h h h h h
Canada, Alberta h h h h h h h h h h h h h h h h h h h h h h h
Singapore h h h h h h h h h h h h h h h h h h h h h
Canada, British Columbia h h h h h h h h h h h h h h h h h h h h h
Luxembourg i i h h h h h h h h h h h h h h h h h h h h h h
Canada, Ontario i i h h h h h h h h h h h h h h h h h h h
Italy i i i h h h h h h h h h h h h h h h
Hungary i i i i h h h h h h h h h h h h h h h
Sweden i i i i i i h h h h h h h h h h h h h h h
Germany i i i i i i i h h h h h h h h h h h h h
Netherlands i i i i i i i h h h h h h h h h h h h h h
Belgium (Flemish) i i i i i i i h h h h h h h h h h h h h
Bulgaria i i i i i i h h h h h h h h h h
Denmark i i i i i i i h h h h h h h h h h h h
Canada, Nova Scotia i i i i i i i i i i i h h h h h h h h h
Latvia i i i i i i i i i i i i i h h h h h h h h
United States i i i i i i i i i i h h h h h h h
England i i i i i i i i i i i i i i h h h h h h h
Austria i i i i i i i i i i i i i i h h h h h h h
Lithuania i i i i i i i i i i i i i i i h h h h h h
Chinese Taipei i i i i i i i i i i i i i i i i h h h h h
Canada, Quebec i i i i i i i i i i i i i i i i i h h h h
New Zealand i i i i i i i i i i i i i i i i i i i i i h h h h
Slovak Republic i i i i i i i i i i i i i i i i i i i i h h h h
Scotland i i i i i i i i i i i i i i i i i i i i i i h h
France i i i i i i i i i i i i i i i i i i i i i i i i i h
Slovenia i i i i i i i i i i i i i i i i i i i i i i i i i h
Poland i i i i i i i i i i i i i i i i i i i i i i i i i i h
Spain i i i i i i i i i i i i i i i i i i i i i i i i i i i i i
Israel i i i i i i i i i i i i i i i i i i i i i i i i i i i i
Iceland i i i i i i i i i i i i i i i i i i i i i i i i i i i i i
Moldova, Rep. of i i i i i i i i i i i i i i i i i i i i i i i i i i i i i i
Belgium (French) i i i i i i i i i i i i i i i i i i i i i i i i i i i i i i
Norway i i i i i i i i i i i i i i i i i i i i i i i i i i i i i i
Romania i i i i i i i i i i i i i i i i i i i i i i i i i i i i i i
Georgia i i i i i i i i i i i i i i i i i i i i i i i i i i i i i i
Macedonia, Rep. of i i i i i i i i i i i i i i i i i i i i i i i i i i i i i i
Trinidad and Tobago i i i i i i i i i i i i i i i i i i i i i i i i i i i i i i
Iran, Islamic Rep. of i i i i i i i i i i i i i i i i i i i i i i i i i i i i i i
Indonesia i i i i i i i i i i i i i i i i i i i i i i i i i i i i i i
Qatar i i i i i i i i i i i i i i i i i i i i i i i i i i i i i i
Kuwait i i i i i i i i i i i i i i i i i i i i i i i i i i i i i i
Morocco i i i i i i i i i i i i i i i i i i i i i i i i i i i i i i
South Africa i i i i i i i i i i i i i i i i i i i i i i i i i i i i i i
Exhibit 1.2: Multiple Comparisons of Average Reading Achievement (Continued)
Instructions: Read across the row for a country to compare performance with the countries listed along the top of the chart. The symbols indicate whether the average achievement of the country in the row is significantly lower than that of the comparison country, significantly higher than that of the comparison country, or if there is no statistically significant difference between the average achievement of the two countries.
Isra
el
Note: 5% of these comparisons would be statistically significant by chance alone.
SOU
RCE:
IEA
Pro
gres
s in
Inte
rnat
iona
l Rea
ding
Lite
racy
Stu
dy (P
IRLS
) 200
6
Exhibit 1.2 Multiple Comparisons of Average Reading Achievement PIRLS 20064th Grade
41chapter 1: international student achievement in reading
Exhibit 1.2: Multiple Comparisons of Average Reading Achievement (Continued)
Instructions: Read across the row for a country to compare performance with the countries listed along the top of the chart. The symbols indicate whether the average achievement of the country in the row is significantly lower than that of the comparison country, significantly higher than that of the comparison country, or if there is no statistically significant difference between the average achievement of the two countries.
Isra
el
Icel
and
M
old
ova,
Rep
. of
Bel
gium
(Fre
nch
) N
orw
ay
Rom
ania
Geo
rgia
M
aced
onia
, Rep
. of
Trin
idad
an
d T
obag
o Ir
an, I
slam
ic R
ep. o
f In
don
esia
Q
atar
Ku
wai
t M
oroc
co
Sout
h A
fric
a Countries
h h h h h h h h h h h h h h h Russian Federation h h h h h h h h h h h h h h h Hong Kong SAR h h h h h h h h h h h h h h h Canada, Alberta h h h h h h h h h h h h h h h Singapore h h h h h h h h h h h h h h h Canada, British Columbia h h h h h h h h h h h h h h h Luxembourg h h h h h h h h h h h h h h h Canada, Ontario h h h h h h h h h h h h h h h Italy h h h h h h h h h h h h h h h Hungary h h h h h h h h h h h h h h h Sweden h h h h h h h h h h h h h h h Germany h h h h h h h h h h h h h h h Netherlands h h h h h h h h h h h h h h h Belgium (Flemish) h h h h h h h h h h h h h h h Bulgaria h h h h h h h h h h h h h h h Denmark h h h h h h h h h h h h h h h Canada, Nova Scotia h h h h h h h h h h h h h h h Latvia h h h h h h h h h h h h h h h United States h h h h h h h h h h h h h h h Englandh h h h h h h h h h h h h h h Austria h h h h h h h h h h h h h h h Lithuaniah h h h h h h h h h h h h h h Chinese Taipei h h h h h h h h h h h h h h h Canada, Quebec h h h h h h h h h h h h h h h New Zealand h h h h h h h h h h h h h h h Slovak Republic h h h h h h h h h h h h h h h Scotland h h h h h h h h h h h h h h h France h h h h h h h h h h h h h h h Slovenia
h h h h h h h h h h h h h h Poland h h h h h h h h h h h h h Spainh h h h h h h h h h h h h Israel h h h h h h h h h h h h h Iceland
i i h h h h h h h h h Moldova, Rep. of i i h h h h h h h h h Belgium (French) i i h h h h h h h h h Norway i i h h h h h h h h h Romania i i i i i i h h h h h h h h Georgia i i i i i i i h h h h h h Macedonia, Rep. of i i i i i i i h h h h h h Trinidad and Tobago i i i i i i i i i h h h h h Iran, Islamic Rep. of i i i i i i i i i i h h h h Indonesia i i i i i i i i i i i h h h Qatar i i i i i i i i i i i i h Kuwait i i i i i i i i i i i i h Morocco i i i i i i i i i i i i i i South Africa
Exhibit 1.2 Multiple Comparisons of Average Reading Achievement (Continued)
SOU
RCE:
IEA
Pro
gres
s in
Inte
rnat
iona
l Rea
ding
Lite
racy
Stu
dy (P
IRLS
) 200
6
PIRLS 20064th Grade
hAverage achievement significantly higher than comparison country
iAverage achievement significantly lower than comparison country
42 chapter 1: international student achievement in reading
a symbol indicates no significant difference in performance, and a circle with a triangle pointing down indicates significantly lower performance than the comparison country or Canadian province.
The results in Exhibit 1.2 help interpret the typically small differences in achievement among the PIRLS 2006 participants shown close to each other in Exhibit 1.1. The Russian Federation, Hong Kong SAR, and Singapore were the three top-performing countries, and fourth-grade students in the Canadian provinces of Alberta and British Colombia had similar average achievement. Considering the five participants with the highest achievement, the Russian Federation and Hong Kong SAR had significantly higher average achievement than all of the remaining participants except the other three in the top five, while the Canadian province of Alberta also performed similarly to Luxembourg and the province of Ontario. In turn, Singapore and the Canadian province of British Columbia showed no significant difference compared to two additional countries—Italy and Hungary. Luxembourg, the Canadian province of Ontario, Italy, and Hungary also performed very well. Luxembourg and the Canadian province of Ontario were outperformed only by the Russian Federation and Hong Kong SAR, Italy by those two and the Canadian province of Alberta, and Hungary also by Luxembourg. Next, although outperformed by the highest achieving countries and provinces, Sweden, Germany, the Netherlands, Belgium (Flemish), Bulgaria, and Denmark achieved at comparable levels, and had higher achievement than the majority of other participants.
Looking at the other end of the achievement continuum in Exhibit 1.2, the lowest performing countries were each, in turn, outperformed by one or two additional countries. That is, South Africa had lower achievement than all the other countries, while Kuwait and Morocco had higher achievement than South Africa (but no other countries). In turn, Qatar had higher achievement than the previous 3 countries, Indonesia than the previous 4 countries, Iran than the previous 5 countries, Trinidad and Tobago together with Macedonia than the previous 6 countries, and Georgia had higher achievement than the previous 8 countries. The next cluster of countries after Georgia all had similar achievement—Romania, Norway, Belgium (French), and Moldova.

43chapter 1: international student achievement in reading
Fourth-grade students in these four countries outperformed those in the previously mentioned nine lowest-performing countries, but had significantly lower average achievement than the rest of the participants.
How Has Achievement in Reading Comprehension Changed Between PIRLS 2001 and PIRLS 2006?
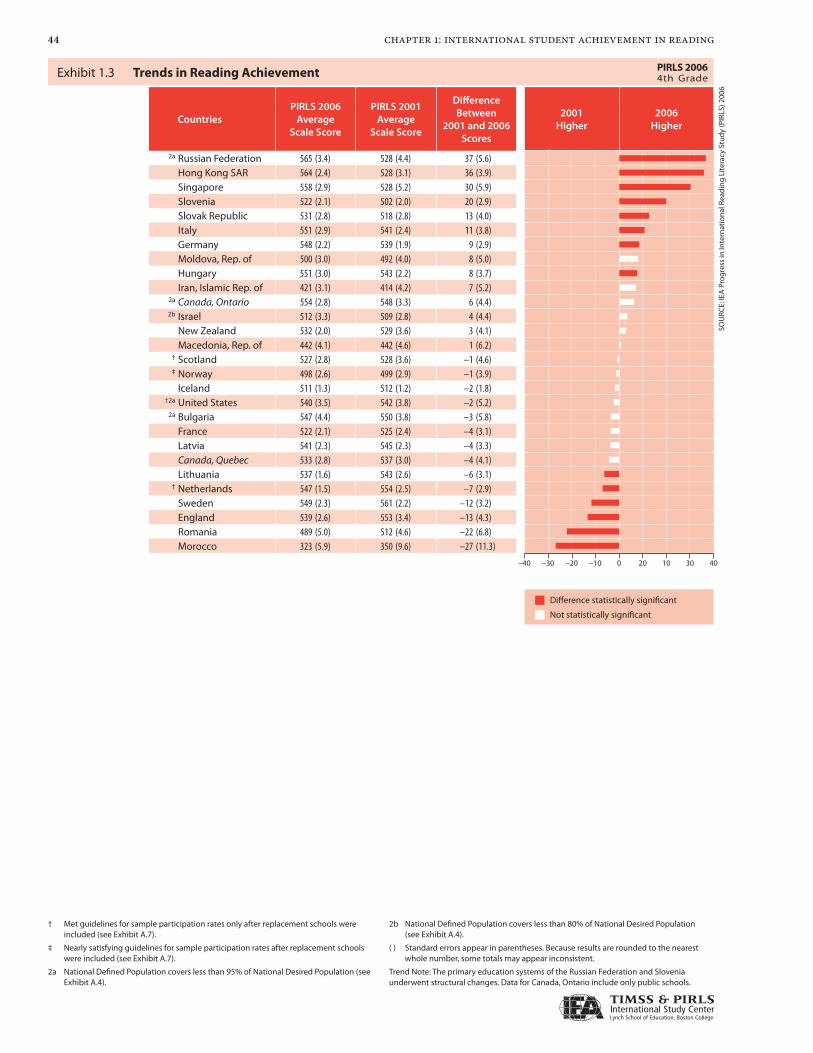
Exhibit 1.3 displays changes in average achievement between 2001 and 2006 for the 26 countries and 2 Canadian provinces that participated in both assessments.� The participants are shown in order of the most improvement to largest decline. A red bar indicates that the difference is statistically significant. The Russian Federation, Hong Kong SAR, Singapore, Slovenia, the Slovak Republic, Italy, Germany, and Hungary all showed significant gains in average reading achievement between 2001 and 2006. The gain in Moldova was not significant statistically due to a comparatively larger standard error, even though the increase (8 points) was comparable to that in Hungary. Countries with significant decreases in reading achievement since PIRLS 2001 were Lithuania, the Netherlands, Sweden, England, Romania, and Morocco. (As a trend note, for the Canadian province of Ontario, only public schools participated in PIRLS 2001. To be comparable to PIRLS 2001, the PIRLS 2006 data for Ontario used in the trend analyses included only public schools and differs slightly from Exhibit 1.1.)
It is interesting to consider the PIRLS 2006 achievement results in light of the information countries provided in the PIRLS 2006 Encyclopedia. For example, the trend results illustrate how PIRLS data can be used to monitor the impact of structural and curricular changes in education systems. Although the education systems in the PIRLS trend countries and provinces have been relatively stable in most respects between 2001 and 2006, several have undergone fundamental changes. Table A.8 in Appendix A documents the grades, average ages, and percentages of exclusions in 2001 and 2006 for the trend participants.
According to ongoing reforms described in the PIRLS 2006 Encyclopedia, improvement in the Russian Federation and Slovenia may have been anticipated. These two countries have been undergoing structural changes
� ForPIRLS2006,NewZealandandSingaporetestedontheSouthernHemispherescheduleofOctoberthroughDecember2005.ForPIRLS2001,theSouthernHemispheretestingwasscheduledaftertheNorthernHemisphere(insteadofbeforeit)inOctoberthroughDecemberof2001.Thus,thechangesforNewZealandandSingaporeareovera4-yearperiodratherthana5-yearperiod.
44 chapter 1: international student achievement in reading
Exhibit 1.3: Trends in Reading Achievement
CountriesPIRLS 2006
Average Scale Score
PIRLS 2001Average
Scale Score
Difference Between
2001 and 2006 Scores
2001Higher
2006Higher
2a Russian Federation 565 (3.4) 528 (4.4) 37 (5.6)Hong Kong SAR 564 (2.4) 528 (3.1) 36 (3.9)Singapore 558 (2.9) 528 (5.2) 30 (5.9)Slovenia 522 (2.1) 502 (2.0) 20 (2.9)Slovak Republic 531 (2.8) 518 (2.8) 13 (4.0)Italy 551 (2.9) 541 (2.4) 11 (3.8)Germany 548 (2.2) 539 (1.9) 9 (2.9)Moldova, Rep. of 500 (3.0) 492 (4.0) 8 (5.0)Hungary 551 (3.0) 543 (2.2) 8 (3.7)Iran, Islamic Rep. of 421 (3.1) 414 (4.2) 7 (5.2)
2a Canada, Ontario 554 (2.8) 548 (3.3) 6 (4.4)2b Israel 512 (3.3) 509 (2.8) 4 (4.4)
New Zealand 532 (2.0) 529 (3.6) 3 (4.1)Macedonia, Rep. of 442 (4.1) 442 (4.6) 1 (6.2)
† Scotland 527 (2.8) 528 (3.6) –1 (4.6)‡ Norway 498 (2.6) 499 (2.9) –1 (3.9)
Iceland 511 (1.3) 512 (1.2) –2 (1.8)†2a United States 540 (3.5) 542 (3.8) –2 (5.2)
2a Bulgaria 547 (4.4) 550 (3.8) –3 (5.8)France 522 (2.1) 525 (2.4) –4 (3.1)Latvia 541 (2.3) 545 (2.3) –4 (3.3)Canada, Quebec 533 (2.8) 537 (3.0) –4 (4.1)Lithuania 537 (1.6) 543 (2.6) –6 (3.1)
† Netherlands 547 (1.5) 554 (2.5) –7 (2.9)Sweden 549 (2.3) 561 (2.2) –12 (3.2)England 539 (2.6) 553 (3.4) –13 (4.3)Romania 489 (5.0) 512 (4.6) –22 (6.8)Morocco 323 (5.9) 350 (9.6) –27 (11.3)
† Met guidelines for sample participation rates only after replacement schools were included (see Exhibit A.7).
‡ Nearly satisfying guidelines for sample participation rates after replacement schools were included (see Exhibit A.7).
2a National Defined Population covers less than 95% of National Desired Population (see Exhibit A.4).
2b National Defined Population covers less than 80% of National Desired Population (see Exhibit A.4).
( ) Standard errors appear in parentheses. Because results are rounded to the nearest whole number, some totals may appear inconsistent.
Trend Note: The primary education systems of the Russian Federation and Slovenia underwent structural changes. Data for Canada, Ontario include only public schools.
SOU
RCE:
IEA
Pro
gres
s in
Inte
rnat
iona
l Rea
ding
Lite
racy
Stu
dy (P
IRLS
) 200
6
Exhibit 1.3 Trends in Reading Achievement PIRLS 20064th Grade
Difference statistically significant
Not statistically significant
–40 0–20 4010–30 –10 20 30
45chapter 1: international student achievement in reading
in their primary system that involve adding one more year of schooling at the primary level, as well as associated curricular and instructional reforms. In the Russian Federation, the primary level of the education system has been undergoing a transition from 3 years to 4 years of schooling. In PIRLS 2001, more than half of the Russian students were still in the 3-year system, whereas by 2006 the transition essentially was complete to the 4-year system. When the transition was conceived, the idea was to have students start school a year younger at age 6, but in actuality, parents are still sending their children to school at age 7. Thus, in 2006, about half of the students in the Russian Federation had an extra year of school, and the average age increased from 10.3 to 10.8. Slovenia is in the middle of a similar transition; so, in anticipation of this reform, they tested students in their third year of schooling in 2001. By 2006, about half of the students had attended school for 4 years. However, in Slovenia, students having attended school for 4 years started school younger, so the average age has not changed (9.8 to 9.9). According to the Slovenian chapter in the PIRLS 2006 Encyclopedia, one of the reasons for changing from an 8- to a 9-year elementary school system was to improve literacy.
In Hong Kong SAR, as described in the PIRLS 2006 Encyclopedia, curriculum reform since 2000 has involved the government doing extensive work to promote reading and enable all children to read with comprehension in both official languages of Chinese and English. In 2000, the Curriculum Development Council established clear reading goals for schools giving them the responsibility for promoting reading and building a culture of reading. The Curriculum Development Council gave schools the power to adjust the curriculum and schedule to meet the literacy needs of students, and suggested that teachers expand the range of teaching materials used in lessons. Schools ensure that students are given opportunities to develop reading fluency, and many have trained “Reading Mothers” to help students read stories. There also has been considerable community involvement. For example, the Reading Ambassador project has trained 2,500 parents, university students including prospective teachers, older secondary school students, and community leaders to read and share their perspectives with students in schools.
46 chapter 1: international student achievement in reading
According to the Singaporean chapter in the PIRLS 2006 Encyclopedia, Singapore implemented a new English language syllabus in 2001 that was significantly different from the previous one. Organized loosely around three areas: language for information, language for literary response and expression, and language for social interaction, the new syllabus focuses on language use through study of a wide range of text types. It is supported by new instructional materials, and learning outcomes specified in the syllabus give teachers more explicit information on teaching reading skills and strategies at various levels. During 2000 and 2001, nationwide training workshops were conducted to prepare all English language teachers to teach the new syllabus. Children in Singapore also have been exposed to more opportunities to learn English (the language of the test). The number of students whose predominant home language is English increased from 37 percent in 2001 to 42 percent in 2005. The 2-year Learning Support Programme provides early intervention and support for students who enter primary school with weak English language skills.
What Are the Gender Differences in Reading Achievement?
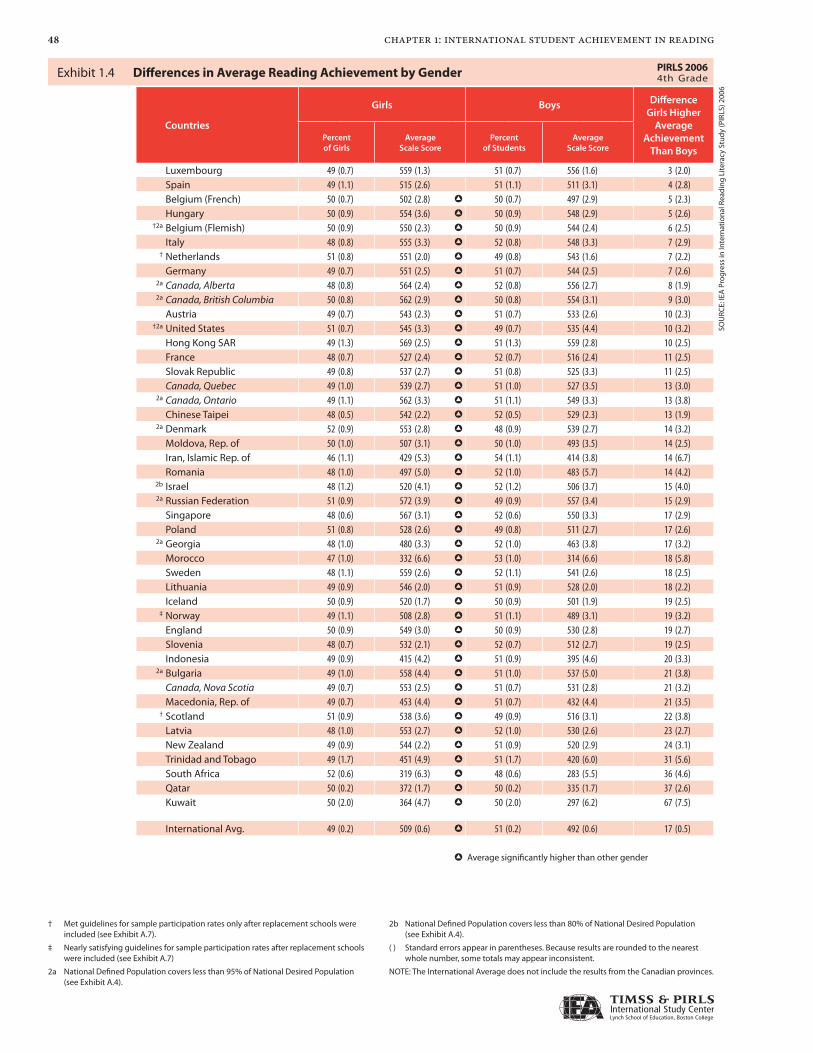
Exhibit 1.4 shows differences in fourth-grade students’ reading achievement between girls and boys. For each of the PIRLS 2006 participants, the percentage of girls and boys is shown with their respective average achievement. The countries and provinces are shown in increasing order of the gender difference. Because girls had higher average achievement than boys in every country and province, the ordering is according to the extent of the difference favoring girls from the least to the most difference (shown in the last column). Except in the two countries with the most equitable results, Luxembourg and Spain, the differences were statistically significant.
For the first time in this chapter, Exhibit 1.4 provides an “international average” based on averaging the results across countries. The five Canadian provinces were not included in the computations. As point of reference, the results were averaged separately for boys and for girls to examine the extent of the gender difference, on average internationally. On average internationally,
47chapter 1: international student achievement in reading
the average scale score for girls was 509 compared to that of 492 for boys, a difference of 17 scale score points on average.
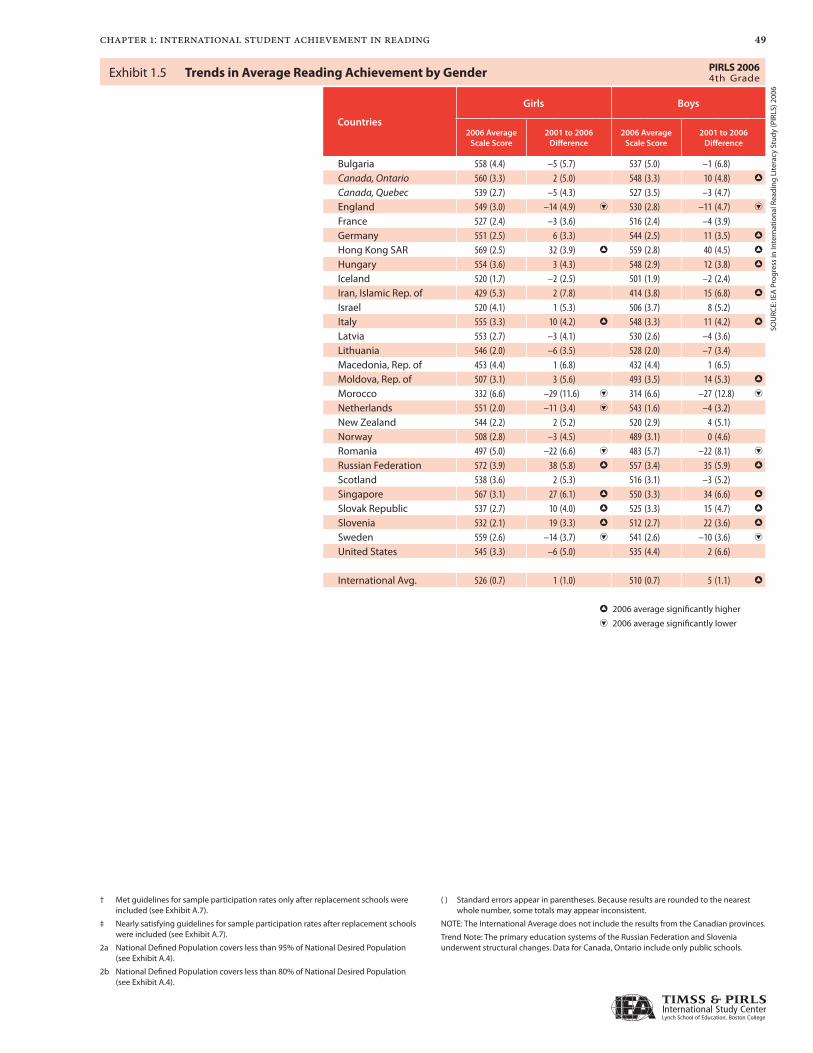
Exhibit 1.5 presents, in alphabetical order, changes in average reading achievement for girls and boys between PIRLS 2001 and PIRLS 2006. The changes for Hong Kong SAR, Italy, the Russian Federation, Singapore, the Slovak Republic, and Slovenia mirror their overall gains, with increases for both girls and boys. Interestingly, only boys showed improvement in Germany and Hungary (as well as in Moldova). The boys in the Canadian province of Ontario and Iran also showed improvement in average achievement between PIRLS 2001 and PIRLS 2006. For countries showing declines overall, both girls and boys showed decreases in achievement in England, Morocco, Romania, and Sweden. In the Netherlands, the decline overall seemed to be primarily attributable to the decrease in girls’ average reading achievement.
How Does Achievement Differ Across Countries for Reading Literacy Purposes?
In both PIRLS 2001 and 2006, the assessment framework included two overarching purposes for reading:
Reading for literary experience, and
Reading to acquire and use information.
The PIRLS 2006 assessment included five literary passages and five informational passages, so that half of the assessment time was devoted to each purpose. Comprehension processes were assessed within each purpose (see next section). The literary texts were fictional stories where students could engage with the events, characters’ actions and feelings, the setting, and ideas, as well as the language itself. The informational passages dealt with aspects of the real universe, and covered a variety of content and organizational structures. In addition to prose, each one involved some variety in format, by including features such as photographs, illustrations, text boxes, maps, and diagrams. More information about the passages can be found in Chapter 2, and two of the literary and informational passages are
▶
▶
48 chapter 1: international student achievement in reading
Exhibit 1.4: Differences in Average Reading Achievement by Gender
Countries
Girls Boys DifferenceGirls Higher
Average Achievement
Than BoysPercentof Girls
AverageScale Score
Percentof Students
AverageScale Score
Luxembourg 49 (0.7) 559 (1.3) 51 (0.7) 556 (1.6) 3 (2.0)Spain 49 (1.1) 515 (2.6) 51 (1.1) 511 (3.1) 4 (2.8)Belgium (French) 50 (0.7) 502 (2.8) h 50 (0.7) 497 (2.9) 5 (2.3)Hungary 50 (0.9) 554 (3.6) h 50 (0.9) 548 (2.9) 5 (2.6)
†2a Belgium (Flemish) 50 (0.9) 550 (2.3) h 50 (0.9) 544 (2.4) 6 (2.5)Italy 48 (0.8) 555 (3.3) h 52 (0.8) 548 (3.3) 7 (2.9)
† Netherlands 51 (0.8) 551 (2.0) h 49 (0.8) 543 (1.6) 7 (2.2)Germany 49 (0.7) 551 (2.5) h 51 (0.7) 544 (2.5) 7 (2.6)
2a Canada, Alberta 48 (0.8) 564 (2.4) h 52 (0.8) 556 (2.7) 8 (1.9)2a Canada, British Columbia 50 (0.8) 562 (2.9) h 50 (0.8) 554 (3.1) 9 (3.0)
Austria 49 (0.7) 543 (2.3) h 51 (0.7) 533 (2.6) 10 (2.3)†2a United States 51 (0.7) 545 (3.3) h 49 (0.7) 535 (4.4) 10 (3.2)
Hong Kong SAR 49 (1.3) 569 (2.5) h 51 (1.3) 559 (2.8) 10 (2.5)France 48 (0.7) 527 (2.4) h 52 (0.7) 516 (2.4) 11 (2.5)Slovak Republic 49 (0.8) 537 (2.7) h 51 (0.8) 525 (3.3) 11 (2.5)Canada, Quebec 49 (1.0) 539 (2.7) h 51 (1.0) 527 (3.5) 13 (3.0)
2a Canada, Ontario 49 (1.1) 562 (3.3) h 51 (1.1) 549 (3.3) 13 (3.8)Chinese Taipei 48 (0.5) 542 (2.2) h 52 (0.5) 529 (2.3) 13 (1.9)
2a Denmark 52 (0.9) 553 (2.8) h 48 (0.9) 539 (2.7) 14 (3.2)Moldova, Rep. of 50 (1.0) 507 (3.1) h 50 (1.0) 493 (3.5) 14 (2.5)Iran, Islamic Rep. of 46 (1.1) 429 (5.3) h 54 (1.1) 414 (3.8) 14 (6.7)Romania 48 (1.0) 497 (5.0) h 52 (1.0) 483 (5.7) 14 (4.2)
2b Israel 48 (1.2) 520 (4.1) h 52 (1.2) 506 (3.7) 15 (4.0)2a Russian Federation 51 (0.9) 572 (3.9) h 49 (0.9) 557 (3.4) 15 (2.9)
Singapore 48 (0.6) 567 (3.1) h 52 (0.6) 550 (3.3) 17 (2.9)Poland 51 (0.8) 528 (2.6) h 49 (0.8) 511 (2.7) 17 (2.6)
2a Georgia 48 (1.0) 480 (3.3) h 52 (1.0) 463 (3.8) 17 (3.2)Morocco 47 (1.0) 332 (6.6) h 53 (1.0) 314 (6.6) 18 (5.8)Sweden 48 (1.1) 559 (2.6) h 52 (1.1) 541 (2.6) 18 (2.5)Lithuania 49 (0.9) 546 (2.0) h 51 (0.9) 528 (2.0) 18 (2.2)Iceland 50 (0.9) 520 (1.7) h 50 (0.9) 501 (1.9) 19 (2.5)
‡ Norway 49 (1.1) 508 (2.8) h 51 (1.1) 489 (3.1) 19 (3.2)England 50 (0.9) 549 (3.0) h 50 (0.9) 530 (2.8) 19 (2.7)Slovenia 48 (0.7) 532 (2.1) h 52 (0.7) 512 (2.7) 19 (2.5)Indonesia 49 (0.9) 415 (4.2) h 51 (0.9) 395 (4.6) 20 (3.3)
2a Bulgaria 49 (1.0) 558 (4.4) h 51 (1.0) 537 (5.0) 21 (3.8)Canada, Nova Scotia 49 (0.7) 553 (2.5) h 51 (0.7) 531 (2.8) 21 (3.2)Macedonia, Rep. of 49 (0.7) 453 (4.4) h 51 (0.7) 432 (4.4) 21 (3.5)
† Scotland 51 (0.9) 538 (3.6) h 49 (0.9) 516 (3.1) 22 (3.8)Latvia 48 (1.0) 553 (2.7) h 52 (1.0) 530 (2.6) 23 (2.7)New Zealand 49 (0.9) 544 (2.2) h 51 (0.9) 520 (2.9) 24 (3.1)Trinidad and Tobago 49 (1.7) 451 (4.9) h 51 (1.7) 420 (6.0) 31 (5.6)South Africa 52 (0.6) 319 (6.3) h 48 (0.6) 283 (5.5) 36 (4.6)Qatar 50 (0.2) 372 (1.7) h 50 (0.2) 335 (1.7) 37 (2.6)Kuwait 50 (2.0) 364 (4.7) h 50 (2.0) 297 (6.2) 67 (7.5)
International Avg. 49 (0.2) 509 (0.6) h 51 (0.2) 492 (0.6) 17 (0.5)
h Average significantly higher than other gender
† Met guidelines for sample participation rates only after replacement schools were included (see Exhibit A.7).
‡ Nearly satisfying guidelines for sample participation rates after replacement schools were included (see Exhibit A.7)
2a National Defined Population covers less than 95% of National Desired Population (see Exhibit A.4).
2b National Defined Population covers less than 80% of National Desired Population (see Exhibit A.4).
( ) Standard errors appear in parentheses. Because results are rounded to the nearest whole number, some totals may appear inconsistent.
NOTE: The International Average does not include the results from the Canadian provinces.
SOU
RCE:
IEA
Pro
gres
s in
Inte
rnat
iona
l Rea
ding
Lite
racy
Stu
dy (P
IRLS
) 200
6
Exhibit 1.4 Differences in Average Reading Achievement by Gender PIRLS 20064th Grade
49chapter 1: international student achievement in reading
Exhibit 1.5: Trends in Average Reading Achievement by Gender
Countries
Girls Boys
2006 Average Scale Score
2001 to 2006 Difference
2006 Average Scale Score
2001 to 2006 Difference
Bulgaria 558 (4.4) –5 (5.7) 537 (5.0) –1 (6.8)Canada, Ontario 560 (3.3) 2 (5.0) 548 (3.3) 10 (4.8) h
Canada, Quebec 539 (2.7) –5 (4.3) 527 (3.5) –3 (4.7)England 549 (3.0) –14 (4.9) i 530 (2.8) –11 (4.7) i
France 527 (2.4) –3 (3.6) 516 (2.4) –4 (3.9)Germany 551 (2.5) 6 (3.3) 544 (2.5) 11 (3.5) h
Hong Kong SAR 569 (2.5) 32 (3.9) h 559 (2.8) 40 (4.5) h
Hungary 554 (3.6) 3 (4.3) 548 (2.9) 12 (3.8) h
Iceland 520 (1.7) –2 (2.5) 501 (1.9) –2 (2.4)Iran, Islamic Rep. of 429 (5.3) 2 (7.8) 414 (3.8) 15 (6.8) h
Israel 520 (4.1) 1 (5.3) 506 (3.7) 8 (5.2)Italy 555 (3.3) 10 (4.2) h 548 (3.3) 11 (4.2) h
Latvia 553 (2.7) –3 (4.1) 530 (2.6) –4 (3.6)Lithuania 546 (2.0) –6 (3.5) 528 (2.0) –7 (3.4)Macedonia, Rep. of 453 (4.4) 1 (6.8) 432 (4.4) 1 (6.5)Moldova, Rep. of 507 (3.1) 3 (5.6) 493 (3.5) 14 (5.3) h
Morocco 332 (6.6) –29 (11.6) i 314 (6.6) –27 (12.8) i
Netherlands 551 (2.0) –11 (3.4) i 543 (1.6) –4 (3.2)New Zealand 544 (2.2) 2 (5.2) 520 (2.9) 4 (5.1)Norway 508 (2.8) –3 (4.5) 489 (3.1) 0 (4.6)Romania 497 (5.0) –22 (6.6) i 483 (5.7) –22 (8.1) i
Russian Federation 572 (3.9) 38 (5.8) h 557 (3.4) 35 (5.9) h
Scotland 538 (3.6) 2 (5.3) 516 (3.1) –3 (5.2)Singapore 567 (3.1) 27 (6.1) h 550 (3.3) 34 (6.6) h
Slovak Republic 537 (2.7) 10 (4.0) h 525 (3.3) 15 (4.7) h
Slovenia 532 (2.1) 19 (3.3) h 512 (2.7) 22 (3.6) h
Sweden 559 (2.6) –14 (3.7) i 541 (2.6) –10 (3.6) i
United States 545 (3.3) –6 (5.0) 535 (4.4) 2 (6.6)
International Avg. 526 (0.7) 1 (1.0) 510 (0.7) 5 (1.1) h
h 2006 average significantly higher
i 2006 average significantly lower
† Met guidelines for sample participation rates only after replacement schools were included (see Exhibit A.7).
‡ Nearly satisfying guidelines for sample participation rates after replacement schools were included (see Exhibit A.7).
2a National Defined Population covers less than 95% of National Desired Population (see Exhibit A.4).
2b National Defined Population covers less than 80% of National Desired Population (see Exhibit A.4).
( ) Standard errors appear in parentheses. Because results are rounded to the nearest whole number, some totals may appear inconsistent.
NOTE: The International Average does not include the results from the Canadian provinces.
Trend Note: The primary education systems of the Russian Federation and Slovenia underwent structural changes. Data for Canada, Ontario include only public schools.
SOU
RCE:
IEA
Pro
gres
s in
Inte
rnat
iona
l Rea
ding
Lite
racy
Stu
dy (P
IRLS
) 200
6
Exhibit 1.5 Trends in Average Reading Achievement by Gender PIRLS 20064th Grade
50 chapter 1: international student achievement in reading
reproduced in the Appendix D and in the PIRLS 2006 Reader in the pocket at the end of this report.
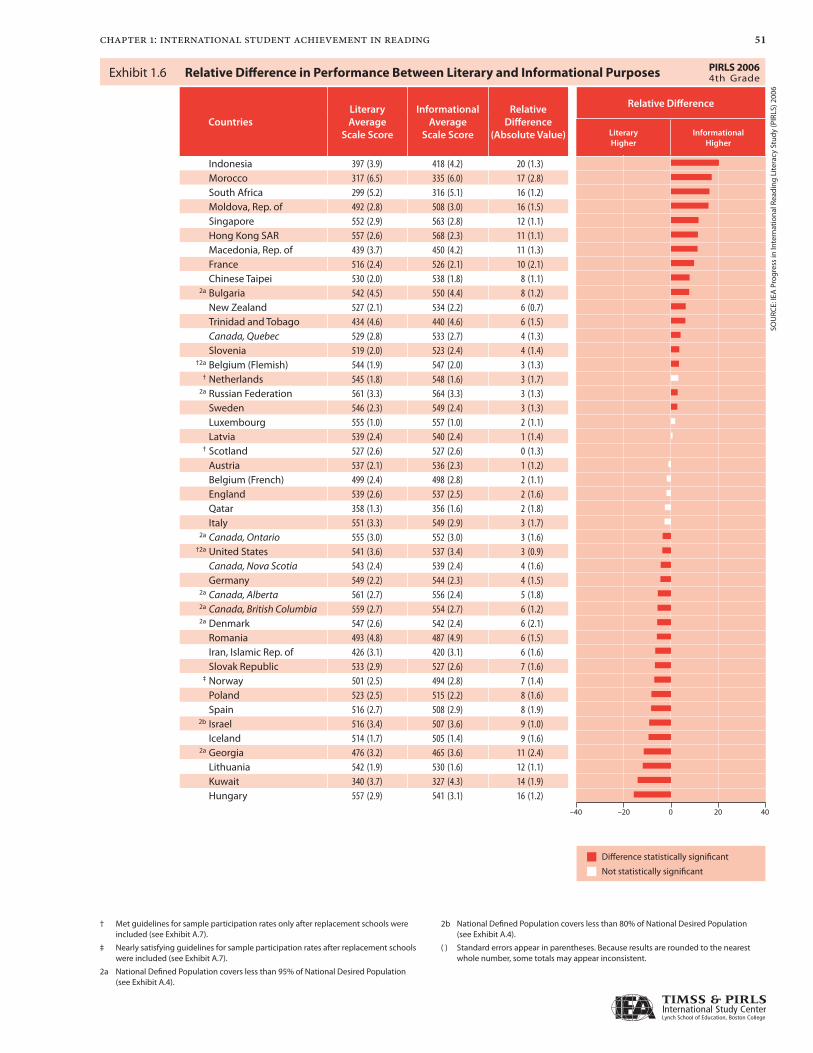
For each country and Canadian province, Exhibit 1.6 presents the average achievement for fourth-grade students in reading for literary purposes and in reading for informational purposes. The two numerical scale scores are not directly comparable, since they represent different constructs, and the assessments were of slightly different difficulties. As shown in Exhibit A.16 containing the average percent correct across the items on the PIRLS 2006 scales, on average internationally, the informational scale was slightly more difficult than the literary scale, 52 percent correct on average compared to 55 percent correct. This pattern held for most but not all of the PIRLS 2006 participants. However, to allow comparison of the relative performance of each PIRLS 2006 participant for each purpose, the international average for each purpose was scaled to be 500, the same as the overall PIRLS scale average. This makes it possible to examine relative strengths and weaknesses of countries by comparing the relative positions of the participants on the two scales. To assist in the relative comparisons, the graph displays the differences.
The first two columns in Exhibit 1.6 present the average achievement for the literary purpose and the average achievement for the informational purpose. Generally, the PIRLS 2006 participants with the highest achievement overall also had the highest achievement in both literary and informational reading. Exhibit B.1 for literary reading and Exhibit B.2 for informational reading, respectively, present the PIRLS 2006 participants in order of average achievement and show whether or not the differences in average achievement are statistically significant.
The results in Exhibit 1.6 reveal, however, that many countries performed relatively better or worse in one reading purpose compared to the other (the red bar indicates that the difference is statistically significant). The countries with relatively better performance in informational reading are shown in the upper portion of the exhibit, and those with relatively better performance in literary reading are shown in the lower portion. Except for a consistent pattern among countries where Chinese is one of the major languages (Singapore,
51chapter 1: international student achievement in reading
Exhibit 1.6: Relative Difference in Performance Between Literary and Informational Purposes
CountriesLiteraryAverage
Scale Score
InformationalAverage
Scale Score
Relative Difference
(Absolute Value)
Relative Difference
LiteraryHigher
InformationalHigher
Indonesia 397 (3.9) 418 (4.2) 20 (1.3)Morocco 317 (6.5) 335 (6.0) 17 (2.8)South Africa 299 (5.2) 316 (5.1) 16 (1.2)Moldova, Rep. of 492 (2.8) 508 (3.0) 16 (1.5)Singapore 552 (2.9) 563 (2.8) 12 (1.1)Hong Kong SAR 557 (2.6) 568 (2.3) 11 (1.1)Macedonia, Rep. of 439 (3.7) 450 (4.2) 11 (1.3)France 516 (2.4) 526 (2.1) 10 (2.1)Chinese Taipei 530 (2.0) 538 (1.8) 8 (1.1)
2a Bulgaria 542 (4.5) 550 (4.4) 8 (1.2)New Zealand 527 (2.1) 534 (2.2) 6 (0.7)Trinidad and Tobago 434 (4.6) 440 (4.6) 6 (1.5)Canada, Quebec 529 (2.8) 533 (2.7) 4 (1.3)Slovenia 519 (2.0) 523 (2.4) 4 (1.4)
†2a Belgium (Flemish) 544 (1.9) 547 (2.0) 3 (1.3)† Netherlands 545 (1.8) 548 (1.6) 3 (1.7)
2a Russian Federation 561 (3.3) 564 (3.3) 3 (1.3)Sweden 546 (2.3) 549 (2.4) 3 (1.3)Luxembourg 555 (1.0) 557 (1.0) 2 (1.1)Latvia 539 (2.4) 540 (2.4) 1 (1.4)
† Scotland 527 (2.6) 527 (2.6) 0 (1.3)Austria 537 (2.1) 536 (2.3) 1 (1.2)Belgium (French) 499 (2.4) 498 (2.8) 2 (1.1)England 539 (2.6) 537 (2.5) 2 (1.6)Qatar 358 (1.3) 356 (1.6) 2 (1.8)Italy 551 (3.3) 549 (2.9) 3 (1.7)
2a Canada, Ontario 555 (3.0) 552 (3.0) 3 (1.6)†2a United States 541 (3.6) 537 (3.4) 3 (0.9)
Canada, Nova Scotia 543 (2.4) 539 (2.4) 4 (1.6)Germany 549 (2.2) 544 (2.3) 4 (1.5)
2a Canada, Alberta 561 (2.7) 556 (2.4) 5 (1.8)2a Canada, British Columbia 559 (2.7) 554 (2.7) 6 (1.2)2a Denmark 547 (2.6) 542 (2.4) 6 (2.1)
Romania 493 (4.8) 487 (4.9) 6 (1.5)Iran, Islamic Rep. of 426 (3.1) 420 (3.1) 6 (1.6)Slovak Republic 533 (2.9) 527 (2.6) 7 (1.6)
‡ Norway 501 (2.5) 494 (2.8) 7 (1.4)Poland 523 (2.5) 515 (2.2) 8 (1.6)Spain 516 (2.7) 508 (2.9) 8 (1.9)
2b Israel 516 (3.4) 507 (3.6) 9 (1.0)Iceland 514 (1.7) 505 (1.4) 9 (1.6)
2a Georgia 476 (3.2) 465 (3.6) 11 (2.4)Lithuania 542 (1.9) 530 (1.6) 12 (1.1)Kuwait 340 (3.7) 327 (4.3) 14 (1.9)Hungary 557 (2.9) 541 (3.1) 16 (1.2)
† Met guidelines for sample participation rates only after replacement schools were included (see Exhibit A.7).
‡ Nearly satisfying guidelines for sample participation rates after replacement schools were included (see Exhibit A.7).
2a National Defined Population covers less than 95% of National Desired Population (see Exhibit A.4).
2b National Defined Population covers less than 80% of National Desired Population (see Exhibit A.4).
( ) Standard errors appear in parentheses. Because results are rounded to the nearest whole number, some totals may appear inconsistent.
SOU
RCE:
IEA
Pro
gres
s in
Inte
rnat
iona
l Rea
ding
Lite
racy
Stu
dy (P
IRLS
) 200
6
Exhibit 1.6 Relative Difference in Performance Between Literary and Informational Purposes PIRLS 20064th Grade
Difference statistically significant
Not statistically significant
–40 0–20 4020

52 chapter 1: international student achievement in reading
Hong Kong SAR, and Chinese Taipei), there is considerable diversity among the countries achieving relatively higher in informational reading. Similarly, there is considerable diversity among countries with a relative strength in literary reading, except perhaps for English-speaking North America (the United States as well as the English-speaking Canadian provinces), which achieved somewhat higher in literary reading.
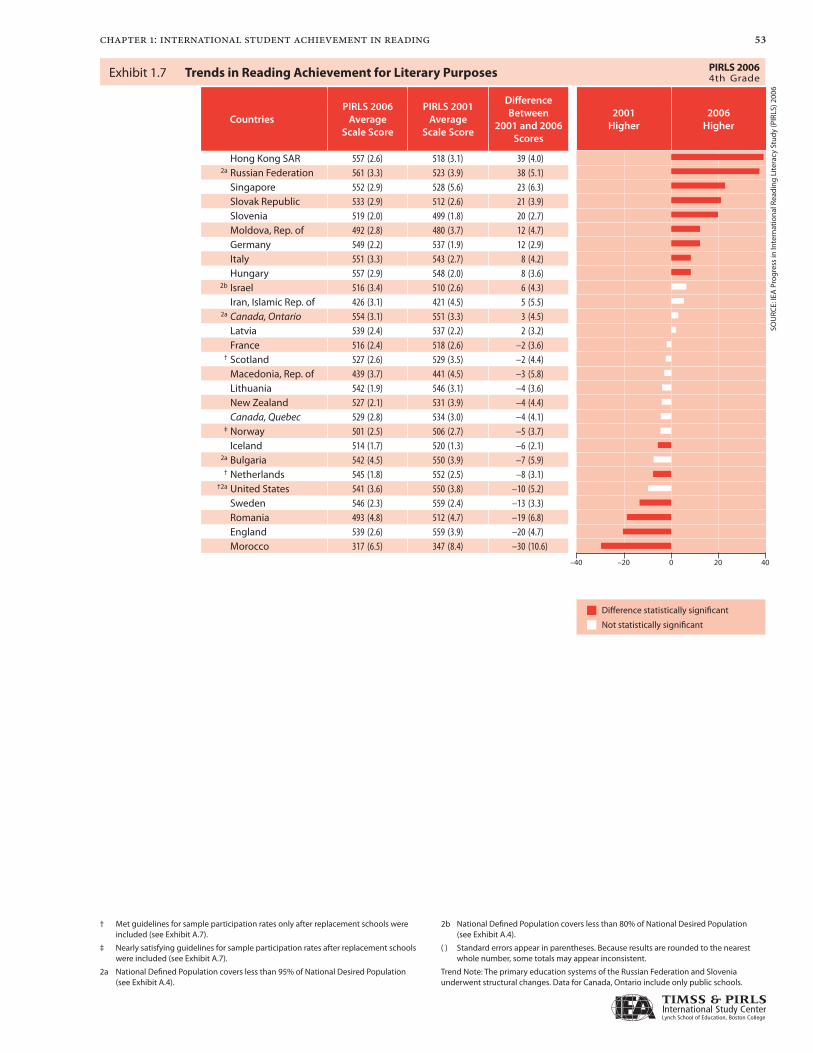
Exhibit 1.7 shows changes in average achievement in reading for the literary purpose. Again, the countries are shown according to the amount of their increase between PIRLS 2001 and PIRLS 2006 (with the bar colored if the change is statistically significant). Consistent with their improvement overall, Hong Kong SAR, the Russian Federation, Singapore, the Slovak Republic, Slovenia, Moldova, Germany, Italy, and Hungary all showed improvement in reading for literary purposes. Also, consistent with their overall decreases, Morocco, England, Romania, Sweden, and the Netherlands declined in average achievement. Iceland, which showed essentially no change overall, had a decrease in reading for literary purposes.
The changes in average achievement in reading for the informational purpose are presented in Exhibit 1.8. Similar to the results for reading for the literary purpose, many countries with improvement overall also improved in informational reading, including Singapore, the Russian Federation, Hong Kong SAR, Slovenia, Italy, and Germany. Interestingly, even though the Slovak Republic, Moldova, and Hungary improved in reading for the literary purpose, they showed little, if any, change in achievement in informational reading. Iran and the Canadian province of Ontario showed improvement in informational reading. (Also, New Zealand had a 9-point increase that did not meet the criteria used for statistical significance.) The decreases in Romania, Sweden, Lithuania, and England as well as in Morocco were consistent with their overall declines. Average achievement in informational reading also declined in Latvia and France. (The 7-point decrease in the Canadian province of Quebec was accompanied by a slightly larger standard error, so the difference was not statistically significant.)
53chapter 1: international student achievement in reading
Exhibit 1.7: Trends in Reading Achievement for Literary Purposes
CountriesPIRLS 2006
Average Scale Score
PIRLS 2001Average
Scale Score
Difference Between
2001 and 2006 Scores
2001Higher
2006Higher
Hong Kong SAR 557 (2.6) 518 (3.1) 39 (4.0)2a Russian Federation 561 (3.3) 523 (3.9) 38 (5.1)
Singapore 552 (2.9) 528 (5.6) 23 (6.3)Slovak Republic 533 (2.9) 512 (2.6) 21 (3.9)Slovenia 519 (2.0) 499 (1.8) 20 (2.7)Moldova, Rep. of 492 (2.8) 480 (3.7) 12 (4.7)Germany 549 (2.2) 537 (1.9) 12 (2.9)Italy 551 (3.3) 543 (2.7) 8 (4.2)Hungary 557 (2.9) 548 (2.0) 8 (3.6)
2b Israel 516 (3.4) 510 (2.6) 6 (4.3)Iran, Islamic Rep. of 426 (3.1) 421 (4.5) 5 (5.5)
2a Canada, Ontario 554 (3.1) 551 (3.3) 3 (4.5)Latvia 539 (2.4) 537 (2.2) 2 (3.2)France 516 (2.4) 518 (2.6) –2 (3.6)
† Scotland 527 (2.6) 529 (3.5) –2 (4.4)Macedonia, Rep. of 439 (3.7) 441 (4.5) –3 (5.8)Lithuania 542 (1.9) 546 (3.1) –4 (3.6)New Zealand 527 (2.1) 531 (3.9) –4 (4.4)Canada, Quebec 529 (2.8) 534 (3.0) –4 (4.1)
‡ Norway 501 (2.5) 506 (2.7) –5 (3.7)Iceland 514 (1.7) 520 (1.3) –6 (2.1)
2a Bulgaria 542 (4.5) 550 (3.9) –7 (5.9)† Netherlands 545 (1.8) 552 (2.5) –8 (3.1)
†2a United States 541 (3.6) 550 (3.8) –10 (5.2)Sweden 546 (2.3) 559 (2.4) –13 (3.3)Romania 493 (4.8) 512 (4.7) –19 (6.8)England 539 (2.6) 559 (3.9) –20 (4.7)Morocco 317 (6.5) 347 (8.4) –30 (10.6)
† Met guidelines for sample participation rates only after replacement schools were included (see Exhibit A.7).
‡ Nearly satisfying guidelines for sample participation rates after replacement schools were included (see Exhibit A.7).
2a National Defined Population covers less than 95% of National Desired Population (see Exhibit A.4).
2b National Defined Population covers less than 80% of National Desired Population (see Exhibit A.4).
( ) Standard errors appear in parentheses. Because results are rounded to the nearest whole number, some totals may appear inconsistent.
Trend Note: The primary education systems of the Russian Federation and Slovenia underwent structural changes. Data for Canada, Ontario include only public schools.
SOU
RCE:
IEA
Pro
gres
s in
Inte
rnat
iona
l Rea
ding
Lite
racy
Stu
dy (P
IRLS
) 200
6
Exhibit 1.7 Trends in Reading Achievement for Literary Purposes PIRLS 20064th Grade
Difference statistically significant
Not statistically significant
–40 0–20 4020

54 chapter 1: international student achievement in reading
Exhibit 1.8: Trends in Reading Achievement for Informational Purposes
CountriesPIRLS 2006
Average Scale Score
PIRLS 2001Average
Scale Score
Difference Between
2001 and 2006 Scores
2001Higher
2006Higher
Singapore 563 (2.8) 527 (4.8) 36 (5.6)2a Russian Federation 564 (3.3) 531 (4.3) 32 (5.5)
Hong Kong SAR 568 (2.3) 537 (2.9) 31 (3.7)Slovenia 523 (2.4) 503 (1.9) 20 (3.1)Italy 549 (2.9) 536 (2.4) 13 (3.8)Iran, Islamic Rep. of 420 (3.1) 408 (4.6) 11 (5.6)
2a Canada, Ontario 551 (3.1) 542 (3.2) 10 (4.4)New Zealand 534 (2.2) 525 (3.8) 9 (4.4)Germany 544 (2.3) 538 (1.9) 6 (3.0)Slovak Republic 527 (2.6) 522 (2.7) 5 (3.8)Macedonia, Rep. of 450 (4.2) 445 (5.2) 5 (6.7)Hungary 541 (3.1) 537 (2.2) 4 (3.8)
†2a United States 537 (3.4) 533 (3.7) 4 (5.0)Moldova, Rep. of 508 (3.0) 505 (4.7) 3 (5.6)
‡ Norway 494 (2.8) 492 (2.8) 2 (4.0)Iceland 505 (1.4) 504 (1.5) 1 (2.0)
2b Israel 507 (3.6) 507 (2.9) 1 (4.6)† Scotland 527 (2.6) 527 (3.6) 0 (4.4)
2a Bulgaria 550 (4.4) 551 (3.6) –1 (5.6)† Netherlands 548 (1.6) 553 (2.6) –5 (3.1)
Latvia 540 (2.4) 547 (2.3) –7 (3.3)France 526 (2.1) 533 (2.5) –7 (3.3)Canada, Quebec 533 (2.7) 541 (2.9) –7 (4.0)England 537 (2.5) 546 (3.6) –9 (4.4)Lithuania 530 (1.6) 540 (2.7) –10 (3.1)Sweden 549 (2.4) 559 (2.2) –10 (3.2)Morocco 335 (6.0) 358 (10.9) –24 (12.4)Romania 487 (4.9) 512 (4.6) –25 (6.8)
† Met guidelines for sample participation rates only after replacement schools were included (see Exhibit A.7).
‡ Nearly satisfying guidelines for sample participation rates after replacement schools were included (see Exhibit A.7).
2a National Defined Population covers less than 95% of National Desired Population (see Exhibit A.4).
2b National Defined Population covers less than 80% of National Desired Population (see Exhibit A.4).
( ) Standard errors appear in parentheses. Because results are rounded to the nearest whole number, some totals may appear inconsistent.
Trend Note: The primary education systems of the Russian Federation and Slovenia underwent structural changes. Data for Canada, Ontario include only public schools.
SOU
RCE:
IEA
Pro
gres
s in
Inte
rnat
iona
l Rea
ding
Lite
racy
Stu
dy (P
IRLS
) 200
6
Exhibit 1.8 Trends in Reading Achievement for Informational Purposes PIRLS 20064th Grade
Difference statistically significant
Not statistically significant
–40 0–20 4020

55chapter 1: international student achievement in reading
What Are the Gender Differences in Achievement for the Reading Purposes?
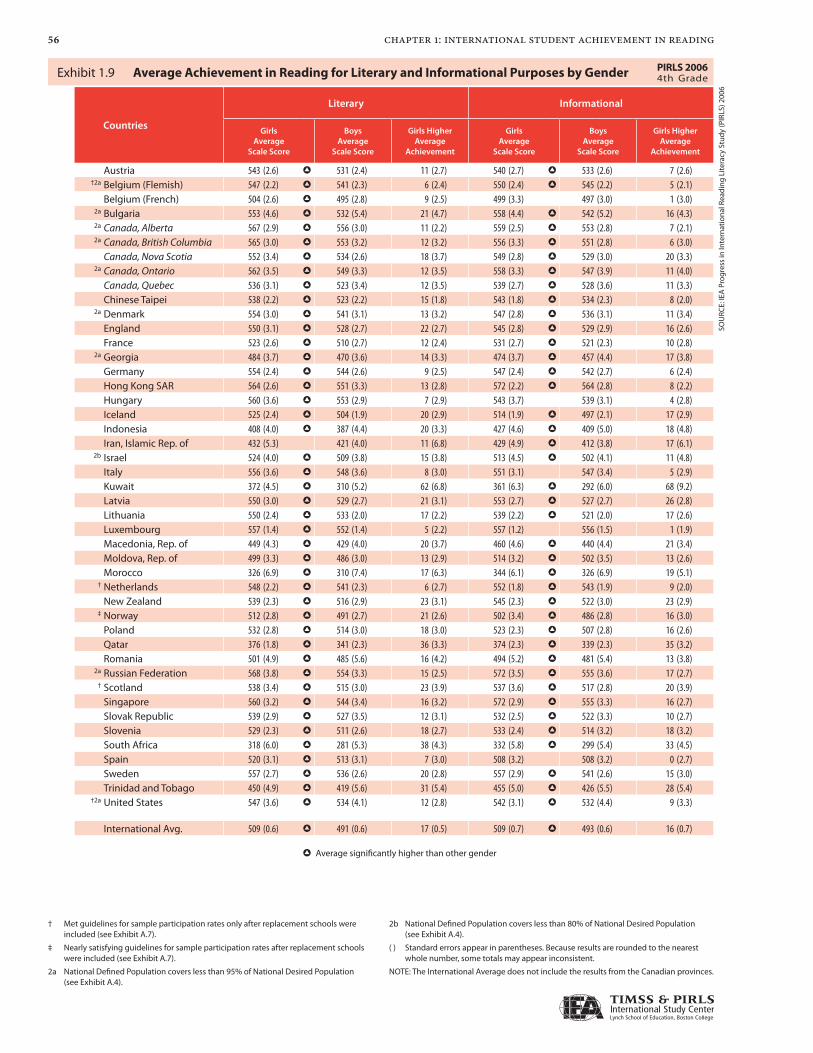
Exhibit 1.9 presents the PIRLS 2006 gender differences in average achievement for literary and informational reading. For the literary reading purpose, girls had significantly higher average achievement than boys in every participating entity (except Iran where the 11-point difference was not statistically significant). In contrast, some European countries had little if any gender difference in informational reading, including Belgium (French), Hungary, Italy, Luxembourg, and Spain.
To provide an international context for the differences, Exhibit 1.9 presents the international average for girls and boys for each of the purposes. The international average is the mean of the average scale score of the PIRLS 2006 countries, excluding the five Canadian provinces. Across all the participating countries (excluding the provinces), the average differences were similar for the two purposes—17 points for literary and 16 points for informational.
How Does Achievement Differ Across Countries for Reading Comprehension Processes?
Within reading for literary and informational purposes, the test questions or items were designed to measure four major processes of reading comprehension described in the framework. Briefly, the four major reading comprehension processes addressed by PIRLS 2006 are:
Focus on and retrieve explicitly stated information,
Make straightforward inferences,
Interpret and integrate ideas and information, and
Examine and evaluate content, language, and textual elements.
Given the number of items in the assessment, it was not possible to create four separate achievement scales for the reading processes. Based on research conducted by Germany5 and at the TIMSS & PIRLS International Study Center� examining PIRLS 2001, PIRLS 2006 was designed to support the
� Bos,W.,Lankes,E.M.,Prenzel,M.,Schwippert,K.,Walther,G.,&Valtin,R.(Hrsg.).(2003).Ergebnisse aus IGLU: Schülerleistungen am Ende der vierten Jahrgangsstufe im internationalen Vergleich.NewYork:Waxmann.
� Mullis,I.V.S.,Martin,M.O.,andGonzalez,E.J.(2004).PIRLS international achievement in the processes of reading comprehension: Results from PIRLS 2001 in 35 countries.ChestnutHill,MA:BostonCollege.
▶
▶
▶
▶
56 chapter 1: international student achievement in reading
Exhibit 1.9: Average Achievement in Reading for Literary and Informational Purposes by Gender
Countries
Literary Informational
GirlsAverage
Scale Score
BoysAverage
Scale Score
Girls Higher Average
Achievement
GirlsAverage
Scale Score
BoysAverage
Scale Score
Girls Higher Average
Achievement
Austria 543 (2.6) h 531 (2.4) 11 (2.7) 540 (2.7) h 533 (2.6) 7 (2.6)†2a Belgium (Flemish) 547 (2.2) h 541 (2.3) 6 (2.4) 550 (2.4) h 545 (2.2) 5 (2.1)
Belgium (French) 504 (2.6) h 495 (2.8) 9 (2.5) 499 (3.3) 497 (3.0) 1 (3.0)2a Bulgaria 553 (4.6) h 532 (5.4) 21 (4.7) 558 (4.4) h 542 (5.2) 16 (4.3)2a Canada, Alberta 567 (2.9) h 556 (3.0) 11 (2.2) 559 (2.5) h 553 (2.8) 7 (2.1)2a Canada, British Columbia 565 (3.0) h 553 (3.2) 12 (3.2) 556 (3.3) h 551 (2.8) 6 (3.0)
Canada, Nova Scotia 552 (3.4) h 534 (2.6) 18 (3.7) 549 (2.8) h 529 (3.0) 20 (3.3)2a Canada, Ontario 562 (3.5) h 549 (3.3) 12 (3.5) 558 (3.3) h 547 (3.9) 11 (4.0)
Canada, Quebec 536 (3.1) h 523 (3.4) 12 (3.5) 539 (2.7) h 528 (3.6) 11 (3.3)Chinese Taipei 538 (2.2) h 523 (2.2) 15 (1.8) 543 (1.8) h 534 (2.3) 8 (2.0)
2a Denmark 554 (3.0) h 541 (3.1) 13 (3.2) 547 (2.8) h 536 (3.1) 11 (3.4)England 550 (3.1) h 528 (2.7) 22 (2.7) 545 (2.8) h 529 (2.9) 16 (2.6)France 523 (2.6) h 510 (2.7) 12 (2.4) 531 (2.7) h 521 (2.3) 10 (2.8)
2a Georgia 484 (3.7) h 470 (3.6) 14 (3.3) 474 (3.7) h 457 (4.4) 17 (3.8)Germany 554 (2.4) h 544 (2.6) 9 (2.5) 547 (2.4) h 542 (2.7) 6 (2.4)Hong Kong SAR 564 (2.6) h 551 (3.3) 13 (2.8) 572 (2.2) h 564 (2.8) 8 (2.2)Hungary 560 (3.6) h 553 (2.9) 7 (2.9) 543 (3.7) 539 (3.1) 4 (2.8)Iceland 525 (2.4) h 504 (1.9) 20 (2.9) 514 (1.9) h 497 (2.1) 17 (2.9)Indonesia 408 (4.0) h 387 (4.4) 20 (3.3) 427 (4.6) h 409 (5.0) 18 (4.8)Iran, Islamic Rep. of 432 (5.3) 421 (4.0) 11 (6.8) 429 (4.9) h 412 (3.8) 17 (6.1)
2b Israel 524 (4.0) h 509 (3.8) 15 (3.8) 513 (4.5) h 502 (4.1) 11 (4.8)Italy 556 (3.6) h 548 (3.6) 8 (3.0) 551 (3.1) 547 (3.4) 5 (2.9)Kuwait 372 (4.5) h 310 (5.2) 62 (6.8) 361 (6.3) h 292 (6.0) 68 (9.2)Latvia 550 (3.0) h 529 (2.7) 21 (3.1) 553 (2.7) h 527 (2.7) 26 (2.8)Lithuania 550 (2.4) h 533 (2.0) 17 (2.2) 539 (2.2) h 521 (2.0) 17 (2.6)Luxembourg 557 (1.4) h 552 (1.4) 5 (2.2) 557 (1.2) 556 (1.5) 1 (1.9)Macedonia, Rep. of 449 (4.3) h 429 (4.0) 20 (3.7) 460 (4.6) h 440 (4.4) 21 (3.4)Moldova, Rep. of 499 (3.3) h 486 (3.0) 13 (2.9) 514 (3.2) h 502 (3.5) 13 (2.6)Morocco 326 (6.9) h 310 (7.4) 17 (6.3) 344 (6.1) h 326 (6.9) 19 (5.1)
† Netherlands 548 (2.2) h 541 (2.3) 6 (2.7) 552 (1.8) h 543 (1.9) 9 (2.0)New Zealand 539 (2.3) h 516 (2.9) 23 (3.1) 545 (2.3) h 522 (3.0) 23 (2.9)
‡ Norway 512 (2.8) h 491 (2.7) 21 (2.6) 502 (3.4) h 486 (2.8) 16 (3.0)Poland 532 (2.8) h 514 (3.0) 18 (3.0) 523 (2.3) h 507 (2.8) 16 (2.6)Qatar 376 (1.8) h 341 (2.3) 36 (3.3) 374 (2.3) h 339 (2.3) 35 (3.2)Romania 501 (4.9) h 485 (5.6) 16 (4.2) 494 (5.2) h 481 (5.4) 13 (3.8)
2a Russian Federation 568 (3.8) h 554 (3.3) 15 (2.5) 572 (3.5) h 555 (3.6) 17 (2.7)† Scotland 538 (3.4) h 515 (3.0) 23 (3.9) 537 (3.6) h 517 (2.8) 20 (3.9)
Singapore 560 (3.2) h 544 (3.4) 16 (3.2) 572 (2.9) h 555 (3.3) 16 (2.7)Slovak Republic 539 (2.9) h 527 (3.5) 12 (3.1) 532 (2.5) h 522 (3.3) 10 (2.7)Slovenia 529 (2.3) h 511 (2.6) 18 (2.7) 533 (2.4) h 514 (3.2) 18 (3.2)South Africa 318 (6.0) h 281 (5.3) 38 (4.3) 332 (5.8) h 299 (5.4) 33 (4.5)Spain 520 (3.1) h 513 (3.1) 7 (3.0) 508 (3.2) 508 (3.2) 0 (2.7)Sweden 557 (2.7) h 536 (2.6) 20 (2.8) 557 (2.9) h 541 (2.6) 15 (3.0)Trinidad and Tobago 450 (4.9) h 419 (5.6) 31 (5.4) 455 (5.0) h 426 (5.5) 28 (5.4)
†2a United States 547 (3.6) h 534 (4.1) 12 (2.8) 542 (3.1) h 532 (4.4) 9 (3.3)
International Avg. 509 (0.6) h 491 (0.6) 17 (0.5) 509 (0.7) h 493 (0.6) 16 (0.7)
h Average significantly higher than other gender
† Met guidelines for sample participation rates only after replacement schools were included (see Exhibit A.7).
‡ Nearly satisfying guidelines for sample participation rates after replacement schools were included (see Exhibit A.7).
2a National Defined Population covers less than 95% of National Desired Population (see Exhibit A.4).
2b National Defined Population covers less than 80% of National Desired Population (see Exhibit A.4).
( ) Standard errors appear in parentheses. Because results are rounded to the nearest whole number, some totals may appear inconsistent.
NOTE: The International Average does not include the results from the Canadian provinces.
SOU
RCE:
IEA
Pro
gres
s in
Inte
rnat
iona
l Rea
ding
Lite
racy
Stu
dy (P
IRLS
) 200
6
Exhibit 1.9 Average Achievement in Reading for Literary and Informational Purposes by Gender PIRLS 20064th Grade
57chapter 1: international student achievement in reading
creation of two reading achievement scales for the reading processes. One scale combines the retrieval and straightforward inferencing processes and is called the retrieving and straightforward inferencing scale. The second scale combines the interpreting and integrating processes with the examining and evaluating processes and is called the interpreting, integrating, and evaluating scale. This combination makes sense conceptually, because it combines the two text-based processes and the two processes that require more reasoning. It also works well analytically, because it allocates about half of the assessment items to each scale.
In the PIRLS 2006 Assessment Framework and Specifications, retrieving information was allocated 20 percent of the assessment and straightforward inferencing 30 percent. These two comprehension processes involve locating explicitly stated information, as well as filling in the “gaps” in information contained in the text. Straightforward inferences are very much text based. Although not explicitly stated in the text, the meaning remains relatively clear. Interpreting and integrating ideas and information was given a weight of 30 percent and examining and evaluating 20 percent. Interpreting and integrating ideas can be at a global level or require relating details and information in the text to an overall idea. Readers are making connections that are not only implicit, but that may be open to some interpretation based on their own perspective. Evaluation focuses on considering the text itself, including the author’s purpose, claims made in the text, and the structure and genre, as well as language conventions.
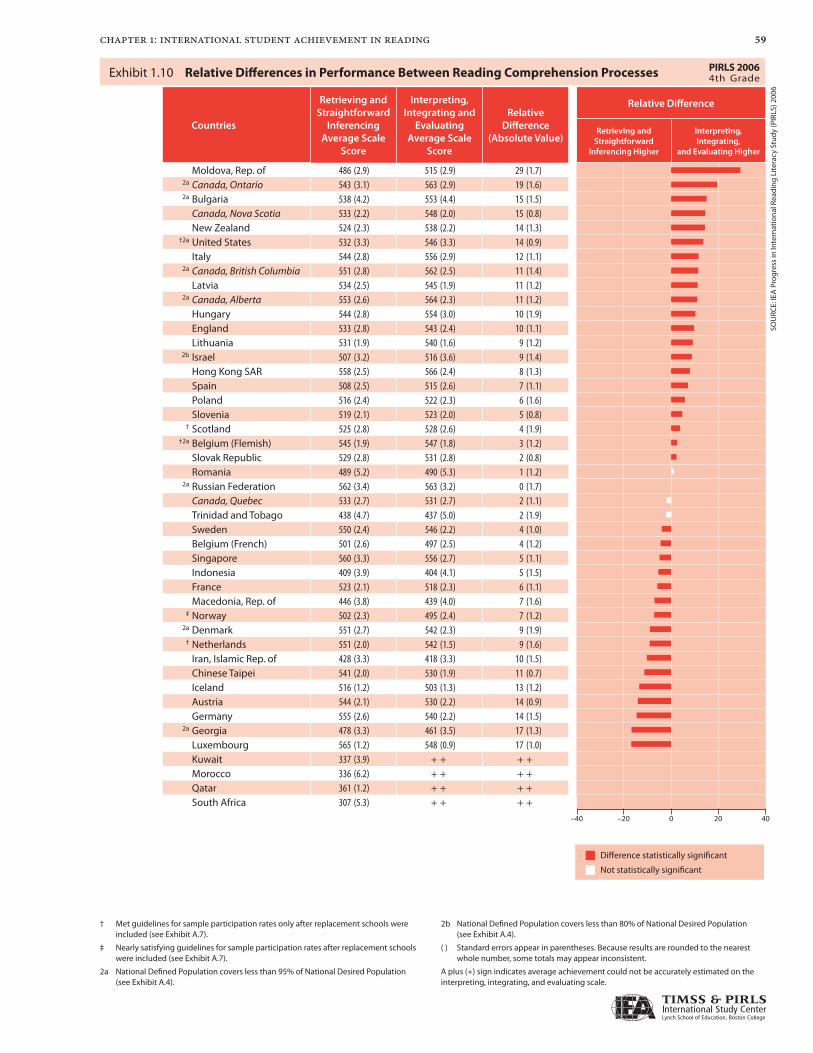
Exhibit 1.10 presents average achievement for the two achievement scales for the reading processes. Just as was the case with the scales for the reading purposes, the scales for the processes are not directly comparable, since they represent different constructs, and, as shown by average percent correct in Exhibit A.16, items on the interpreting, integrating, and evaluating scale were more difficult than those on the retrieving and straightforward inferencing scale. Internationally on average, for the retrieving and straightforward inferencing scale, the average percent correct was 64 percent. In contrast the average percent correct was 20 percentage points lower for the interpreting,
58 chapter 1: international student achievement in reading
integrating, and evaluating scale (44%). This pattern held to some degree for each of the PIRLS 2006 participants.
To allow for relative comparisons between the processes for the PIRLS 2006 participants, again just as was done for the purposes, the international average of each process was scaled to be 500 (the same as the overall PIRLS scale average). However, as can be seen in Exhibit A.16, the items in the interpreting, integrating, and evaluating scale were very difficult, less than 20 percent correct on average, for students in Kuwait, Morocco, Qatar, and South Africa. This low performance created a floor effect in the scaling process that made it difficult to obtain accurate achievement scale estimates for these countries (please see Appendix A for further information). Therefore, achievement results for the interpreting, integrating, and evaluating scale were not produced for these four countries.
As would be anticipated, the countries and Canadian provinces with high achievement overall tended to have the highest achievement in the reading processes (as they did in the reading purposes). Exhibits B.3 and B.4 provide the multiple-comparison information for the two achievement scales for the reading processes.
Exhibit 1.10 also displays the differences between average achievement in the retrieving and straightforward inferencing processes compared to the interpreting, integrating, and evaluating processes. There were some interesting results in relative performance, with about half the PIRLS 2006 participants performing relatively better in the reasoning processes, and most of the others performing relatively better in the text-based processes (the red bar indicates that the difference is statistically significant).
Countries and provinces with higher relative performance in the interpreting, integrating, and evaluating processes included Moldova, Bulgaria, New Zealand, the United States, Italy, Latvia, Hungary, England, Lithuania, Israel, Hong Kong SAR, Spain, Poland, Slovenia, Scotland, Belgium (Flemish), and the Slovak Republic as well as the Canadian provinces of Ontario, Nova Scotia, British Columbia, and Alberta. Interestingly, all of the participants with English as the predominant language had relatively higher
59chapter 1: international student achievement in reading
Exhibit 1.10: Relative Differences in Performance Between Reading Comprehension Processes
Countries
Retrieving and Straightforward
InferencingAverage Scale
Score
Interpreting, Integrating and
Evaluating Average Scale
Score
Relative Difference
(Absolute Value)
Relative Difference
Retrieving and Straightforward
Inferencing Higher
Interpreting, Integrating,
and Evaluating Higher
Moldova, Rep. of 486 (2.9) 515 (2.9) 29 (1.7)2a Canada, Ontario 543 (3.1) 563 (2.9) 19 (1.6)2a Bulgaria 538 (4.2) 553 (4.4) 15 (1.5)
Canada, Nova Scotia 533 (2.2) 548 (2.0) 15 (0.8)New Zealand 524 (2.3) 538 (2.2) 14 (1.3)
†2a United States 532 (3.3) 546 (3.3) 14 (0.9)Italy 544 (2.8) 556 (2.9) 12 (1.1)
2a Canada, British Columbia 551 (2.8) 562 (2.5) 11 (1.4)Latvia 534 (2.5) 545 (1.9) 11 (1.2)
2a Canada, Alberta 553 (2.6) 564 (2.3) 11 (1.2)Hungary 544 (2.8) 554 (3.0) 10 (1.9)England 533 (2.8) 543 (2.4) 10 (1.1)Lithuania 531 (1.9) 540 (1.6) 9 (1.2)
2b Israel 507 (3.2) 516 (3.6) 9 (1.4)Hong Kong SAR 558 (2.5) 566 (2.4) 8 (1.3)Spain 508 (2.5) 515 (2.6) 7 (1.1)Poland 516 (2.4) 522 (2.3) 6 (1.6)Slovenia 519 (2.1) 523 (2.0) 5 (0.8)
† Scotland 525 (2.8) 528 (2.6) 4 (1.9)†2a Belgium (Flemish) 545 (1.9) 547 (1.8) 3 (1.2)
Slovak Republic 529 (2.8) 531 (2.8) 2 (0.8)Romania 489 (5.2) 490 (5.3) 1 (1.2)
2a Russian Federation 562 (3.4) 563 (3.2) 0 (1.7)Canada, Quebec 533 (2.7) 531 (2.7) 2 (1.1)Trinidad and Tobago 438 (4.7) 437 (5.0) 2 (1.9)Sweden 550 (2.4) 546 (2.2) 4 (1.0)Belgium (French) 501 (2.6) 497 (2.5) 4 (1.2)Singapore 560 (3.3) 556 (2.7) 5 (1.1)Indonesia 409 (3.9) 404 (4.1) 5 (1.5)France 523 (2.1) 518 (2.3) 6 (1.1)Macedonia, Rep. of 446 (3.8) 439 (4.0) 7 (1.6)
‡ Norway 502 (2.3) 495 (2.4) 7 (1.2)2a Denmark 551 (2.7) 542 (2.3) 9 (1.9)
† Netherlands 551 (2.0) 542 (1.5) 9 (1.6)Iran, Islamic Rep. of 428 (3.3) 418 (3.3) 10 (1.5)Chinese Taipei 541 (2.0) 530 (1.9) 11 (0.7)Iceland 516 (1.2) 503 (1.3) 13 (1.2)Austria 544 (2.1) 530 (2.2) 14 (0.9)Germany 555 (2.6) 540 (2.2) 14 (1.5)
2a Georgia 478 (3.3) 461 (3.5) 17 (1.3)Luxembourg 565 (1.2) 548 (0.9) 17 (1.0)Kuwait 337 (3.9) + + + +Morocco 336 (6.2) + + + +Qatar 361 (1.2) + + + +South Africa 307 (5.3) + + + +
† Met guidelines for sample participation rates only after replacement schools were included (see Exhibit A.7).
‡ Nearly satisfying guidelines for sample participation rates after replacement schools were included (see Exhibit A.7).
2a National Defined Population covers less than 95% of National Desired Population (see Exhibit A.4).
2b National Defined Population covers less than 80% of National Desired Population (see Exhibit A.4).
( ) Standard errors appear in parentheses. Because results are rounded to the nearest whole number, some totals may appear inconsistent.
A plus (+) sign indicates average achievement could not be accurately estimated on the interpreting, integrating, and evaluating scale.
SOU
RCE:
IEA
Pro
gres
s in
Inte
rnat
iona
l Rea
ding
Lite
racy
Stu
dy (P
IRLS
) 200
6
Exhibit 1.10 Relative Differences in Performance Between Reading Comprehension Processes PIRLS 20064th Grade
Difference statistically significant
Not statistically significant
–40 0–20 4020
60 chapter 1: international student achievement in reading
achievement in the reasoning processes than in the text-based processes. Countries with higher relative performance in retrieving and straightforward inferencing processes included Luxembourg, Georgia, Germany, Austria, Iceland, Chinese Taipei, Iran, the Netherlands, Denmark, Norway, Macedonia, France, Indonesia, Singapore, Belgium (French), and Sweden. This set of countries included the German- and French-speaking countries (except the Canadian province of Quebec) as well as the Scandinavian countries.
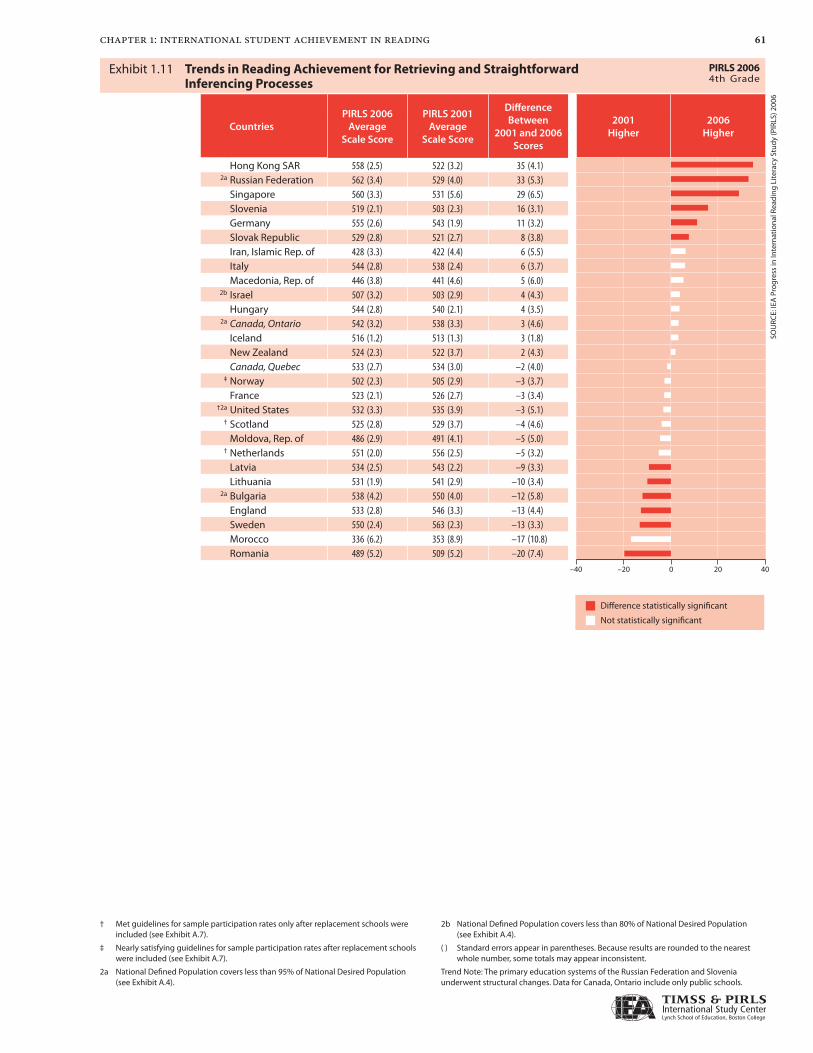
Exhibit 1.11 presents changes between PIRLS 2001 and PIRLS 2006 in average achievement for the retrieving and straightforward inferencing processes. Many, but not all, of the countries with improved achievement overall also showed improvement in retrieving and straightforward inferencing (red bar), including Hong Kong SAR, the Russian Federation, Singapore, Slovenia, Germany, and the Slovak Republic. Also, almost all of the countries showing declines overall (except the Netherlands) also had decreases in these text-based comprehension processes, including Romania, Morocco (large but not significant), Sweden, England, and Lithuania. In addition, Bulgaria and Latvia had decreases in average achievement in retrieving and straightforward inferencing.
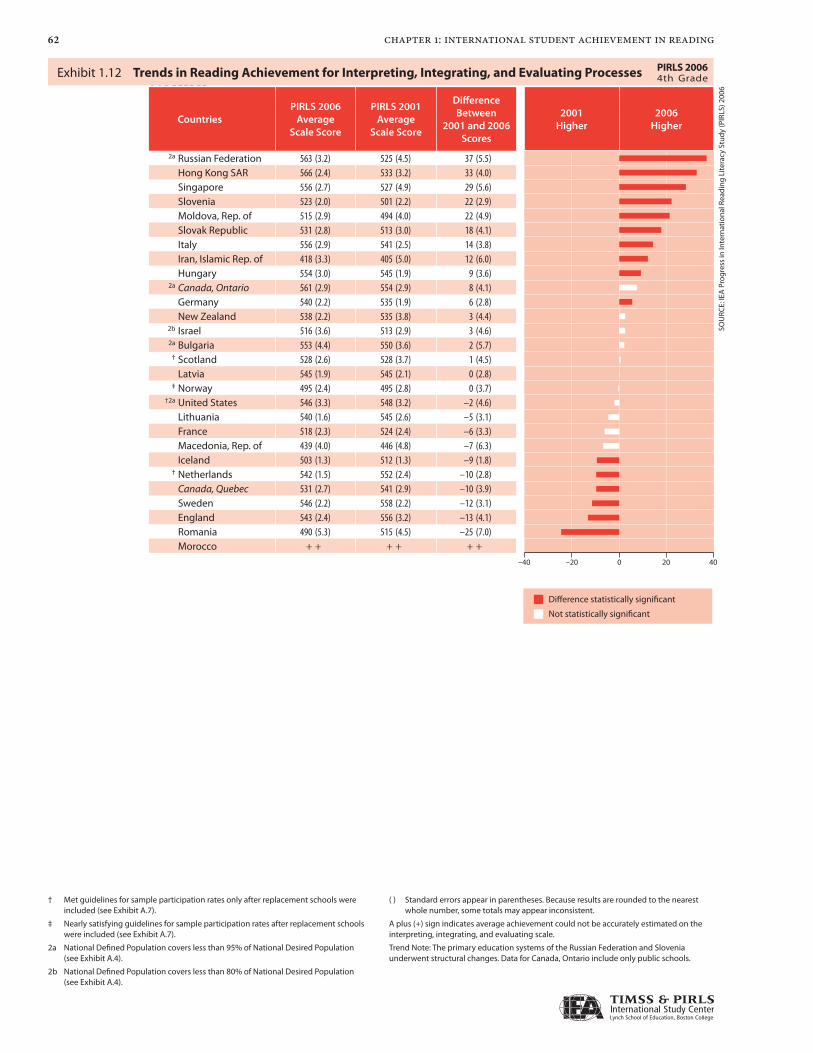
Exhibit 1.12 presents changes in average achievement between PIRLS 2001 and PIRLS 2006 for the interpreting, integrating, and evaluating processes. The same countries that showed improvement overall, also had higher average achievement in 2006 in interpreting, integrating, and evaluating—the Russian Federation, Hong Kong SAR, Singapore, Slovenia, Moldova, the Slovak Republic, Italy, Hungary, and Germany. In addition, Iran improved in the interpreting, integrating, and evaluating processes. (The 8-point increase in the Canadian province of Ontario was not statistically significant.) Many of the countries that had declines overall also had decreases in average achievement in interpreting, integrating, and evaluating, including Romania, England, Sweden, and the Netherlands. In addition, the Canadian province of Quebec and Iceland declined in this area.
61chapter 1: international student achievement in reading
Exhibit 1.11: Trends in Reading Achievement for Retrieving and Straightforward Inferencing Processes
CountriesPIRLS 2006
Average Scale Score
PIRLS 2001Average
Scale Score
Difference Between
2001 and 2006 Scores
2001Higher
2006Higher
Hong Kong SAR 558 (2.5) 522 (3.2) 35 (4.1)2a Russian Federation 562 (3.4) 529 (4.0) 33 (5.3)
Singapore 560 (3.3) 531 (5.6) 29 (6.5)Slovenia 519 (2.1) 503 (2.3) 16 (3.1)Germany 555 (2.6) 543 (1.9) 11 (3.2)Slovak Republic 529 (2.8) 521 (2.7) 8 (3.8)Iran, Islamic Rep. of 428 (3.3) 422 (4.4) 6 (5.5)Italy 544 (2.8) 538 (2.4) 6 (3.7)Macedonia, Rep. of 446 (3.8) 441 (4.6) 5 (6.0)
2b Israel 507 (3.2) 503 (2.9) 4 (4.3)Hungary 544 (2.8) 540 (2.1) 4 (3.5)
2a Canada, Ontario 542 (3.2) 538 (3.3) 3 (4.6)Iceland 516 (1.2) 513 (1.3) 3 (1.8)New Zealand 524 (2.3) 522 (3.7) 2 (4.3)Canada, Quebec 533 (2.7) 534 (3.0) –2 (4.0)
‡ Norway 502 (2.3) 505 (2.9) –3 (3.7)France 523 (2.1) 526 (2.7) –3 (3.4)
†2a United States 532 (3.3) 535 (3.9) –3 (5.1)† Scotland 525 (2.8) 529 (3.7) –4 (4.6)
Moldova, Rep. of 486 (2.9) 491 (4.1) –5 (5.0)† Netherlands 551 (2.0) 556 (2.5) –5 (3.2)
Latvia 534 (2.5) 543 (2.2) –9 (3.3)Lithuania 531 (1.9) 541 (2.9) –10 (3.4)
2a Bulgaria 538 (4.2) 550 (4.0) –12 (5.8)England 533 (2.8) 546 (3.3) –13 (4.4)Sweden 550 (2.4) 563 (2.3) –13 (3.3)Morocco 336 (6.2) 353 (8.9) –17 (10.8)Romania 489 (5.2) 509 (5.2) –20 (7.4)
† Met guidelines for sample participation rates only after replacement schools were included (see Exhibit A.7).
‡ Nearly satisfying guidelines for sample participation rates after replacement schools were included (see Exhibit A.7).
2a National Defined Population covers less than 95% of National Desired Population (see Exhibit A.4).
2b National Defined Population covers less than 80% of National Desired Population (see Exhibit A.4).
( ) Standard errors appear in parentheses. Because results are rounded to the nearest whole number, some totals may appear inconsistent.
Trend Note: The primary education systems of the Russian Federation and Slovenia underwent structural changes. Data for Canada, Ontario include only public schools.
SOU
RCE:
IEA
Pro
gres
s in
Inte
rnat
iona
l Rea
ding
Lite
racy
Stu
dy (P
IRLS
) 200
6
Exhibit 1.11 Trends in Reading Achievement for Retrieving and Straightforward Inferencing Processes
PIRLS 20064th Grade
Difference statistically significant
Not statistically significant
–40 0–20 4020
62 chapter 1: international student achievement in reading
Exhibit 1.12: Trends in Reading Achievement for Interpreting, Integrating, and Evaluating Processes
CountriesPIRLS 2006
Average Scale Score
PIRLS 2001Average
Scale Score
Difference Between
2001 and 2006 Scores
2001Higher
2006Higher
2a Russian Federation 563 (3.2) 525 (4.5) 37 (5.5)Hong Kong SAR 566 (2.4) 533 (3.2) 33 (4.0)Singapore 556 (2.7) 527 (4.9) 29 (5.6)Slovenia 523 (2.0) 501 (2.2) 22 (2.9)Moldova, Rep. of 515 (2.9) 494 (4.0) 22 (4.9)Slovak Republic 531 (2.8) 513 (3.0) 18 (4.1)Italy 556 (2.9) 541 (2.5) 14 (3.8)Iran, Islamic Rep. of 418 (3.3) 405 (5.0) 12 (6.0)Hungary 554 (3.0) 545 (1.9) 9 (3.6)
2a Canada, Ontario 561 (2.9) 554 (2.9) 8 (4.1)Germany 540 (2.2) 535 (1.9) 6 (2.8)New Zealand 538 (2.2) 535 (3.8) 3 (4.4)
2b Israel 516 (3.6) 513 (2.9) 3 (4.6)2a Bulgaria 553 (4.4) 550 (3.6) 2 (5.7)
† Scotland 528 (2.6) 528 (3.7) 1 (4.5)Latvia 545 (1.9) 545 (2.1) 0 (2.8)
‡ Norway 495 (2.4) 495 (2.8) 0 (3.7)†2a United States 546 (3.3) 548 (3.2) –2 (4.6)
Lithuania 540 (1.6) 545 (2.6) –5 (3.1)France 518 (2.3) 524 (2.4) –6 (3.3)Macedonia, Rep. of 439 (4.0) 446 (4.8) –7 (6.3)Iceland 503 (1.3) 512 (1.3) –9 (1.8)
† Netherlands 542 (1.5) 552 (2.4) –10 (2.8)Canada, Quebec 531 (2.7) 541 (2.9) –10 (3.9)Sweden 546 (2.2) 558 (2.2) –12 (3.1)England 543 (2.4) 556 (3.2) –13 (4.1)Romania 490 (5.3) 515 (4.5) –25 (7.0)Morocco + + + + + +
† Met guidelines for sample participation rates only after replacement schools were included (see Exhibit A.7).
‡ Nearly satisfying guidelines for sample participation rates after replacement schools were included (see Exhibit A.7).
2a National Defined Population covers less than 95% of National Desired Population (see Exhibit A.4).
2b National Defined Population covers less than 80% of National Desired Population (see Exhibit A.4).
( ) Standard errors appear in parentheses. Because results are rounded to the nearest whole number, some totals may appear inconsistent.
A plus (+) sign indicates average achievement could not be accurately estimated on the interpreting, integrating, and evaluating scale.
Trend Note: The primary education systems of the Russian Federation and Slovenia underwent structural changes. Data for Canada, Ontario include only public schools.
SOU
RCE:
IEA
Pro
gres
s in
Inte
rnat
iona
l Rea
ding
Lite
racy
Stu
dy (P
IRLS
) 200
6
Exhibit 1.12 Trends in Reading Achievement for Interpreting, Integrating, and Evaluating Processes PIRLS 20064th Grade
Difference statistically significant
Not statistically significant
–40 0–20 4020
63chapter 1: international student achievement in reading
What Are the Gender Differences in Achievement for the Reading Processes?
Exhibit 1.13 shows (in alphabetical order) average achievement for girls and boys for the retrieval and straightforward inferencing processes and the interpreting, integrating, and evaluating processes. Mirroring the results overall and for the literary and informational purposes, girls typically had higher achievement than boys. Notably, several countries did not have statistically significant differences for the text-based processes, including, Hungary, Iran, Italy, Luxembourg, the Netherlands, and Spain. However, in the remaining countries and provinces, girls had significantly higher average achievement than boys. For interpreting, integrating, and evaluating, girls had higher achievement than boys in all the participating countries and provinces except Hungary and Iran.
To indicate the pattern internationally, Exhibit 1.13 provides the international average for girls and boys for the two processes, based on the average achievement across the PIRLS 2006 countries, excluding the five Canadian provinces. On average, the advantage for girls was 15 points for the retrieving and straightforward inferencing processes, compared to 17 points for interpreting, integrating, and evaluating.
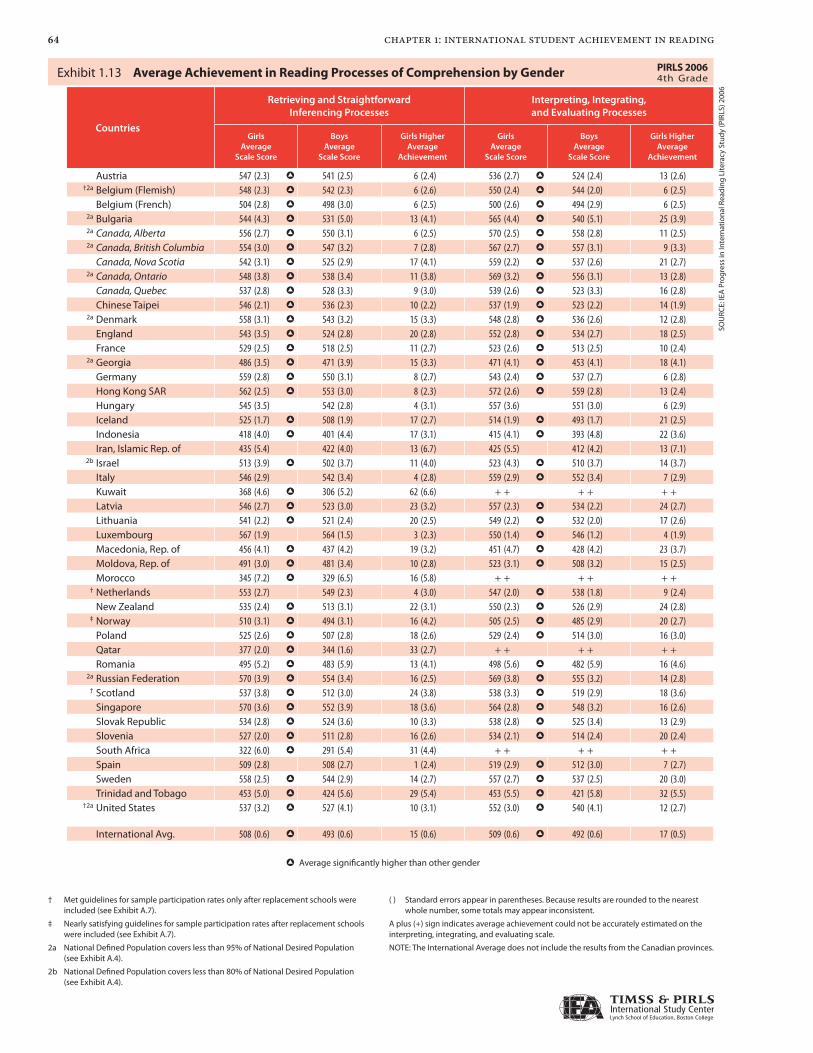
64 chapter 1: international student achievement in reading
Exhibit 1.13: Average Achievement in Reading Processes of Comprehension by Gender
Countries
Retrieving and Straightforward Inferencing Processes
Interpreting, Integrating, and Evaluating Processes
GirlsAverage
Scale Score
BoysAverage
Scale Score
Girls Higher Average
Achievement
GirlsAverage
Scale Score
BoysAverage
Scale Score
Girls Higher Average
Achievement
Austria 547 (2.3) h 541 (2.5) 6 (2.4) 536 (2.7) h 524 (2.4) 13 (2.6)†2a Belgium (Flemish) 548 (2.3) h 542 (2.3) 6 (2.6) 550 (2.4) h 544 (2.0) 6 (2.5)
Belgium (French) 504 (2.8) h 498 (3.0) 6 (2.5) 500 (2.6) h 494 (2.9) 6 (2.5)2a Bulgaria 544 (4.3) h 531 (5.0) 13 (4.1) 565 (4.4) h 540 (5.1) 25 (3.9)2a Canada, Alberta 556 (2.7) h 550 (3.1) 6 (2.5) 570 (2.5) h 558 (2.8) 11 (2.5)2a Canada, British Columbia 554 (3.0) h 547 (3.2) 7 (2.8) 567 (2.7) h 557 (3.1) 9 (3.3)
Canada, Nova Scotia 542 (3.1) h 525 (2.9) 17 (4.1) 559 (2.2) h 537 (2.6) 21 (2.7)2a Canada, Ontario 548 (3.8) h 538 (3.4) 11 (3.8) 569 (3.2) h 556 (3.1) 13 (2.8)
Canada, Quebec 537 (2.8) h 528 (3.3) 9 (3.0) 539 (2.6) h 523 (3.3) 16 (2.8)Chinese Taipei 546 (2.1) h 536 (2.3) 10 (2.2) 537 (1.9) h 523 (2.2) 14 (1.9)
2a Denmark 558 (3.1) h 543 (3.2) 15 (3.3) 548 (2.8) h 536 (2.6) 12 (2.8)England 543 (3.5) h 524 (2.8) 20 (2.8) 552 (2.8) h 534 (2.7) 18 (2.5)France 529 (2.5) h 518 (2.5) 11 (2.7) 523 (2.6) h 513 (2.5) 10 (2.4)
2a Georgia 486 (3.5) h 471 (3.9) 15 (3.3) 471 (4.1) h 453 (4.1) 18 (4.1)Germany 559 (2.8) h 550 (3.1) 8 (2.7) 543 (2.4) h 537 (2.7) 6 (2.8)Hong Kong SAR 562 (2.5) h 553 (3.0) 8 (2.3) 572 (2.6) h 559 (2.8) 13 (2.4)Hungary 545 (3.5) 542 (2.8) 4 (3.1) 557 (3.6) 551 (3.0) 6 (2.9)Iceland 525 (1.7) h 508 (1.9) 17 (2.7) 514 (1.9) h 493 (1.7) 21 (2.5)Indonesia 418 (4.0) h 401 (4.4) 17 (3.1) 415 (4.1) h 393 (4.8) 22 (3.6)Iran, Islamic Rep. of 435 (5.4) 422 (4.0) 13 (6.7) 425 (5.5) 412 (4.2) 13 (7.1)
2b Israel 513 (3.9) h 502 (3.7) 11 (4.0) 523 (4.3) h 510 (3.7) 14 (3.7)Italy 546 (2.9) 542 (3.4) 4 (2.8) 559 (2.9) h 552 (3.4) 7 (2.9)Kuwait 368 (4.6) h 306 (5.2) 62 (6.6) + + + + + +Latvia 546 (2.7) h 523 (3.0) 23 (3.2) 557 (2.3) h 534 (2.2) 24 (2.7)Lithuania 541 (2.2) h 521 (2.4) 20 (2.5) 549 (2.2) h 532 (2.0) 17 (2.6)Luxembourg 567 (1.9) 564 (1.5) 3 (2.3) 550 (1.4) h 546 (1.2) 4 (1.9)Macedonia, Rep. of 456 (4.1) h 437 (4.2) 19 (3.2) 451 (4.7) h 428 (4.2) 23 (3.7)Moldova, Rep. of 491 (3.0) h 481 (3.4) 10 (2.8) 523 (3.1) h 508 (3.2) 15 (2.5)Morocco 345 (7.2) h 329 (6.5) 16 (5.8) + + + + + +
† Netherlands 553 (2.7) 549 (2.3) 4 (3.0) 547 (2.0) h 538 (1.8) 9 (2.4)New Zealand 535 (2.4) h 513 (3.1) 22 (3.1) 550 (2.3) h 526 (2.9) 24 (2.8)
‡ Norway 510 (3.1) h 494 (3.1) 16 (4.2) 505 (2.5) h 485 (2.9) 20 (2.7)Poland 525 (2.6) h 507 (2.8) 18 (2.6) 529 (2.4) h 514 (3.0) 16 (3.0)Qatar 377 (2.0) h 344 (1.6) 33 (2.7) + + + + + +Romania 495 (5.2) h 483 (5.9) 13 (4.1) 498 (5.6) h 482 (5.9) 16 (4.6)
2a Russian Federation 570 (3.9) h 554 (3.4) 16 (2.5) 569 (3.8) h 555 (3.2) 14 (2.8)† Scotland 537 (3.8) h 512 (3.0) 24 (3.8) 538 (3.3) h 519 (2.9) 18 (3.6)
Singapore 570 (3.6) h 552 (3.9) 18 (3.6) 564 (2.8) h 548 (3.2) 16 (2.6)Slovak Republic 534 (2.8) h 524 (3.6) 10 (3.3) 538 (2.8) h 525 (3.4) 13 (2.9)Slovenia 527 (2.0) h 511 (2.8) 16 (2.6) 534 (2.1) h 514 (2.4) 20 (2.4)South Africa 322 (6.0) h 291 (5.4) 31 (4.4) + + + + + +Spain 509 (2.8) 508 (2.7) 1 (2.4) 519 (2.9) h 512 (3.0) 7 (2.7)Sweden 558 (2.5) h 544 (2.9) 14 (2.7) 557 (2.7) h 537 (2.5) 20 (3.0)Trinidad and Tobago 453 (5.0) h 424 (5.6) 29 (5.4) 453 (5.5) h 421 (5.8) 32 (5.5)
†2a United States 537 (3.2) h 527 (4.1) 10 (3.1) 552 (3.0) h 540 (4.1) 12 (2.7)
International Avg. 508 (0.6) h 493 (0.6) 15 (0.6) 509 (0.6) h 492 (0.6) 17 (0.5)
h Average significantly higher than other gender
† Met guidelines for sample participation rates only after replacement schools were included (see Exhibit A.7).
‡ Nearly satisfying guidelines for sample participation rates after replacement schools were included (see Exhibit A.7).
2a National Defined Population covers less than 95% of National Desired Population (see Exhibit A.4).
2b National Defined Population covers less than 80% of National Desired Population (see Exhibit A.4).
( ) Standard errors appear in parentheses. Because results are rounded to the nearest whole number, some totals may appear inconsistent.
A plus (+) sign indicates average achievement could not be accurately estimated on the interpreting, integrating, and evaluating scale.
NOTE: The International Average does not include the results from the Canadian provinces.
SOU
RCE:
IEA
Pro
gres
s in
Inte
rnat
iona
l Rea
ding
Lite
racy
Stu
dy (P
IRLS
) 200
6
Exhibit 1.13 Average Achievement in Reading Processes of Comprehension by Gender PIRLS 20064th Grade

