teacher qualifications and middle school student · pdf fileteacher qualifications and middle...
TRANSCRIPT
Teacher Qualifications and Middle School Student Achievement
RICHARD BUDDIN, GEMA ZAMARRO
WR-671-IES
June 2009
Prepared for the Institute of Education Sciences
WORK ING P A P E R
This product is part of the RAND Education working paper series. RAND working papers are intended to share researchers’ latest findings and to solicit informal peer review. They have been approved for circulation by RAND Education but have not been formally edited or peer reviewed. Unless otherwise indicated, working papers can be quoted and cited without permission of the author, provided the source is clearly referred to as a working paper. RAND’s publications do not necessarily reflect the opinions of its research clients and sponsors.
is a registered trademark.

iii
ABSTRACT
This research examines whether teacher licensure test scores and other teacher
qualifications affect middle school student achievement. The results are based on longitudinal student-level data from Los Angeles. The achievement analysis uses a value-added approach that adjusts for both student and teacher fixed effects. The results show little relationship between traditional measures of teacher quality (e.g., experience and education level) and student achievement in reading or math. Similarly, licensure test scores in general aptitude, subject-matter knowledge, and reading pedagogy had no significant effects on student achievement. Teachers with elementary school credentials had slightly better success in the classroom than did teachers with secondary school credentials. (JEL: J44, J45, H0, H75, I21) (Keywords: Teacher quality, teacher licensure, student achievement, middle school, two-level fixed effects, education production function)

iv
v
ACKNOWLEDGMENTS
The authors are grateful to Harold Himmelfarb of the Institute of Education Sciences for his encouragement and support of this research. We are indebted to David Wright and William Wilson of the California State University (CSU), Office of the Chancellor, for providing access to teacher licensure test score data for recent graduates of the CSU system. Cynthia Lim and Glenn Daley of the Los Angeles Unified School District (LAUSD) provided access to student achievement data and answered numerous questions about district policies and procedures. Eva Pongmanopap of LAUSD was helpful in building the student achievement files and in clarifying numerous issues about the data. Ron Zimmer and Jerry Sollinger provided comments on an earlier draft.
This paper is part of a larger research project “Teacher Licensure Tests and Student Achievement” that is sponsored by the Institute of Education Sciences in the United States Department of Education under grant number R305M040186.

vi
1. INTRODUCTION
Many states struggle with improving the academic outcomes of middle school
students, especially in urban areas serving large groups of low-income students. While
proficiency standards vary from state to state, student proficiency in the three largest
school districts lags behind that of each respective state. About 58 percent of New York
7th grade students are proficient in English/Language Arts (ELA) as compared with 45
percent of 7th graders in New York City Public Schools. In California, 46 percent of 7th
graders meet state proficiency standards for ELA, but only 31 percent of 7th graders in
Los Angeles Unified are proficient. The pattern is similar in Illinois, where 79 percent of
statewide 7th graders are proficient in ELA, but only 63 percent of 7th graders in Chicago
Public Schools meet the state proficiency standard. Math proficiency rates in these
districts also lag the state rates as a whole.
Academic problems in middle school are often a precursor of subsequent
problems in high school and beyond. Several studies have shown that failing classes in
middle school are a strong predictor of dropping out of high school (Balfanz and Herzog,
2006; Zao and Betts, 2008; Zarate, Ruzek, & Silver, 2008). In addition, participation in
post-secondary education has been linked with strong performance in 8th grade reading
and math (Horn and Numez, 2000; Zarate, 2008).
This research examines linkages between the qualifications of middle school
teachers and student achievement. Murnane and Steele (2007) argue that teachers with
low qualifications and weak academic credentials instruct disproportionate shares of low
income and at-risk students. These poorly prepared teachers have difficulties in the

2
classroom and often leave the teaching profession or transfer to less arduous duty in
suburban schools.
We focus on identifying which teachers are having success in improving student
achievement and identifying what teacher qualifications predict classroom performance.
In addition to traditional measures of teacher preparation like experience and educational
degrees, we also have information on teacher licensure test scores that measure a
teacher’s general aptitude, subject-matter knowledge, and pedagogical skill. We will also
examine whether teachers with multi-subject elementary school teaching credentials have
better or worse classroom results than do comparable teachers with more specialized
single-subject, secondary credentials. In particular, the study addresses the following
issues:
1. How does teacher quality vary across classrooms and across schools? Using
longitudinally linked student-level data we will examine whether students
consistently perform better in some teachers’ classrooms than in others. We will
asses whether “high quality” teachers are concentrated in a portion of schools
with well-prepared, motivated students or whether higher performing teachers
teach both high- and low-performing students.
2. Do traditional measures of teacher quality like experience and teacher educational
preparation explain their classroom results? Teacher pay is typically based on
teacher experience and education level (Buddin et al., 2007), so it is important to
assess whether these teacher inputs are tied to better classroom outcomes.
3
3. Do teachers with single-subject credentials have better outcomes than teachers
with multiple-subject credentials? The conventional wisdom is that more
specialized knowledge in math and ELA would translate into better instruction.
4. Does teacher success on licensure test exams translate into better student
achievement outcomes in teacher’s classroom?
We structure the rest of the paper in the following way. Section 2 reviews prior
literature on teacher quality and licensure test scores emphasizing the research on middle
schools. Section 3 describes the data set and econometric methods used in the analysis.
Section 4 presents the empirical results. The final section draws conclusion and makes
recommendations.
2. PRIOR LITERATURE AND EMPIRICAL ISSUES
Research on teacher effectiveness has progressed through three distinct stages that
are tied directly to data availability and emerging empirical approaches. Initial studies
relied on cross sectional data that were often aggregated at the level of schools or even
school districts (Hanushek, 1986). This approach related average school test scores to
aggregate measures of teacher proficiency. Hanushek (1986) showed that most explicit
measures of teacher qualifications like experience and education had little effect on
student achievement. In contrast, implicit measures of teacher quality (i.e., the average
performance of individual teachers) differed significantly across teachers. These studies
were plagued by concerns about inadequate controls for the prior achievement of students
attending different groups of schools. If teachers with stronger credentials were assigned
to schools with better prepared students, then the estimated return to teacher credentials
would be overstated.
4
A new round of studies focused on year-to-year improvements in student
achievement. These studies implicitly provided better controls for student background
and preparation by isolating individual student improvements in achievement. They
provided some evidence for differences in teacher qualifications affecting student
achievement gains. For example, Ferguson (1991) found that scores on the teacher
licensing test in Texas—which measures reading and writing skills as well as a limited
body of professional knowledge—accounted for 20-25 percent of the variation across
districts in student average test scores, controlling for teachers’ experience, student-
teacher ratio, and percentage of teachers with master’s degrees. Ferguson and Ladd
(1996) found smaller effects using ACT scores in Alabama. Ehrenberg and Brewer
(1995) found that the teacher test scores on a verbal aptitude test were associated with
higher gains in student scores although the results varied by school level and students’
racial/ethnic status. Using data from the 1998 National Educational Longitudinal Study
(NELS), Rowan et al. (1997) found that teachers’ responses to a one-item measure of
mathematics knowledge were positively and significantly related to students’
performance in mathematics, suggesting that teacher scores on subject matter tests may
relate to student achievement as well. A few studies that examined pedagogical
knowledge tests found that higher teacher scores were also related to higher student test
performance, although many of these were dated (1979 or earlier). Strauss and Sawyer
(1986) reported a modest and positive relationship between teachers’ performance on the
National Teacher Examination (NTE) and district average NTE scores, after controlling
for size, wealth, racial/ethnic composition, and number of students interested in
postsecondary education in the district.
5
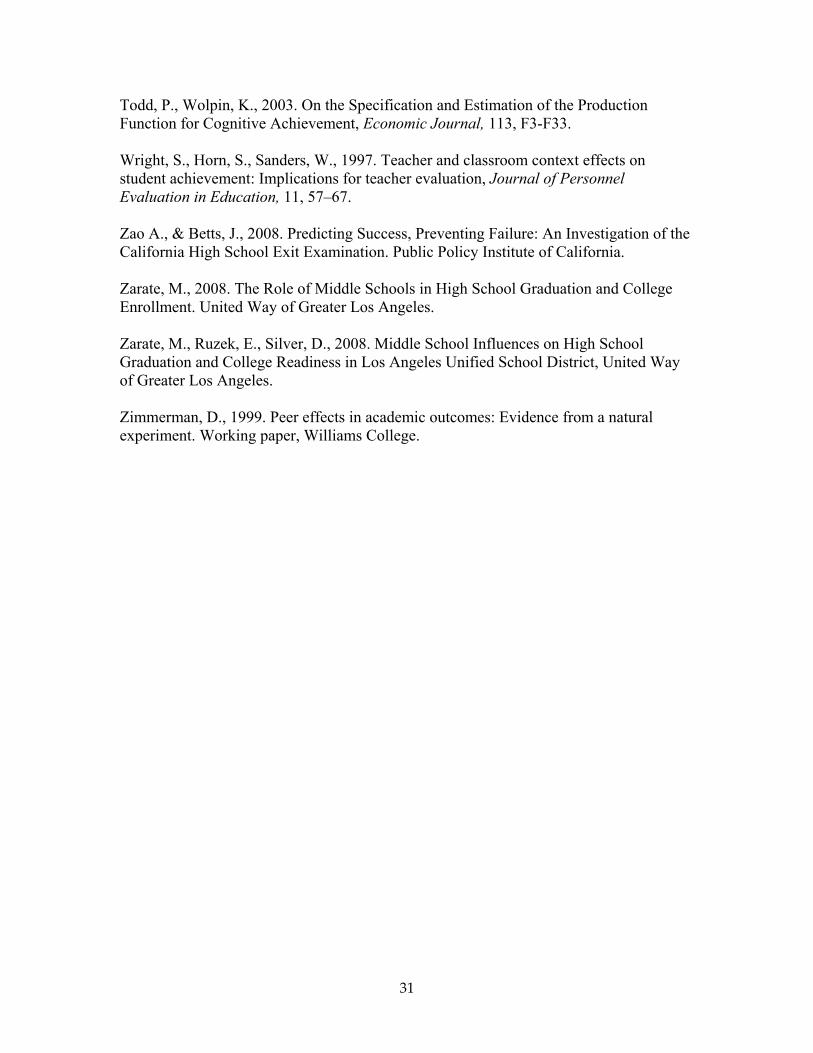
Most recent studies of teacher effectiveness (see Table 2.1) have relied on
estimates from longitudinal student-level data using either the contemporaneous value-
added model with fixed effects or the value-added gains model with fixed effects. In
some cases, the models control for student fixed effects but not for teacher fixed effects.
The studies rely on administrative data from school districts or states and have limited
information on teacher qualifications and preparation. Table 2.1 compares the modeling
approaches and results of seven recent studies of teacher quality.
Only two of the previous studies included data from middle school. Harris and
Sass (2006a) examined how teacher qualifications and in-service training affected student
achievement for grades 3rd to 10th in Florida. They estimated a value added gains model
that controlled for student and teacher fixed effects. They found small effects of
experience and educational background on teacher performance. In addition, they found
that a teacher’s college major or scholastic aptitude (SAT or ACT score) is unrelated to
their classroom performance. On the other hand, Aaronson et al. (2008) looked at teacher
quality and student achievement from 8th grade to 9th grade in Chicago public schools.
They used a gain score approach with controls for student and teacher fixed effects. The
results showed strong effects of teachers on student achievement, but that traditional
measures of teacher qualifications like education, experience, and credential type have
little effect on classroom results.
6
3. ECONOMETRIC METHODS AND DATA
Modeling Issues
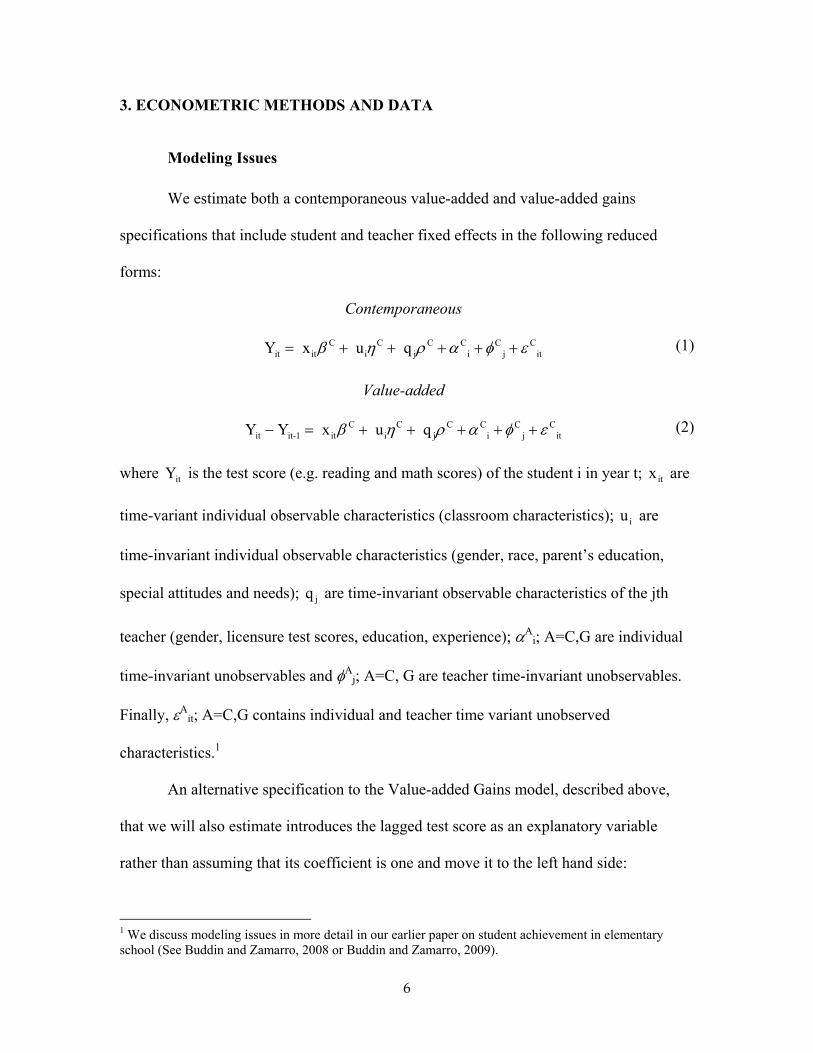
We estimate both a contemporaneous value-added and value-added gains
specifications that include student and teacher fixed effects in the following reduced
forms:
Contemporaneous
C C C C C Cit it i j i j itY x u q (1)
Value-added
C C C C C Cit it-1 it i j i j itY Y x u q (2)
where itY is the test score (e.g. reading and math scores) of the student i in year t; itx are
time-variant individual observable characteristics (classroom characteristics); iu are
time-invariant individual observable characteristics (gender, race, parent’s education,
special attitudes and needs); jq are time-invariant observable characteristics of the jth
teacher (gender, licensure test scores, education, experience); Ai; A=C,G are individual
time-invariant unobservables and Aj; A=C, G are teacher time-invariant unobservables.
Finally, Ait; A=C,G contains individual and teacher time variant unobserved
characteristics.1
An alternative specification to the Value-added Gains model, described above,
that we will also estimate introduces the lagged test score as an explanatory variable
rather than assuming that its coefficient is one and move it to the left hand side:
1 We discuss modeling issues in more detail in our earlier paper on student achievement in elementary school (See Buddin and Zamarro, 2008 or Buddin and Zamarro, 2009).
7
it it 1 0 it 1 i j i j itY Y +x u qL L L L L L L
Although estimation of this model may seem more appealing than the one of the model
presented in (2), given that it is a more general model, in practice the estimation is more
complicated and it requires the availability of at least three waves of data as it will be
explained below.
Both teachers and students enter and exit the panel so, we have an unbalanced
panel. Students also change teachers (generally from year to year). This is crucial,
because fixed effects are identified only by the students who change teachers. It is
assumed that it is strictly exogenous. That is, student's assignments to teachers are
independent of it . Note, according to this assumption, assignment of students to teachers
may be a function of the observables and the time-invariant unobservables.
It is usual to assume that the unobserved heterogeneity terms (Ai; A=C,G and
Aj; A=C, G) are correlated with the observables (due to student unobserved
heterogeneity, teacher unobserved heterogeneity and non-random assignment of students
to teachers). Thus, random effect methods are inconsistent and fixed effect methods are
needed. In this case, the coefficients of students and teachers’ time invariant observed
characteristics (A and A; A=C,G) are not identified separately from the unobserved
heterogeneity terms. Given that the objective of this paper is to asses the role of such
observed teacher characteristics on determining student performance, rather than
dropping the variables ui and qj, we define:
AjqA A
j j (3)
iuA A Ai i (4)
8
Then, we estimate the models in two steps. In a first step we estimate the following
equations using fixed effects methods:
Contemporaneous Value-added
Cit it Y x C C C
i j it (5)
Value-added Gains Models
it 1 itY -Y x G G G G
it i j it (6)
it it 1 0 it 1 itY Y +x L L L L L
i j (7)
Then, in a second-stage regression we evaluate the ability of a rich set of observable
teacher qualifications to predict teacher quality (Aj; A=C,G). Many of the observable
teacher characteristics considered in this analysis are important determinants of teacher
recruitment, retention and salaries decisions. In the same manner, we also analyze the
ability of observable student characteristics to predict the student ability term (Ai).
Causal interpretation of the coefficients in these second step regressions would need the
additional assumptions that Cov(ui, Ai )=Cov(qj, A
j)=0. As explained below, this
assumption is unlikely to be satisfied in this context. Thus, our second step estimates
should not be interpreted as causal effects but as measures of the correlation between
observed characteristics and the teacher quality and student ability terms. Finally, our
dependent variables in these second step regressions are statistical estimates of the true
measures of teacher quality and student ability (Aj and A
i) and as such they are
measured with error. Thus, to obtain efficient estimates of the parameters we perform
Feasible Generalized Least Squares (FGLS) regressions where the weights are computed
following Borjas (1987).
9
A practical problem in estimating equations (5, 6 and 7) is that there is no straight
forward algebraic transformation of the observables that allow us estimate these
equations and easily recover the estimates of the students and teachers’ fixed effects.2
Abowd et al. (1999), in an application for employer- employee data, propose to explicitly
including dummy variables for employer heterogeneity and sweeping out the employee
heterogeneity algebraically. They proved that this approach gives the same solution as the
Least Squares Dummy Variables estimator for fixed effects panel data models. However,
this method leads to computational difficulties because the software needs to invert a
(K+J)×(K+J) matrix and store a lot of information. K refers to the total number of
explanatory variables while J is the total number of teachers. Thus, we estimate the
models in equations (5) and (6) using a preconditioned conjugate gradient method
described in Abowd, Creecy & Kramarz (2002).3 Guimaraes and Portugal (2009)
proposed an alternative approach to estimation using a simple to implement iterative
procedure that can be easily extended to alternative specifications of the model.
In addition to previous computational difficulties, estimation of equation (7) has
the additional complication that taking differences to eliminate the student fixed effects
will lead to correlation of the differenced lagged score ( it 1 it 2Y Y ) and the differenced
error term ( it it-1L L ). Anderson and Hsiao (1981) proposed using an instrumental
variable estimator with it 2Y as an instrument for ( it 1 it 2Y Y ). This is a valid method
since it 2Y is not correlated with ( it it-1L L ), assuming the errors are not serially
2 See Abowd et al (1999) for a description of suitable methods to estimate models with two levels fixed effects in the context of linked employer-employee data. 3 Amine Ouazad developed the STATA routine used for the estimation of equations (5) and (6). The software is available on the web at http://repository.ciser.cornell.edu/viewcvs-public/cg2/branches/stata/.
10
correlated. This is the approach we follow to obtain estimates of equation (7). In
particular, we follow Guimaraes and Portugal (2009) proposed routine for estimating
models with high dimensional fixed effects and obtain instrumental variable estimates of
equation (7) using it 2Y as instrument.4
Other potential data problems include, sample selection and attrition. Sample
selection is due to the fact that we only observe teachers who passed their licensure
exams. Although we acknowledge that the results we obtain are not representative for the
whole population of potential teachers, they are for those teachers who are deemed
eligible to teach. In this sense, we still believe the estimates we obtain in this population
are the most relevant ones because these are the teachers who effectively will be
participating in the educational system. On the other hand, literature suggests that more
qualified teachers are more likely to leave the profession sooner (See e.g. Goldhaber,
2007). This phenomenon constitutes another source of potential bias. As a specification
check, we estimated our models for teachers with less than 6 years of teaching
experience, and the results did not differ from the ones for the whole sample. As a result,
only the results corresponding to the complete sample are presented in the next sections.
Data Issues
Student Achievement Data
This study is based on panel data from the Los Angeles Unified School District
(LAUSD) for students in grades 6 through 8 for eight consecutive school years from 2000 4 An alternative more efficient estimator method uses additional lags of the dependent variable as instruments (see Arellano and Bond (1991)). The model is then overidentified, so estimation should be by 2SLS or GMM methods. Given to computational difficulties derived from combination of these methods with high dimensional fixed effects we are not able to obtain estimates using these alternative methods.
11
to 2007. In the gains models, we also included 5th grade test scores, so we could compute
gains for 6th, 7th, and 8th grades, and 4th grade to use as an additional instrumental variable
for the estimates following Anderson and Hsiao (1981). Student and teacher data are
linked by an identifying variable.5
This matched LAUSD student/teacher data are unusual in student achievement
analysis. Districts often maintain separate administrative records for teachers and have
difficulty linking students to individual teachers. Rivkin et al. (2005) are not able to
match individual teachers with students and rely on the average characteristics of teachers
in each grade and year for their study. Similarly, North Carolina data links students with
the individual who proctored the test and not necessarily the student’s teacher. Clotfelter
et al. (2007) rely on an imputation strategy to link students with their classroom teacher.
The authors were able to match about 75 percent of elementary math and reading
teachers.
LAUSD is a large, diverse urban school district. Annual enrollment is about
730,000 students in over 800 schools.6 Our data set includes individual student records
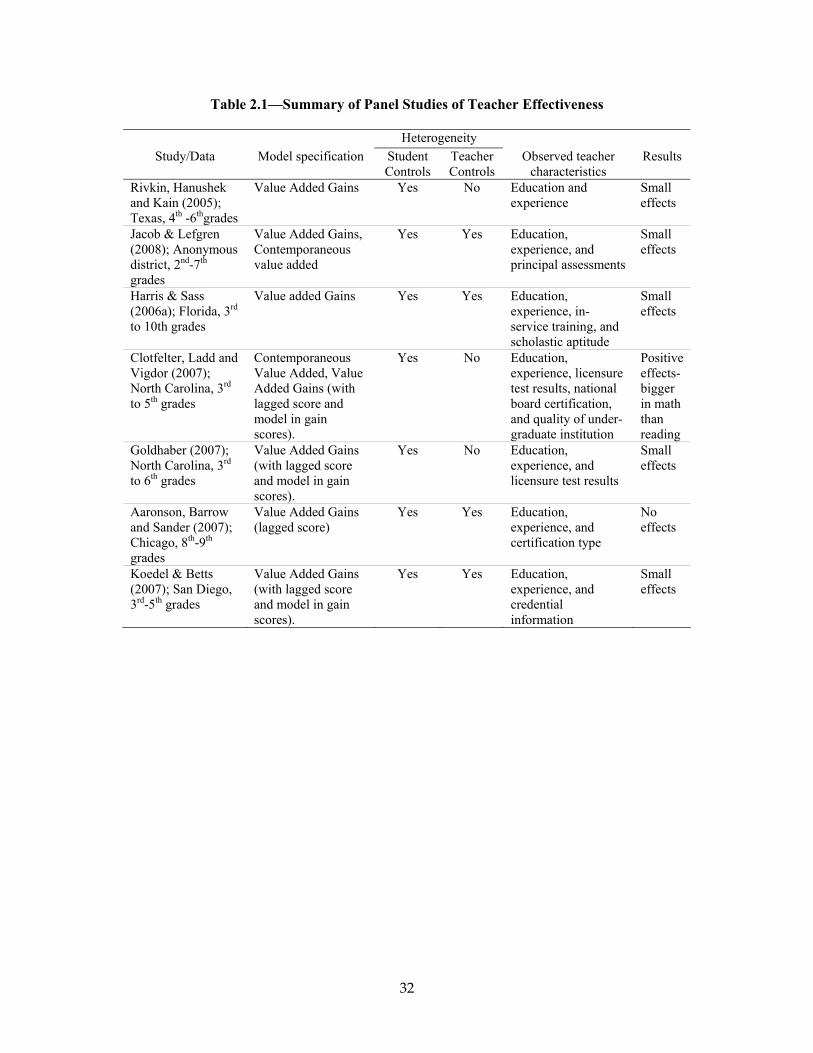
for about 400,000 students per year at about 150 middle schools. Table 3.1 shows that 72
percent of students are Hispanic, 11 percent are black, 10 percent are white/non-Hispanic,
and 7 percent are Asian/Pacific Islander. 29 percent of the students are classified as
Limited English Proficient (LEP). About 75 percent of students are eligible for the
free/reduced lunch program. While 18 percent of students have parents who graduated
5 For privacy reasons, all teacher and student data in our analysis have scrambled identifiers. This allows the tracking of students and teachers overtime without compromising the privacy of individuals in the analysis. 6 By way of comparison, LAUSD enrollment is larger than enrollment in 28 states.
12
from high school, another 17 percent of students have a parent with a college or graduate
school degree.
LAUSD middle schools are struggling to meet achievement goals set by the No
Child Left Behind (NCLB) Act of 2001. Under NCLB, schools are designated at eligible
for special Title I funding if 40 percent of their students are low income. All middle
schools in LAUSD are Title I eligible. Title I schools are designated at Program
Improvement (PI) schools if they fail to make adequate yearly progress towards meeting
state achievement standards for two consecutive years. Under PI, NCLB requires schools
to provide various options to parents including transfers to other schools, supplemental
educational services for students, and restructuring. In 2007 (see Figure 3.1), 87 percent
of LAUSD middle schools were in PI status, and 45 percent of district schools had been
in PI status for 5 or more years.
Student achievement is measured on the California Standards Test (CST), in
reading and math. The CST is aligned with state curriculum standards and reflects the
material covered in the respective middle school courses. CST raw scores are normalized
by grade and year, so our models are based on a continuous linear scale.
Teacher Characteristics and California Licensure Test Data
The middle LAUSD teacher workforce is diverse and experienced. The average
teaching tenure is 7 years for English teachers and 6 years for math teachers, but the
distributions are skewed with the median being in 3 years of experience. Half of the
teachers are women. The race/ethnic distribution of teachers is 46 percent white non-
Hispanic, 24 percent Hispanic, 16 percent black, and 14 percent Asian. About 19 percent
of the teachers have a master’s degree, but only 2 percent has a doctorate.

13
California requires new teachers to pass up to three tests as part of state
certification procedures (Le and Buddin, 2005):
• General Aptitude or Basic Skills. The California Basic Educational Skills Test
(CBEST) is generally given before admission to a teacher preparation program.
The test focuses on proficiency in reading, writing, and mathematics.
• Subject-Matter Knowledge. Each candidate is required to show competence in the
material that they will be authorized to teach. The California Subject
Examinations for Teachers (CSET) are divided into two groups: a multiple
subject exam for elementary school teachers and a single subject exam for middle
and secondary school teachers. These skills are acquired in subject-matter
departments and outside of teacher preparation programs.7
• Reading Pedagogy. The Reading Instruction Competence Assessment (RICA) is
required for all elementary school teachers. This is the only licensure test that
specifically assesses skills that are learned through professional teacher
preparation programs.
Although middle schools are traditionally considered as serving secondary
students, in the past decade, they have increasingly hired teachers holding a multiple-
subject credential. Multiple subject holders cannot be assigned by schools to teach a full
day of classes in a unique subject, but they can be assigned to daily schedules in which a
teacher is responsible for up to three consecutive “core classes” that encompass two
subjects (e.g. Science and math). As a result, an increasing number of middle school
7 Prior to NCLB legislation in 2001, teaching candidates could demonstrate subject-matter knowledge by either passing the state mandated licensure test or by completing an approved subject matter preparation program. Under NCLB, candidates are required to pass a subject matter test.
14
students are taught by teachers whose subject-matter competence has been assessed in
relation to the typical curriculum in elementary school. In our sample 42 per cent of
middle school ELA teachers and 53 per cent of math middle school teachers hold an
elementary school credential.
All teacher candidates must take the general aptitude test. The first-time pass rates
are 81 percent for white non-Hispanic teaching candidates but only 44 and 53 percent for
Black and Hispanic candidates (Jacobson and Suckow, 2006). After retesting, the pass
rates increase substantially, and the race/ethnic gap in pass rates narrows considerably.
This suggests that many candidates may improve their skills and preparation to meet the
pass criterion or test familiarity boosts scores. The cumulative pass rates are 93, 69, and
77 for white non-Hispanics, Blacks, and Hispanics, respectively. Many candidates may
be discouraged by failing one of the tests, however, and lose interest in teaching.
The reading pedagogy test is required for the elementary school credential. But
still, in our sample, approximately 5 percent of English and Math middle school teachers
without elementary school credentials have reading pedagogy licensure scores. The first-
time pass rates on this test are 88, 67, and 72 for white non-Hispanic, Black, and Hispanic
candidates, respectively. As before, this gap closes substantially for cumulative rates after
some candidates retest.
Subject-matter qualification differs for elementary and secondary credentials.
Elementary credentials are based on passing the multi-subject version of CSET. The first-
time pass rates are 81, 48, and 60 percent for white non-Hispanic, Black, and Hispanic
candidates.
15
Secondary credentials are based on single-subject versions of CSET. We focus on
ELA and math teachers, since CST measure student achievement in these subjects each
year. The pass rates on these exams are much lower than for the multiple-subject exams.
In English, the first-time pass rates are 66, 36 and 49 percent for white non-Hispanics,
Blacks, and Hispanics. In math, the first-time pass rates are 44, 22, and 29 percent.
As might be expected, higher licensure scores are associated with better academic
success in college. Teaching candidates with a B average or better in college have first-
time pass rates on the aptitude test of 78 percent as compared with only 54 percent for
others (Jacobson and Suckow, 2006). Similarly, better students consistently have high
scores on the subject matter and pedagogy exams.
Licensure test scores are collected by the California Commission on Teacher
Credentialing as part of teacher certification procedures. Individuals are informed of their
passing status on tests. Districts are not informed of licensure test scores, but they are
informed when a teacher completes certification requirements for a multiple-subject
credential (elementary school teachers) or single-subject credential (middle- and high-
school teacher).
We worked with the California State University (CSU), Chancellor’s Office, to
obtain teacher licensure scores for seven cohorts of teachers from the CSU system (years
2000 through 2006). The file includes licensure scores for about 62,000 teaching
candidates. Separate scores are recorded on a basic skills test, subject area tests, and
reading pedagogy. The file contains information on failed exams, so we know whether a
teacher needed to retake one or more exams as part of the certification process.

16
The CSU licensure data are available for around 18 per cent of the LAUSD
middle school teachers. This low match rate reflects two key factors. First, most teachers
in the district received their certification before 2000 and have been teaching for some
time. The match rate rises to around 23 percent for teachers in their first three years of
teaching. Second, CSU only has access for licensure scores for candidates from their
various campuses and not from the entire state. About 50 percent of California teaching
certificate completers are affiliated with a CSU campus. We were unable to obtain
additional licensure information from either the California Commission on Teacher
Credentialing or other campuses.
Several different methods were used in the empirical analysis to handle the
missing information on licensure test scores. In each approach, stage 1 regressions are
estimated as described above on the entire sample. The adjustment for missing licensure
data occurs in stage 2 using data on estimated teacher effects in reading and math.
• Multiple imputation. This approach imputes licensure scores from other teacher
characteristics and estimated teacher effects in reading and math. Multiple
datasets are created with different imputed values, and final parameters estimates
are blended from regressions on each dataset. The methods rely on assumptions
such as Missing at Random or Missing Completely at Random that are made on
the conditional distributions of the licensure score variables.8 We are concerned
that this approach is not well suited to our situations where we have large
proportions of missing variables, and we would rather prefer not to make
assumptions about their (conditional) distributions.
8 See, e.g., Rubin (1996) for a description of Missing at Random and Missing Completely at Random assumptions and their application in imputing methods.

17
• Dropping records with missing teacher data. In this approach, we estimate stage 2
entirely on matched CSU teachers. The results show whether licensure scores for
recent CSU teaching graduates are significantly related to student achievement in
each teacher’s classroom. We are concerned that this approach focuses on the
CSU sample of young teachers and ignores the other teachers. The broader group
of teachers would provide more information on how other teacher characteristics
affect student achievement.
• Missing dummy variables. A common missing value adjustment consists of
setting the value of the missing covariate to an arbitrary fixed value (zero) and,
adding dummy variables for “missings.”
The main analysis results reported below rely on the missing dummy variable approach.
We also estimated various models with the missing multiple imputation and “dropped
records” approaches, and these results were similar to those reported below.
Patterns of Student and Teacher Characteristics across Middle Schools
The composition of LAUSD middle schools varies substantially across the
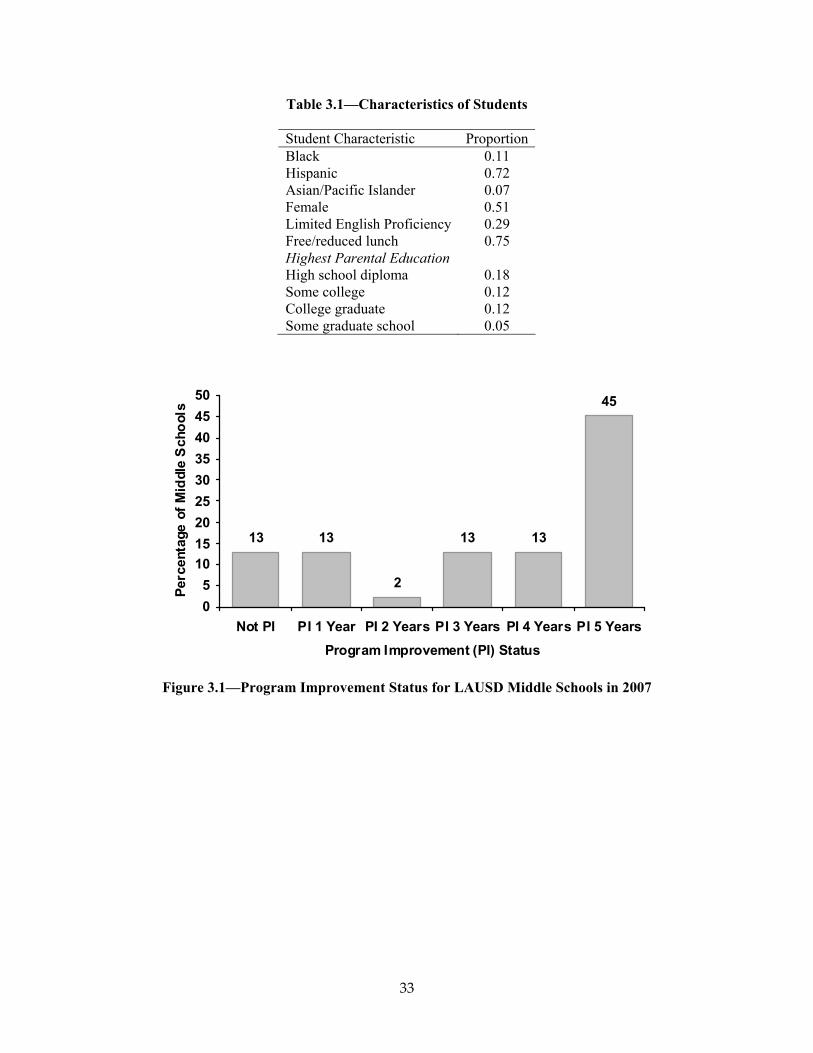
district. Table 3.2 shows simple differences in the student and teacher characteristics for
low- and high-performing middle schools. Schools in the lowest achievement quartile in
2007 had average reading and math scores nearly a full standard deviation lower than
schools in the highest quartile. The low-performing schools were nearly 50 percent larger
than the high-performing schools. The low-performing schools have disproportionate
shares of Black, Hispanic, LEP, and low-SES students.
The teacher mix also varies substantial across low- and high-performing schools.
Teachers in low-performing schools have less experience, fewer advanced degrees, and

18
slightly lower aptitude on their licensure exams. Black and Hispanic teachers are much
more common in low-performing middle schools. Finally, only 28 percent of teachers in
the lowest achievement quartile schools have elementary credentials as compared with 48
percent in the highest quartile.
The teacher assignment patterns hint that differences in student achievement
might be related to lower quality teachers being assigned to schools with more at-risk
students. The patterns show that the schools with the most at-risk students have newer
teachers, fewer teachers with advanced degrees, and more teachers with lower teacher
licensure test scores. The next section will begin to disentangle how these teacher
characteristics translate into student achievement outcomes.
Classroom scheduling
Middle school students move from teacher to teacher for different subjects in
departmentalized classrooms. In contrast, elementary school students are taught multiple
subjects by the same teacher in self-contained classrooms. The departmentalized structure
of middle schools makes it easier to disentangle individual teacher contributions and
classroom composition effects. Middle school teachers teach multiple sections of a course
during an academic year. Thus, both the variation in class composition across sections at
a point in time and the variation across cohorts of students taught by a given teacher over
time serve as sources of identification of teacher and classroom composition variables.
Middle school students have multiple teachers and peers during the day, however,
and this creates the additional challenge of identifying who are the relevant teacher and
classroom peers. In this respect, previous researchers (e.g., Harris and Sass, 2006b) have
sometimes restricted the sample of analysis to get a clearer measure (e.g. restricting the
19
analysis to math courses, students who are enrolled in only a single mathematics course
and who have only one primary instructor).
In our analysis, we analyze both math and ELA courses and exploit information
about the courses to asses who is the “relevant” teacher. In math, 89 percent of students
take only one class per year with the same teacher, and we restrict our sample to this
group of students and teachers. In ELA, about half of the students take multiple classes,
and many of those students are enrolled in ELA as a Second Language (ESL) student. If
the student only has one ELA teacher, then this teacher is designated as the “principal”
ELA teacher. Our next priority is the core course for students with multiple courses or the
highest level core course. Finally, for ESL students with no core ELA class, the
“principal” ELA teacher is designated as the highest level ESL course.
Peer effect and classroom characteristics are computed as an average of the
characteristics in the ELA and math courses taken over the year.
4. RESULTS
This section presents the results from the value-added models of student
achievement. The results are divided into four subsections. The first examines the
distribution of student and teacher quality across schools in the district. The second
subsection shows the results of the stage 1 regressions for time-varying variables.
Subsections three and four examine factors affecting teacher and student heterogeneity,
respectively.
Distribution of Teacher Quality Across Schools
Are “good” teachers concentrated in a few schools (presumably with few at-risk
students), or are high-quality teachers distributed broadly across a variety of schools?
20
Table 4.1 shows the results of fixed effects regressions for unconditional models in gains
that adjust only for grade and test year. The first model shows that student-to-student
deviations in achievement are greater than teacher-to-teacher deviations. The second
model in Table 4.1 shows a similar model that controls for student and school fixed
effects. The magnitude of school deviations in the second model is much smaller than for
teachers in the first model. These results show that high-quality teachers are dispersed
across schools and not concentrated in a few schools.
These simple models provide a broad description of how student achievement
varies across students and teachers. We now turn to models that decompose in more
detail what student and teacher’s factors are linked with stronger student achievement
outcomes.
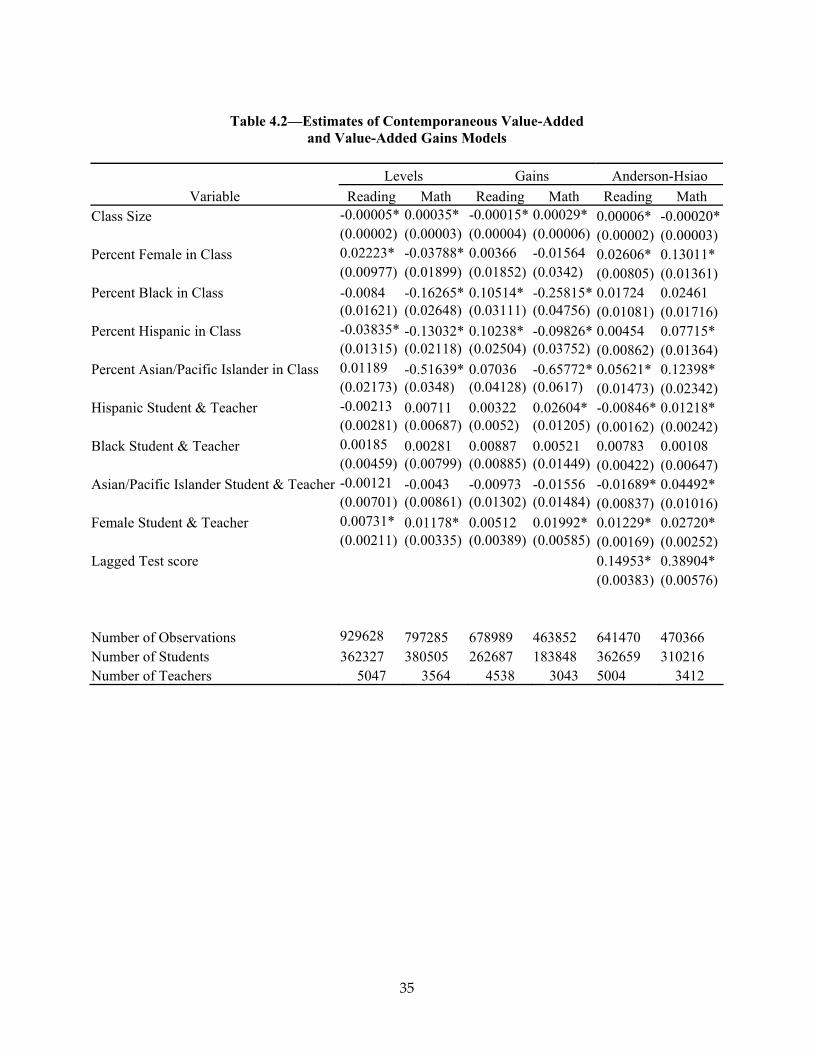
Estimates of Value-Added Models
The results for the contemporaneous value-added model (levels) and the value-
added gains models (gains and Anderson-Hsiao) are reported in Table 4.2. The dependent
variables are standardized scales scores by year and grade. Each model version controls
for test year as well as for time-varying student and classroom characteristics. In addition,
each specification includes student and teacher fixed effects. The time-varying factors
consist of three types of components: class size, class peer composition, and
student/teacher match variables. Peer effects measures are the proportion of different
ethnicity groups and female students in the classroom. As explained in previous sections,
the central problem with estimating the effect of these peer and match variables is that
families may self-select their children into classrooms and schools depending on their
children ability. Moreover, schools may assign their teachers to a given classroom
21
depending on its composition. As a result, these variables are potentially endogenous.
This is taken into account in our estimates including both student and teacher fixed
effects allowing for correlation between them and the explanatory variables.9
The results in Table 4.2 are slightly different between reading and math but they
are somewhat consistent across the different specifications. Class size is inversely related
to reading scores and directly related to math score both in the levels and gains models,
but both effects are very small. Opposite results are found in the Anderson-Hsiao
specification. In the levels and Anderson-Hsiao specifications, the percentage of female
students in the classroom has a positive effect on reading. The effect in math is however
negative in the levels model and positive in the Anderson-Hsiao specification. These
effects are insignificant in the gains model. The race/ethnic composition variables are
generally significant with math achievement inversely related to the proportion of Black,
Hispanic, and Asian/Pacific Islander students in the class. A surprising finding is that
reading gain scores are positively related to the Black and Hispanic composition of
classes in the gains model, and positively related to the proportion of Asian/Pacific
Islander in the Anderson-Hsiao specification. Math scores are also found positively
related to the proportion of Asian/Pacific Islander and Hispanic students in the Anderson-
Hsiao specification.
9 Most of the research on peer effects dealt with selection by controlling for observable variables, comparing siblings that experienced different schools, examining desegregation programs or estimating selection models (Angrist & Lang, 2002). Other parts of the literature exploit the availability of policy or natural experiments to estimate peer effects (Zimmerman, 1999 and Sacerdote, 2000). Hoxby (2000) exploits the variation in adjacent cohorts’ peer composition within a grade within a school that is idiosyncratic to estimate peer effects. Cullen and Jacob (2007) use lottery data to look at open enrollment effects for Chicago elementary school students. They find lottery winners are matched with higher quality peers in their new schools but their subsequent achievement scores are not higher than those of lottery losers.
22
The results provide little evidence that students have higher achievement levels if
they are matched with a similar teacher. Dee (2005), Clotfelter et al. (2007), and Ouazad
(2007) find that students do better academically when they are matched with a teacher of
similar race/ethnicity or gender. Virtually most of the race/ethnic match variables are
insignificant in Table 4.2. Only in the Anderson-Hsiao specification the match of
Hispanic and Pacific/Islander teachers and students has a negative effect on reading
scores and a positive effect on math scores. Female students do have higher reading and
math scores when matched with a female teacher, but the magnitude of the effect is
small.
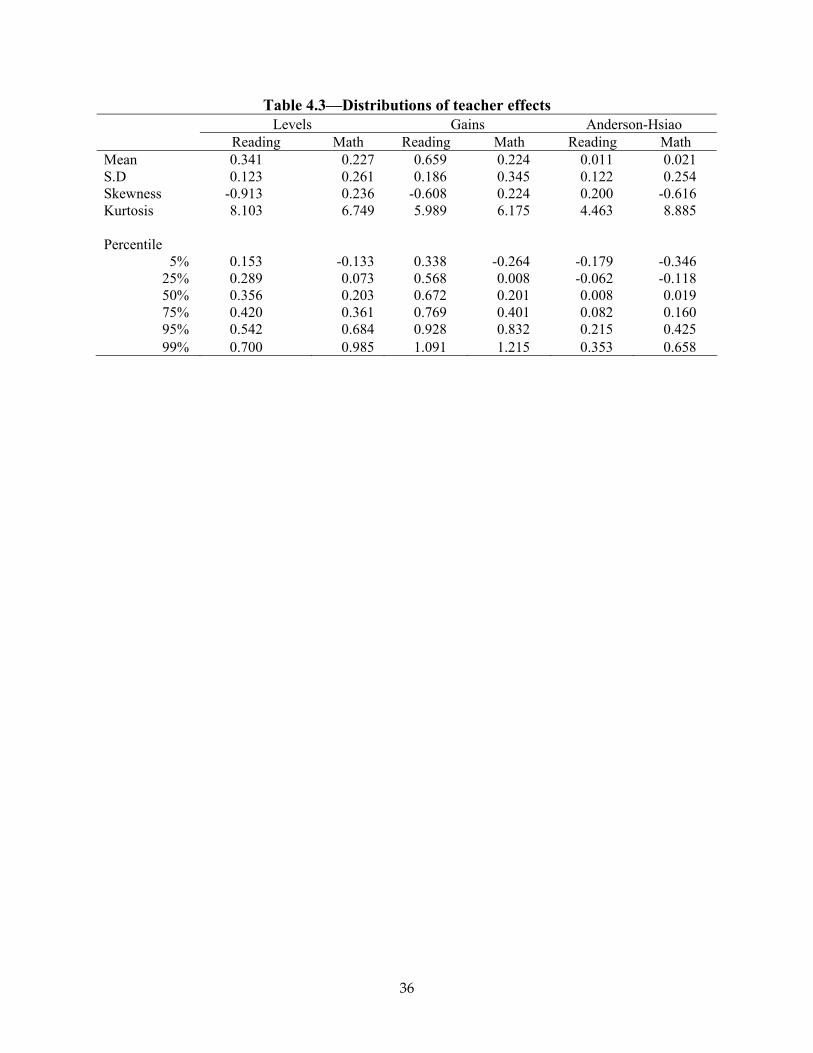
In order to gain insight on the distribution of our estimates of teacher quality,
Table 4.3 describes details of the distribution of empirical Bayes estimates of teacher
fixed effects. The interquartile range (the 25th to 75th percentile) is about 0.13 to 0.28
points in levels, 0.2 to 0.39 points in gains, and 0.14 to 0.28 in the Anderson-Hsiao
specification. The skewness measures indicate that in math scores the distribution of
teacher fixed effects for the levels and gains models has slightly more mass probability in
the left of the distribution than a normal distributed variable (skewness=0). On the other
hand, the distribution of teacher fixed effects has slightly more mass probability in the
right of the distribution than a normal distributed variable in the case of reading scores in
these models. The opposite results are found for the Anderson-Hsiao specification. The
kurtosis coefficients indicate that the distributions of teacher fixed effects have, in all
cases, higher probability than a normally distributed variable of values near the mean.
23
Teacher Quality and Observed Teacher Characteristics
Second-stage regressions are used to identify how time-invariant teacher
characteristics affect student achievement in the classroom. Teacher characteristics
include a set of dummies for teacher experience, gender, race/ethnicity, education level,
teacher licensure scores and a dummy variable indicating if the teacher holds an
elementary school credential. To avoid problems of multicollinearity and to provide a
clearer interpretation of the results, different linear regression models are estimated
including, as explanatory variables, each of the licensure test results both jointly and
separately.
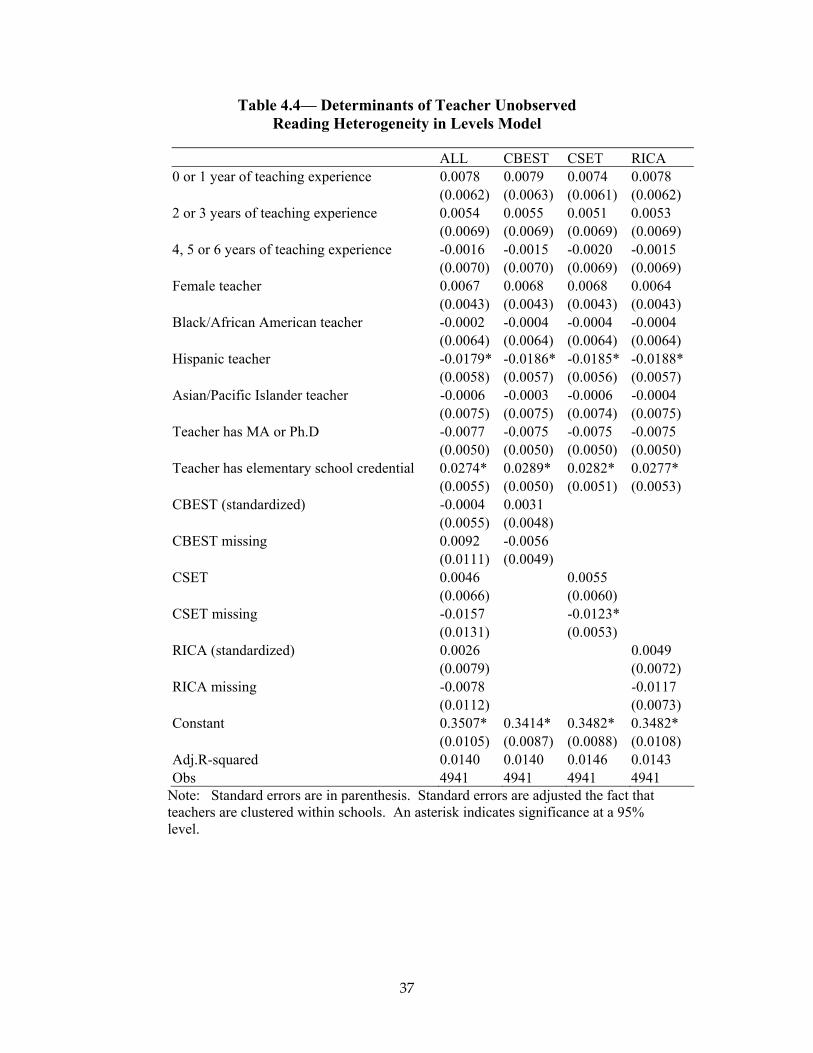
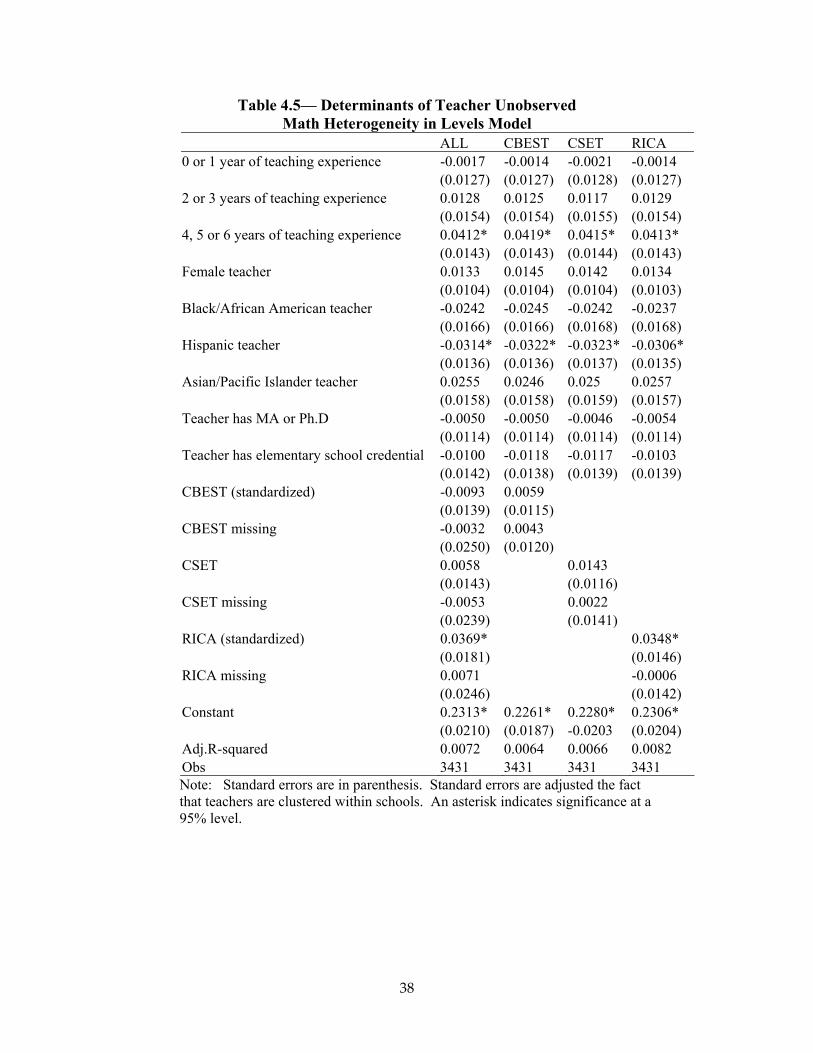
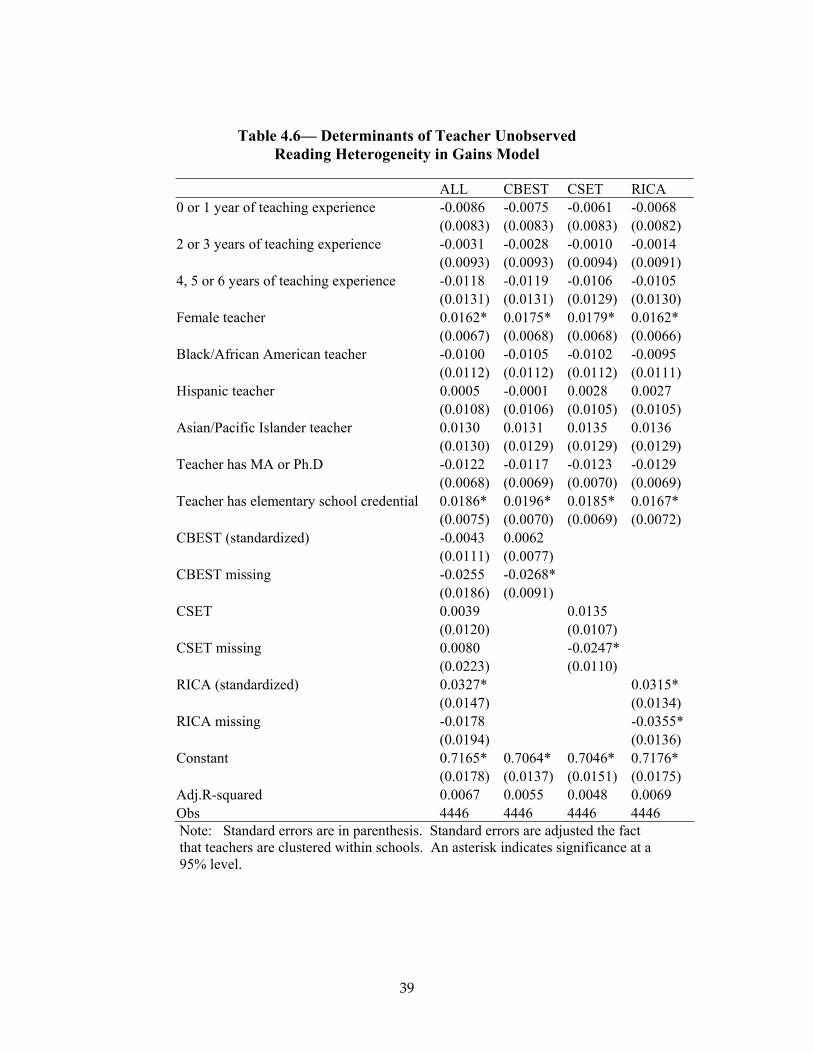
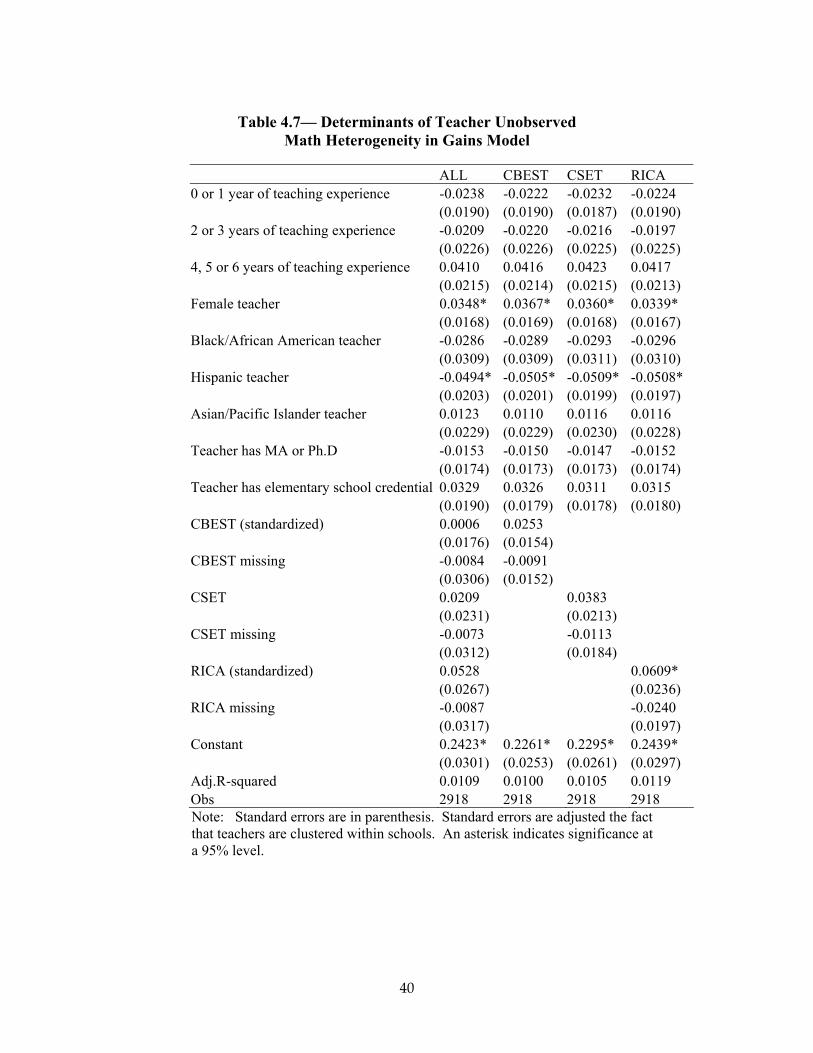
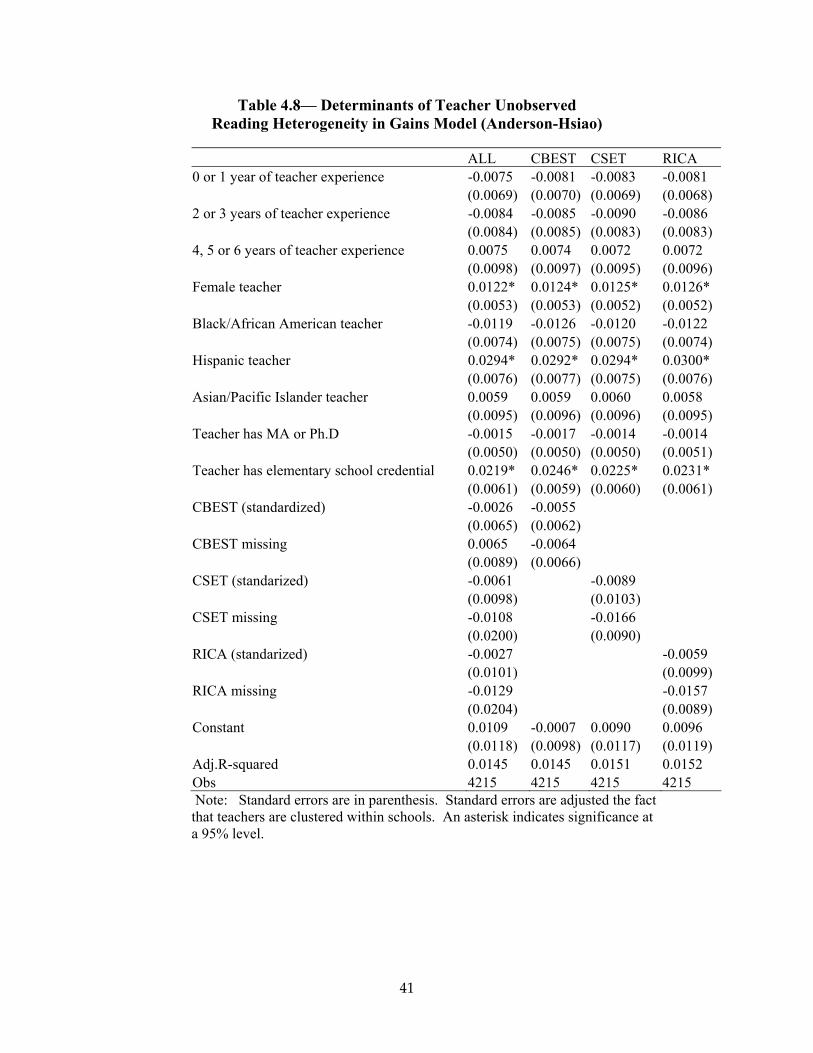
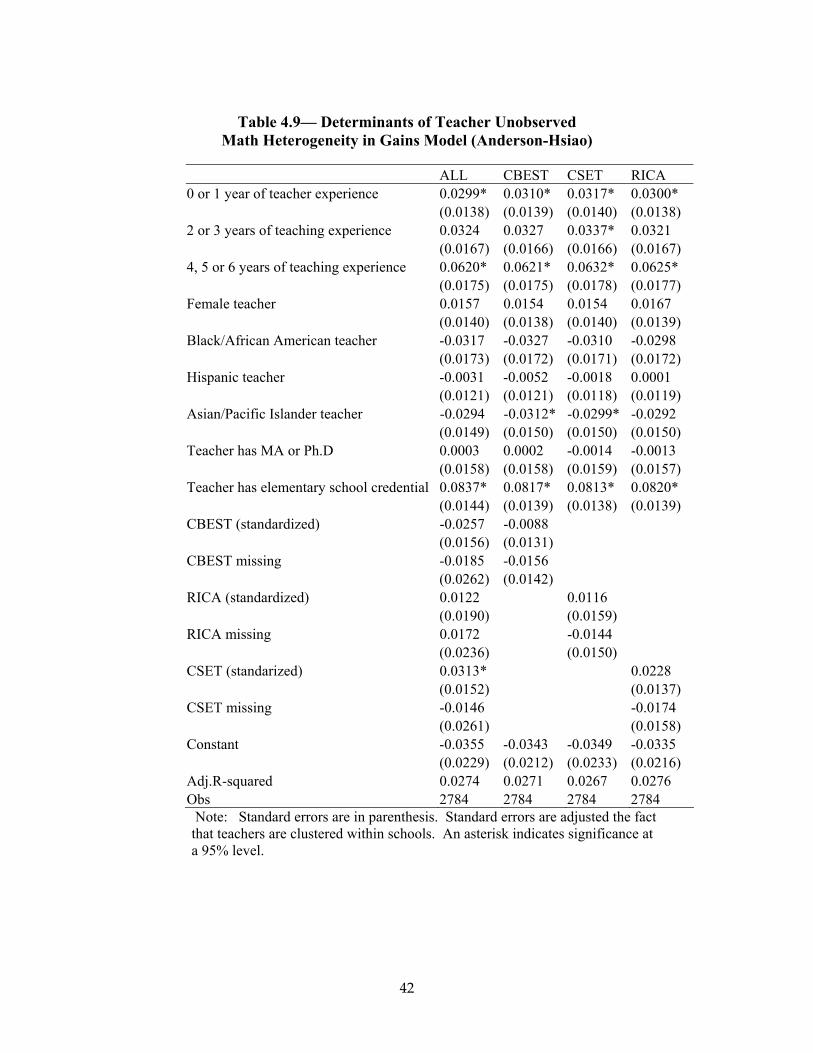
Tables 4.4 and 4.5 show the results for reading and math student test results
obtained for the levels specification. Tables 4.6 and 4.7 and Tables 4.7 and 4.8 show the
equivalent results for the gains and Anderson-Hsiao specifications, respectively. The
teacher experience has no significant effect on reading scores in either model. Teachers
with 4, 5 or 6 years of experience have a higher student performance in math than more
or less experienced teachers (the effect is only statistically significant in the levels and
Anderson Hsiao specifications), but the magnitude of the effect is small. Female teachers
have a positive and significant effect both in reading and in math for the specification in
gains and in reading for the Anderson-Hsiao specification, but the effects are
insignificant in the levels model. Teachers with masters or a doctorate degree do no better
or worse in either reading or math than comparable teachers without advanced degrees.
Students with Hispanic teachers perform worse in math than with a white non-Hispanic
teacher in the levels and gains models. Hispanic teachers perform better in reading in the
Anderson-Hsiao specification.
24
The teacher licensure scores have little if any effect on classroom student
achievement. The CBEST, CSET, and RICA variables are all insignificant in the reading
models. Only RICA has a positive and significant effect in math for the specification in
levels and in reading for the specification in gains. However, teachers with an elementary
school credential perform better in reading for all specifications and in math for the
Anderson-Hsiao specification.
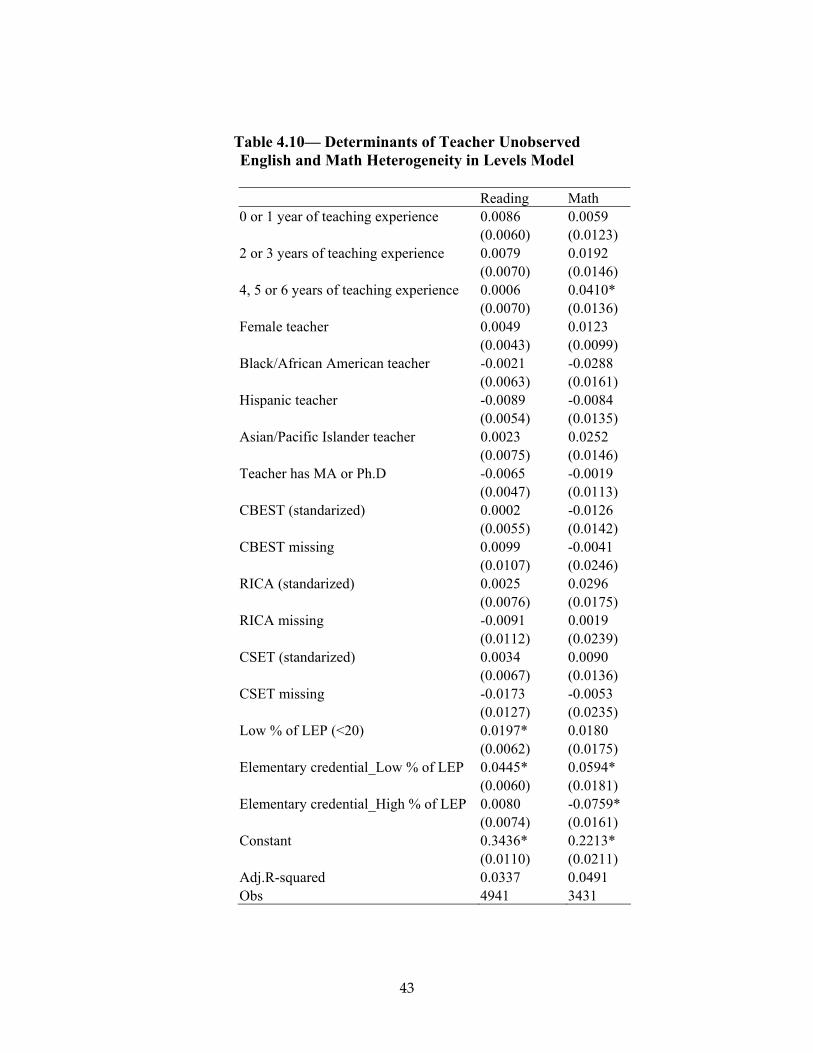
In Table 4.10, we examine whether teachers with elementary credentials are
relatively better suited to handling high concentrations of LEP students than are teachers
with secondary credentials. In order to do so, we allow the effect of having an elementary
school credential to vary depending if the teacher regularly teaches a high proportion of
LEP students or not. LEP students may require extra teacher attention and detract from
teacher overall productivity in the classroom, so we also incorporated a control for having
a high concentration of LEP students in the classroom. The results show that high
concentrations of LEP students reduce reading scores but not math scores. Having an
elementary school credential has a positive effect on achievement of groups that have a
low proportion of LEP students. On the contrary, it has no effect on reading achievement
if the proportion of LEP students is high and it can have a negative effect on math
achievement.
Student Quality and Observed Student Characteristics
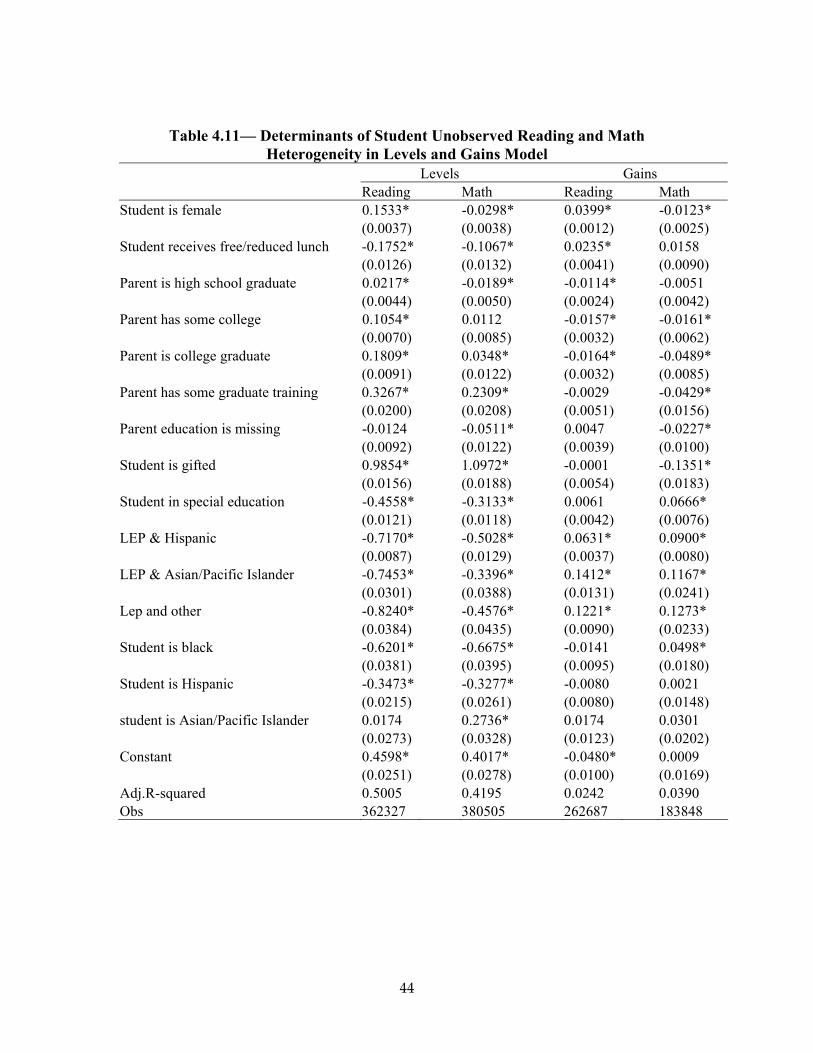
Table 4.11 shows how observed student characteristics explain differences in
unobserved student heterogeneity. The explanatory variables are gender, race/ethnicity,
LEP indicator, whether the student receives free/reduced school lunch, parent’s education
variables, and indicators for students that are enrolled in a gifted or special education
25
program. The table includes reading and math specifications for the levels and gains
models.
The level results show large differences in achievement scores across different
student types. In general, black and Hispanic students have lower scores than non-
Hispanic white students. Asian/Pacific Islander students have higher performance in math
than non-Hispanic white students. Girls do better in reading and worse in math than do
boys. LEP students perform worse than non LEP students although the gap is higher in
reading than in math.
Socioeconomic status is a strong predictor of student success in the levels model.
Students in the free/reduced lunch program have lower scores in both reading and math.
Parental education has a positive effect on reading and math scores, but the magnitude of
the effect is smaller in math. Greater family wealth may affect students through greater
resources in the home to complement schoolhouse learning. Alternatively, these parents
may place greater emphasis on student learning or provide more support for their
children. Finally, gifted and special education students have much different scores than
other students and the effects have the expected sign.
One issue for the gains model is that little student-level heterogeneity remains
after computing the gain score and remaining student effects reflect differences in growth
rates for particular groups. The results show that black students have higher growth in
math than white non-Hispanics. LEP students have higher growth both in reading and
math than English proficient students—this may reflect students “catching up” as they
become more proficient in English. Girls have higher growth rates than boys in reading
but lower growth in math.
26
Socioeconomic status effects are smaller in gains than in levels. Free/reduced
lunch students have higher growth in reading than others, but the growth effect is
insignificant in math. Growth rates in reading are negatively related to parental education.
Finally, growth rates seem to be lower for gifted students and higher for special
education students. The reasons for these effects are unclear. Perhaps gifted students
enter the program after a very strong year and then regress to the mean. Special education
students may be improving and learning to adapt to their problems. The gifted and special
education programs are not a focus of this study, and further investigation is needed to
sort out how and why these students have these achievement patterns.
5. Conclusions and Implications
Teacher quality is an important determinant of middle student achievement, but
measured teacher qualifications and preparation explain little of the observed differences
in student outcomes across teachers. Traditional measures of teacher quality like
experience and advanced degrees are drivers of salaries, but these measures are largely
unrelated to how well teachers perform in the classroom. Teachers with elementary
credentials have slightly better outcomes than teachers with more specialized knowledge
of ELA and math represented by secondary credentials. Student achievement is unrelated
to how well teachers do on the licensure exams—measured teacher aptitude, subject-
matter knowledge, and pedagogical proficiency have no bearing on classroom success.
The weak effects of measured teacher qualifications have important implications
for improving test scores in low-performing middle schools. Efforts to improve the
teaching performance in these schools are unlikely to succeed, if they rely entirely on
teacher experience, educational attainment, credential type, or licensure scores. A simple
27
reshuffling of teachers is unlikely to produce substantial achievement improvement in
low-performing schools.
A limitation of the data is that licensure tests and teacher performance are
available only for teachers who pass the tests. Licensure tests are designed to set
minimum teaching proficiency standards. Potential teachers who fall below the cut scores
on the licensure tests might indeed have worse classroom outcomes than teachers who
ultimately surpass those cut scores.
Different test content might change the measured relationship with student
achievement. Perhaps education experts should rethink the knowledge requirements for
new teachers and develop tests that more accurately predict classroom performance.
Different standards might restrict entry into the teacher profession, however, and have
adverse consequences for teacher supply (Angrist and Guryan, 2003).
An alternative explanation for the weak effects of teacher quality measures on
student achievement is that teaching effort is inversely related to those quality measures.
More experienced or better educated or more skilled teachers (as measured by licensure
exams) may inherently be better able to teach, but they may not persistently practice
those abilities in the classroom. The current compensation system rewards measured
teacher inputs and not performance per se. Perhaps this system provides too little
incentive for the “best” teachers to deliver their best performance in the classroom on a
consistent basis.
28
References
Aaronson, D., Barrow, L., Sander, W., 2007. Teachers and Student Achievement in the Chicago Public High Schools, Journal of Labor Economics, 25(1), 95-135. Abowd, J., Creecy, R., Kramarz, F., 2002, “Computing Person and Firm Effects Using Linked Longitudinal Employer-Employee Data,” Cornell University Working Paper. Abowd, J., Kramarz, F., Margolis, D., 1999. High Wage Workers and High Wage Firms, Econometrica, 67 (2), 251-333. Anderson, T.W., Hsiao, C., 1981. Estimation of Dynamic Models with Error Components, Journal of the American Statistical Association, 76, 598-606. Angrist, J., Lang, K., 2002. How Important Are Classroom Peer Effects? Evidence from Boston’s Metco Program, NBER working Paper 9263. Angrist, J. , Guryan, J., 2003. Does Teacher Testing Raise Teacher Quality? Evidence from State Certification Requirements, NBER working paper 9545. Arellano, M., Bond, S., 1991. Some tests of Specification for Panel Data: Monte Carlo Evidence and an Application to Employment Equations, Review of Economic Studies, 58, 277-298. Balfanz, R., & Herzog, L., 2006. Keeping middle grade students on track to graduation. Philadelphia, PA: Philadelphia Education Fund. Borjas, G., 1987. Self-Selection and the Earning of Immigrants, American Economic Review, 77(4), 531-553. Buddin, R., McCaffrey, D., Kirby, S., Xia, N., 2007. Merit Pay for Florida Teachers: Design and Implementation Issues, Working paper, RAND WR-508-FEA. Buddin, R., Zamarro, G., 2008. Teacher Quality, Teacher Licensure Tests, and Student Achievement, Working paper, RAND WR-555-IES. Buddin, R., Zamarro, G., 2009. Teacher Qualifications and Student Achievement in Urban Elementary Schools, Journal of Urban Economics. Clotfelter, C., Ladd, H., Vigdor, J., 2007. How and Why Do Teacher Credentials Matter for Student Achievement? NBER Working Paper 12828. Corneliβen, T., 2006. Using Stata for a Memory Saving Fixed Effects Estimation of the Three-way Error Component Model, Working paper, FDZ Methodenreport nr. 3. Cullen, J., Jacob, B., 2007. Is Gaining Access to Selective Elementary Schools Gaining Ground? Evidence from Randomized Lotteries, NBER Working Paper 13443.
29
Dee, T., 2005. A Teacher Like Me: Does Race, Ethnicity, or Gender Matter? American Economic Review, 95(2), 558-565 Ehrenberg, R., Brewer, D., 1995. Did teachers’ verbal ability and race matter in the 1960’s? Coleman revisited, Economics of Education Review, 141, 1-21. Ferguson, R., Ladd, H., 1996. How and why money matters: An analysis of Alabama schools, In H.Ladd (Ed.), Holding schools accountable: Performance-based reform in education, 265-298. Washington, DC: Brookings Institute. Ferguson, R., 1991. Paying for public education: New evidence on how and why money matters, Harvard Journal on Legislation, 282, 465-498. Goldhaber, D., 2007. Everyone’s Doing It, But What Does Teacher Testing Tell Us About Teacher Effectiveness? Journal of Human Resources, 42(4), 765-794. Guimaraes, P., Portugal, P., 2009. “A Simple Feasible Alternative Procedure to Estimate Models with High-Dimensional Fixed Effects,” Institute for the Study of Labor. Harris, D., Sass, T., 2006a. The Effects of Teacher Training on Teacher Value-Added, Working paper, Florida State University. Harris, D., Sass, T., 2006b. Value-Added Models and the Estimation of Teacher Quality, Working paper, Florida State University. Hanushek, E., 1986. The Economics of Schooling: Production and Efficiency in Public Schools, Journal of Economic Literature, 24(4), 1141-1177. Horn, L., & Nunez, A. M., 2000. Mapping the road to college: First-generation students’ math track. Washington, D.C.: U.S. Department of Education, National Center for Education Statistics.
Hoxby, C., 2000. Peer effects in the classroom: Learning from gender and race variation. Working Paper 7867, National Bureau of Economic Research. Jacob, B., Lefgren, L., 2008. Can Principals Identify Effective Teachers? Evidence on Subjective Performance Evaluation in Education, Journal of Labor Economics, 26(1), pp. 101-136. Jacobson, P., Suckow, M., 2006. Report on Passing Rates of Commission-Approved Exams For 2000-01 to 2004-05, California Commission on Teacher Credentialing. Koedel, C., Betts, J., 2007. Re-Examining the Role of Teacher Quality in the Educational Production Function, Working paper, University of California, San Diego.
30
Kramarz, F., Machin, S., Ouazad, A., 2007. What Makes a Test Score? Pupils, Schools and Peers in Achievement in English Primary Education, Working paper. Lazear, E., 1986. Salaries and Piece Rates, Journal of Business, 59(3), 405-31. Lazear, E., 2000. Performance Pay and Productivity, American Economic Review, 93(5), 1346-61. Le, V., Buddin, R., 2005., Examining the Validity Evidence for California Teacher Licensure Exams, Working paper, RAND WR-334-EDU. Murnane, R. & Steele, J., 2008. What Is the Problem? The Challenge of Providing Effective Teachers for All Children, Project Muse, 17(1), 15-43. Ouazad, A., 2007. Assessed by a Teacher Like Me: Race, Gender and Subjective Evaluations, Working paper, London School of Economics. Rivkin, S., Hanushek, E., Kain, J., 2005. Teachers, Schools, and Academic Achievement, Econometrica, 73(2), 417-458. Rowan, B., Chaing, F., Miller, R.J., 1997. Using research on employees’ performance to study the effects of teachers on students’ achievement, Sociology of Education, 704, 256-284. Rowan, B., Correnti R., Miller, R. J., 2002. What large-scale research tells us about teacher effects on student achievement: Insights from the Prospects study of elementary schools, Teachers College Record, 104(8), 1525-1567. Rubin, D., 1996. Multiple Imputation after 18+ Years, Journal of the American Statistical Association, 91, 473-489. Sacerdote, B., 2001. Peer effects with random assignment: Results for Dartmouth roommates, Quarterly Journal of Economics, 116(2), 681–704. Silver, D., Saunders, M., Zarate, E., 2008. What Factors Predict High School Graduation in the Los Angeles Unified School District, California Dropout Research Project Report #14. Steele, J., 2008. Do Financial Incentives Help Low-Performing Schools Attract and Keep Academically Talented Teachers? Evidence from California, Working paper, Harvard University. Strauss, R., Sawyer, E., 1986. Some New Evidence on Teacher and Student Competencies, Economics of Education Review, 5(1), 41-48.
31
Todd, P., Wolpin, K., 2003. On the Specification and Estimation of the Production Function for Cognitive Achievement, Economic Journal, 113, F3-F33. Wright, S., Horn, S., Sanders, W., 1997. Teacher and classroom context effects on student achievement: Implications for teacher evaluation, Journal of Personnel Evaluation in Education, 11, 57–67. Zao A., & Betts, J., 2008. Predicting Success, Preventing Failure: An Investigation of the California High School Exit Examination. Public Policy Institute of California. Zarate, M., 2008. The Role of Middle Schools in High School Graduation and College Enrollment. United Way of Greater Los Angeles. Zarate, M., Ruzek, E., Silver, D., 2008. Middle School Influences on High School Graduation and College Readiness in Los Angeles Unified School District, United Way of Greater Los Angeles. Zimmerman, D., 1999. Peer effects in academic outcomes: Evidence from a natural experiment. Working paper, Williams College.
32
Table 2.1—Summary of Panel Studies of Teacher Effectiveness
Heterogeneity
Study/Data Model specification Student Controls
Teacher Controls
Observed teacher characteristics
Results
Rivkin, Hanushek and Kain (2005); Texas, 4th -6thgrades
Value Added Gains Yes No Education and experience
Small effects
Jacob & Lefgren (2008); Anonymous district, 2nd-7th grades
Value Added Gains, Contemporaneous value added
Yes Yes Education, experience, and principal assessments
Small effects
Harris & Sass (2006a); Florida, 3rd to 10th grades
Value added Gains Yes Yes Education, experience, in-service training, and scholastic aptitude
Small effects
Clotfelter, Ladd and Vigdor (2007); North Carolina, 3rd to 5th grades
Contemporaneous Value Added, Value Added Gains (with lagged score and model in gain scores).
Yes No Education, experience, licensure test results, national board certification, and quality of under-graduate institution
Positive effects- bigger in math than reading
Goldhaber (2007); North Carolina, 3rd to 6th grades
Value Added Gains (with lagged score and model in gain scores).
Yes No Education, experience, and licensure test results
Small effects
Aaronson, Barrow and Sander (2007); Chicago, 8th-9th grades
Value Added Gains (lagged score)
Yes Yes Education, experience, and certification type
No effects
Koedel & Betts (2007); San Diego, 3rd-5th grades
Value Added Gains (with lagged score and model in gain scores).
Yes Yes Education, experience, and credential information
Small effects
33
Table 3.1—Characteristics of Students
Student Characteristic ProportionBlack 0.11 Hispanic 0.72 Asian/Pacific Islander 0.07 Female 0.51 Limited English Proficiency 0.29 Free/reduced lunch 0.75 Highest Parental Education High school diploma 0.18 Some college 0.12 College graduate 0.12 Some graduate school 0.05
13 13
2
13 13
45
0
5
10
15
20
25
30
35
40
45
50
Not PI PI 1 Year PI 2 Years PI 3 Years PI 4 Years PI 5 Years
Program Improvement (PI) Status
Per
cent
age
of M
iddl
e S
cho
ols
Figure 3.1—Program Improvement Status for LAUSD Middle Schools in 2007
34
Table 3.2--Comparison of Student and Teacher Characteristics in Schools with Lowest and Highest Test Scores in 2007
School Characteristic
Lowest Quartile Schools
Highest Quartile Schools
Enrollment 2430 1641 Student Characteristics Reading (Standardized) -0.36 0.50 Math (Standardized) -0.40 0.50 Black 0.19 0.13 Hispanic 0.79 0.52 Limited English Proficiency 0.37 0.14 Parents Not High School Graduates 0.48 0.20 ELA & Math Teacher Characteristics Elementary Credential 0.28 0.48 Experience 6.87 11.33 Black 0.21 0.05 Hispanic 0.29 0.18 Master's/Doctorate 0.25 0.33 General Aptitude (Standardized) -0.23 -0.14
Table 4.1—Comparison of Student, Teacher, and School Fixed Effects
Reading Math #1. Student & Teacher Fixed Effects Student (Student) 0.26 0.40 Teacher (Teacher) 0.12 0.31 #2. Student & School Fixed Effects Student (Student) 0.26 0.40 School (School) 0.07 0.19
35
Table 4.2—Estimates of Contemporaneous Value-Added
and Value-Added Gains Models
Levels Gains Anderson-Hsiao
Variable Reading Math Reading Math Reading Math Class Size -0.00005* 0.00035* -0.00015* 0.00029* 0.00006* -0.00020* (0.00002) (0.00003) (0.00004) (0.00006) (0.00002) (0.00003)Percent Female in Class 0.02223* -0.03788* 0.00366 -0.01564 0.02606* 0.13011* (0.00977) (0.01899) (0.01852) (0.0342) (0.00805) (0.01361)Percent Black in Class -0.0084 -0.16265* 0.10514* -0.25815* 0.01724 0.02461 (0.01621) (0.02648) (0.03111) (0.04756) (0.01081) (0.01716)Percent Hispanic in Class -0.03835* -0.13032* 0.10238* -0.09826* 0.00454 0.07715* (0.01315) (0.02118) (0.02504) (0.03752) (0.00862) (0.01364)Percent Asian/Pacific Islander in Class 0.01189 -0.51639* 0.07036 -0.65772* 0.05621* 0.12398* (0.02173) (0.0348) (0.04128) (0.0617) (0.01473) (0.02342)Hispanic Student & Teacher -0.00213 0.00711 0.00322 0.02604* -0.00846* 0.01218* (0.00281) (0.00687) (0.0052) (0.01205) (0.00162) (0.00242)Black Student & Teacher 0.00185 0.00281 0.00887 0.00521 0.00783 0.00108 (0.00459) (0.00799) (0.00885) (0.01449) (0.00422) (0.00647)Asian/Pacific Islander Student & Teacher -0.00121 -0.0043 -0.00973 -0.01556 -0.01689* 0.04492* (0.00701) (0.00861) (0.01302) (0.01484) (0.00837) (0.01016)Female Student & Teacher 0.00731* 0.01178* 0.00512 0.01992* 0.01229* 0.02720* (0.00211) (0.00335) (0.00389) (0.00585) (0.00169) (0.00252)Lagged Test score 0.14953* 0.38904* (0.00383) (0.00576)
Number of Observations 929628 797285 678989 463852 641470 470366 Number of Students 362327 380505 262687 183848 362659 310216
Number of Teachers 5047 3564 4538 3043 5004 3412
36
Table 4.3—Distributions of teacher effects Levels Gains Anderson-Hsiao Reading Math Reading Math Reading Math
Mean 0.341 0.227 0.659 0.224 0.011 0.021 S.D 0.123 0.261 0.186 0.345 0.122 0.254 Skewness -0.913 0.236 -0.608 0.224 0.200 -0.616 Kurtosis 8.103 6.749 5.989 6.175 4.463 8.885 Percentile
5% 0.153 -0.133 0.338 -0.264 -0.179 -0.346 25% 0.289 0.073 0.568 0.008 -0.062 -0.118 50% 0.356 0.203 0.672 0.201 0.008 0.019 75% 0.420 0.361 0.769 0.401 0.082 0.160 95% 0.542 0.684 0.928 0.832 0.215 0.425 99% 0.700 0.985 1.091 1.215 0.353 0.658
37
Table 4.4— Determinants of Teacher Unobserved Reading Heterogeneity in Levels Model
ALL CBEST CSET RICA 0 or 1 year of teaching experience 0.0078 0.0079 0.0074 0.0078 (0.0062) (0.0063) (0.0061) (0.0062) 2 or 3 years of teaching experience 0.0054 0.0055 0.0051 0.0053 (0.0069) (0.0069) (0.0069) (0.0069) 4, 5 or 6 years of teaching experience -0.0016 -0.0015 -0.0020 -0.0015 (0.0070) (0.0070) (0.0069) (0.0069) Female teacher 0.0067 0.0068 0.0068 0.0064 (0.0043) (0.0043) (0.0043) (0.0043) Black/African American teacher -0.0002 -0.0004 -0.0004 -0.0004 (0.0064) (0.0064) (0.0064) (0.0064) Hispanic teacher -0.0179* -0.0186* -0.0185* -0.0188* (0.0058) (0.0057) (0.0056) (0.0057) Asian/Pacific Islander teacher -0.0006 -0.0003 -0.0006 -0.0004 (0.0075) (0.0075) (0.0074) (0.0075) Teacher has MA or Ph.D -0.0077 -0.0075 -0.0075 -0.0075 (0.0050) (0.0050) (0.0050) (0.0050) Teacher has elementary school credential 0.0274* 0.0289* 0.0282* 0.0277* (0.0055) (0.0050) (0.0051) (0.0053) CBEST (standardized) -0.0004 0.0031 (0.0055) (0.0048) CBEST missing 0.0092 -0.0056 (0.0111) (0.0049) CSET 0.0046 0.0055 (0.0066) (0.0060) CSET missing -0.0157 -0.0123* (0.0131) (0.0053) RICA (standardized) 0.0026 0.0049 (0.0079) (0.0072) RICA missing -0.0078 -0.0117 (0.0112) (0.0073) Constant 0.3507* 0.3414* 0.3482* 0.3482* (0.0105) (0.0087) (0.0088) (0.0108) Adj.R-squared 0.0140 0.0140 0.0146 0.0143 Obs 4941 4941 4941 4941
Note: Standard errors are in parenthesis. Standard errors are adjusted the fact that teachers are clustered within schools. An asterisk indicates significance at a 95% level.
38
Table 4.5— Determinants of Teacher Unobserved Math Heterogeneity in Levels Model
ALL CBEST CSET RICA 0 or 1 year of teaching experience -0.0017 -0.0014 -0.0021 -0.0014 (0.0127) (0.0127) (0.0128) (0.0127) 2 or 3 years of teaching experience 0.0128 0.0125 0.0117 0.0129 (0.0154) (0.0154) (0.0155) (0.0154) 4, 5 or 6 years of teaching experience 0.0412* 0.0419* 0.0415* 0.0413* (0.0143) (0.0143) (0.0144) (0.0143) Female teacher 0.0133 0.0145 0.0142 0.0134 (0.0104) (0.0104) (0.0104) (0.0103) Black/African American teacher -0.0242 -0.0245 -0.0242 -0.0237 (0.0166) (0.0166) (0.0168) (0.0168) Hispanic teacher -0.0314* -0.0322* -0.0323* -0.0306* (0.0136) (0.0136) (0.0137) (0.0135) Asian/Pacific Islander teacher 0.0255 0.0246 0.025 0.0257 (0.0158) (0.0158) (0.0159) (0.0157) Teacher has MA or Ph.D -0.0050 -0.0050 -0.0046 -0.0054 (0.0114) (0.0114) (0.0114) (0.0114) Teacher has elementary school credential -0.0100 -0.0118 -0.0117 -0.0103 (0.0142) (0.0138) (0.0139) (0.0139) CBEST (standardized) -0.0093 0.0059 (0.0139) (0.0115) CBEST missing -0.0032 0.0043 (0.0250) (0.0120) CSET 0.0058 0.0143 (0.0143) (0.0116) CSET missing -0.0053 0.0022 (0.0239) (0.0141) RICA (standardized) 0.0369* 0.0348* (0.0181) (0.0146) RICA missing 0.0071 -0.0006 (0.0246) (0.0142) Constant 0.2313* 0.2261* 0.2280* 0.2306* (0.0210) (0.0187) -0.0203 (0.0204) Adj.R-squared 0.0072 0.0064 0.0066 0.0082 Obs 3431 3431 3431 3431 Note: Standard errors are in parenthesis. Standard errors are adjusted the fact that teachers are clustered within schools. An asterisk indicates significance at a 95% level.
39
Table 4.6— Determinants of Teacher Unobserved Reading Heterogeneity in Gains Model
ALL CBEST CSET RICA 0 or 1 year of teaching experience -0.0086 -0.0075 -0.0061 -0.0068 (0.0083) (0.0083) (0.0083) (0.0082) 2 or 3 years of teaching experience -0.0031 -0.0028 -0.0010 -0.0014 (0.0093) (0.0093) (0.0094) (0.0091) 4, 5 or 6 years of teaching experience -0.0118 -0.0119 -0.0106 -0.0105 (0.0131) (0.0131) (0.0129) (0.0130) Female teacher 0.0162* 0.0175* 0.0179* 0.0162* (0.0067) (0.0068) (0.0068) (0.0066) Black/African American teacher -0.0100 -0.0105 -0.0102 -0.0095 (0.0112) (0.0112) (0.0112) (0.0111) Hispanic teacher 0.0005 -0.0001 0.0028 0.0027 (0.0108) (0.0106) (0.0105) (0.0105) Asian/Pacific Islander teacher 0.0130 0.0131 0.0135 0.0136 (0.0130) (0.0129) (0.0129) (0.0129) Teacher has MA or Ph.D -0.0122 -0.0117 -0.0123 -0.0129 (0.0068) (0.0069) (0.0070) (0.0069) Teacher has elementary school credential 0.0186* 0.0196* 0.0185* 0.0167* (0.0075) (0.0070) (0.0069) (0.0072) CBEST (standardized) -0.0043 0.0062 (0.0111) (0.0077) CBEST missing -0.0255 -0.0268* (0.0186) (0.0091) CSET 0.0039 0.0135 (0.0120) (0.0107) CSET missing 0.0080 -0.0247* (0.0223) (0.0110) RICA (standardized) 0.0327* 0.0315* (0.0147) (0.0134) RICA missing -0.0178 -0.0355* (0.0194) (0.0136) Constant 0.7165* 0.7064* 0.7046* 0.7176* (0.0178) (0.0137) (0.0151) (0.0175) Adj.R-squared 0.0067 0.0055 0.0048 0.0069 Obs 4446 4446 4446 4446 Note: Standard errors are in parenthesis. Standard errors are adjusted the fact that teachers are clustered within schools. An asterisk indicates significance at a 95% level.
40
Table 4.7— Determinants of Teacher Unobserved
Math Heterogeneity in Gains Model
ALL CBEST CSET RICA 0 or 1 year of teaching experience -0.0238 -0.0222 -0.0232 -0.0224 (0.0190) (0.0190) (0.0187) (0.0190) 2 or 3 years of teaching experience -0.0209 -0.0220 -0.0216 -0.0197 (0.0226) (0.0226) (0.0225) (0.0225) 4, 5 or 6 years of teaching experience 0.0410 0.0416 0.0423 0.0417 (0.0215) (0.0214) (0.0215) (0.0213) Female teacher 0.0348* 0.0367* 0.0360* 0.0339* (0.0168) (0.0169) (0.0168) (0.0167) Black/African American teacher -0.0286 -0.0289 -0.0293 -0.0296 (0.0309) (0.0309) (0.0311) (0.0310) Hispanic teacher -0.0494* -0.0505* -0.0509* -0.0508* (0.0203) (0.0201) (0.0199) (0.0197) Asian/Pacific Islander teacher 0.0123 0.0110 0.0116 0.0116 (0.0229) (0.0229) (0.0230) (0.0228) Teacher has MA or Ph.D -0.0153 -0.0150 -0.0147 -0.0152 (0.0174) (0.0173) (0.0173) (0.0174) Teacher has elementary school credential 0.0329 0.0326 0.0311 0.0315 (0.0190) (0.0179) (0.0178) (0.0180) CBEST (standardized) 0.0006 0.0253 (0.0176) (0.0154) CBEST missing -0.0084 -0.0091 (0.0306) (0.0152) CSET 0.0209 0.0383 (0.0231) (0.0213) CSET missing -0.0073 -0.0113 (0.0312) (0.0184) RICA (standardized) 0.0528 0.0609* (0.0267) (0.0236) RICA missing -0.0087 -0.0240 (0.0317) (0.0197) Constant 0.2423* 0.2261* 0.2295* 0.2439* (0.0301) (0.0253) (0.0261) (0.0297) Adj.R-squared 0.0109 0.0100 0.0105 0.0119 Obs 2918 2918 2918 2918 Note: Standard errors are in parenthesis. Standard errors are adjusted the fact that teachers are clustered within schools. An asterisk indicates significance at a 95% level.
41
Table 4.8— Determinants of Teacher Unobserved Reading Heterogeneity in Gains Model (Anderson-Hsiao)
ALL CBEST CSET RICA 0 or 1 year of teacher experience -0.0075 -0.0081 -0.0083 -0.0081 (0.0069) (0.0070) (0.0069) (0.0068) 2 or 3 years of teacher experience -0.0084 -0.0085 -0.0090 -0.0086 (0.0084) (0.0085) (0.0083) (0.0083) 4, 5 or 6 years of teacher experience 0.0075 0.0074 0.0072 0.0072 (0.0098) (0.0097) (0.0095) (0.0096) Female teacher 0.0122* 0.0124* 0.0125* 0.0126* (0.0053) (0.0053) (0.0052) (0.0052) Black/African American teacher -0.0119 -0.0126 -0.0120 -0.0122 (0.0074) (0.0075) (0.0075) (0.0074) Hispanic teacher 0.0294* 0.0292* 0.0294* 0.0300* (0.0076) (0.0077) (0.0075) (0.0076) Asian/Pacific Islander teacher 0.0059 0.0059 0.0060 0.0058 (0.0095) (0.0096) (0.0096) (0.0095) Teacher has MA or Ph.D -0.0015 -0.0017 -0.0014 -0.0014 (0.0050) (0.0050) (0.0050) (0.0051) Teacher has elementary school credential 0.0219* 0.0246* 0.0225* 0.0231* (0.0061) (0.0059) (0.0060) (0.0061) CBEST (standardized) -0.0026 -0.0055 (0.0065) (0.0062) CBEST missing 0.0065 -0.0064 (0.0089) (0.0066) CSET (standarized) -0.0061 -0.0089 (0.0098) (0.0103) CSET missing -0.0108 -0.0166 (0.0200) (0.0090) RICA (standarized) -0.0027 -0.0059 (0.0101) (0.0099) RICA missing -0.0129 -0.0157 (0.0204) (0.0089) Constant 0.0109 -0.0007 0.0090 0.0096 (0.0118) (0.0098) (0.0117) (0.0119) Adj.R-squared 0.0145 0.0145 0.0151 0.0152 Obs 4215 4215 4215 4215 Note: Standard errors are in parenthesis. Standard errors are adjusted the fact that teachers are clustered within schools. An asterisk indicates significance at a 95% level.
42
Table 4.9— Determinants of Teacher Unobserved
Math Heterogeneity in Gains Model (Anderson-Hsiao)
ALL CBEST CSET RICA 0 or 1 year of teacher experience 0.0299* 0.0310* 0.0317* 0.0300* (0.0138) (0.0139) (0.0140) (0.0138) 2 or 3 years of teaching experience 0.0324 0.0327 0.0337* 0.0321 (0.0167) (0.0166) (0.0166) (0.0167) 4, 5 or 6 years of teaching experience 0.0620* 0.0621* 0.0632* 0.0625* (0.0175) (0.0175) (0.0178) (0.0177) Female teacher 0.0157 0.0154 0.0154 0.0167 (0.0140) (0.0138) (0.0140) (0.0139) Black/African American teacher -0.0317 -0.0327 -0.0310 -0.0298 (0.0173) (0.0172) (0.0171) (0.0172) Hispanic teacher -0.0031 -0.0052 -0.0018 0.0001 (0.0121) (0.0121) (0.0118) (0.0119) Asian/Pacific Islander teacher -0.0294 -0.0312* -0.0299* -0.0292 (0.0149) (0.0150) (0.0150) (0.0150) Teacher has MA or Ph.D 0.0003 0.0002 -0.0014 -0.0013 (0.0158) (0.0158) (0.0159) (0.0157) Teacher has elementary school credential 0.0837* 0.0817* 0.0813* 0.0820* (0.0144) (0.0139) (0.0138) (0.0139) CBEST (standardized) -0.0257 -0.0088 (0.0156) (0.0131) CBEST missing -0.0185 -0.0156 (0.0262) (0.0142) RICA (standardized) 0.0122 0.0116 (0.0190) (0.0159) RICA missing 0.0172 -0.0144 (0.0236) (0.0150) CSET (standarized) 0.0313* 0.0228 (0.0152) (0.0137) CSET missing -0.0146 -0.0174 (0.0261) (0.0158) Constant -0.0355 -0.0343 -0.0349 -0.0335 (0.0229) (0.0212) (0.0233) (0.0216) Adj.R-squared 0.0274 0.0271 0.0267 0.0276 Obs 2784 2784 2784 2784 Note: Standard errors are in parenthesis. Standard errors are adjusted the fact that teachers are clustered within schools. An asterisk indicates significance at a 95% level.
43
Table 4.10— Determinants of Teacher Unobserved English and Math Heterogeneity in Levels Model
Reading Math 0 or 1 year of teaching experience 0.0086 0.0059 (0.0060) (0.0123) 2 or 3 years of teaching experience 0.0079 0.0192 (0.0070) (0.0146) 4, 5 or 6 years of teaching experience 0.0006 0.0410* (0.0070) (0.0136) Female teacher 0.0049 0.0123 (0.0043) (0.0099) Black/African American teacher -0.0021 -0.0288 (0.0063) (0.0161) Hispanic teacher -0.0089 -0.0084 (0.0054) (0.0135) Asian/Pacific Islander teacher 0.0023 0.0252 (0.0075) (0.0146) Teacher has MA or Ph.D -0.0065 -0.0019 (0.0047) (0.0113) CBEST (standarized) 0.0002 -0.0126 (0.0055) (0.0142) CBEST missing 0.0099 -0.0041 (0.0107) (0.0246) RICA (standarized) 0.0025 0.0296 (0.0076) (0.0175) RICA missing -0.0091 0.0019 (0.0112) (0.0239) CSET (standarized) 0.0034 0.0090 (0.0067) (0.0136) CSET missing -0.0173 -0.0053 (0.0127) (0.0235) Low % of LEP (<20) 0.0197* 0.0180 (0.0062) (0.0175) Elementary credential_Low % of LEP 0.0445* 0.0594* (0.0060) (0.0181) Elementary credential_High % of LEP 0.0080 -0.0759* (0.0074) (0.0161) Constant 0.3436* 0.2213* (0.0110) (0.0211) Adj.R-squared 0.0337 0.0491 Obs 4941 3431
44
Table 4.11— Determinants of Student Unobserved Reading and Math Heterogeneity in Levels and Gains Model
Levels Gains Reading Math Reading Math Student is female 0.1533* -0.0298* 0.0399* -0.0123* (0.0037) (0.0038) (0.0012) (0.0025) Student receives free/reduced lunch -0.1752* -0.1067* 0.0235* 0.0158 (0.0126) (0.0132) (0.0041) (0.0090) Parent is high school graduate 0.0217* -0.0189* -0.0114* -0.0051 (0.0044) (0.0050) (0.0024) (0.0042) Parent has some college 0.1054* 0.0112 -0.0157* -0.0161* (0.0070) (0.0085) (0.0032) (0.0062) Parent is college graduate 0.1809* 0.0348* -0.0164* -0.0489* (0.0091) (0.0122) (0.0032) (0.0085) Parent has some graduate training 0.3267* 0.2309* -0.0029 -0.0429* (0.0200) (0.0208) (0.0051) (0.0156) Parent education is missing -0.0124 -0.0511* 0.0047 -0.0227* (0.0092) (0.0122) (0.0039) (0.0100) Student is gifted 0.9854* 1.0972* -0.0001 -0.1351* (0.0156) (0.0188) (0.0054) (0.0183) Student in special education -0.4558* -0.3133* 0.0061 0.0666* (0.0121) (0.0118) (0.0042) (0.0076) LEP & Hispanic -0.7170* -0.5028* 0.0631* 0.0900* (0.0087) (0.0129) (0.0037) (0.0080) LEP & Asian/Pacific Islander -0.7453* -0.3396* 0.1412* 0.1167* (0.0301) (0.0388) (0.0131) (0.0241) Lep and other -0.8240* -0.4576* 0.1221* 0.1273* (0.0384) (0.0435) (0.0090) (0.0233) Student is black -0.6201* -0.6675* -0.0141 0.0498* (0.0381) (0.0395) (0.0095) (0.0180) Student is Hispanic -0.3473* -0.3277* -0.0080 0.0021 (0.0215) (0.0261) (0.0080) (0.0148) student is Asian/Pacific Islander 0.0174 0.2736* 0.0174 0.0301 (0.0273) (0.0328) (0.0123) (0.0202) Constant 0.4598* 0.4017* -0.0480* 0.0009 (0.0251) (0.0278) (0.0100) (0.0169) Adj.R-squared 0.5005 0.4195 0.0242 0.0390 Obs 362327 380505 262687 183848