international journal of issi, vol. 12 (2015), no. 2, pp....
TRANSCRIPT

1
The Effect of Cold Rolling Process on the Microstructure and Texture Evolution in a 1 wt. % Si Non-oriented Electrical Steel
A. Sonboli 1*, M. R. Toroghinejad 2, H. Edris 3 and J. A. Szpunar 4
1,2,3 Department of Materials Engineering, Isfahan University of Technology, Isfahan 84156- 83111, Iran4 Department of Mechanical Engineering, University of Saskatchewan, Saskatoon, SK, Canada S7N 5A9
* Corresponding authorEmail: [email protected]: Department of Materials Engineering, IsfahanUniversity of Technology, Isfahan 84156- 83111, Iran1. PhD Student2. Professor3. Professor4. Professor
1. Introduction
Non-oriented electrical steel sheets have been widely used as core materials in rotating machines in which rotational magnetic fields exist. Non-oriented electrical steel sheets with θ-fiber texture (<100> || ND) have two easy magnetization directions. This means two directions with high permeability in the rolling plane, such that they are expected to improve the efficiency of the rotating machines. In contrast, oriented electrical steel sheets with Goss texture ({110} <001>) have one easy magnetization direction in the rolling direction, making them suitable for use in transformer cores.
Final texture in BCC steels (e.g. non-oriented electrical steels) depends on deformation texture and local microstructure (e.g. shear band) 1). Goss grains could be nucleated inside shear bands 1, 2), which would be promoted by increasing grain size prior to cold rolling, adding large amounts of solute and employing high strain and low temperatures 3, 4). Cold rolling process may also affect the occurrence of shear bands and the corresponding recrystallization behaviors.
The development of shear bands has a strong
Abstract
In this study, the effect of cold rolling process on the microstructure and texture evolution in 1wt. % Si non-oriented electrical steel was investigated. For this purpose, all samples were processed through single-stage hot rolling at 1100 ° C and two-stage cold rolling (cross rolling and unidirectional rolling) with intermediate annealing at 650 °C for 35 seconds. Finally, all of them were fully annealed for 3 min at 900 ° C. The results showed that cold rolling process could affect shear band formation, deformation texture and annealing texture. Shear band and {322} grains were decreased and {100} grains were increased by the cross rolling method. These observations showed the weakening of the {110} <001> and {111} <112> components and the strengthening of the {001} <110> compo-nent after final annealing for the cross rolled sample. On the other hand, shear band formation in the unidirectional rolling sample caused the development of annealing Goss texture component ({110} <001>).
Keywords: Non-oriented electrical steel, Microstructure, Texture, Shear band.
effect not only on the work hardening and the evolution of deformation texture, but also on the nucleation and grain growth during subsequent recrystallization. Therefore, further study of deformation and recrystallization phenomena and the correlation between them is essential to have a better understanding of the deformed microstructure, particularly the formation of shear bands.
In our pervious study 5), it was shown that cross rolling with intermediate annealing could lead to appropriate texture in 1wt.% Si non-oriented electrical steel. In this paper, the effect of rolling method on the microstructure and texture evolution in the 1wt.% Si non-oriented electrical steel was investigated.
2. Materials and Methods
At the start, the non-oriented electrical steel used in this research was produced by the casting method. The chemical composition of the material after the casting is shown in Table 1. In order to homogenize the microstructure, hot forging process at 1100 °C was performed. Then, the hot rolling process was carried out with 60% reduction at 1100 °C. The thickness of samples after the hot rolling process was 7 mm.
A two-stage cold rolling process with intermediate annealing treatment was considered, as schematically shown in Fig. 1. Intermediate annealing was carried out at 650 °C for 35s.
International Journal of ISSI, Vol. 12 (2015), No. 2, pp. 1-6

2
A Bruker D8 diffractometer utilizing Eulerian cradle and 2D detector was employed to measure incomplete pole figures. Incomplete pole figures were used to calculate Orientation Distribution Function (ODF) as well as the texture components, by means of ResMat® software. Ferritic steels develop characteristic fiber textures during various processing steps. In Fig. 2 four typical fibers and some texture components of them are displayed in φ2 =45 ° section: θ-fiber (<100> || ND), γ-fiber (<111> || ND), α-fiber (<110> || RD), and ε-fiber.
Fig. 2. Typical fiber textures and some components of them in φ2 =45 ° section of ODF.
The micro-texture measurements were carried out using an Oxford Electron Back Scatter Diffraction (EBSD) setup fitted on a Hitachi SU6600 Field Emission Gun Scanning Electron Microscope. EBSD was performed on the TD plane as the planar features of cold-rolled microstructures could be better detected in this plane than any others. HKL AzTech software was utilized to extract and analyze the EBSD data. For EBSD measurements, samples were mechanically polished and then subjected to vibratory polishing using a Beuhler Vibromet® with 0.04 silica to remove the deformation layer. The microstructures were examined by optical microscopy (OM) using polarized light. Grain size measurements were performed using the linear intercept method.
3. Results and Discussion 3.1. Microstructure and texture after hot rolling
Fig. 3 shows optical microscopy image of hot rolled sample microstructure in the rolling direction-transvers direction (RD-TD) section with 30 µm grain size. As mentioned before, in order to achieve the same initial state prior to cold rolling, the samples were prepared in the same way as done after hot rolling. Therefore, grain size before cold rolling was the constant parameter and had an identical effect on the deformed microstructure (shear band formation)
C Si Al Mn P S O Ni Cr Ti0.012 0.994 0.021 0.232 0.032 0.008 0.014 0.029 0.036 0.002
A. Sonboli et al. / International Journal of ISSI 12 (2015), No. 2, 1-6
The amount of cold rolling reduction in each stage was 72%. So the final thickness of the samples after this procedure was 0.5 mm. Finally, all samples were fully annealed for 3 min at 900 ° C. In Fig. 1, A and B denote unidirectional rolling and cross rolling, respectively.
The first number after A/B shows the stage of the samples and the second one represents intermediate annealing. For example, A21 shows the sample after two stage unidirectional cold rolling (before final annealing) with intermediate annealing and A31 is the same one after final annealing.
Table 1. Chemical composition of the non-oriented electrical steel (wt. %).
Fig. 1. Schematic diagram of samples preparation routes with unidirectional rolling (UR) and cross rolling (CR) modes, along with intermediate annealing and their denotations after each stage.
3
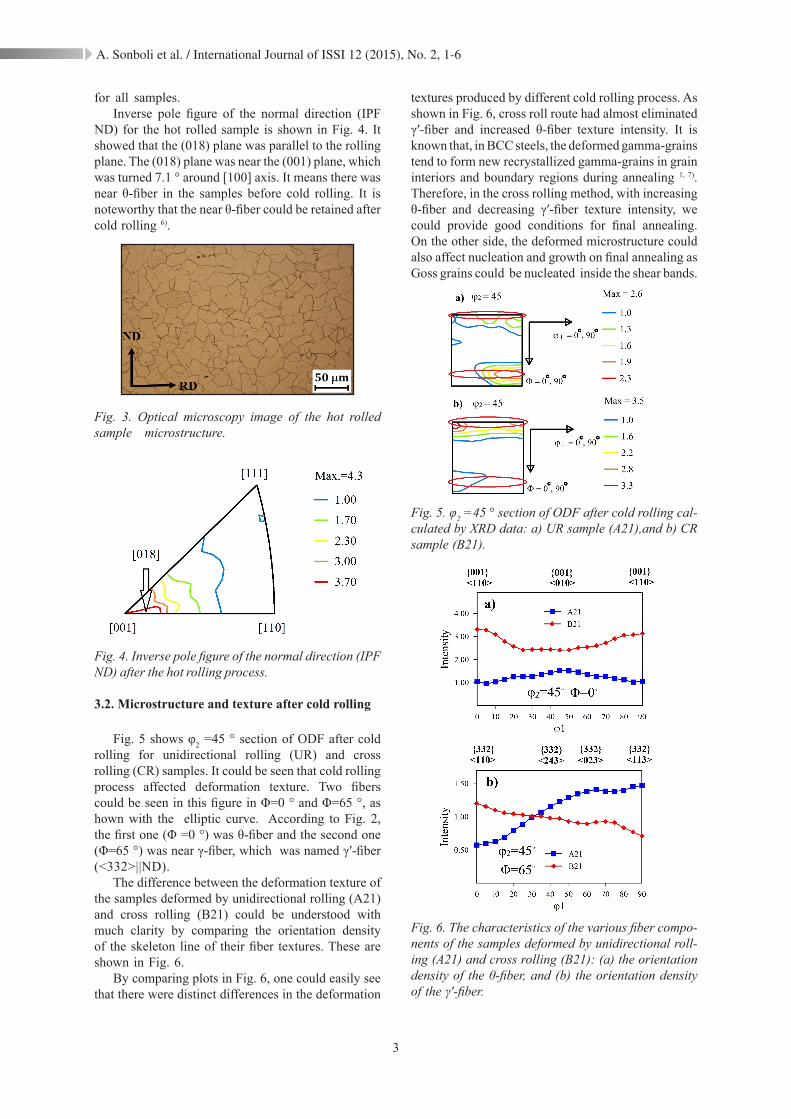
for all samples. Inverse pole figure of the normal direction (IPF
ND) for the hot rolled sample is shown in Fig. 4. It showed that the (018) plane was parallel to the rolling plane. The (018) plane was near the (001) plane, which was turned 7.1 ° around [100] axis. It means there was near θ-fiber in the samples before cold rolling. It is noteworthy that the near θ-fiber could be retained after cold rolling 6).
Fig. 3. Optical microscopy image of the hot rolled sample microstructure.
Fig. 4. Inverse pole figure of the normal direction (IPF ND) after the hot rolling process.
3.2. Microstructure and texture after cold rolling
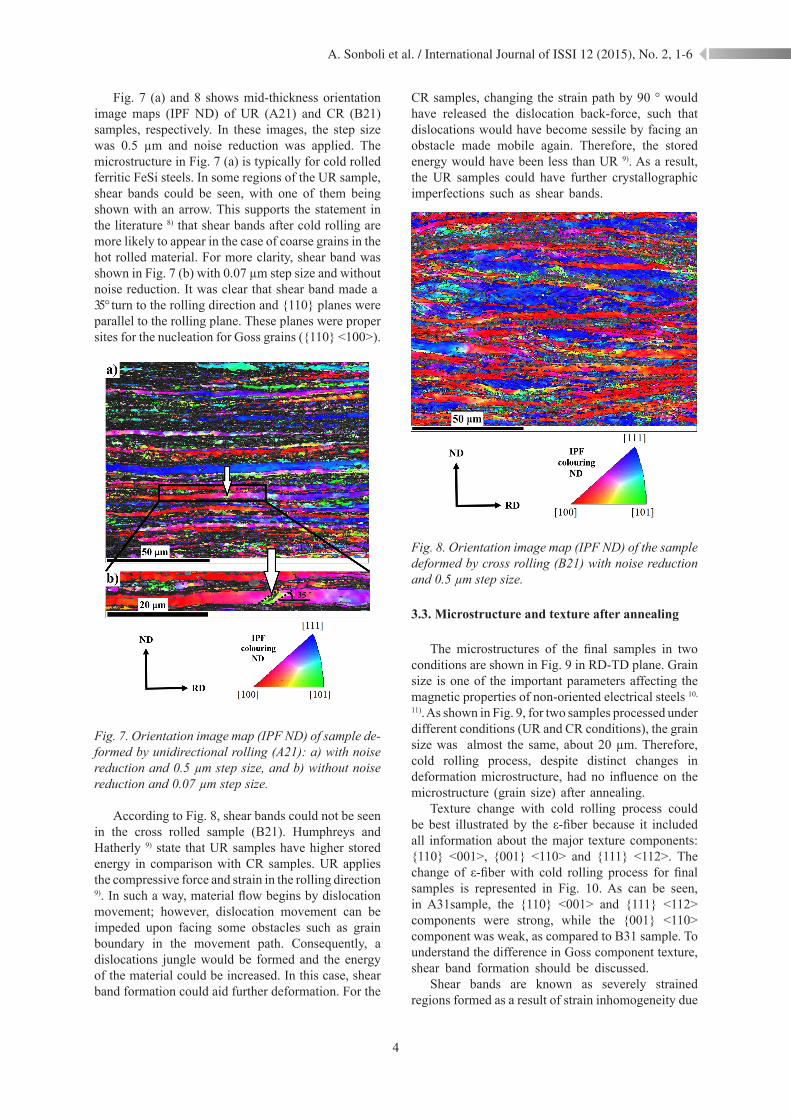
Fig. 5 shows φ2 =45 ° section of ODF after cold rolling for unidirectional rolling (UR) and cross rolling (CR) samples. It could be seen that cold rolling process affected deformation texture. Two fibers could be seen in this figure in Φ=0 ° and Φ=65 °, as hown with the elliptic curve. According to Fig. 2, the first one (Φ =0 °) was θ-fiber and the second one (Φ=65 °) was near γ-fiber, which was named γ′-fiber (<332>||ND).
The difference between the deformation texture of the samples deformed by unidirectional rolling (A21) and cross rolling (B21) could be understood with much clarity by comparing the orientation density of the skeleton line of their fiber textures. These are shown in Fig. 6.
By comparing plots in Fig. 6, one could easily see that there were distinct differences in the deformation
textures produced by different cold rolling process. As shown in Fig. 6, cross roll route had almost eliminated γ′-fiber and increased θ-fiber texture intensity. It is known that, in BCC steels, the deformed gamma-grains tend to form new recrystallized gamma-grains in grain interiors and boundary regions during annealing 1, 7). Therefore, in the cross rolling method, with increasing θ-fiber and decreasing γ′-fiber texture intensity, we could provide good conditions for final annealing. On the other side, the deformed microstructure could also affect nucleation and growth on final annealing as Goss grains could be nucleated inside the shear bands.
Fig. 5. φ2 =45 ° section of ODF after cold rolling cal-culated by XRD data: a) UR sample (A21),and b) CR sample (B21).
Fig. 6. The characteristics of the various fiber compo-nents of the samples deformed by unidirectional roll-ing (A21) and cross rolling (B21): (a) the orientation density of the θ-fiber, and (b) the orientation density of the γ′-fiber.
A. Sonboli et al. / International Journal of ISSI 12 (2015), No. 2, 1-6
4
Fig. 7 (a) and 8 shows mid-thickness orientation image maps (IPF ND) of UR (A21) and CR (B21) samples, respectively. In these images, the step size was 0.5 µm and noise reduction was applied. The microstructure in Fig. 7 (a) is typically for cold rolled ferritic FeSi steels. In some regions of the UR sample, shear bands could be seen, with one of them being shown with an arrow. This supports the statement in the literature 8) that shear bands after cold rolling are more likely to appear in the case of coarse grains in the hot rolled material. For more clarity, shear band was shown in Fig. 7 (b) with 0.07 µm step size and without noise reduction. It was clear that shear band made a 35 ° turn to the rolling direction and {110} planes were parallel to the rolling plane. These planes were proper sites for the nucleation for Goss grains ({110} <100>).
Fig. 7. Orientation image map (IPF ND) of sample de-formed by unidirectional rolling (A21): a) with noise reduction and 0.5 µm step size, and b) without noise reduction and 0.07 µm step size.
According to Fig. 8, shear bands could not be seen in the cross rolled sample (B21). Humphreys and Hatherly 9) state that UR samples have higher stored energy in comparison with CR samples. UR applies the compressive force and strain in the rolling direction 9). In such a way, material flow begins by dislocation movement; however, dislocation movement can be impeded upon facing some obstacles such as grain boundary in the movement path. Consequently, a dislocations jungle would be formed and the energy of the material could be increased. In this case, shear band formation could aid further deformation. For the
CR samples, changing the strain path by 90 ° would have released the dislocation back-force, such that dislocations would have become sessile by facing an obstacle made mobile again. Therefore, the stored energy would have been less than UR 9). As a result, the UR samples could have further crystallographic imperfections such as shear bands.
Fig. 8. Orientation image map (IPF ND) of the sample deformed by cross rolling (B21) with noise reduction and 0.5 µm step size.
3.3. Microstructure and texture after annealing
The microstructures of the final samples in two conditions are shown in Fig. 9 in RD-TD plane. Grain size is one of the important parameters affecting the magnetic properties of non-oriented electrical steels 10,
11). As shown in Fig. 9, for two samples processed under different conditions (UR and CR conditions), the grain size was almost the same, about 20 µm. Therefore, cold rolling process, despite distinct changes in deformation microstructure, had no influence on the microstructure (grain size) after annealing.
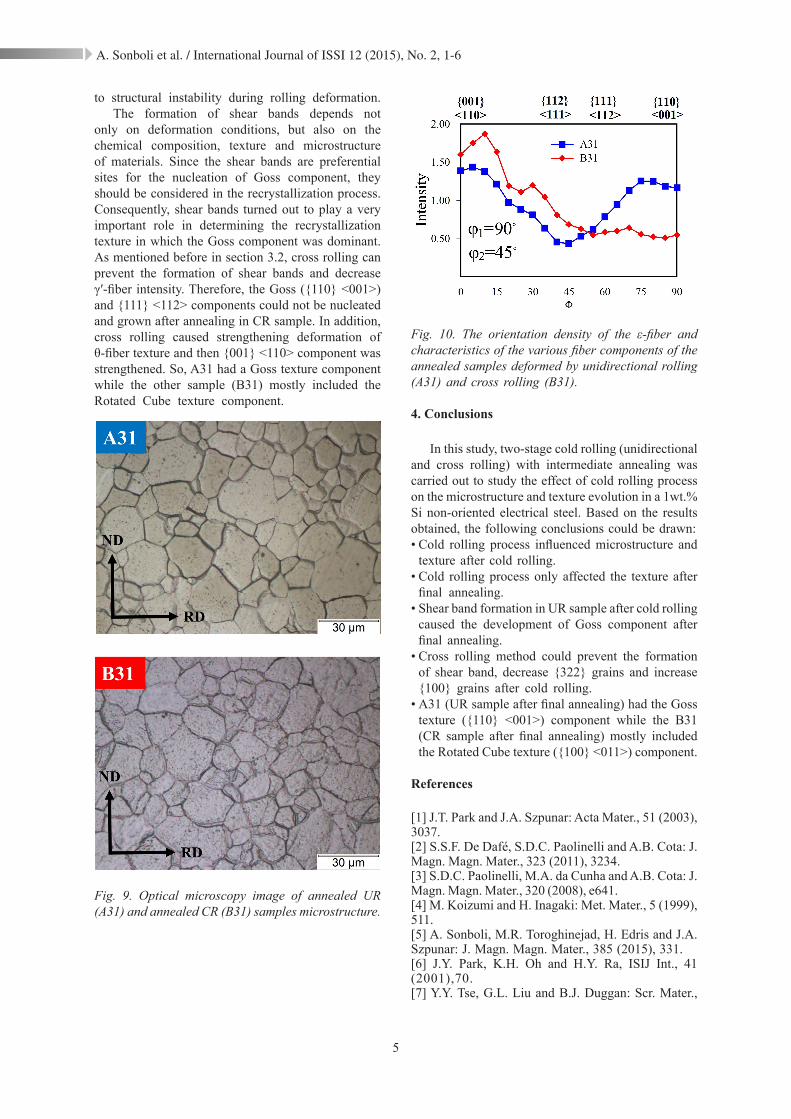
Texture change with cold rolling process could be best illustrated by the ε-fiber because it included all information about the major texture components: {110} <001>, {001} <110> and {111} <112>. The change of ε-fiber with cold rolling process for final samples is represented in Fig. 10. As can be seen, in A31sample, the {110} <001> and {111} <112> components were strong, while the {001} <110> component was weak, as compared to B31 sample. To understand the difference in Goss component texture, shear band formation should be discussed.
Shear bands are known as severely strained regions formed as a result of strain inhomogeneity due
A. Sonboli et al. / International Journal of ISSI 12 (2015), No. 2, 1-6
5
to structural instability during rolling deformation. The formation of shear bands depends not
only on deformation conditions, but also on the chemical composition, texture and microstructure of materials. Since the shear bands are preferential sites for the nucleation of Goss component, they should be considered in the recrystallization process. Consequently, shear bands turned out to play a very important role in determining the recrystallization texture in which the Goss component was dominant. As mentioned before in section 3.2, cross rolling can prevent the formation of shear bands and decrease γ′-fiber intensity. Therefore, the Goss ({110} <001>) and {111} <112> components could not be nucleated and grown after annealing in CR sample. In addition, cross rolling caused strengthening deformation of θ-fiber texture and then {001} <110> component was strengthened. So, A31 had a Goss texture component while the other sample (B31) mostly included the Rotated Cube texture component.
Fig. 9. Optical microscopy image of annealed UR (A31) and annealed CR (B31) samples microstructure.
Fig. 10. The orientation density of the ε-fiber and characteristics of the various fiber components of the annealed samples deformed by unidirectional rolling (A31) and cross rolling (B31).
4. Conclusions
In this study, two-stage cold rolling (unidirectional and cross rolling) with intermediate annealing was carried out to study the effect of cold rolling process on the microstructure and texture evolution in a 1wt.% Si non-oriented electrical steel. Based on the results obtained, the following conclusions could be drawn:• Cold rolling process influenced microstructure and
texture after cold rolling.• Cold rolling process only affected the texture after
final annealing.• Shear band formation in UR sample after cold rolling
caused the development of Goss component after final annealing.
• Cross rolling method could prevent the formation of shear band, decrease {322} grains and increase {100} grains after cold rolling.
• A31 (UR sample after final annealing) had the Goss texture ({110} <001>) component while the B31 (CR sample after final annealing) mostly included the Rotated Cube texture ({100} <011>) component.
References
[1] J.T. Park and J.A. Szpunar: Acta Mater., 51 (2003), 3037.[2] S.S.F. De Dafé, S.D.C. Paolinelli and A.B. Cota: J. Magn. Magn. Mater., 323 (2011), 3234.[3] S.D.C. Paolinelli, M.A. da Cunha and A.B. Cota: J. Magn. Magn. Mater., 320 (2008), e641.[4] M. Koizumi and H. Inagaki: Met. Mater., 5 (1999), 511.[5] A. Sonboli, M.R. Toroghinejad, H. Edris and J.A. Szpunar: J. Magn. Magn. Mater., 385 (2015), 331.[6] J.Y. Park, K.H. Oh and H.Y. Ra, ISIJ Int., 41 (2001),70.[7] Y.Y. Tse, G.L. Liu and B.J. Duggan: Scr. Mater.,
A. Sonboli et al. / International Journal of ISSI 12 (2015), No. 2, 1-6

6
42 (1999), 25.[8] J.-T. Park, J. a. Szpunar and S.Y. Cha: ISIJ Int., 43 (2003), 1611.[9] F.J. Humphreys and M. Hatherly: Recrystallization and Relted Annealing Phenomena, Elsevier, (2004).
[10] M. Shiozaki and Y. Kurosaki: J. Mater. Eng., 11 (1989), 37.[11] E. Stephenson and A. Marder: IEEE Trans. Magn., 22 (1986), 101.
A. Sonboli et al. / International Journal of ISSI 12 (2015), No. 2, 1-6