international journal of coal geology - csir central
TRANSCRIPT
Contents lists available at ScienceDirect
International Journal of Coal Geology
journal homepage: www.elsevier.com/locate/coal
Comparative study on sorption characteristics of coal seams from Barakarand Raniganj formations of Damodar Valley Basin, IndiaSujoy Chattaraja,b, Debadutta Mohantya,⁎, Tarkeshwar Kumarc, Gopinath Halderb,Kanhaiya Mishraa
a Non-Conventional Gases Section, CSIR – Central Institute of Mining and Fuel Research, Dhanbad 826 015, Indiab Department of Chemical Engineering, National Institute of Technology Durgapur, Durgapur 713 209, Indiac Department of Petroleum Engineering, IIT-Indian School of Mines, Dhanbad 826 004, India
A R T I C L E I N F O
Keywords:Sub-basinThermal historyMethaneSorptionMicropores
A B S T R A C T
The methane retention mechanism in coal seams is markedly different from those of conventional gas reservoirs.Methane remains mainly as physically adsorbed molecules on micropore surface. Chemical and petrographiccompositions of coal are the measures of maturity and type of organic matter that control the methane sorptioncharacteristics of the coal. 99% of Indian coal occurrences are contributed by lower Gondwana sequences housedin two major geologic formations, younger Raniganj and older Barakar. The Raniganj Formation is best exposedin Raniganj Sub-basin and Barakar Formation is best exposed in Jharia Sub-basin of Damodar Valley. Presentwork attempts a systematic investigation on comparative account of methane sorption characteristics of coalsfrom Raniganj Formation of Raniganj Sub-basin and Barakar Formations of Jharia Sub-basin in relation to theirchemical composition and petrographic makeup. Chemical analyses shows that moisture, ash, volatile matterand fixed carbon varies between 2.5 and 4.6%, 10.0–27.2%, 38.8–40.2% (dmmf) and 59.8–61.2% (dmmf),respectively for Raniganj coals and, 0.5–1.1%, 16.7–32.9%, 20.7–22.0% (dmmf) and 78.0–79.3% (dmmf), re-spectively for Barakar coals. Carbon content is distinct for the suites of coal, 79.2–85.4% and 85.6–92.0% forRaniganj and Barakar coals, respectively. The vitrinite reflectance for the Raniganj coals ranges 0.53–0.72% andthe Barakar coals ranges 1.09–1.23%. Based on the chemical composition and vitrinite reflectance valueRaniganj coals belongs to high volatile bituminous type, whereas Barakar coals belongs to high to mediumvolatile bituminous type. Such variation in composition and maturity is mainly attributed to the variation inprecursor organic matter as well as the basinal and thermal history of the sub-basins under consideration.
H/C atomic ratio of the Raniganj and Barakar coals varies between 0.65 and 0.80 and 0.51–0.72 and O/Catomic ratio varies between 0.05 and 0.13 and 0.01–0.07, respectively. Coals of both the Raniganj and Barakarformations are mostly of kerogen Type-III with Raniganj coals falling in wet gas maturity stage approachingearly-thermogenic methane generation whereas Barakar coals falling in condensate gas stage approaching peak-thermogenic methane generation. The Langmuir volume ranges from 9.3–21.8 cc/g (daf) for Raniganj coals and21.1–29.1 cc/g (daf) for Barakar coals. Sorption capacity for the set of coals shows a strong rank dependency andincrease with corresponding increase in rank down the stratigraphic column. Methane sorption capacity showspositive relationship with carbon content and vitrinite reflectance, and negative relationship with moisturecontent, ash and volatile matter. Moisture effect is more prominent in low rank Raniganj coals. The adsorptioncapacity shows a strong positive relation with vitrinite content and a moderate negative relation with inertinitecontent for both the Raniganj and Barakar coals, which may be attributed to dominancy of micropores in vi-trinites with rank enhancement. The multiple regression analysis shows that the moisture is the main predictorof the VL, and the interaction of moisture with ash and reflectance mainly control the sorption capacity. Apredictive model equation is developed for determination of sorption for Damodar basin coals from carbon, ashand moisture data.
https://doi.org/10.1016/j.coal.2019.05.009Received 15 November 2018; Received in revised form 7 May 2019; Accepted 13 May 2019
⁎ Corresponding author.E-mail address: [email protected] (D. Mohanty).
International Journal of Coal Geology 212 (2019) 103202
Available online 15 May 20190166-5162/ © 2019 Elsevier B.V. All rights reserved.
T
1. Introduction
The methane generated during the coalification process remainstrapped within the coal seams and associated rocks are known ascoalbed methane. The gas retention mechanism in coal seams ismarkedly different from that of conventional oil and gas reservoirs.Coal seam gases are generally found as adsorbed molecules on surface,absorbed gas within the matrix, free gas in cleats and fractures, and as asolute in ground water (Murray, 1991). However, physical adsorption isthe dominant mechanism governing the storage of CBM in the coalseam (Crosdale et al., 1998). USA, China, Australia and Canada are themajor CBM producing countries having CBM resources locked up in thecoals of different age and rank. Coal bearing Upper Cretaceous Fruit-land Formation of San Juan basin and Cretaceous Pottsville Formationof Black Warrior basin are the principal CBM producing zones of USA.Alberta Basin hosts the major hydrocarbon resources in Canada. Thesecoals from Cretaceous to Tertiary strata are similar to Rocky mountainforeland basin of USA. High permeable thin coal seams of JurassicWalloon Coal Measures of Surat Basin and relatively thick coal seams ofPermian Baralaba Coal Measures and Bandanna formation of BowenBasin are the principle gas producing horizons in Australia (Towleret al., 2016). Qinshui and Ordos basins are the key CBM producingareas in China, accounting for 94.6% of the total production in 2014.Carboniferous Benxi and Taiyuan Formations in the Ordos basin andPermian Shanxi Formation and Carboniferous Taiyuan Formation inQinshui basin of China are the major coal bearing strata (Mu et al.,2015). Hence, it is important to investigate the CBM potentiality ofdifferent coal basins in terms of their age, rank, types, grades etc. in thelight of their chemical and petrographic makeup.
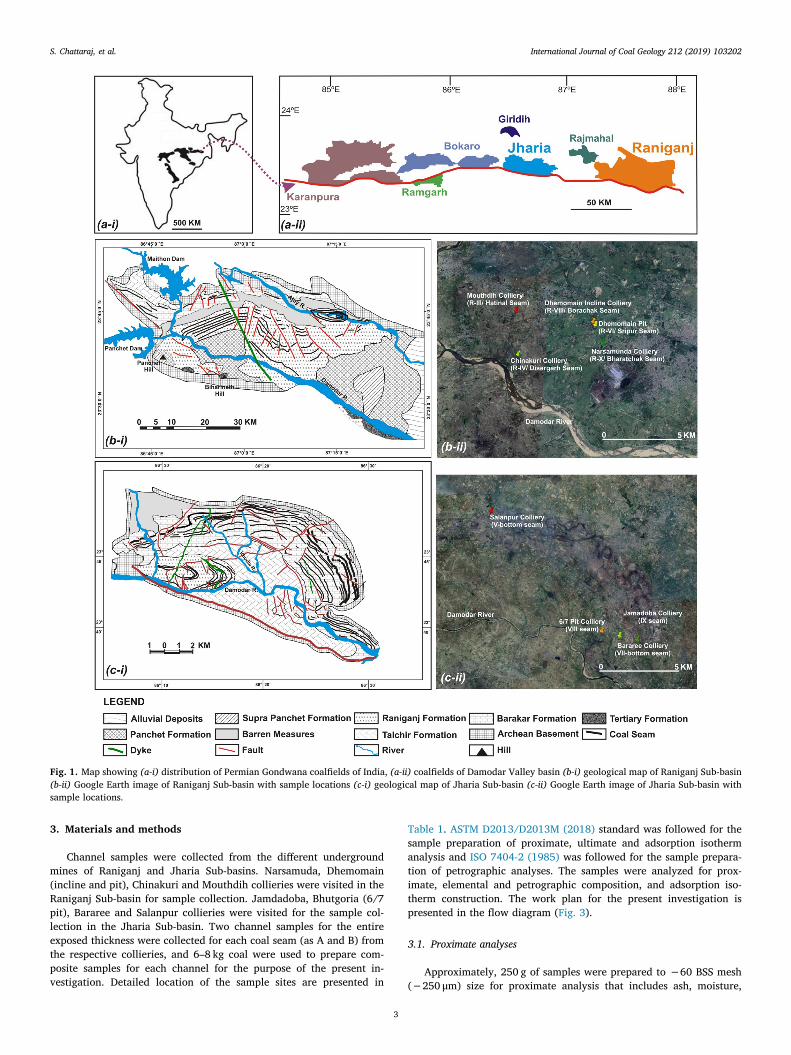
The total prognosticated CBM resource of India from 33 CBM blocksawarded in four rounds of bidding is about 1767 BCM (DGH, 2019) thatincludes Permian coal basins of Damodar valley, Son Valley, Tertiarycoal basins of North East India, Tertiary Neyveli lignites etc. Thecoalfields of Damodar (Raniganj, Jharia, Bokaro & North Karanpura)and Son River Valley (Sohagpur) have emerged as the most prospectivefor CBM exploration and 8 blocks in these two river valley Basins are inthe development phase with an estimated gas-in-place of 280 BCM(DGH, 2019). However, these blocks are yet to enter into the com-mercial exploitation phase. The coal measures of India belong to twobroad geologic periods, Permian and Tertiary. The Permian LowerGondwana sequences of Peninsular India hosts almost 99% of theCountry's coal resource. Gondwana coal basins are distributed alongthree major river valley lineaments, the Damodar Valley, Son-MahanadiValley and Godavari Valley (Fig. 1a-i). The east–west trending DamodarValley hosts major prime coking coal reserves of the country and is amain coalfield for CBM exploration. A major normal fault that runs thelength of the Damodar Valley marks the southern edge of the majorcoalfields where Gondwana sediments are in contact with the Pre-cambrian gneissic terrain (Fig. 1a-ii). The intra-basinal faulting andigneous activity have complicated the structure of the Damodar Valleybasin. During the Permian period, coal seams were most likely formedthroughout the entire Damodar Valley. Subsequent upliftment anderosion of the Gondwana sediments, however, has left only the isolatedcoalfields now preserved as graben and half-graben structures in Da-modar Valley, from east to west, namely Raniganj, Jharia, East andWest Bokaro, Ramgarh, South and North Karanpura coalfields. Thestrata generally dip towards the faulted southern boundary.
The chemical and petrographic composition of coal, rank and thetype of organic matter are the main factors controlling the amount ofgas adsorbed in coals (Chattaraj et al., 2016). Extensive study onsorption behavior of coals from different parts of the globe has beencarried out in relation to CBM exploration. Though these studies haveadded to our understanding about coalbed methane, there is strongneed to assess the CBM potentiality of particular basin in terms of itssource organic matter, basinal and thermal history (Busch andGensterblum, 2011; Chattaraj et al., 2016). Hence, an attempt is made
to study the sorption behavior of the coals from the two major coal-bearing formations of two different sub-basins of Damodar Valley,India, Raniganj Formation of Raniganj Sub-basin and Barakar formationof Jharia Sub-basin under same experimental conditions. Further, ef-forts were made to correlate the adsorption capacity of the coals withtheir chemical composition, petrographic makeup and maturity.
2. Geology of the study area
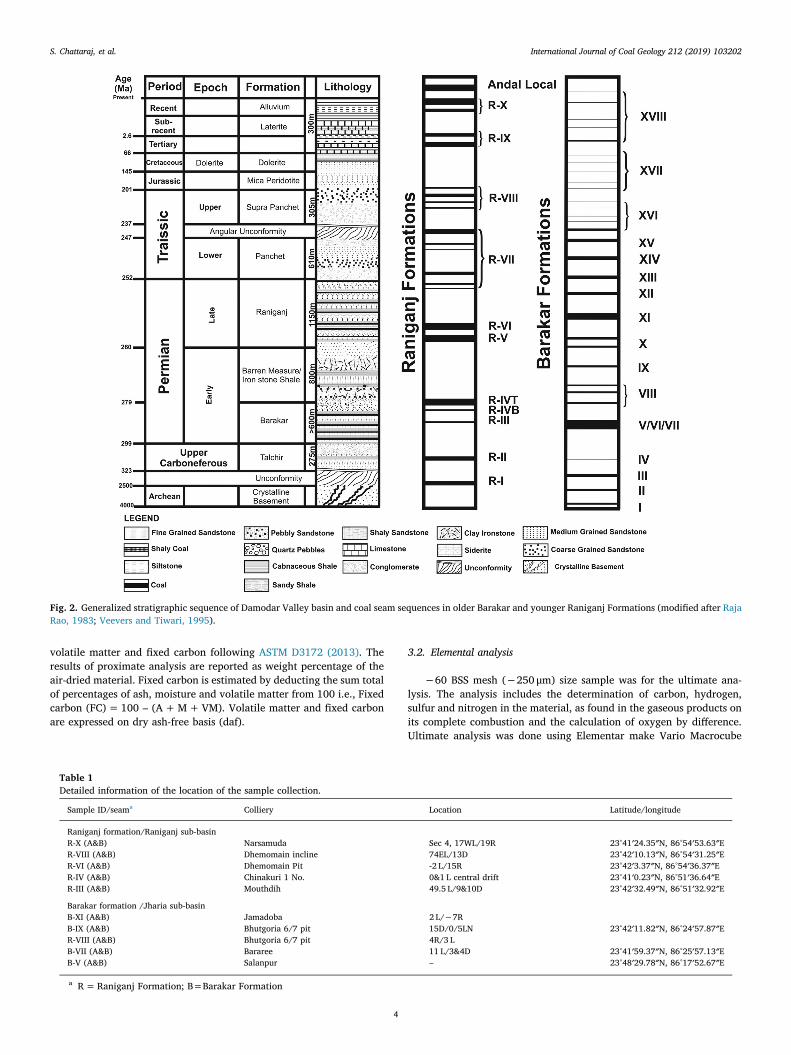
The Lower Gondwana sequence of India is comprised of five for-mations namely Talchir, Karharbari, Barakar, Barren Measure andRaniganj from bottom to top. Among them Karharbari is almost missingin the Damodar Valley, except in the Giridih Gondwana sub-basin. TheDamodar Valley Basin is regarded as an ‘outlier’ in the Archaeancountry. Overlying the Talchir formation, Damuda group holds themajor coal resources and is classified into three distinct formations viz.Barakar, Barren Measures and Raniganj (Fig. 2) with a cumulativethickness of nearly 2500 m. The Barren Measures is not a coal-bearingformation and separates the underlying Barakar and overlying Raniganjcoal bearing formations (Dutta, 2002). Coal seams occur both in theBarakar and in Raniganj Formations. The Barakar formation is bestexposed in the Jharia Sub-basin and is the sole repository of primecoking coals in the country. The Raniganj Formation is best developedin the Raniganj Sub-basin and their importance diminishes towardswest in the Damodar Valley and in rest of the peninsular India.
2.1. Raniganj sub-basin
Raniganj Sub-basin spreading over an area of 1550 km2 is theeastern most member of Damodar Valley Coalfields bounded by thelatitudes 23°03′:23°52′N and longitudes 86°25′:87°37′E. Two prominentelevations namely, Panchet and Biharinath are conspicuous in thesouthern part of the Sub-basin. Three perennial rivers Ajay, Barakar andDamodar along with their tributaries drain the northern, eastern andsouthern parts of the Sub-basin. The Coalfield has a semi-ellipticalelongated shape and is bounded on the north, west and south by theArchaean metamorphics except in the east, where it is covered by al-luvium. Archaean metamorphic rocks consisting of granite gneiss,migmatite gneiss, hornblende schist, hornblende gneiss, metabasicrocks, pegmatite and quartz veins etc. represent basement of Raniganjcoalfield. Though several correlations are available for the regional aswell as local coal seams of Raniganj Formation, the one generally ac-cepted, recognizes ten groups of coal seams numbered R-I to R-X in theascending order.
2.2. Jharia sub-basin
The Jharia Sub-basin is the second eastern most member of theDamodar Valley basin banked by the Raniganj Sub-basin in the east andBokaro Sub-basin in the west. The Jharia Sub-basin is a sickle-shapedsynclinal basin with an east-west alignment. The Sub-basin is extendedover an area of about 453km2 bounded by latitudes 23°37′:23°52′N andlongitudes 86°06′:86°30′E lying mostly in the Dhanbad district ofJharkhand. It is an outlier of Permo-Carboniferous lower Gondwanasediments in an Archaean country. The area is mostly covered withalluvial soil and successive outcrops of older rocks from north to southand Barren measures outcrop at the central part. The coal seams occurin the Jharia Sub-basin in both Barakar and Raniganj Formation thoughworkable coal seams are present only in Barakar Formation. As far asthe number of coal seams (50 cm and more in thickness) is concerned,the existence of as many as 46 (including 5 local) seams in BarakarMeasures and 24 (including 4 local) seams in Raniganj Measures havebeen proved. Out of the above-mentioned Barakar coal measures, 18coal seams (I to XVIII) have been identified as regionally correlatablecoal seams (Fox, 1930).
S. Chattaraj, et al. International Journal of Coal Geology 212 (2019) 103202
2
3. Materials and methods
Channel samples were collected from the different undergroundmines of Raniganj and Jharia Sub-basins. Narsamuda, Dhemomain(incline and pit), Chinakuri and Mouthdih collieries were visited in theRaniganj Sub-basin for sample collection. Jamdadoba, Bhutgoria (6/7pit), Bararee and Salanpur collieries were visited for the sample col-lection in the Jharia Sub-basin. Two channel samples for the entireexposed thickness were collected for each coal seam (as A and B) fromthe respective collieries, and 6–8 kg coal were used to prepare com-posite samples for each channel for the purpose of the present in-vestigation. Detailed location of the sample sites are presented in
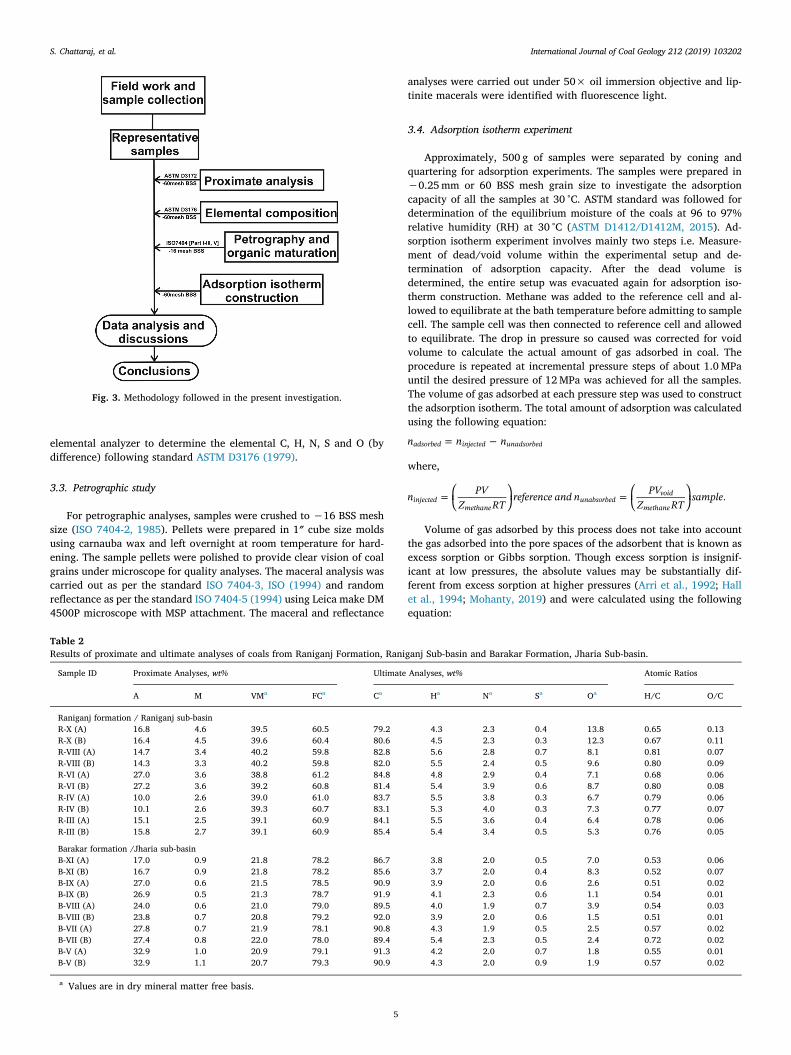
Table 1. ASTM D2013/D2013M (2018) standard was followed for thesample preparation of proximate, ultimate and adsorption isothermanalysis and ISO 7404-2 (1985) was followed for the sample prepara-tion of petrographic analyses. The samples were analyzed for prox-imate, elemental and petrographic composition, and adsorption iso-therm construction. The work plan for the present investigation ispresented in the flow diagram (Fig. 3).
3.1. Proximate analyses
Approximately, 250 g of samples were prepared to −60 BSS mesh(−250 μm) size for proximate analysis that includes ash, moisture,
Fig. 1. Map showing (a-i) distribution of Permian Gondwana coalfields of India, (a-ii) coalfields of Damodar Valley basin (b-i) geological map of Raniganj Sub-basin(b-ii) Google Earth image of Raniganj Sub-basin with sample locations (c-i) geological map of Jharia Sub-basin (c-ii) Google Earth image of Jharia Sub-basin withsample locations.
S. Chattaraj, et al. International Journal of Coal Geology 212 (2019) 103202
3
volatile matter and fixed carbon following ASTM D3172 (2013). Theresults of proximate analysis are reported as weight percentage of theair-dried material. Fixed carbon is estimated by deducting the sum totalof percentages of ash, moisture and volatile matter from 100 i.e., Fixedcarbon (FC) = 100 – (A + M + VM). Volatile matter and fixed carbonare expressed on dry ash-free basis (daf).
3.2. Elemental analysis
−60 BSS mesh (−250 μm) size sample was for the ultimate ana-lysis. The analysis includes the determination of carbon, hydrogen,sulfur and nitrogen in the material, as found in the gaseous products onits complete combustion and the calculation of oxygen by difference.Ultimate analysis was done using Elementar make Vario Macrocube
Fig. 2. Generalized stratigraphic sequence of Damodar Valley basin and coal seam sequences in older Barakar and younger Raniganj Formations (modified after RajaRao, 1983; Veevers and Tiwari, 1995).
Table 1Detailed information of the location of the sample collection.
Sample ID/seama Colliery Location Latitude/longitude
Raniganj formation/Raniganj sub-basinR-X (A&B) Narsamuda Sec 4, 17WL/19R 23°41′24.35″N, 86°54′53.63″ER-VIII (A&B) Dhemomain incline 74EL/13D 23°42′10.13″N, 86°54′31.25″ER-VI (A&B) Dhemomain Pit -2 L/15R 23°42′3.37″N, 86°54′36.37″ER-IV (A&B) Chinakuri 1 No. 0&1 L central drift 23°41′0.23″N, 86°51′36.64″ER-III (A&B) Mouthdih 49.5 L/9&10D 23°42′32.49″N, 86°51′32.92″E
Barakar formation /Jharia sub-basinB-XI (A&B) Jamadoba 2 L/−7RB-IX (A&B) Bhutgoria 6/7 pit 15D/0/5LN 23°42′11.82″N, 86°24′57.87″ER-VIII (A&B) Bhutgoria 6/7 pit 4R/3 LB-VII (A&B) Bararee 11 L/3&4D 23°41′59.37″N, 86°25′57.13″EB-V (A&B) Salanpur – 23°48′29.78″N, 86°17′52.67″E
a R = Raniganj Formation; B=Barakar Formation
S. Chattaraj, et al. International Journal of Coal Geology 212 (2019) 103202
4
elemental analyzer to determine the elemental C, H, N, S and O (bydifference) following standard ASTM D3176 (1979).
3.3. Petrographic study
For petrographic analyses, samples were crushed to −16 BSS meshsize (ISO 7404-2, 1985). Pellets were prepared in 1″ cube size moldsusing carnauba wax and left overnight at room temperature for hard-ening. The sample pellets were polished to provide clear vision of coalgrains under microscope for quality analyses. The maceral analysis wascarried out as per the standard ISO 7404-3, ISO (1994) and randomreflectance as per the standard ISO 7404-5 (1994) using Leica make DM4500P microscope with MSP attachment. The maceral and reflectance
analyses were carried out under 50× oil immersion objective and lip-tinite macerals were identified with fluorescence light.
3.4. Adsorption isotherm experiment
Approximately, 500 g of samples were separated by coning andquartering for adsorption experiments. The samples were prepared in−0.25 mm or 60 BSS mesh grain size to investigate the adsorptioncapacity of all the samples at 30 °C. ASTM standard was followed fordetermination of the equilibrium moisture of the coals at 96 to 97%relative humidity (RH) at 30 °C (ASTM D1412/D1412M, 2015). Ad-sorption isotherm experiment involves mainly two steps i.e. Measure-ment of dead/void volume within the experimental setup and de-termination of adsorption capacity. After the dead volume isdetermined, the entire setup was evacuated again for adsorption iso-therm construction. Methane was added to the reference cell and al-lowed to equilibrate at the bath temperature before admitting to samplecell. The sample cell was then connected to reference cell and allowedto equilibrate. The drop in pressure so caused was corrected for voidvolume to calculate the actual amount of gas adsorbed in coal. Theprocedure is repeated at incremental pressure steps of about 1.0 MPauntil the desired pressure of 12 MPa was achieved for all the samples.The volume of gas adsorbed at each pressure step was used to constructthe adsorption isotherm. The total amount of adsorption was calculatedusing the following equation:
=n n nadsorbed injected unadsorbed
where,
= =n PVZ RT
reference and n PVZ RT
sample.injectedmethane
unabsorbedvoid
methane
Volume of gas adsorbed by this process does not take into accountthe gas adsorbed into the pore spaces of the adsorbent that is known asexcess sorption or Gibbs sorption. Though excess sorption is insignif-icant at low pressures, the absolute values may be substantially dif-ferent from excess sorption at higher pressures (Arri et al., 1992; Hallet al., 1994; Mohanty, 2019) and were calculated using the followingequation:
Fig. 3. Methodology followed in the present investigation.
Table 2Results of proximate and ultimate analyses of coals from Raniganj Formation, Raniganj Sub-basin and Barakar Formation, Jharia Sub-basin.
Sample ID Proximate Analyses, wt% Ultimate Analyses, wt% Atomic Ratios
A M VMa FCa Ca Ha Na Sa Oa H/C O/C
Raniganj formation / Raniganj sub-basinR-X (A) 16.8 4.6 39.5 60.5 79.2 4.3 2.3 0.4 13.8 0.65 0.13R-X (B) 16.4 4.5 39.6 60.4 80.6 4.5 2.3 0.3 12.3 0.67 0.11R-VIII (A) 14.7 3.4 40.2 59.8 82.8 5.6 2.8 0.7 8.1 0.81 0.07R-VIII (B) 14.3 3.3 40.2 59.8 82.0 5.5 2.4 0.5 9.6 0.80 0.09R-VI (A) 27.0 3.6 38.8 61.2 84.8 4.8 2.9 0.4 7.1 0.68 0.06R-VI (B) 27.2 3.6 39.2 60.8 81.4 5.4 3.9 0.6 8.7 0.80 0.08R-IV (A) 10.0 2.6 39.0 61.0 83.7 5.5 3.8 0.3 6.7 0.79 0.06R-IV (B) 10.1 2.6 39.3 60.7 83.1 5.3 4.0 0.3 7.3 0.77 0.07R-III (A) 15.1 2.5 39.1 60.9 84.1 5.5 3.6 0.4 6.4 0.78 0.06R-III (B) 15.8 2.7 39.1 60.9 85.4 5.4 3.4 0.5 5.3 0.76 0.05
Barakar formation /Jharia sub-basinB-XI (A) 17.0 0.9 21.8 78.2 86.7 3.8 2.0 0.5 7.0 0.53 0.06B-XI (B) 16.7 0.9 21.8 78.2 85.6 3.7 2.0 0.4 8.3 0.52 0.07B-IX (A) 27.0 0.6 21.5 78.5 90.9 3.9 2.0 0.6 2.6 0.51 0.02B-IX (B) 26.9 0.5 21.3 78.7 91.9 4.1 2.3 0.6 1.1 0.54 0.01B-VIII (A) 24.0 0.6 21.0 79.0 89.5 4.0 1.9 0.7 3.9 0.54 0.03B-VIII (B) 23.8 0.7 20.8 79.2 92.0 3.9 2.0 0.6 1.5 0.51 0.01B-VII (A) 27.8 0.7 21.9 78.1 90.8 4.3 1.9 0.5 2.5 0.57 0.02B-VII (B) 27.4 0.8 22.0 78.0 89.4 5.4 2.3 0.5 2.4 0.72 0.02B-V (A) 32.9 1.0 20.9 79.1 91.3 4.2 2.0 0.7 1.8 0.55 0.01B-V (B) 32.9 1.1 20.7 79.3 90.9 4.3 2.0 0.9 1.9 0.57 0.02
a Values are in dry mineral matter free basis.
S. Chattaraj, et al. International Journal of Coal Geology 212 (2019) 103202
5
=N n /(1 [ / ])absolute excess gas adsorbed
where, N or n, no. of moles; P, pressure; V, volume; R, universal gasconstant; T, temperature; ρ, density and Z, compressibility factor.
The rate of gas sorption decreases with increasing pressure even-tually reaching a maximum value of sorbed gas which denoted asLangmuir volume (VL) and the pressure at which gas sorption capacityequals one half of the maximum value (VL/2) represents Langmuirpressure (PL). Langmuir parameters are calculated from the model fitfor adsorption isotherm data.
4. Results
4.1. Chemical composition
The results of proximate and ultimate analyses of Raniganj coalsfrom Raniganj Sub-basin and Barakar coals from Jharia Sub-basin arepresented in Table 2. The moisture content varies in two distinct rangesbeing comparatively higher for Raniganj coal (2.5–4.6%, air-driedbasis) than the Barakar coals (0.5–1.1%, air-dried basis). The ash con-tent is significantly low in Raniganj formation coal (Table 2), mostly
ranging between 10.0 and 16.8% (air-dried basis) except R-VI seamcoal (~27%, air-dried basis). The ash content of the Barakar coals fromthe Jharia Sub-basin varies widely in between 16.7 and 32.9% (air-dried basis) and typically higher than the Raniganj coals. The volatilematter content for both the coals varies within a narrow range and,distinctly different for the set of coals being higher for the Raniganjcoals (38.8–40.2%, dmmf basis) and lower for the Barakar coals(20.7–22.0%, dmmf basis).
Like the proximate analyses results, the elemental compositions forthe two sets of coals are very distinctive from each other. Overallcarbon content (Table 2) of the studied sample varies within the range79.2–92.0% (dmmf basis) and nitrogen content between 1.9 and 4.0%(dmmf basis) for both the coals. The oxygen content of these coalsvaries between 1.1 and 13.8% (dmmf basis). However, sulfur content ofboth the coals is very less and varies between 0.3 and 0.9% (dmmfbasis). The carbon content for the Raniganj coals of Raniganj Sub-basinand Barakar coals of Jharia Sub-basin is 79.2–85.4% (dmmf basis) and85.6–92.0% (dmmf basis), respectively and the hydrogen content is4.3–5.6% and 3.7–5.0%, respectively. The nitrogen content vary withina very narrow yet distinct ranges for the Raniganj coals (2.3–4.0%,dmmf basis) of Raniganj Sub-basin and Barakar coals (1.9–2.3%, dmmfbasis) of Jharia Sub-basin and sulfur content is 0.3–0.7% and 0.4–0.9%,respectively.
4.2. Petrography
The maceral composition and random reflectance (Rr) values de-termined through petrographic analyses are presented in Table 3.Overall range of random reflectance value of the suite of coals is0.53–1.23%. The Raniganj coals (0.53–0.72%) of Raniganj Sub-basinhave lower reflectance than the Barakar coals (1.09–1.23%) of JhariaSub-basin. The B-VIII seam coal from Jharia shows the highest re-flectance value of 1.23%. The lower reflectance values of Raniganj coals(0.53–0.72%) of Raniganj Sub-basin (Table 3) compared to the Barakarcoals of Jharia Sub-basin indicate that these coals are less mature andhave evolved through a different kind of thermal history than that ofJharia sub-basin.
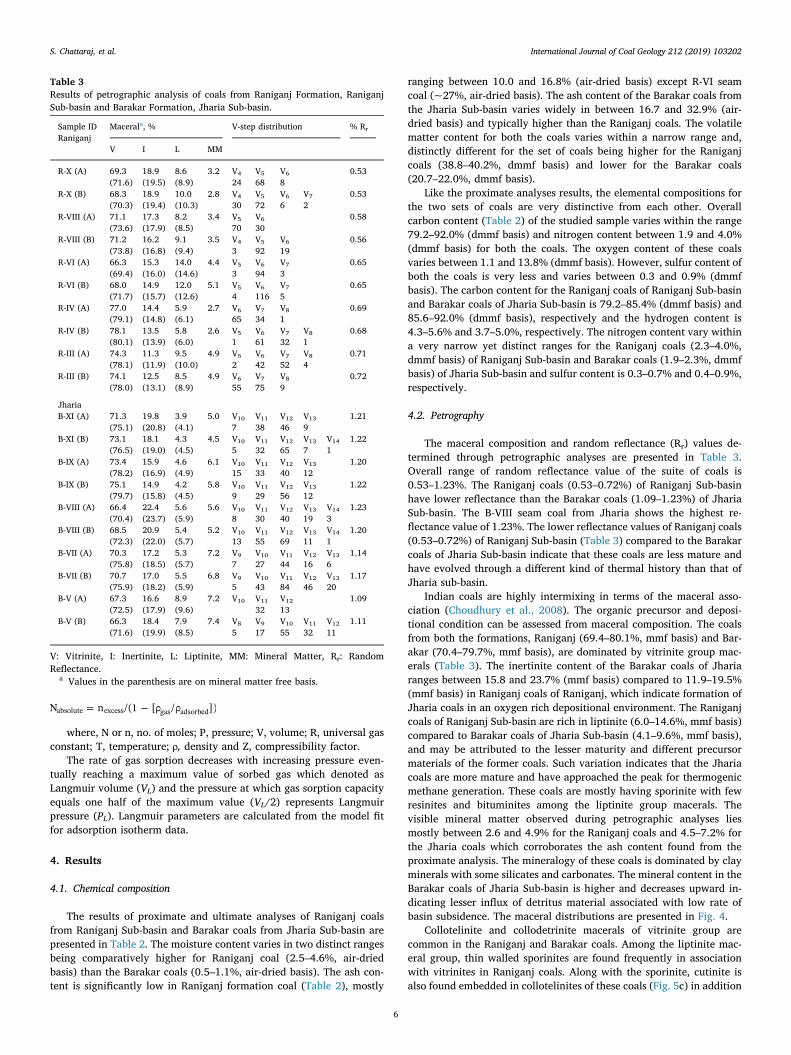
Indian coals are highly intermixing in terms of the maceral asso-ciation (Choudhury et al., 2008). The organic precursor and deposi-tional condition can be assessed from maceral composition. The coalsfrom both the formations, Raniganj (69.4–80.1%, mmf basis) and Bar-akar (70.4–79.7%, mmf basis), are dominated by vitrinite group mac-erals (Table 3). The inertinite content of the Barakar coals of Jhariaranges between 15.8 and 23.7% (mmf basis) compared to 11.9–19.5%(mmf basis) in Raniganj coals of Raniganj, which indicate formation ofJharia coals in an oxygen rich depositional environment. The Raniganjcoals of Raniganj Sub-basin are rich in liptinite (6.0–14.6%, mmf basis)compared to Barakar coals of Jharia Sub-basin (4.1–9.6%, mmf basis),and may be attributed to the lesser maturity and different precursormaterials of the former coals. Such variation indicates that the Jhariacoals are more mature and have approached the peak for thermogenicmethane generation. These coals are mostly having sporinite with fewresinites and bituminites among the liptinite group macerals. Thevisible mineral matter observed during petrographic analyses liesmostly between 2.6 and 4.9% for the Raniganj coals and 4.5–7.2% forthe Jharia coals which corroborates the ash content found from theproximate analysis. The mineralogy of these coals is dominated by clayminerals with some silicates and carbonates. The mineral content in theBarakar coals of Jharia Sub-basin is higher and decreases upward in-dicating lesser influx of detritus material associated with low rate ofbasin subsidence. The maceral distributions are presented in Fig. 4.
Collotelinite and collodetrinite macerals of vitrinite group arecommon in the Raniganj and Barakar coals. Among the liptinite mac-eral group, thin walled sporinites are found frequently in associationwith vitrinites in Raniganj coals. Along with the sporinite, cutinite isalso found embedded in collotelinites of these coals (Fig. 5c) in addition
Table 3Results of petrographic analysis of coals from Raniganj Formation, RaniganjSub-basin and Barakar Formation, Jharia Sub-basin.
Sample IDRaniganj
Macerala, % V-step distribution % Rr
V I L MM
R-X (A) 69.3 18.9 8.6 3.2 V4 V5 V6 0.53(71.6) (19.5) (8.9) 24 68 8
R-X (B) 68.3 18.9 10.0 2.8 V4 V5 V6 V7 0.53(70.3) (19.4) (10.3) 30 72 6 2
R-VIII (A) 71.1 17.3 8.2 3.4 V5 V6 0.58(73.6) (17.9) (8.5) 70 30
R-VIII (B) 71.2 16.2 9.1 3.5 V4 V5 V6 0.56(73.8) (16.8) (9.4) 3 92 19
R-VI (A) 66.3 15.3 14.0 4.4 V5 V6 V7 0.65(69.4) (16.0) (14.6) 3 94 3
R-VI (B) 68.0 14.9 12.0 5.1 V5 V6 V7 0.65(71.7) (15.7) (12.6) 4 116 5
R-IV (A) 77.0 14.4 5.9 2.7 V6 V7 V8 0.69(79.1) (14.8) (6.1) 65 34 1
R-IV (B) 78.1 13.5 5.8 2.6 V5 V6 V7 V8 0.68(80.1) (13.9) (6.0) 1 61 32 1
R-III (A) 74.3 11.3 9.5 4.9 V5 V6 V7 V8 0.71(78.1) (11.9) (10.0) 2 42 52 4
R-III (B) 74.1 12.5 8.5 4.9 V6 V7 V8 0.72(78.0) (13.1) (8.9) 55 75 9
JhariaB-XI (A) 71.3 19.8 3.9 5.0 V10 V11 V12 V13 1.21
(75.1) (20.8) (4.1) 7 38 46 9B-XI (B) 73.1 18.1 4.3 4.5 V10 V11 V12 V13 V14 1.22
(76.5) (19.0) (4.5) 5 32 65 7 1B-IX (A) 73.4 15.9 4.6 6.1 V10 V11 V12 V13 1.20
(78.2) (16.9) (4.9) 15 33 40 12B-IX (B) 75.1 14.9 4.2 5.8 V10 V11 V12 V13 1.22
(79.7) (15.8) (4.5) 9 29 56 12B-VIII (A) 66.4 22.4 5.6 5.6 V10 V11 V12 V13 V14 1.23
(70.4) (23.7) (5.9) 8 30 40 19 3B-VIII (B) 68.5 20.9 5.4 5.2 V10 V11 V12 V13 V14 1.20
(72.3) (22.0) (5.7) 13 55 69 11 1B-VII (A) 70.3 17.2 5.3 7.2 V9 V10 V11 V12 V13 1.14
(75.8) (18.5) (5.7) 7 27 44 16 6B-VII (B) 70.7 17.0 5.5 6.8 V9 V10 V11 V12 V13 1.17
(75.9) (18.2) (5.9) 5 43 84 46 20B-V (A) 67.3 16.6 8.9 7.2 V10 V11 V12 1.09
(72.5) (17.9) (9.6) 32 13B-V (B) 66.3 18.4 7.9 7.4 V8 V9 V10 V11 V12 1.11
(71.6) (19.9) (8.5) 5 17 55 32 11
V: Vitrinite, I: Inertinite, L: Liptinite, MM: Mineral Matter, Rr: RandomReflectance.
a Values in the parenthesis are on mineral matter free basis.
S. Chattaraj, et al. International Journal of Coal Geology 212 (2019) 103202
6
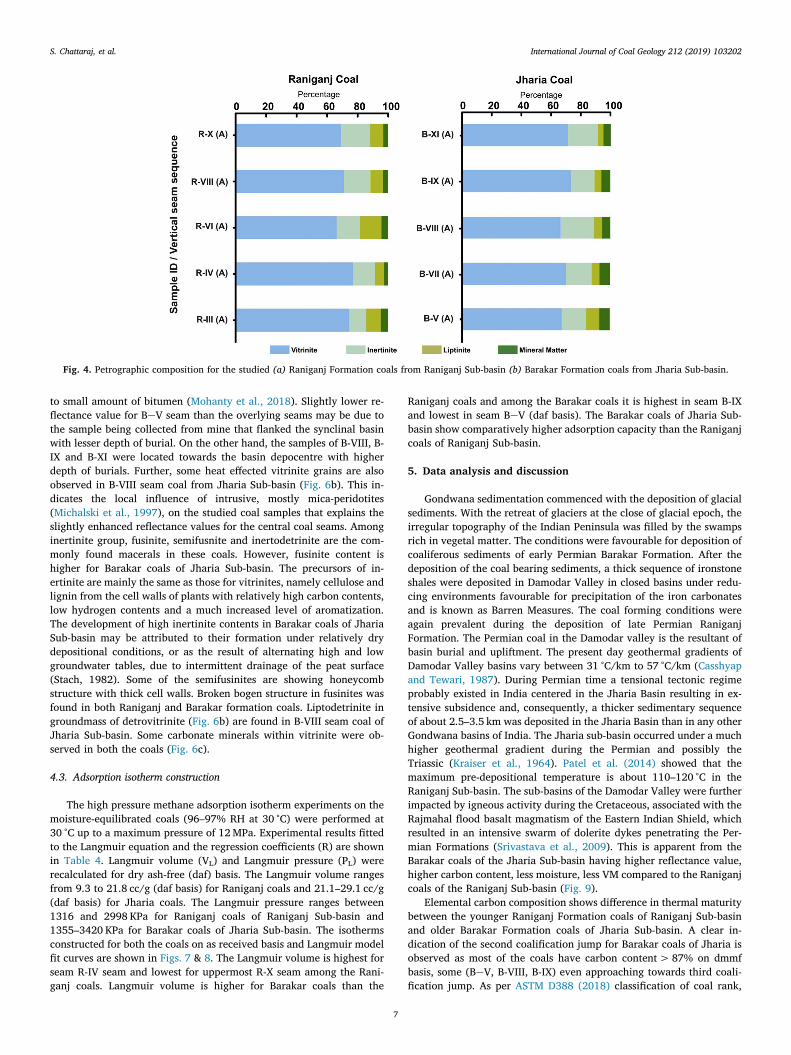
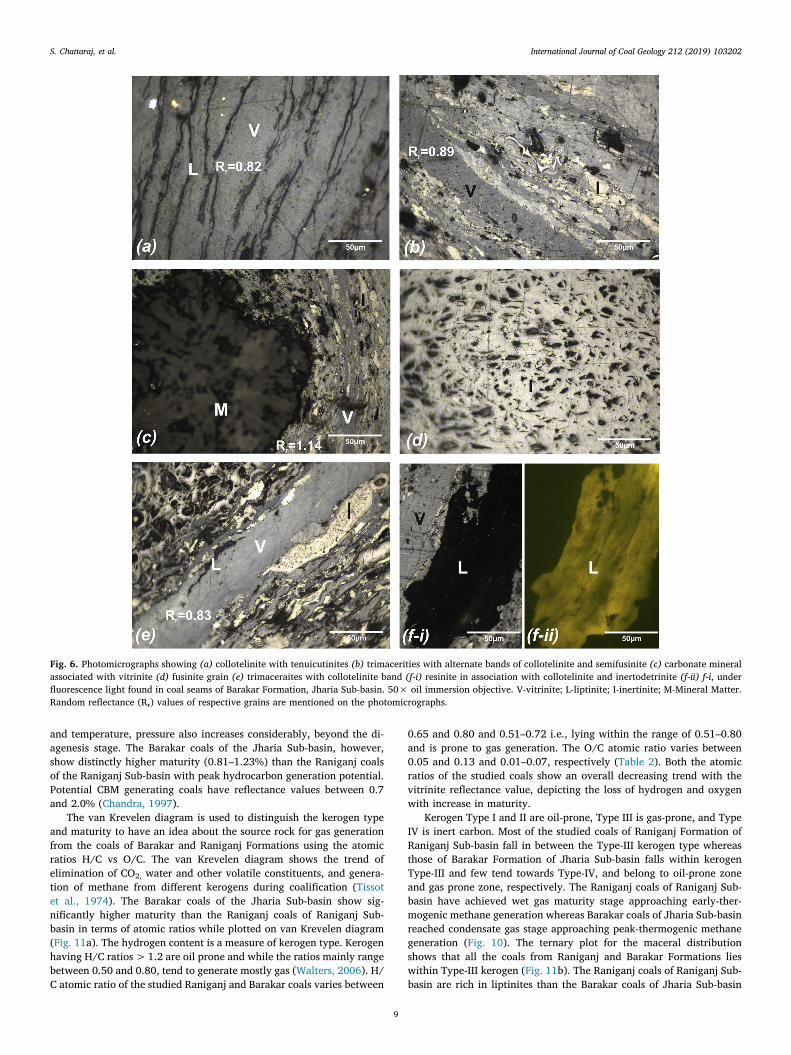
to small amount of bitumen (Mohanty et al., 2018). Slightly lower re-flectance value for BeV seam than the overlying seams may be due tothe sample being collected from mine that flanked the synclinal basinwith lesser depth of burial. On the other hand, the samples of B-VIII, B-IX and B-XI were located towards the basin depocentre with higherdepth of burials. Further, some heat effected vitrinite grains are alsoobserved in B-VIII seam coal from Jharia Sub-basin (Fig. 6b). This in-dicates the local influence of intrusive, mostly mica-peridotites(Michalski et al., 1997), on the studied coal samples that explains theslightly enhanced reflectance values for the central coal seams. Amonginertinite group, fusinite, semifusnite and inertodetrinite are the com-monly found macerals in these coals. However, fusinite content ishigher for Barakar coals of Jharia Sub-basin. The precursors of in-ertinite are mainly the same as those for vitrinites, namely cellulose andlignin from the cell walls of plants with relatively high carbon contents,low hydrogen contents and a much increased level of aromatization.The development of high inertinite contents in Barakar coals of JhariaSub-basin may be attributed to their formation under relatively drydepositional conditions, or as the result of alternating high and lowgroundwater tables, due to intermittent drainage of the peat surface(Stach, 1982). Some of the semifusinites are showing honeycombstructure with thick cell walls. Broken bogen structure in fusinites wasfound in both Raniganj and Barakar formation coals. Liptodetrinite ingroundmass of detrovitrinite (Fig. 6b) are found in B-VIII seam coal ofJharia Sub-basin. Some carbonate minerals within vitrinite were ob-served in both the coals (Fig. 6c).
4.3. Adsorption isotherm construction
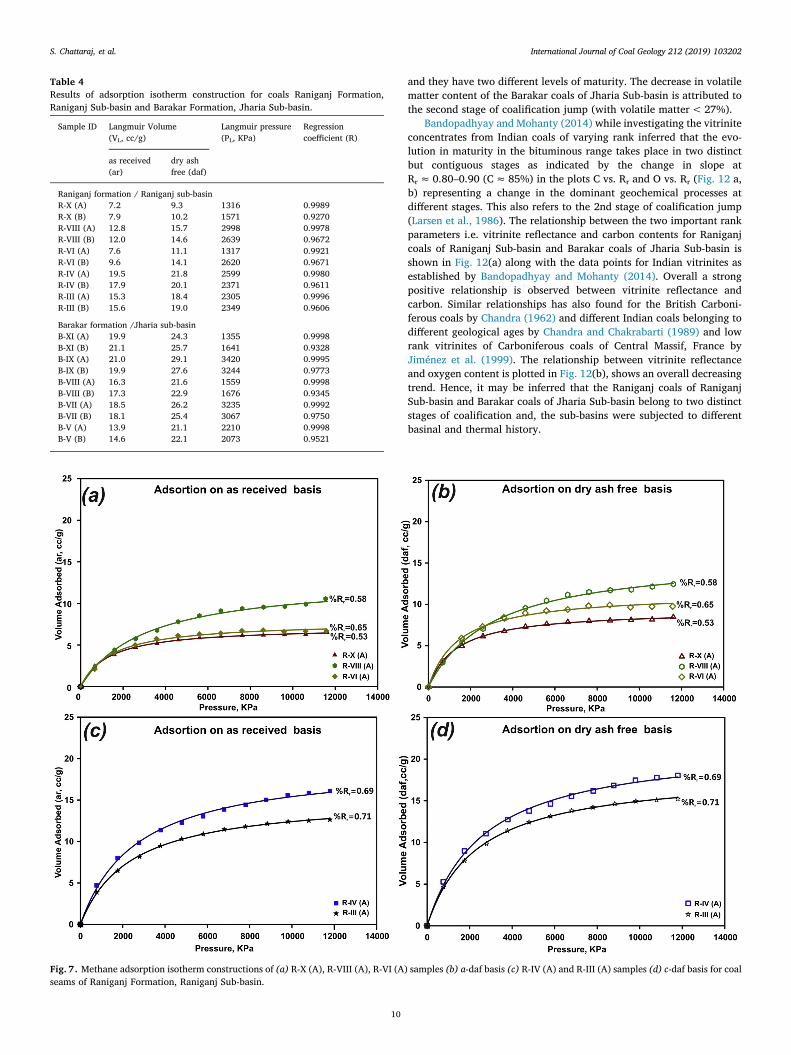
The high pressure methane adsorption isotherm experiments on themoisture-equilibrated coals (96–97% RH at 30 °C) were performed at30 °C up to a maximum pressure of 12 MPa. Experimental results fittedto the Langmuir equation and the regression coefficients (R) are shownin Table 4. Langmuir volume (VL) and Langmuir pressure (PL) wererecalculated for dry ash-free (daf) basis. The Langmuir volume rangesfrom 9.3 to 21.8 cc/g (daf basis) for Raniganj coals and 21.1–29.1 cc/g(daf basis) for Jharia coals. The Langmuir pressure ranges between1316 and 2998 KPa for Raniganj coals of Raniganj Sub-basin and1355–3420 KPa for Barakar coals of Jharia Sub-basin. The isothermsconstructed for both the coals on as received basis and Langmuir modelfit curves are shown in Figs. 7 & 8. The Langmuir volume is highest forseam R-IV seam and lowest for uppermost R-X seam among the Rani-ganj coals. Langmuir volume is higher for Barakar coals than the
Raniganj coals and among the Barakar coals it is highest in seam B-IXand lowest in seam BeV (daf basis). The Barakar coals of Jharia Sub-basin show comparatively higher adsorption capacity than the Raniganjcoals of Raniganj Sub-basin.
5. Data analysis and discussion
Gondwana sedimentation commenced with the deposition of glacialsediments. With the retreat of glaciers at the close of glacial epoch, theirregular topography of the Indian Peninsula was filled by the swampsrich in vegetal matter. The conditions were favourable for deposition ofcoaliferous sediments of early Permian Barakar Formation. After thedeposition of the coal bearing sediments, a thick sequence of ironstoneshales were deposited in Damodar Valley in closed basins under redu-cing environments favourable for precipitation of the iron carbonatesand is known as Barren Measures. The coal forming conditions wereagain prevalent during the deposition of late Permian RaniganjFormation. The Permian coal in the Damodar valley is the resultant ofbasin burial and upliftment. The present day geothermal gradients ofDamodar Valley basins vary between 31 °C/km to 57 °C/km (Casshyapand Tewari, 1987). During Permian time a tensional tectonic regimeprobably existed in India centered in the Jharia Basin resulting in ex-tensive subsidence and, consequently, a thicker sedimentary sequenceof about 2.5–3.5 km was deposited in the Jharia Basin than in any otherGondwana basins of India. The Jharia sub-basin occurred under a muchhigher geothermal gradient during the Permian and possibly theTriassic (Kraiser et al., 1964). Patel et al. (2014) showed that themaximum pre-depositional temperature is about 110–120 °C in theRaniganj Sub-basin. The sub-basins of the Damodar Valley were furtherimpacted by igneous activity during the Cretaceous, associated with theRajmahal flood basalt magmatism of the Eastern Indian Shield, whichresulted in an intensive swarm of dolerite dykes penetrating the Per-mian Formations (Srivastava et al., 2009). This is apparent from theBarakar coals of the Jharia Sub-basin having higher reflectance value,higher carbon content, less moisture, less VM compared to the Raniganjcoals of the Raniganj Sub-basin (Fig. 9).
Elemental carbon composition shows difference in thermal maturitybetween the younger Raniganj Formation coals of Raniganj Sub-basinand older Barakar Formation coals of Jharia Sub-basin. A clear in-dication of the second coalification jump for Barakar coals of Jharia isobserved as most of the coals have carbon content > 87% on dmmfbasis, some (BeV, B-VIII, B-IX) even approaching towards third coali-fication jump. As per ASTM D388 (2018) classification of coal rank,
Fig. 4. Petrographic composition for the studied (a) Raniganj Formation coals from Raniganj Sub-basin (b) Barakar Formation coals from Jharia Sub-basin.
S. Chattaraj, et al. International Journal of Coal Geology 212 (2019) 103202
7
chemical analyses data of the studied reveals that Raniganj coals ofRaniganj Sub-basin belong to high volatile bituminous A type whereasthe Barakar coals of Jharia Sub-basin belong to medium volatile bitu-minous to low volatile bituminous type.
5.1. Gas generation potential: organic matter type and maturation
The compositional changes are indicative of the maturity stage of aparticular kerogen and include loss of hydrogen, oxygen, nitrogen, andsulfur in the form of different functional groups that further promotearomatization associated with increasing depth of burial. Various gasesare evolved during thermal transformation of organic matter duringcoalification. CO2 and CH4 are the principal gases formed at low andhigh rank, respectively. Deoxygenation reactions including decarbox-ylation and dehydroxylation primarily occur in low rank coals below85% C and after this rank, dehydrogenation reactions set in.Aromatization leads to proper molecular stacking in sheets therebyincrease in molecular density and vitrinite reflectance, as well aschanges in spore coloration, with increasing depth. The microporosity
increases with increase in aromaticity which in turn increases thesorption capacity of the coals with increase in rank.
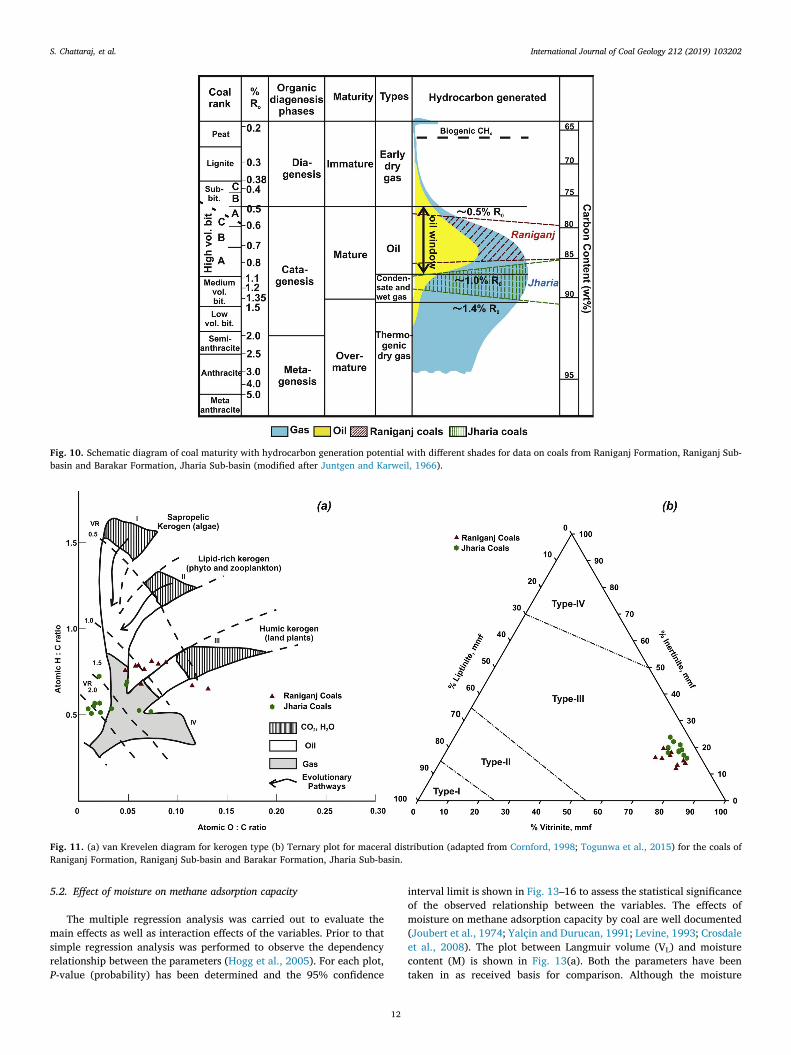
Type of organic matter and thermal maturity of a source rock de-termines its hydrocarbon generation potential. Elemental compositionsare taken as atomic ratios and plotted in van Krevelen diagram (VanKrevelen, 1993). Due to kerogen mixtures, however, obtaining maturityonly through elemental analyses is approximate (Tissot and Welte,1984). Hence, vitrinite reflectance is the most reliable and commonlyused maturity parameter measured on the rock and kerogen (Hunt,1996). Based on the vitrinite reflectance and other maturity parameterssource rocks are identified as immature, mature and over mature rock(Fig. 10). The early biogenic gas generation starts below vitrinite re-flectance value of < 0.5% and is not significant for generating hydro-carbons (Cornford, 1998). Significant methane generation is mainly dueto thermal origin and occurs at high-volatile bituminous and higherranks having the vitrinite reflectance value > 0.6% (Rice, 1993).Ther-mally mature source rocks are exposed to the temperature range of50 °C–200 °C having the vitrinite reflectance value ranging between 0.5and 1.35% (Peters and Cassa, 1994). With the increase of burial depth
Fig. 5. Photomicrographs showing (a) fusinite and mineral matter associated with collotellinite (b) fusinite and inertodetrinite embedded in collotelinite (c-i)tenuicutinite embedded in telinite (c-ii) c-i, under fluorescence light (d) telovitrinite (e) liptodetrinite, inertodetrinite and mineral matter in collotelinite (f) car-bonates within liptinite band associated with alternate bands of collotelinite found in coal seams of Raniganj Formation, Raniganj Sub-basin. 50× oil immersionobjective. V, vitrinite; I, inertinite; L, liptinite; M, mineral matter. Random reflectance (Rr) values of respective grains are mentioned on the photomicrographs.
S. Chattaraj, et al. International Journal of Coal Geology 212 (2019) 103202
8
and temperature, pressure also increases considerably, beyond the di-agenesis stage. The Barakar coals of the Jharia Sub-basin, however,show distinctly higher maturity (0.81–1.23%) than the Raniganj coalsof the Raniganj Sub-basin with peak hydrocarbon generation potential.Potential CBM generating coals have reflectance values between 0.7and 2.0% (Chandra, 1997).
The van Krevelen diagram is used to distinguish the kerogen typeand maturity to have an idea about the source rock for gas generationfrom the coals of Barakar and Raniganj Formations using the atomicratios H/C vs O/C. The van Krevelen diagram shows the trend ofelimination of CO2, water and other volatile constituents, and genera-tion of methane from different kerogens during coalification (Tissotet al., 1974). The Barakar coals of the Jharia Sub-basin show sig-nificantly higher maturity than the Raniganj coals of Raniganj Sub-basin in terms of atomic ratios while plotted on van Krevelen diagram(Fig. 11a). The hydrogen content is a measure of kerogen type. Kerogenhaving H/C ratios > 1.2 are oil prone and while the ratios mainly rangebetween 0.50 and 0.80, tend to generate mostly gas (Walters, 2006). H/C atomic ratio of the studied Raniganj and Barakar coals varies between
0.65 and 0.80 and 0.51–0.72 i.e., lying within the range of 0.51–0.80and is prone to gas generation. The O/C atomic ratio varies between0.05 and 0.13 and 0.01–0.07, respectively (Table 2). Both the atomicratios of the studied coals show an overall decreasing trend with thevitrinite reflectance value, depicting the loss of hydrogen and oxygenwith increase in maturity.
Kerogen Type I and II are oil-prone, Type III is gas-prone, and TypeIV is inert carbon. Most of the studied coals of Raniganj Formation ofRaniganj Sub-basin fall in between the Type-III kerogen type whereasthose of Barakar Formation of Jharia Sub-basin falls within kerogenType-III and few tend towards Type-IV, and belong to oil-prone zoneand gas prone zone, respectively. The Raniganj coals of Raniganj Sub-basin have achieved wet gas maturity stage approaching early-ther-mogenic methane generation whereas Barakar coals of Jharia Sub-basinreached condensate gas stage approaching peak-thermogenic methanegeneration (Fig. 10). The ternary plot for the maceral distributionshows that all the coals from Raniganj and Barakar Formations lieswithin Type-III kerogen (Fig. 11b). The Raniganj coals of Raniganj Sub-basin are rich in liptinites than the Barakar coals of Jharia Sub-basin
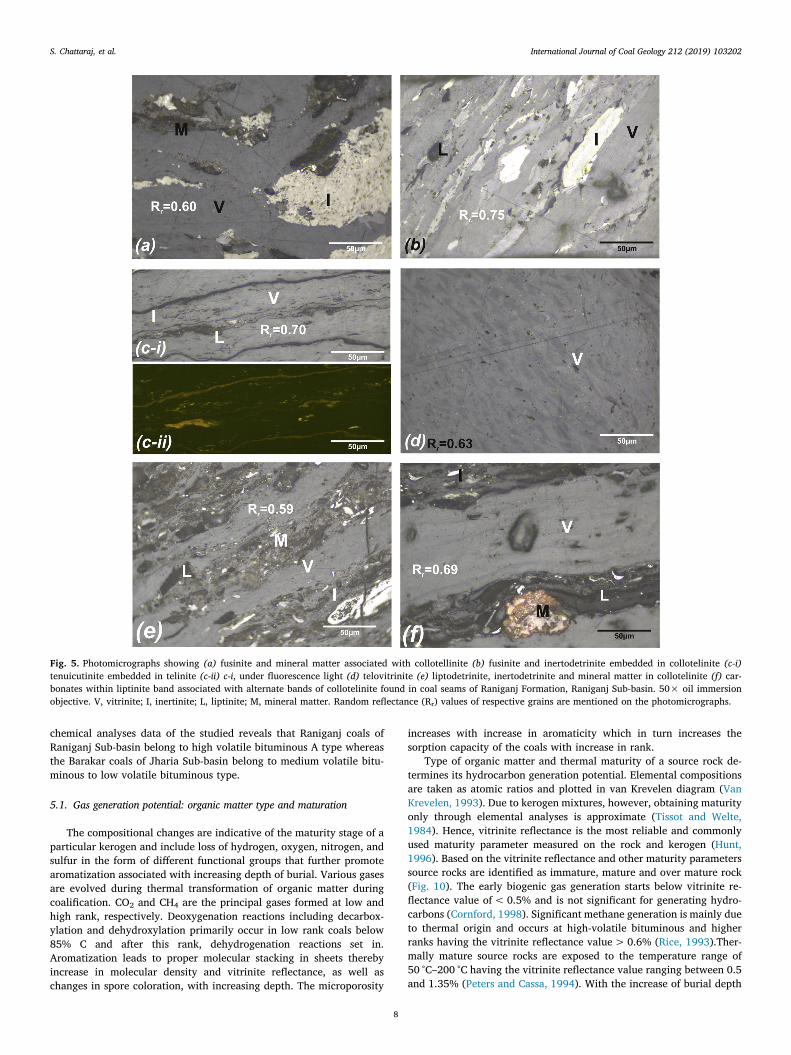
Fig. 6. Photomicrographs showing (a) collotelinite with tenuicutinites (b) trimacerities with alternate bands of collotelinite and semifusinite (c) carbonate mineralassociated with vitrinite (d) fusinite grain (e) trimaceraites with collotelinite band (f-i) resinite in association with collotelinite and inertodetrinite (f-ii) f-i, underfluorescence light found in coal seams of Barakar Formation, Jharia Sub-basin. 50× oil immersion objective. V-vitrinite; L-liptinite; I-inertinite; M-Mineral Matter.Random reflectance (Rr) values of respective grains are mentioned on the photomicrographs.
S. Chattaraj, et al. International Journal of Coal Geology 212 (2019) 103202
9
and they have two different levels of maturity. The decrease in volatilematter content of the Barakar coals of Jharia Sub-basin is attributed tothe second stage of coalification jump (with volatile matter < 27%).
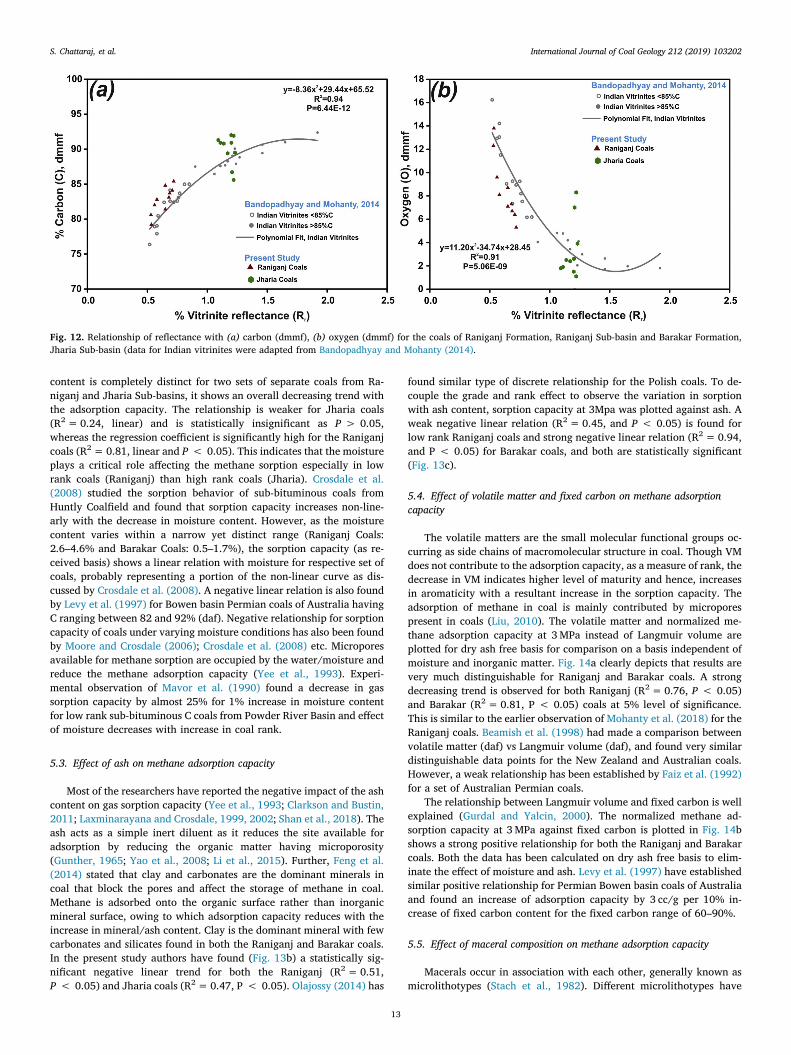
Bandopadhyay and Mohanty (2014) while investigating the vitriniteconcentrates from Indian coals of varying rank inferred that the evo-lution in maturity in the bituminous range takes place in two distinctbut contiguous stages as indicated by the change in slope atRr ≈ 0.80–0.90 (C ≈ 85%) in the plots C vs. Rr and O vs. Rr (Fig. 12 a,b) representing a change in the dominant geochemical processes atdifferent stages. This also refers to the 2nd stage of coalification jump(Larsen et al., 1986). The relationship between the two important rankparameters i.e. vitrinite reflectance and carbon contents for Raniganjcoals of Raniganj Sub-basin and Barakar coals of Jharia Sub-basin isshown in Fig. 12(a) along with the data points for Indian vitrinites asestablished by Bandopadhyay and Mohanty (2014). Overall a strongpositive relationship is observed between vitrinite reflectance andcarbon. Similar relationships has also found for the British Carboni-ferous coals by Chandra (1962) and different Indian coals belonging todifferent geological ages by Chandra and Chakrabarti (1989) and lowrank vitrinites of Carboniferous coals of Central Massif, France byJiménez et al. (1999). The relationship between vitrinite reflectanceand oxygen content is plotted in Fig. 12(b), shows an overall decreasingtrend. Hence, it may be inferred that the Raniganj coals of RaniganjSub-basin and Barakar coals of Jharia Sub-basin belong to two distinctstages of coalification and, the sub-basins were subjected to differentbasinal and thermal history.
Table 4Results of adsorption isotherm construction for coals Raniganj Formation,Raniganj Sub-basin and Barakar Formation, Jharia Sub-basin.
Sample ID Langmuir Volume(VL, cc/g)
Langmuir pressure(PL, KPa)
Regressioncoefficient (R)
as received(ar)
dry ashfree (daf)
Raniganj formation / Raniganj sub-basinR-X (A) 7.2 9.3 1316 0.9989R-X (B) 7.9 10.2 1571 0.9270R-VIII (A) 12.8 15.7 2998 0.9978R-VIII (B) 12.0 14.6 2639 0.9672R-VI (A) 7.6 11.1 1317 0.9921R-VI (B) 9.6 14.1 2620 0.9671R-IV (A) 19.5 21.8 2599 0.9980R-IV (B) 17.9 20.1 2371 0.9611R-III (A) 15.3 18.4 2305 0.9996R-III (B) 15.6 19.0 2349 0.9606
Barakar formation /Jharia sub-basinB-XI (A) 19.9 24.3 1355 0.9998B-XI (B) 21.1 25.7 1641 0.9328B-IX (A) 21.0 29.1 3420 0.9995B-IX (B) 19.9 27.6 3244 0.9773B-VIII (A) 16.3 21.6 1559 0.9998B-VIII (B) 17.3 22.9 1676 0.9345B-VII (A) 18.5 26.2 3235 0.9992B-VII (B) 18.1 25.4 3067 0.9750B-V (A) 13.9 21.1 2210 0.9998B-V (B) 14.6 22.1 2073 0.9521
Fig. 7. Methane adsorption isotherm constructions of (a) R-X (A), R-VIII (A), R-VI (A) samples (b) a-daf basis (c) R-IV (A) and R-III (A) samples (d) c-daf basis for coalseams of Raniganj Formation, Raniganj Sub-basin.
S. Chattaraj, et al. International Journal of Coal Geology 212 (2019) 103202
10
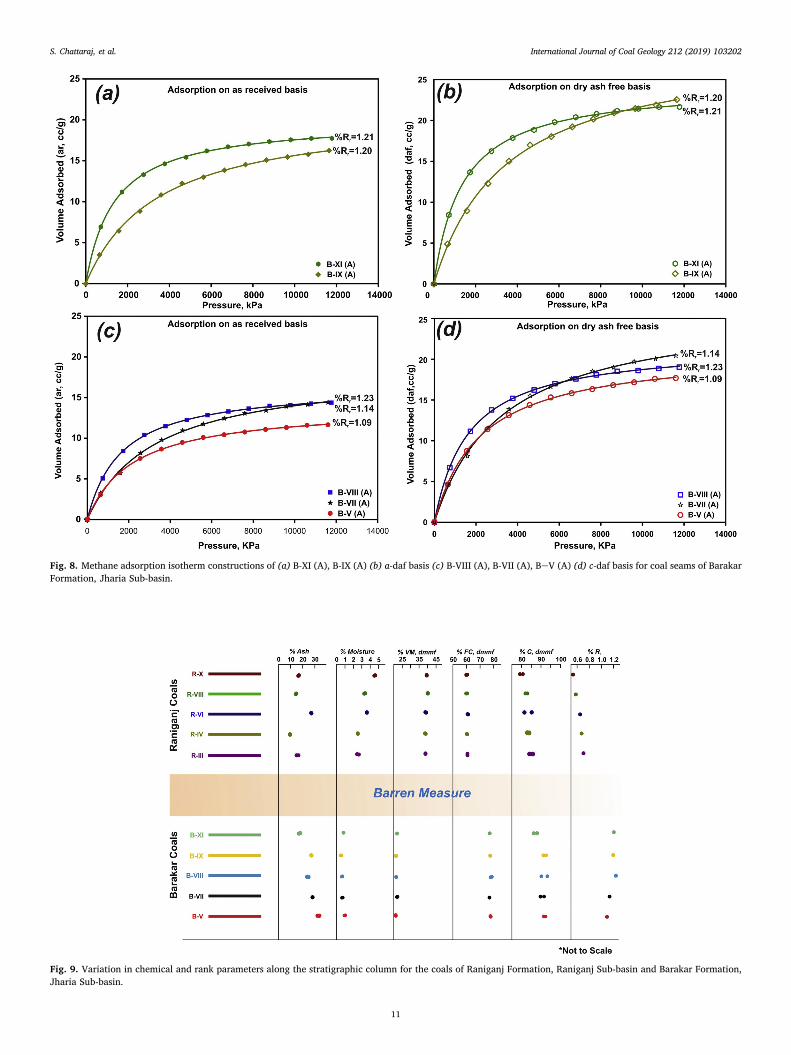
Fig. 8. Methane adsorption isotherm constructions of (a) B-XI (A), B-IX (A) (b) a-daf basis (c) B-VIII (A), B-VII (A), BeV (A) (d) c-daf basis for coal seams of BarakarFormation, Jharia Sub-basin.
Fig. 9. Variation in chemical and rank parameters along the stratigraphic column for the coals of Raniganj Formation, Raniganj Sub-basin and Barakar Formation,Jharia Sub-basin.
S. Chattaraj, et al. International Journal of Coal Geology 212 (2019) 103202
11
5.2. Effect of moisture on methane adsorption capacity
The multiple regression analysis was carried out to evaluate themain effects as well as interaction effects of the variables. Prior to thatsimple regression analysis was performed to observe the dependencyrelationship between the parameters (Hogg et al., 2005). For each plot,P-value (probability) has been determined and the 95% confidence
interval limit is shown in Fig. 13–16 to assess the statistical significanceof the observed relationship between the variables. The effects ofmoisture on methane adsorption capacity by coal are well documented(Joubert et al., 1974; Yalçin and Durucan, 1991; Levine, 1993; Crosdaleet al., 2008). The plot between Langmuir volume (VL) and moisturecontent (M) is shown in Fig. 13(a). Both the parameters have beentaken in as received basis for comparison. Although the moisture
Fig. 10. Schematic diagram of coal maturity with hydrocarbon generation potential with different shades for data on coals from Raniganj Formation, Raniganj Sub-basin and Barakar Formation, Jharia Sub-basin (modified after Juntgen and Karweil, 1966).
Fig. 11. (a) van Krevelen diagram for kerogen type (b) Ternary plot for maceral distribution (adapted from Cornford, 1998; Togunwa et al., 2015) for the coals ofRaniganj Formation, Raniganj Sub-basin and Barakar Formation, Jharia Sub-basin.
S. Chattaraj, et al. International Journal of Coal Geology 212 (2019) 103202
12
content is completely distinct for two sets of separate coals from Ra-niganj and Jharia Sub-basins, it shows an overall decreasing trend withthe adsorption capacity. The relationship is weaker for Jharia coals(R2 = 0.24, linear) and is statistically insignificant as P > 0.05,whereas the regression coefficient is significantly high for the Raniganjcoals (R2 = 0.81, linear and P < 0.05). This indicates that the moistureplays a critical role affecting the methane sorption especially in lowrank coals (Raniganj) than high rank coals (Jharia). Crosdale et al.(2008) studied the sorption behavior of sub-bituminous coals fromHuntly Coalfield and found that sorption capacity increases non-line-arly with the decrease in moisture content. However, as the moisturecontent varies within a narrow yet distinct range (Raniganj Coals:2.6–4.6% and Barakar Coals: 0.5–1.7%), the sorption capacity (as re-ceived basis) shows a linear relation with moisture for respective set ofcoals, probably representing a portion of the non-linear curve as dis-cussed by Crosdale et al. (2008). A negative linear relation is also foundby Levy et al. (1997) for Bowen basin Permian coals of Australia havingC ranging between 82 and 92% (daf). Negative relationship for sorptioncapacity of coals under varying moisture conditions has also been foundby Moore and Crosdale (2006); Crosdale et al. (2008) etc. Microporesavailable for methane sorption are occupied by the water/moisture andreduce the methane adsorption capacity (Yee et al., 1993). Experi-mental observation of Mavor et al. (1990) found a decrease in gassorption capacity by almost 25% for 1% increase in moisture contentfor low rank sub-bituminous C coals from Powder River Basin and effectof moisture decreases with increase in coal rank.
5.3. Effect of ash on methane adsorption capacity
Most of the researchers have reported the negative impact of the ashcontent on gas sorption capacity (Yee et al., 1993; Clarkson and Bustin,2011; Laxminarayana and Crosdale, 1999, 2002; Shan et al., 2018). Theash acts as a simple inert diluent as it reduces the site available foradsorption by reducing the organic matter having microporosity(Gunther, 1965; Yao et al., 2008; Li et al., 2015). Further, Feng et al.(2014) stated that clay and carbonates are the dominant minerals incoal that block the pores and affect the storage of methane in coal.Methane is adsorbed onto the organic surface rather than inorganicmineral surface, owing to which adsorption capacity reduces with theincrease in mineral/ash content. Clay is the dominant mineral with fewcarbonates and silicates found in both the Raniganj and Barakar coals.In the present study authors have found (Fig. 13b) a statistically sig-nificant negative linear trend for both the Raniganj (R2 = 0.51,P < 0.05) and Jharia coals (R2 = 0.47, P < 0.05). Olajossy (2014) has
found similar type of discrete relationship for the Polish coals. To de-couple the grade and rank effect to observe the variation in sorptionwith ash content, sorption capacity at 3Mpa was plotted against ash. Aweak negative linear relation (R2 = 0.45, and P < 0.05) is found forlow rank Raniganj coals and strong negative linear relation (R2 = 0.94,and P < 0.05) for Barakar coals, and both are statistically significant(Fig. 13c).
5.4. Effect of volatile matter and fixed carbon on methane adsorptioncapacity
The volatile matters are the small molecular functional groups oc-curring as side chains of macromolecular structure in coal. Though VMdoes not contribute to the adsorption capacity, as a measure of rank, thedecrease in VM indicates higher level of maturity and hence, increasesin aromaticity with a resultant increase in the sorption capacity. Theadsorption of methane in coal is mainly contributed by microporespresent in coals (Liu, 2010). The volatile matter and normalized me-thane adsorption capacity at 3 MPa instead of Langmuir volume areplotted for dry ash free basis for comparison on a basis independent ofmoisture and inorganic matter. Fig. 14a clearly depicts that results arevery much distinguishable for Raniganj and Barakar coals. A strongdecreasing trend is observed for both Raniganj (R2 = 0.76, P < 0.05)and Barakar (R2 = 0.81, P < 0.05) coals at 5% level of significance.This is similar to the earlier observation of Mohanty et al. (2018) for theRaniganj coals. Beamish et al. (1998) had made a comparison betweenvolatile matter (daf) vs Langmuir volume (daf), and found very similardistinguishable data points for the New Zealand and Australian coals.However, a weak relationship has been established by Faiz et al. (1992)for a set of Australian Permian coals.
The relationship between Langmuir volume and fixed carbon is wellexplained (Gurdal and Yalcin, 2000). The normalized methane ad-sorption capacity at 3 MPa against fixed carbon is plotted in Fig. 14bshows a strong positive relationship for both the Raniganj and Barakarcoals. Both the data has been calculated on dry ash free basis to elim-inate the effect of moisture and ash. Levy et al. (1997) have establishedsimilar positive relationship for Permian Bowen basin coals of Australiaand found an increase of adsorption capacity by 3 cc/g per 10% in-crease of fixed carbon content for the fixed carbon range of 60–90%.
5.5. Effect of maceral composition on methane adsorption capacity
Macerals occur in association with each other, generally known asmicrolithotypes (Stach et al., 1982). Different microlithotypes have
Fig. 12. Relationship of reflectance with (a) carbon (dmmf), (b) oxygen (dmmf) for the coals of Raniganj Formation, Raniganj Sub-basin and Barakar Formation,Jharia Sub-basin (data for Indian vitrinites were adapted from Bandopadhyay and Mohanty (2014).
S. Chattaraj, et al. International Journal of Coal Geology 212 (2019) 103202
13

different pore size and pore structure at the same rank and/or mineralcontent, which mainly control the methane storage capacity(Laxminarayana and Crosdale, 2002; Chattaraj et al., 2016). Maceralcomposition of the studied coals has been presented in section 4.2. Theinfluence of macerals on CH4 storage capacity is shown in Fig. 15 (a-c).
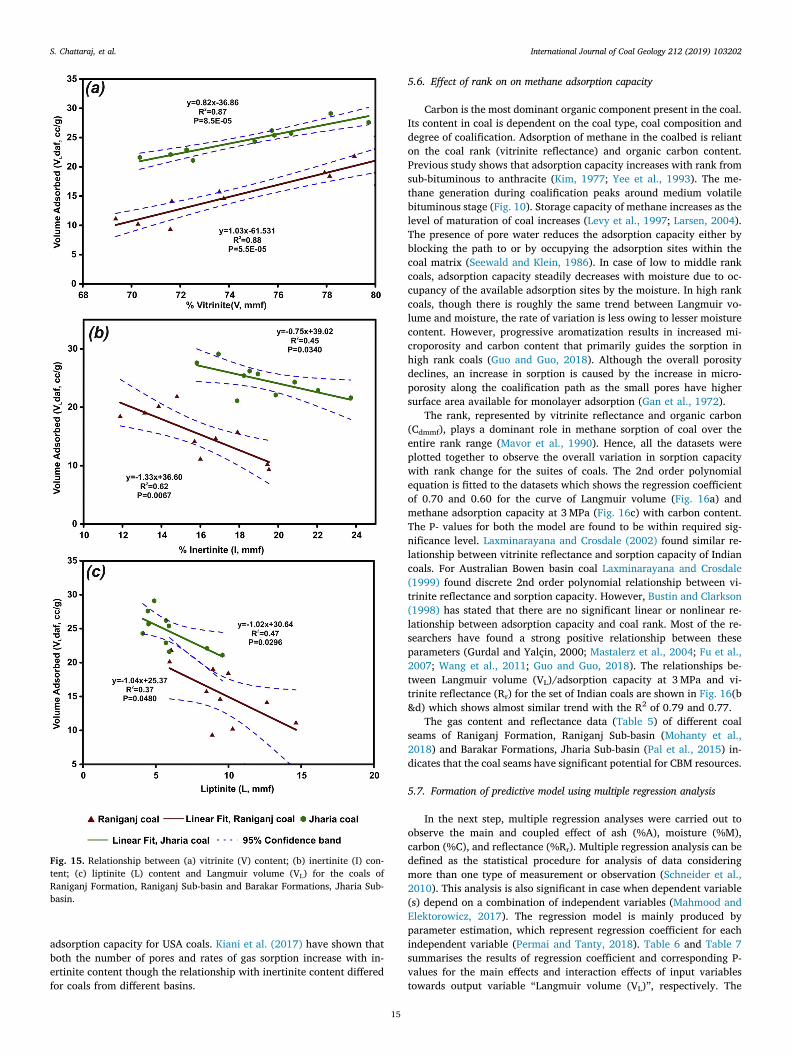
As the inorganic mineral matter of the coal has the negative effect onCH4 storage capacity, for the better understanding of the effect ofmaceral composition Langmuir volume has been converted into the dryash free (daf) basis whereas maceral percentage has been converted into visible mineral matter free (mmf) basis. Many researchers have al-ready discussed the control of maceral composition on adsorption ca-pacity of coals from different basins (Ettinger et al., 1966; Faiz et al.,2007; Lamberson and Bustin, 1993; Bustin et al., 1995; Crosdale et al.,1998; Clarkson and Bustin, 1999; Shan et al., 2018). Most of the re-searchers have found a positive relationship with the vitrinite content(ref). Present study also shows a statistically significant increasing trendfor Langmuir volume (VL)with vitrinite content (Fig. 15a; Raniganjcoals- R2 = 0.88, P < 0.05; Barakar coals- R2 = 0.87, P < 0.05), ne-gative trend with inertinite (Fig. 15b; R2 = 0.62, P < 0.05 andR2 = 0.45, P < 0.05 for both Raniganj and Barakar coals respectively)and with liptinite (Fig. 15c; R2 = 0.37, and R2 = 0.47, P < 0.05 forboth Raniganj and Barakar coals respectively). As vitrinite containhigher microsporosity compared to other maceral groups, the adsorp-tion capacity increases with increase in vitrinite content(Laxminarayana and Crosdale, 1999). The difference in trend for coalsfrom two sub-basins indicate that they have different types of precursororganic matter and have evolved through different degrees of thermalmaturity. However, Carroll and Pashin (2003) and Mastalerz et al.(2004) did not find any trend between maceral composition and CH4
Fig. 13. Effect of (a) moisture content and (b) ash content on Langmuir Volume(VL), and effect of (c) ash content on normalized methane adsorption capacityat 3 MPa for the coals of Raniganj Formation, Raniganj Sub-basin and BarakarFormation, Jharia Sub-basin.
Fig. 14. Variation in normalized methane adsorption capacity at 3 MPa with (a)volatile matter (b) fixed carbon for the coals of Raniganj Formation, RaniganjSub-basin and Barakar Formations, Jharia Sub-basin.
S. Chattaraj, et al. International Journal of Coal Geology 212 (2019) 103202
14
adsorption capacity for USA coals. Kiani et al. (2017) have shown thatboth the number of pores and rates of gas sorption increase with in-ertinite content though the relationship with inertinite content differedfor coals from different basins.
5.6. Effect of rank on on methane adsorption capacity
Carbon is the most dominant organic component present in the coal.Its content in coal is dependent on the coal type, coal composition anddegree of coalification. Adsorption of methane in the coalbed is relianton the coal rank (vitrinite reflectance) and organic carbon content.Previous study shows that adsorption capacity increases with rank fromsub-bituminous to anthracite (Kim, 1977; Yee et al., 1993). The me-thane generation during coalification peaks around medium volatilebituminous stage (Fig. 10). Storage capacity of methane increases as thelevel of maturation of coal increases (Levy et al., 1997; Larsen, 2004).The presence of pore water reduces the adsorption capacity either byblocking the path to or by occupying the adsorption sites within thecoal matrix (Seewald and Klein, 1986). In case of low to middle rankcoals, adsorption capacity steadily decreases with moisture due to oc-cupancy of the available adsorption sites by the moisture. In high rankcoals, though there is roughly the same trend between Langmuir vo-lume and moisture, the rate of variation is less owing to lesser moisturecontent. However, progressive aromatization results in increased mi-croporosity and carbon content that primarily guides the sorption inhigh rank coals (Guo and Guo, 2018). Although the overall porositydeclines, an increase in sorption is caused by the increase in micro-porosity along the coalification path as the small pores have highersurface area available for monolayer adsorption (Gan et al., 1972).
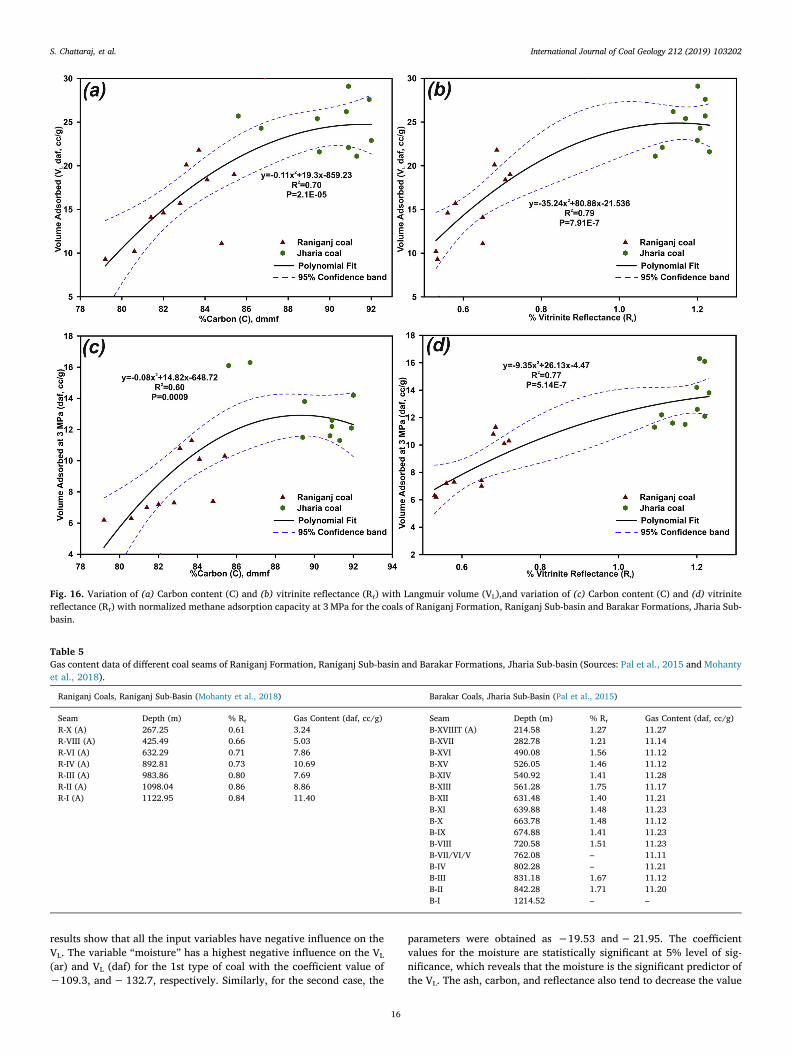
The rank, represented by vitrinite reflectance and organic carbon(Cdmmf), plays a dominant role in methane sorption of coal over theentire rank range (Mavor et al., 1990). Hence, all the datasets wereplotted together to observe the overall variation in sorption capacitywith rank change for the suites of coals. The 2nd order polynomialequation is fitted to the datasets which shows the regression coefficientof 0.70 and 0.60 for the curve of Langmuir volume (Fig. 16a) andmethane adsorption capacity at 3 MPa (Fig. 16c) with carbon content.The P- values for both the model are found to be within required sig-nificance level. Laxminarayana and Crosdale (2002) found similar re-lationship between vitrinite reflectance and sorption capacity of Indiancoals. For Australian Bowen basin coal Laxminarayana and Crosdale(1999) found discrete 2nd order polynomial relationship between vi-trinite reflectance and sorption capacity. However, Bustin and Clarkson(1998) has stated that there are no significant linear or nonlinear re-lationship between adsorption capacity and coal rank. Most of the re-searchers have found a strong positive relationship between theseparameters (Gurdal and Yalçin, 2000; Mastalerz et al., 2004; Fu et al.,2007; Wang et al., 2011; Guo and Guo, 2018). The relationships be-tween Langmuir volume (VL)/adsorption capacity at 3 MPa and vi-trinite reflectance (Rr) for the set of Indian coals are shown in Fig. 16(b&d) which shows almost similar trend with the R2 of 0.79 and 0.77.
The gas content and reflectance data (Table 5) of different coalseams of Raniganj Formation, Raniganj Sub-basin (Mohanty et al.,2018) and Barakar Formations, Jharia Sub-basin (Pal et al., 2015) in-dicates that the coal seams have significant potential for CBM resources.
5.7. Formation of predictive model using multiple regression analysis
In the next step, multiple regression analyses were carried out toobserve the main and coupled effect of ash (%A), moisture (%M),carbon (%C), and reflectance (%Rr). Multiple regression analysis can bedefined as the statistical procedure for analysis of data consideringmore than one type of measurement or observation (Schneider et al.,2010). This analysis is also significant in case when dependent variable(s) depend on a combination of independent variables (Mahmood andElektorowicz, 2017). The regression model is mainly produced byparameter estimation, which represent regression coefficient for eachindependent variable (Permai and Tanty, 2018). Table 6 and Table 7summarises the results of regression coefficient and corresponding P-values for the main effects and interaction effects of input variablestowards output variable “Langmuir volume (VL)”, respectively. The
Fig. 15. Relationship between (a) vitrinite (V) content; (b) inertinite (I) con-tent; (c) liptinite (L) content and Langmuir volume (VL) for the coals ofRaniganj Formation, Raniganj Sub-basin and Barakar Formations, Jharia Sub-basin.
S. Chattaraj, et al. International Journal of Coal Geology 212 (2019) 103202
15
results show that all the input variables have negative influence on theVL. The variable “moisture” has a highest negative influence on the VL
(ar) and VL (daf) for the 1st type of coal with the coefficient value of−109.3, and − 132.7, respectively. Similarly, for the second case, the
parameters were obtained as −19.53 and − 21.95. The coefficientvalues for the moisture are statistically significant at 5% level of sig-nificance, which reveals that the moisture is the significant predictor ofthe VL. The ash, carbon, and reflectance also tend to decrease the value
Fig. 16. Variation of (a) Carbon content (C) and (b) vitrinite reflectance (Rr) with Langmuir volume (VL),and variation of (c) Carbon content (C) and (d) vitrinitereflectance (Rr) with normalized methane adsorption capacity at 3 MPa for the coals of Raniganj Formation, Raniganj Sub-basin and Barakar Formations, Jharia Sub-basin.
Table 5Gas content data of different coal seams of Raniganj Formation, Raniganj Sub-basin and Barakar Formations, Jharia Sub-basin (Sources: Pal et al., 2015 and Mohantyet al., 2018).
Raniganj Coals, Raniganj Sub-Basin (Mohanty et al., 2018) Barakar Coals, Jharia Sub-Basin (Pal et al., 2015)
Seam Depth (m) % Rr Gas Content (daf, cc/g) Seam Depth (m) % Rr Gas Content (daf, cc/g)R-X (A) 267.25 0.61 3.24 B-XVIIIT (A) 214.58 1.27 11.27R-VIII (A) 425.49 0.66 5.03 B-XVII 282.78 1.21 11.14R-VI (A) 632.29 0.71 7.86 B-XVI 490.08 1.56 11.12R-IV (A) 892.81 0.73 10.69 B-XV 526.05 1.46 11.12R-III (A) 983.86 0.80 7.69 B-XIV 540.92 1.41 11.28R-II (A) 1098.04 0.86 8.86 B-XIII 561.28 1.75 11.17R-I (A) 1122.95 0.84 11.40 B-XII 631.48 1.40 11.21
B-XI 639.88 1.48 11.23B-X 663.78 1.48 11.12B-IX 674.88 1.41 11.23B-VIII 720.58 1.51 11.23B-VII/VI/V 762.08 – 11.11B-IV 802.28 – 11.21B-III 831.18 1.67 11.12B-II 842.28 1.71 11.20B-I 1214.52 – –
S. Chattaraj, et al. International Journal of Coal Geology 212 (2019) 103202
16
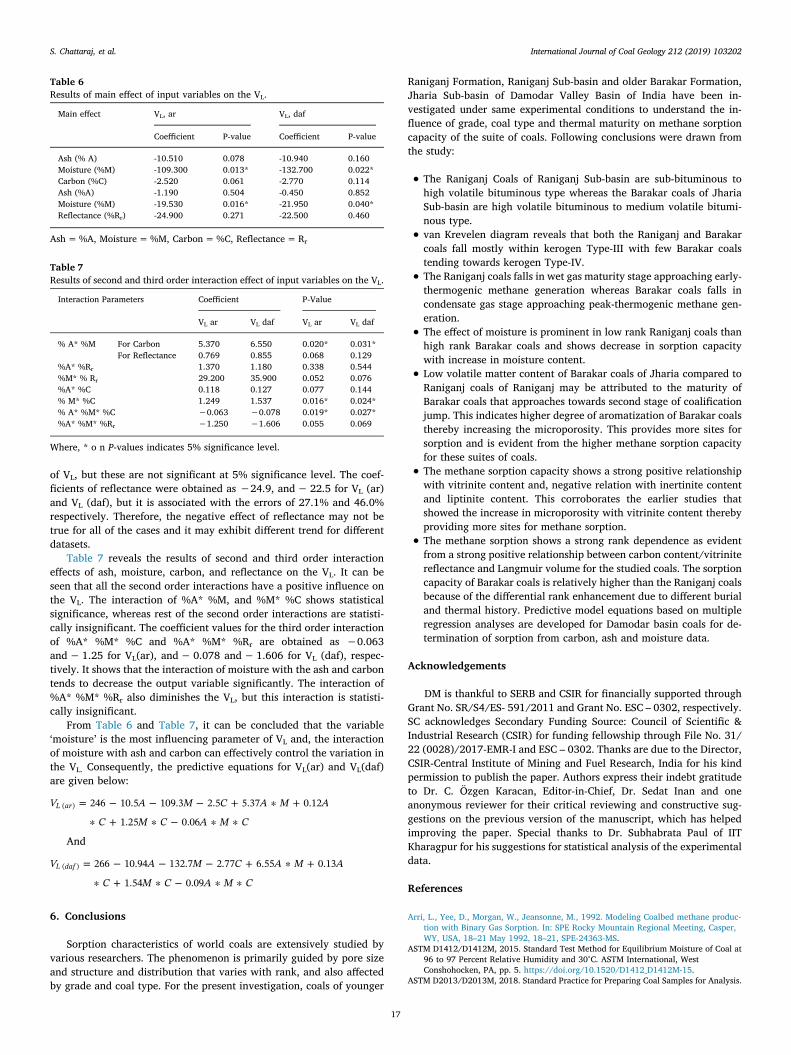
of VL, but these are not significant at 5% significance level. The coef-ficients of reflectance were obtained as −24.9, and − 22.5 for VL (ar)and VL (daf), but it is associated with the errors of 27.1% and 46.0%respectively. Therefore, the negative effect of reflectance may not betrue for all of the cases and it may exhibit different trend for differentdatasets.
Table 7 reveals the results of second and third order interactioneffects of ash, moisture, carbon, and reflectance on the VL. It can beseen that all the second order interactions have a positive influence onthe VL. The interaction of %A* %M, and %M* %C shows statisticalsignificance, whereas rest of the second order interactions are statisti-cally insignificant. The coefficient values for the third order interactionof %A* %M* %C and %A* %M* %Rr are obtained as −0.063and − 1.25 for VL(ar), and − 0.078 and − 1.606 for VL (daf), respec-tively. It shows that the interaction of moisture with the ash and carbontends to decrease the output variable significantly. The interaction of%A* %M* %Rr also diminishes the VL, but this interaction is statisti-cally insignificant.
From Table 6 and Table 7, it can be concluded that the variable‘moisture’ is the most influencing parameter of VL and, the interactionof moisture with ash and carbon can effectively control the variation inthe VL. Consequently, the predictive equations for VL(ar) and VL(daf)are given below:
= + +
+
V A M C A M A
C M C A M C
246 10.5 109.3 2.5 5.37 0.12
1.25 0.06L ar( )
And
= + +
+
V A M C A M A
C M C A M C
266 10.94 132.7 2.77 6.55 0.13
1.54 0.09L daf( )
6. Conclusions
Sorption characteristics of world coals are extensively studied byvarious researchers. The phenomenon is primarily guided by pore sizeand structure and distribution that varies with rank, and also affectedby grade and coal type. For the present investigation, coals of younger
Raniganj Formation, Raniganj Sub-basin and older Barakar Formation,Jharia Sub-basin of Damodar Valley Basin of India have been in-vestigated under same experimental conditions to understand the in-fluence of grade, coal type and thermal maturity on methane sorptioncapacity of the suite of coals. Following conclusions were drawn fromthe study:
• The Raniganj Coals of Raniganj Sub-basin are sub-bituminous tohigh volatile bituminous type whereas the Barakar coals of JhariaSub-basin are high volatile bituminous to medium volatile bitumi-nous type.
• van Krevelen diagram reveals that both the Raniganj and Barakarcoals fall mostly within kerogen Type-III with few Barakar coalstending towards kerogen Type-IV.
• The Raniganj coals falls in wet gas maturity stage approaching early-thermogenic methane generation whereas Barakar coals falls incondensate gas stage approaching peak-thermogenic methane gen-eration.
• The effect of moisture is prominent in low rank Raniganj coals thanhigh rank Barakar coals and shows decrease in sorption capacitywith increase in moisture content.
• Low volatile matter content of Barakar coals of Jharia compared toRaniganj coals of Raniganj may be attributed to the maturity ofBarakar coals that approaches towards second stage of coalificationjump. This indicates higher degree of aromatization of Barakar coalsthereby increasing the microporosity. This provides more sites forsorption and is evident from the higher methane sorption capacityfor these suites of coals.
• The methane sorption capacity shows a strong positive relationshipwith vitrinite content and, negative relation with inertinite contentand liptinite content. This corroborates the earlier studies thatshowed the increase in microporosity with vitrinite content therebyproviding more sites for methane sorption.
• The methane sorption shows a strong rank dependence as evidentfrom a strong positive relationship between carbon content/vitrinitereflectance and Langmuir volume for the studied coals. The sorptioncapacity of Barakar coals is relatively higher than the Raniganj coalsbecause of the differential rank enhancement due to different burialand thermal history. Predictive model equations based on multipleregression analyses are developed for Damodar basin coals for de-termination of sorption from carbon, ash and moisture data.
Acknowledgements
DM is thankful to SERB and CSIR for financially supported throughGrant No. SR/S4/ES- 591/2011 and Grant No. ESC – 0302, respectively.SC acknowledges Secondary Funding Source: Council of Scientific &Industrial Research (CSIR) for funding fellowship through File No. 31/22 (0028)/2017-EMR-I and ESC – 0302. Thanks are due to the Director,CSIR-Central Institute of Mining and Fuel Research, India for his kindpermission to publish the paper. Authors express their indebt gratitudeto Dr. C. Özgen Karacan, Editor-in-Chief, Dr. Sedat Inan and oneanonymous reviewer for their critical reviewing and constructive sug-gestions on the previous version of the manuscript, which has helpedimproving the paper. Special thanks to Dr. Subhabrata Paul of IITKharagpur for his suggestions for statistical analysis of the experimentaldata.
References
Arri, L., Yee, D., Morgan, W., Jeansonne, M., 1992. Modeling Coalbed methane produc-tion with Binary Gas Sorption. In: SPE Rocky Mountain Regional Meeting, Casper,WY, USA, 18–21 May 1992, 18–21, SPE-24363-MS.
ASTM D1412/D1412M, 2015. Standard Test Method for Equilibrium Moisture of Coal at96 to 97 Percent Relative Humidity and 30°C. ASTM International, WestConshohocken, PA, pp. 5. https://doi.org/10.1520/D1412_D1412M-15.
ASTM D2013/D2013M, 2018. Standard Practice for Preparing Coal Samples for Analysis.
Table 6Results of main effect of input variables on the VL.
Main effect VL, ar VL, daf
Coefficient P-value Coefficient P-value
Ash (% A) -10.510 0.078 -10.940 0.160Moisture (%M) -109.300 0.013* -132.700 0.022*Carbon (%C) -2.520 0.061 -2.770 0.114Ash (%A) -1.190 0.504 -0.450 0.852Moisture (%M) -19.530 0.016* -21.950 0.040*Reflectance (%Rr) -24.900 0.271 -22.500 0.460
Ash = %A, Moisture = %M, Carbon = %C, Reflectance = Rr
Table 7Results of second and third order interaction effect of input variables on the VL.
Interaction Parameters Coefficient P-Value
VL ar VL daf VL ar VL daf
% A* %M For Carbon 5.370 6.550 0.020* 0.031*For Reflectance 0.769 0.855 0.068 0.129
%A* %Rr 1.370 1.180 0.338 0.544%M* % Rr 29.200 35.900 0.052 0.076%A* %C 0.118 0.127 0.077 0.144% M* %C 1.249 1.537 0.016* 0.024*% A* %M* %C −0.063 −0.078 0.019* 0.027*%A* %M* %Rr −1.250 −1.606 0.055 0.069
Where, * o n P-values indicates 5% significance level.
S. Chattaraj, et al. International Journal of Coal Geology 212 (2019) 103202
17
19428-2959. ASTM International, West Conshohocken, PA, pp. 12. https://doi.org/10.1520/D2013_D2013M-18. United States.
ASTM D3172, 2013. Standard Practice for Proximate Analysis of Coal and Coke. ASTMInternational, West Conshohocken, PA, pp. 2. https://doi.org/10.1520/D3172.
ASTM D3176, 1979. Standard Method for Ultimate Analysis of Coal and Coke [C, H, S, N,O, Ash], 409–412. ASTM International, West Conshohocken, PA, pp. 4. https://doi.org/10.1520/D3176-15.
ASTM D388, 2018. Standard Classification of Coals by Rank. 5 ASTM International, WestConshohocken, PA. https://doi.org/10.1520/D0388-18.
Bandopadhyay, A.K., Mohanty, D., 2014. Variation in hydrogen content of vitriniteconcentrates with rank advance. Fuel 134, 220–225. https://doi.org/10.1016/j.fuel.2014.05.057.
Beamish, B., Laxminarayana, C., Crosdale, P.J., 1998. Contrasts in methane sorptionproperties between New Zealand and Australian coals. In: N. Aziz (Ed.), Coal 1998:Coal Operators' Conference. University of Wollongong & the Australasian Institute ofMining and Metallurgy, pp. 561–565.
Busch, A., Gensterblum, Y., 2011. CBM and CO2-ECBM related sorption processes in coal:a review. Int. J. Coal Geol. 87, 49–71.
Bustin, R.M., Clarkson, C.R., 1998. Geological controls on coalbed methane reservoircapacity and gas content. Int. J. Coal Geol. 38, 3–26.
Bustin, R.M., Clarkson, C.R., Levy, J., 1995. Coalbed methane adsorption of coals of theBulli and Wongawill seams, southern Sydney Basin: Effects of maceral composition.In: 29th Newcastle Symposium on Advances in the Study of the Sydney Basin,Newcastle NSW, Australia, Department of Geology. The University of Newcastle,NSW, pp. 22–28.
Carroll, R.E., Pashin, J.C., 2003. Relationship of sorption capacity to coal quality: CO2sequestration potential of coalbed methane reservoirs in the Black Warrior Basin. In:Proceedings of the International Coal Bed Methane Symposium, pp. 1–11.
Casshyap, S.M., Tewari, R.C., 1987. Depositional model and tectonic evolution ofGondwana Basins. Palaeobotanist 36, 59–66.
Chandra, D., 1962. Reflectance and microstructure of weathered coals. Fuel 41, 155–163.Chandra, K., 1997. Alternative hydrocarbon resources in the next millennium,
Geohorizons, v.2, no.2. Levine, J.R., 1993. In: Law, B.E., Rice, D.D. (Eds.),Coalification: The Evolution of Coal as Source Rock and Reservoir Rock for Oil andGas. Studies in Geology Series, Tulsa, pp. 39–77.
Chandra, D., Chakrabarti, N.C., 1989. Coalification trends in Indian coals. In: Coal:Classification, Coalification, Mineralogy, Trace-element Chemistry, and Oil and GasPotential. Int. J. Coal Geol. 13. pp. 413–435.
Chattaraj, S., Mohanty, D., Kumar, T., Halder, G., 2016. Thermodynamics, kinetics andmodeling of sorption behavior of coalbed methane – a review. J. Unconv. Oil GasResour. 16, 14–33. https://doi.org/10.1016/j.juogr.2016.09.001.
Choudhury, N., Mohanty, D., Boral, P., Kumar, S., Hazra, S.K., 2008. Microscopic eva-luation of coal and coke for metallurgical usage: a case study. Curr. Sci. 94-1, 74–81.
Clarkson, C.R., Bustin, R.M., 1999. The effect of pore structure and gas pressure upon thetransport properties of coal: a laboratory and modeling study. 2. Adsorption ratemodeling. Fuel 78, 1345–1362.
Clarkson, C.R., Bustin, R.M., 2011. Coalbed methane: current field-based evaluationmethods. SPE Reserv. Eval. Eng. 14, 60–75.
Cornford, C., 1998. Source rocks and hydrocarbons of the North Sea. In: Glennie, K.W.(Ed.), Petroleum Geology of the North Sea: Basic Concepts and Recent Advances, 4thed. Oxford, Blackwell, pp. 376–462.
Crosdale, P.J., Beamish, B.B., Valix, M., 1998. Coalbed methane sorption related to coalcomposition. Int. J. Coal Geol. 35 (1–4), 147–158.
Crosdale, P.J., Moore, T.A., Mares, T.E., 2008. Influence of moisture content and tem-perature on methane adsorption isotherm analysis for coals from a low-rank, bio-genically-sourced gas reservoir. Int. J. Coal Geol. 76, 166–174. https://doi.org/10.1016/j.coal.2008.04.004.
DGH, 2019. Directorate General of Hydrocarbons. website. www.dghindia.org/index.php/story_details?story=4&heading=Award%20of%20Blocks%20Under%20CBM%20-%20IV%20Bidding%20Round.
Dutta, P., 2002. Gondwana Lithostratigraphy of Peninsular India. Gondwana Res. 5,540–553.
Ettinger, I., Eremin, I., Zimakov, B., Yanovskaya, M., 1966. Natural factors influencingcoal sorption properties. I. Petrography and sorption properties of coals. Fuel 45,267–275.
Faiz, M., Aziz, N.I., Hutton, A.C., Jones, B.G., 1992. Porosity and Gas sorption capacity ofsome eastern Australian coals in relation to coal rank and composition. In: CoalbedMethane Symposium, Townsville, Australia. Vol. 11 19–21 November.
Faiz, M., Saghafi, A., Sherwood, N., Wang, I., 2007. The influence of petrological prop-erties and burial history on coal seam methane reservoir characterization, SydneyBasin, Australia. Int. J. Coal Geol. 70 (1–3), 193–208.
Feng, Y., Yang, W., Chu, W., 2014. Contribution of ash content related to methane ad-sorption behaviors of bituminous coals. Int. J. Chem. Eng. 2014 (11), 956543.https://doi.org/10.1155/2014/956543.
Fox, C.S., 1930. The Jharia coalfield. In: Memoir Geological Survey of India. vol. 56. GSI,Kolkata, India, pp. 255.
Fu, X.H., Qin, Y., Wei, C.T., 2007. Coalbed Methane Geology. China University of Miningand Technology Press, Xuzhou, pp. 1–273 (in Chinese).
Gan, H., Nandi, S.P., Walker Jr., P.L., 1972. Nature of the porosity in American coals.Fuel, 51, 272-277. 2002 In: Gluskoter, H., Mastalerz, M., Stanton, R. (Eds.), ThePotential for Carbon Dioxide Sequestration in Coal Beds: New Evidence fromMethane and Carbon Dioxide Adsorption Analyses of Coals from Lignite toAnthracite. North-Central Section (36th) and Southeastern Section (51st), GSA JointAnnual Meeting Lexington, Kentucky, April 3–5.
Gunther, J., 1965. Etude de la Liaison Gaz-Charbon (Investigation of the Gas-Coal Bond).vol. 47. Revue del'Industric Mineralc, pp. 693–708.
Guo, D., Guo, X., 2018. The influence factors for gas adsorption with different ranks ofcoals. Adsorpt. Sci. Technol. 36 (3–4), 904–918.
Gurdal, G., Yalcin, M.N., 2000. Gas adsorption capacity of carboniferous coals in theZonguldak Basin (NW Turkey) and its controlling factors. Fuel 79, 1913–1924.
Hall, F.E., Chunhe, Z., Gasem, K.A.M., Robinson, R.L., Yee, D., 1994. Adsorption of pureCH4, N2, and CO2 and their binary mixtures on wet Fruitland coal. In: SPE-29194,Eastern Regional Conference and Exhibition, Charleston, WV, USA. 8–10 November,pp. 329–344.
Hogg, R.V., McKean, J.W., Craig, A.T., 2005. Introduction to Mathematical Statistics.Pearson, Boston, pp. 762.
Hunt, J.M., 1996. In: Freeman, W.H. (Ed.), Petroleum Geochemistry and Geology, 2nded. .
ISO 7404-2, 1985. Methods of Petrographic Analysis of Coal. Part 2: Methods forPreparing Coal Samples. vol. 12https://doi.org/10.3403/30145807.
ISO 7404-3, ISO, 1994. Methods for the petrographic analysis of bituminous coal andanthracite. In: Part 3: Method of Determining Maceral Group Composition, pp. 18.https://doi.org/10.3403/30145810.
ISO 7404-5, 1994. Methods for the Petrographic Analysis of Bituminous Coal andAnthracite, Part 5: Method of Determining Microscopically the Reflectance ofVitrinite. pp. 14.
Jiménez, A., Iglesias, M.J., Laggoun-Defarge, F., Sua'rez-Ruiz, I., 1999. Effect of the in-crease in temperature on the evolution of the physical and chemical structure ofvitrinite. J. Anal. Appl. Pyrolysis 50, 117–148.
Joubert, J.I., Grein, C.T., Bienstock, D., 1974. Effect of moisture on the methane capacityof American coals. Fuel 53, 186–191.
Juntgen, H., Karweil, J., 1966. Formation and Storage of Gas in Bituminous Coals: Part I &II: Erdol Und Kohle, Erdgas, Petrochemie. (v. 19, I/p. 251–258 & II/ p. 339–344).
Kiani, A., Sakurovs, R., Grigore, M., Sokolova, A., 2017. Gas sorption capacity, gassorption rates and nanoporosity in coals. Int. J. Coal Geol. 200 (1), 77–86 December2018.
Kim, A.G., 1977. Estimating the Methane Content of Bituminous Coalbeds fromAdsorption Data. 8245. USBM Reports of Investigation, RI, pp. 22.
Kraiser, K.M., Sinha, D.K., Bagchi, S., 1964. Thermal gradients in Indian coalfields. Cent.Min. Res. Stn. Dhanbad Res. Ap. 15.
Lamberson, M.N., Bustin, R.M., 1993. Coalbed methane characteristics of GatesFormation coals, northeastern British Columbia: effect of maceral composition. AAPGBull. 77, 2062–2076.
Larsen, J.W., 2004. The effects of dissolved CO2 on coal structure and properties. Int. J.Coal Geol. 57, 63–70.
Larsen, J.W., Lee, D., Shawver, S.E., 1986. Coal macromolecular structure and reactivity.Fuel Process. Technol. 12, 51–62.
Laxminarayana, C., Crosdale, P.J., 1999. Role of coal type and rank on methane sorptioncharacteristics of Bowen Basin, Australia coals. Int. J. Coal Geol. 40, 309–325.
Laxminarayana, C., Crosdale, P.J., 2002. Controls on methane sorption capacity of Indiancoals. AAPG Bull. 86, 201–212.
Levine, J.R., 1993. Coalification: The evolution of coal as source rock and reservoir. In:Law, B.E., Rice, D.D. (Eds.), Hydrocarbons from Coal. 38. American Association ofPetroleum Geologists, AAPG Studies in Geology, pp. 39–77.
Levy, J., Day, H., Killingley, J.S., 1997. Methane capacities of Bowen basin coals relatedto coal properties. Fuel 76 (9), 813–819.
Li, Q.Z., Lin, B.Q., Wang, K., Zhao, M.Z., Ruan, M.L., 2015. Surface properties of pul-verized coal and its effects on coalmine methane adsorption behaviors under ambientconditions. Powder Technol. 270, 278–286.
Liu, P., 2010. A Research on the Methane Adsorption/Desorption in the Mid and HighRank Bituminous. The master degree thesis of Xi' An university of science andtechnology, China (in Chinese with English abstract).
Mahmood, Ali A., Elektorowicz, M., 2017. Multiple Regression Analysis of UnconfinedCompression Strength of Mine Tailings Matrices. In: MATEC Web of Conferences.103, 07010 (2017). https://doi.org/10.1051/matecconf/201710307010.
Mastalerz, M., Gluskoter, H., Rupp, J., 2004. Carbon dioxide and methane sorption inhigh volatile bituminous coals from Indiana, USA. Int. J. Coal Geol. 40, 309–325.
Mavor, M.J., Owen, L.B., Pratt, T.J., 1990. Measurement and evaluation of coal sorptionisotherm data. In: SPE 20728, SPE 65th Annual Technical Conference and Exhibition,New Orleans, Louisiana, September 23–26.
Michalski, S.R., Custer Jr., E.S., Munshi, P.L., 1997. Investigation of the Jharia coalfieldmine fires - India. Proc. Am. Soc. Min. Reclam. 211–223. https://doi.org/10.21000/JASMR98010211.
Mohanty, D., 2019. Coal Seam Gas - Evaluation, Extraction and Environmental Issues(chapter 7). In: Kundu, S.N., Nawaz, M. (Eds.), Earth, Energy, and Environment.Apple Academic Press (in press, ISBN: 9781771887632).
Mohanty, D., Chattaraj, S., Singh, A.K., 2018. Influence of coal composition and maturityon methane storage capacity of coals of Raniganj coalfield, India. Int. J. Coal Geol.196, 1–18.
Moore, T., Crosdale, P., 2006. The effect of moisture and temperature on adsorptionisotherms of a low-rank coal: Implications for reservoir modeling. In: 2006International Coalbed Methane Symposium, Tuscaloosa, Alabama.
Mu, F., Zhong, W., Zhao, X., Che, C., Chen, Y., Zhu, J., Wang, B., 2015. Strategies for thedevelopment of CBM gas industry in China. Natural Gas Ind. B 2 (4), 383–389.https://doi.org/10.1016/j.ngib.2015.09.013.
Murray, D.K., 1991. Coal bed methane; natural gas resources from coal seams. In: Peters,C. (Ed.), Geology in Coal Resource Utilization, Tech Books, United States, pp. 97–103.
Olajossy, A., 2014. The influences of the rank of coal on methane sorption capacity incoals. Arch. Min. Sci. 59 (2), 509–516.
Pal, P.K., Paul, S., Chatterjee, R., 2015. Estimation of In-situ stress and coal bed methanepotential of coal seams from analysis of well logs, ground mapping and laboratorydata in central part of Jharia Coalfield—An overview. In: Mukherjee, S. (Ed.),
S. Chattaraj, et al. International Journal of Coal Geology 212 (2019) 103202
18

Petroleum Geosciences: Indian Contexts. Springer Geology, pp. 143–173. https://doi.org/10.1007/978-3-319-03119-4_6.
Patel, R.C., Sinha, H.N., Kumar, B.A., 2014. Basin provenance and post-depositionalthermal history along the continental P/T boundary of the Raniganj basin, easternIndia: Constraints from apatite fission track dating. J. Geol. Soc. India 83 (4),403–413.
Permai, S.D., Tanty, H., 2018. Linear regression modeling using Bayesian approach forenergy performance of residential building. Proc. Comp. Sci. 135, 671–677. https://doi.org/10.1016/j.procs.2018.08.219.
Peters, K.E., Cassa, M.R., 1994. Applied Source-Rock Geochemistry. In: Magoon, L.B.,Dow, W.G. (Eds.), The Petroleum System. From Source to Trap. American Associationof Petroleum Geologists, Tulsa, pp. 93–120.
Raja Rao, C.S., 1983. Coalfields of India Vol. III Coal Resources of Madhya Pradesh andJammu and Kashmir. In: Bulletin of Geological Survey of India Series A. 45.
Rice, D.D., 1993. Composition and origins of coalbed gas. In: Law, B.E., Rice, D.D. (Eds.),Hydrocarbons from Coal.: AAPG Studies in Geology. 38. American Association ofPetroleum Geologists, Tulsa, Oklahoma, pp. 159–184.
Schneider, A., Hommel, G., Blettner, M., 2010. Linear Regression Analysis Part 14 of aSeries on Evaluation of Scientific Publications. Dtsch. Arztebl. Int. 107 (44), 776–782.https://doi.org/10.3238/arztebl.2010.0776.
Seewald, H., Klein, J., 1986. Methansorption an steinkohle und kennzeichnung der por-enstruktur. Glückauf-Forschungshefte 47 (3), 149–156.
Shan, C., Zhang, T., Liang, X., Zhang, Z., Zhu, H., Yang, W., Zhang, K., 2018. Influence ofchemical properties on CH4 adsorption capacity of anthracite derived from southernSichuan Basin, China. Mar. Pet. Geol. 89 (Part – 2), 387–401. https://doi.org/10.1016/j.marpetgeo.2017.10.008.
Srivastava, R.K., Rao, N.V.C., Sinha, A.K., 2009. Cretaceous potassic intrusives with af-finities to aillikites from Jharia area: Magmatic expression of metasomatically veinedand thinned lithospheric mantle beneath Singhbhum Craton, Eastern India. Lithos112, 407–418.
Stach, E., Mackowsky, M.T., Teichmuller, M., Taylor, G., Chandra, D., Teichmuller, R.,1982. Stach's Textbook of Coal Petrology. GebruderBorntraeger, Berlin, pp. 565.
Tissot, B.P., Welte, D.H., 1984. Petroleum Formation and Occurrence, 2nd ed. Springer-Verlag, Berlin, pp. 699.
Tissot, B., Durand, B., Espitalie, J., Combaz, A., 1974. Influence of the nature and diag-enesis of organic matter in the formation of petroleum. Am. Assoc. Pet. Geol. Bull. 58,499–506.
Togunwa, O.S., Abdullah, W.H., Hakimi, M.H., Barbeito, P.J., 2015. Organic geochemicaland petrographic characteristics of Neogene organic-rich sediments from the onshoreWest Baram Delta Province, Sarawak Basin: Implications for source rocks and hy-drocarbon generation potential. Mar. Pet. Geol. 63, 115–126.
Towler, B., Firouzi, M., Underschultz, J., Rifkin, W., Garnett, A., Schultz, H., Esterle, J.,Tyson, S., Witt, K., 2016. An overview of the coal seam gas developments inQueensland. J. Natural Gas Sci. Eng. 31, 249–271. https://doi.org/10.1016/j.jngse.2016.02.040.
Van Krevelen, D.W., 1993. Coal; Typology-Chemistry-Physics-Constitution, 3rd ed.Elsevier, Amsterdam, pp. 979 Coal.
Veevers, J.J., Tiwari, R.C., 1995. Gondwana master basin of Peninsular India betweenTethys and interior of the Gondwanaland province of Pangea. Mem. Geol. Soc. Am.Bull. 187, 1–72.
Walters, C.C., 2006. Chapter-2: The Origin of Petroleum. In: Hsu, C.S., Robinson, P.R.(Eds.), Practical Advances in Petroleum Processing. Springer, New York, NY, pp.79–101. https://doi.org/10.1007/978-0-387-25789-1_2.
Wang, K.X., Fu, X.H., Qin, Y., Santigie, K.S., 2011. Adsorption characteristics of Lignite inChina. J. Earth Sci. 22 (3), 371–376.
Yalçin, E., Durucan, S., 1991. Methane capacities of Zonguldak coals and the factors af-fecting methane adsorption. Min. Sci. Technol. 13, 215–222.
Yao, Y.B., Liu, D.M., Tang, D.Z., Tang, S.H., Huang, W.H., 2008. Fractal characterizationof adsorption-pores of coals from North China: an investigation on CH4 adsorptioncapacity of coals. Int. J. Coal Geol. 73, 27–42.
Yee, D., Seidle, J.P., Hanson, W.B., 1993. Gas sorption on coal and measurement of gascontent. In: Law, B.E., Rice, D.D. (Eds.), Hydrocarbons from Coal. AAPG Studies inGeology, pp. 38.
S. Chattaraj, et al. International Journal of Coal Geology 212 (2019) 103202
19