international journal of coal geology - laramie, wyoming€¦ · international journal of coal...
TRANSCRIPT

Contents lists available at ScienceDirect
International Journal of Coal Geology
journal homepage: www.elsevier.com/locate/coal
Stochastic modeling of coal fracture network by direct use of micro-computed tomography images
Sadegh Karimpoulia, Pejman Tahmasebib,⁎, Hamed Lamei Ramandic, Peyman Mostaghimid,Mohammad Saadatfare
a Department of Mining Engineering, School of Engineering, University of Zanjan, Zanjan, Iranb Department of Petroleum Engineering, University of Wyoming, Laramie, WY 82071, USAc School of Mining Engineering, The University of New South Wales, Sydney, NSW 2052, Australiad School of Petroleum Engineering, The University of New South Wales, NSW 2052, Australiae Department of Applied Mathematics, Research School of Physics and Engineering, The Australian National University, Canberra, ACT 2601, Australia
A R T I C L E I N F O
Keywords:Coal bed methaneUnconditional reconstructionStochastic modelingDFNX-ray micro-CT
A B S T R A C T
Characterization of coalbed methane reservoirs is a challenging task because of complex petrophysical propertiesof coal. Coal cleat system has a key role in permeability of gas through coalbed. Previous computational methodsfor characterization and modeling in coal formations do not account for the actual complexities in cleat systemsas they commonly rely on simple statistical properties for describing the fractures. In this study, unlike theprevious methods that try to extract some of the spatial statistical properties, the 2D/3D micro computed to-mography images are used directly without any simplifications and assumptions. The generated models arecompared to discrete fracture networks as one of the widely-used method for the modeling of such complexsystems of coal cleats. Results show that the utilized algorithm produces visually satisfactory realizations of bothcoal matrix and cleat system. To quantify such similarities, autocorrelation functions, connectivity (with twodistinct indices), average fracture length and orientation are computed. Moreover, permeabilities and porositiesof the reconstructed samples are calculated and compared with the original sample. It is demonstrated that theproposed reconstruction method reproduces samples with similar statistical and petrophysical properties, butwith different patterns of both coal porous region and fracture system. Finally, the proposed method and theDFN realizations are also compared extensively. The results of this study can be used for characterization of coalsamples with any degree of complexity and heterogeneity by producing several realistic stochastic models.Consequently, petrophysical properties and their corresponding uncertainties can be evaluated more accurately.
1. Introduction
Coal bed methane (CBM) is a form of natural gas trapped in coal-beds that accounts for enormous unconventional gas resources. In thepast, methane was recognized as a major mine hazard and vented fromunderground workings before mining operations (Karacan et al., 2011);which would contribute to the greenhouse effect. In the past few dec-ades, CBM has become a substantial source of energy in both industryand households and has been extracted in many countries such as theUS, Australia, China and Canada (Hamawand et al., 2013; Moore, 2012;Mostaghimi et al., 2017).
Coal matrix is mainly composed of macerals, more than 50% (byweight), (Suárez-Ruiz and Crelling, 2008), which are organic discreteplant constituents (Crelling, 1989; Suárez-Ruiz and Crelling, 2008).Moore (2012) and Mostaghimi et al. (2016) summarized some of the
CBM characteristics such as generation and trapping of gas, its presencestate and production profile, and pore space morphological properties.Coal contains two sets of natural fractures, known as cleats: i) Through-going cleats, which are formed first and called face cleats, ii) Cleats thatare created later and terminate at intersections, known as butt cleats(Close, 1993; Close and Mavor, 1991; Laubach et al., 1998; Laubachand Tremain, 1991; Ting, 1977). These cleats are usually perpendicularand at right angles to bedding (Close, 1993; Laubach et al., 1998).Furthermore, additional fractures could be induced from differentstresses acting on coalbeds. Despite accounting for a small fraction ofcoal porosity, fractures play a key role for fluid flow through providingpermeable channels (Clarkson and Marc Bustin, 1996; Moore, 2012;Purl et al., 1991; Ramandi et al., 2016a, 2015; Lorig et al., 2015).Permeability of coal, as the most important parameter in gas produc-tion, mainly depends on dimension, spacing, connectivity, and degree
http://dx.doi.org/10.1016/j.coal.2017.06.002Received 23 April 2017; Received in revised form 5 June 2017; Accepted 5 June 2017
⁎ Corresponding author.E-mail address: [email protected] (P. Tahmasebi).
International Journal of Coal Geology 179 (2017) 153–163
Available online 06 June 20170166-5162/ Published by Elsevier B.V.
MARK

of mineralization of cleats, and it usually varies between 0.1 and100 mD (Clarkson and Bustin, 1997; Jing et al., 2016; Laubach et al.,1998).
Recent advances in high resolution X-ray micro-computed tomo-graphy (micro-CT) imaging techniques have led to significant im-provements in pore-scale modeling providing a deeper understandingof displacement phenomena and their underlying mechanisms (Bluntet al., 2013; Cnudde and Boone, 2013). Micro-CT allows for acquisitionof high quality 3D images, which are suitable to extract and quantifyfine features such as coal cleats (Golab et al., 2013, 2010; Heriawan andKoike, 2015, 2008; Karacan and Okandan, 2000; Karacan et al., 2011;Yao et al., 2009). There are several methods for numerical modeling ofthe fracture networks, including (i) Equivalent continuum model (ECM)(Wu, 2000), (ii) Dual continuum model (DCM) (Lichtner, 2000; Pruess,1985) and (iii) Discrete fracture network (DFN) (Jing et al., 2017,2016). The ECM, as one of the most straightforward methods, uses aneffective porous medium. This method divides the porous medium intoa number of regions and uses equivalent porous media with averagedrock properties (Hao et al., 2013; Jing et al., 2016). Then, flow andtransport calculations are simplified by a single-porosity continuumapproach through a set of effective parameters (Jing et al., 2016).However, this method cannot provide accurate predictions when themedium represents a large permeability disparity between the fractureand matrix (Hao et al., 2013). The DCM technique, on the other hand,simplifies the fracture geometry and considers each fracture and matrixsystem as two separate continuums. The key characteristic of DCM ordual-porosity model is that the matrix controls the storage capacitywhile the fractures are considered as flow paths (Sakhaee-Pour andWheeler, 2016). This approach requires detailed information aboutmatrix and fracture geometry and, therefore, is limited to fractureconfiguration. Recently, several attempts have been made to improvethe accuracy of DCM using more realistic fracture geometries (Lathamet al., 2013; Moinfar et al., 2013; Sakhaee-Pour and Wheeler, 2016).The ECM and DCM are being extensively used in industry, owing totheir simplicity and computational efficacy (Jing et al., 2016; Wu,2000). These methods, however, do not provide accurate results atdifferent scales and they usually are used when an average behavior isrequired.
Contrary to continuum methods, stochastic DFN is based on mod-eling of individual fractures and it considers fluid flow and transportprocess through a network of connected fractures (Jing, 2003). Thismethod accounts for geological parameters and its results can be up-scaled to DCM. Furthermore, large-scale connectivities are consideredand thus, the uncertainty can be quantified consequently (Alghalandis,2017; Cacas et al., 1990; Jing et al., 2017). The DFN model has beendeveloped based on two key factors, namely fracture network geometryand transmissivity of individual fractures (Jing, 2003). Fracture prop-erties such as orientation, length, spacing, density and aperture aregiven by statistical distributions obtained from field mapping or otherdata sources such as well logging and micro-CT imaging. The DFNmethod, however, requires detailed knowledge of fracture and matrixgeometry (Cacas et al., 1990; Jing et al., 2016; Wu, 2000).
Among the aforementioned methods, DFN modeling is known to besuitable for evaluation and reconstruction of coal samples (Gao et al.,2014; Jing et al., 2017, 2016; Lorig et al., 2015). The fracture networkis usually inferred using micro-CT imaging for fine-scale modeling.Then, DFN is used to generate stochastic shale samples and evaluate gasflow accordingly. More recently, a DFN approach based on ‘T-junction’reconstruction was presented by Jing et al. (2016) to evaluate CBMpermeability. They used a segmented micro-CT image of a fracturedcoal sample. After separating face and butt cleats in the segmentedimage, the necessary distributions of fracture parameters were digitallycomputed. More accurate fracture aperture sizes were also measuredfrom a combination of micro-CT and high-resolution SEM image(Ketcham et al., 2010; Ramandi et al., 2016b). In a similar fashion,some other methods, called rough-walled DFN, were later developed for
roughness of cleat surfaces by which permeability can be evaluatedmore accurately (Jing et al., 2017). Unlike the continuum methods, theDFN is not affected by fracture configuration, however, this methodsuffers from over simplification. Furthermore, the DFN method requiresan extensive knowledge of the fractures properties such as orientation,length, and size distribution. Also, assuming a plate or disk shape forfractures, which are usually associated with a tremendous roughnessand irregularity, represent an unrealistic simplification of such complexstructures. In particular, when these plates are assumed straight be-tween two bedding planes.
To overcome the discussed limitations of DFN, we use micro-CTimages of coal samples directly, which are further investigated througha recently developed method called cross-correlation based simulation(CCSIM) (Tahmasebi, 2017; Tahmasebi et al., 2017, 2016a). In thisway, instead of extracting the statistical properties of coal fractures, themicro-CT images will be utilized directly. Thus, the existing complexityand heterogeneity in the coal samples are exactly reproduced within astochastic framework. This method has been successfully used in sev-eral fields of geosciences such as reconstruction of porous media(Tahmasebi and Sahimi, 2015a) and nonstationary disordered systems(Tahmasebi and Sahimi, 2015b), shale characterization (Tahmasebiet al., 2016b, 2015a, 2015b), CO2 storage (Tahmasebi et al., 2016c) andreservoir rock evaluation (Karimpouli and Tahmasebi, 2017, 2015).The available 3D images of the actual coal samples are deterministicand, at the same time, are very limited in the sense that they represent asmall volume of the actual reservoir, where the samples were extractedfrom. This is in part due to the limitations of XCT imaging and thetrade-off between the sample size and spatial resolution in which thefeatures of the sample can be resolved. So, the sampling is very limitedand it is not practical to take many samples from different locations in areservoir and generate their 3D images (they are very costly and timedemanding). Thus, the best strategy is to use the stochastic methods toinvestigate the other scenarios. However, based on the presentedmethod in this paper, we can generate realistic stochastic 3D models ofa sample. Using the stochastic methods, to account for such variabilityand randomness, is inevitable. If the actual coal system is stationary(which is not mostly the case), and if the sample size is larger than thelength for stationarity, then the computations with the 3D image will berepresentative of a larger system. Even if the coal system represents astationary behavior, it is unlikely that the sample is larger than theminimum required size. In general, coal systems are highly in-homogeneous due to non-random distribution of cleats and minerals,therefore the available relatively sample size XCT images are non-re-presentative. Thus, one needs to make many realizations and averagetheir various properties such as permeability. Clearly, one can also usethe 3D image and do direct computations with it. However, the resultswill be limited to that particular sample.
In this paper, we report a new stochastic modeling method based onthe latent complexities in micro-CT images for reproducing variousrealizations of coal samples. Such samples can eventually be used forcalculating coal physical properties such as permeability and porosity.In this method, micro-CT imaging technique is used to capture thefracture network of a fractured coal specimen. Then, the acquiredimage is subject to stochastic framework and then several equi-probablerealizations of the coal sample are generated. Finally, the similaritybetween the original sample and generated realizations are quantifiedusing various statistical and physics-based methods.
2. Methodology
2.1. Data collection
A fractured Late Permian medium volatile bituminous coal samplefrom Bowen Basin of Australia is imaged in dry (as-received, Fig. 1(a));and wet (saturated with a contrasting agent, Fig. 1(b)); conditions usinga helical micro-CT scanner. The micro-CT scanner details are provided
S. Karimpouli et al. International Journal of Coal Geology 179 (2017) 153–163
154

in Sheppard et al. (2014). The image resolution is 16.5 μm and theimaged volume is a cylinder of approximately 25 mm in diameter and35 mm in length. The dry and wet images are then subtracted to pro-duce a difference image that highlights void spaces. This image isshown in Fig. 1(c). The imaging parameters together with samplespecifications and geology of its location are explained in elsewhere(Ramandi et al., 2016c).
2.2. Image enhancement and segmentation
The stochastic algorithm in this study utilizes both grayscale andbinary images (segmented) images. This means that the image does notnecessarily need to be segmented before the modeling. However, whena numerical comparison between original and reconstructed images isrequired, the fracture network of both samples needs to be segmented.For enhancing the image quality, first the anisotropic diffusion (AD)filter is applied on the difference image, which reduces the image noisewithout removing the content of image, particularly fracture edges(Sakellariou et al., 2007; Sheppard et al., 2004). These edges are thensharpened using the unsharp mask (UM) filter without excessively in-tensifying the noise (Sakellariou et al., 2007; Sheppard et al., 2004).Lastly, the image intensity values are further adjusted to a stretchedhistogram resulting in an increase in image and fracture network con-trast. Fig. 1(d) illustrates the sharpened image, which highlights the lowintensity fractures in the middle of sample.
The filtered difference image is segmented using an active contour(AC) method (Chan and Vese, 2001). AC begins from initial contours,predefined by a binary (mask) image, and evolves contour positionsusing an iterative process. To prepare the masked image, a simplebinary image of the filtered difference image is produced using Otsuthresholding (Otsu, 1975). Moreover, two morphological operations,namely, dilation and erosion (Serra, 1986), are applied to obtain a re-latively representative mask image. The erosion filter shrinks imagefeatures and eliminates those with a radius less than the kernel, whiledilation filters expand features in the image and close any gap(Quackenbush, 2004). The erosion and dilation tasks are only used tomask the image to assist in segmentation. The erosion and dilationradiuses are chosen based on visual scanning of grayscale and seg-mented images. After image segmentation, a layer-by-layer visual in-spection is conducted on the grayscale and segmented images to ensurethat the segmentation is reasonably correct. Furthermore, regardless of
the utilized segmentation method, we use the same method for both theactual image and the presented stochastic method in this paper.Therefore, despite the uncertainty in segmentation, it is consistent inboth images. The segmentation result is shown in Fig. 1(e). Then, thefracture network is obtained from the segmented image and used fornumerical computations. It should be noted that the fractures belowcertain apertures (i.e. resolution limit) do not appear in the final frac-ture image. Due to the importance of fractures' connectivities, theapertures are made thicker than those in the actual image. The seg-mented image is, then, skeletonized; Fig. 1(f); and, accordingly, end-and branch-points of fractures are extracted and shown in Fig. 1(g).Subsequently, all fractures are separated from their end- and branch-points; Fig. 1(h). The image shown in Fig. 1(h), indeed, enablesstudying fractures network properties such as number, length, or-ientation and connectivity of fractures (Mazumder et al., 2006;Ramandi et al., 2016b, 2016c).
2.3. Stochastic simulation
As discussed earlier, the goal of this paper is to use the existingcomplexity and heterogeneity in coal samples directly without usingany statistical descriptors. Such descriptors cannot take into account thereal fractures and they only represent them based on some averagevalues. The fractures in coal samples are usually associated with tre-mendous complexities, which make the modeling task very difficult(Mazumder et al., 2006; Moore, 2012; Pan and Connell, 2012). Accu-rate modeling of such heterogeneous media requires using more in-formation through which the fractures are characterized. Clearly,summarizing the spatial distribution and variability in these samplescannot address the above issues. One solution for taking into accountthe real heterogeneity and complexity in modeling of coal samples is toavoid using such lower-order statistics and, instead, use the coal imagesdirectly. A direct use of the coal digital image (DI) will remove anyinsufficient descriptors and allows the complexity and heterogeneity tobe captured and manifested in the generated models. For this aim, theCCSIM algorithm is employed by which several realizations can beproduced if only one image of coal sample is available.
The CCSIM algorithm utilized in this study is based on calculating aconditional probability. It uses the previously simulated points to cal-culate the probability of the next outcomes. This algorithm performsthe simulation on a computational grid G={X1,… ,XN}, which N
(a)
(e)
(b)
(f )
(c)
(g)
(d)
(h)
Fig. 1. Imaging, sharpening, segmentation and discrimination of fractures in a 2D image of coal sample: (a) dry micro-CT image, (b) the same image after saturation, (c) difference imageof a and b, (d) sharpened image, (e) segmented image, (f) skeletonized image, (g) end- and branch-points detection and (h) fractures discrimination by end/branch-points separation.
S. Karimpouli et al. International Journal of Coal Geology 179 (2017) 153–163
155

represents the number of points in the G. Each point in G can take asingle value Xi, either for discrete or continuous coal images. Describingthe fractures in coal samples, based on the above notation, requirescalculating the probability distribution function (pdf) p(X) from whicha random sample can be drawn. The probability of having a specificvalue of pixel is given by
= … …− −p p X p X X p X X X X XX( ) ( ) ( | ) ( | , , , , )N N N1 2 1 1 2 2 1 (1)
The above probability requires to be computed for every singlepoint on G, which is computationally prohibitive. By assuming aMarkov Random Field, calculating of the conditional probability in Eq.(1) can be limited to points only around the visiting cell. In other words,we assume that the value of the vising cell depends on the surroundingpoints only. Thus, two finite ranges rx and ry over which the conditionalprobabilities are calculated. Such ranges can be computed based on thecovariance function on which the correlation between the points in thecoal sample reaches a stationary variation.
The conditional probability in Eq. (1) is equivalent to a Euclideandistance d2= ∑ (D−DI)2 between the input coal image DI and a Mar-kovian neighborhood D(i, j) of size rx× ry centered at (i, j) in G. Usingsuch a distance can reduce the computational time. Accounting for theentire points in the visiting neighborhood DT(u) can still increase thecomputational time, especially when the simulation is a large 3D grid.Thus, two overlap regions OL of size OLx×OLy (and similarly in 3D)are considered between the neighboring blocks of G by which thecomputational time is reduced significantly. Thus, the Euclidean dis-tance can be written as follows:
∑ ∑= + + −=
−
=
−
E i j x i y j D x yDI( , ) { ( , ) ( , )}Dx
OL
y
OL
TDI,0
1
0
12
T
x y
(2)
where DI (x,y) represents the datum at point (x,y) of a DT of size(Tx,Ty), with x∈{0,… ,Tx−1} and y∈{0,… ,Ty−1}.
A one-dimensional raster path is utilized in the CCSIM algorithm bywhich the number of data in DT is known a priori. Thus, the self-simi-larities of both DI and DT (i.e. the first two terms in Eq. (3)) do not needto be calculated for each new visiting point if one expands the Eu-clidean distance in Eq. (2):
∑ ∑= + + +
− + +
=
−
=
−
DIE i j x i y j D x y
x i y j D x yDI
( , ) { ( , ) ( , )
2 ( , ) ( , )}
Dx y
T
T
DI,0
OL 1
0
OL 12 2
T
x y
(3)
Based on the above constants, the final similarity function can besummarized as:
C ∑ ∑= + +=
−
=
−
i j x i y j D x yDI( , ) ( , ) ( , )x y
T0
OL 1
0
OL 1x y
(4)
Depending on the variation of fractures' sizes, a proper template size(i.e. DT) is selected and one of the patterns in DI is sampled and insertedin the simulation grid G. As mentioned, the neighboring overlaps fromthe previously simulated regions are selected for keeping the continuitybetween the blocks. Then, the similarity of OL and DI is calculatedusing the function in Eq. (4). Next, a certain set of patterns, dependingon the complexity of DI, are selected and one of the will be inserted inthe visiting point. The process continues until G is filled.
As mentioned, calculating the cdf for the entire simulation grid isnot feasible. Thus, the cdf of local template (i.e. patches) was used in-stead. As a result, the algorithm only selects and inserts the appropriatesample (derived from the so-called cdf) and it does not consider thetotally cdf either.
The previously described algorithm can rapidly simulate the small2D and 3D coal samples in a matter of seconds. For large 3D samples,the above algorithm in spatial domain can be computationally ex-pensive. Performing the calculations in the Fourier space can sig-nificantly reduce the CPU time. To this end, the DI and OLs can be
transferred into the frequency domain using the Fast Fourier Transfer(FFT) algorithm (Cooley and Tukey, 1965; Duhamel and Vetterli, 1990;Oppenheim, 1999). Thus, the computations are first performed in thefrequency domain and then back-transferred to spatial space using theinverse FFT. The integration of FFT results in a speed-up with an orderof 10–20 (see Appendix A for the implementation details).
Aside from the above speed-up, one can use the CCSIM in a multi-scale fashion in such a way that the initial DI is first upscaled and thenthe computations are performed on a relatively small region.Furthermore, several cutting algorithms for optimally interlocking ofpatterns into the simulation grid can also be employed. These two al-gorithms, namely the multiscale and optimal cutting, are discussedelsewhere (Tahmasebi et al., 2016c, 2014; Tahmasebi and Sahimi,2016a, 2016b). Generally, a speed-up factor of 50–80 can be achievedusing the FFT and multiscale approaches.
2.4. Fracture characterization methods
2.4.1. Connectivity analysisFracture connectivity has been characterized in the literature using
different techniques (Jing et al., 2016; Liang, 2016; Ramandi et al.,2016c; Robinson, 1983). Odgaard and Gundersen (1993) defined theconnectivity index as the maximum number of branches that can bebroken within a network before splitting it in two parts. The con-nectivity index is a fundamental topologic measure and can be derivedfrom Euler number (Odgaard and Gundersen, 1993) as follows:
= −CI E1 (9)
where CI is the connectivity index and E is the Euler characteristic ofthe sample. Because the connectivity depends on the sample size, CIneeds to be normalized to volume of image and expressed by the con-nectivity density (Odgaard and Gundersen, 1993; Ramandi et al.,2016a). However, because the original and simulated images are con-sidered with the same volume in this study, only CI of each image iscomputed.
Liang (2016) introduced NNI as an index for normalized number ofintersections within a fracture network, which can effectively char-acterize the connectivity of a fracture network. NNI is defined as theaverage number of ends and junctions normalized to number of frac-tures:
= +NNI N NN
ends brances
fractures (10)
where Nends and Nbrances are the number of ends and junctions, Nfractures
is the number of fractures. A fracture is defined as an individual seg-ment from an end/branch-point to another end/branch-point. Based onthis definition, NNI=2 if there is no intersection among the fractures.The more intersected a fracture network, the less NNI value (Liang,2016).
2.4.2. Average fracture lengthLiang (2016) also introduced NL as the average fracture length
normalized to fractures number, which is defined as follows:
=NL LN
total
fractures (11)
where Ltotal and Nfractures are the total length and number of fractures. Ifa fracture network becomes more fragmented, NL reduces; hence, NL isable to quantitatively describe the fragmentation of a fractures network(Liang, 2016).
2.4.3. Fractures orientationCalculating the largest eigenvector of structure tensors, which pro-
vides the orientation, is known as a reliable method for measuring theorientation of fractures (Mazumder et al., 2006; Wolf et al., 2008). For acropped image, the method considers 1 and 0 for the fractures (or here
S. Karimpouli et al. International Journal of Coal Geology 179 (2017) 153–163
156

we call it mass) and background respectively. The center of fracture (ormass of image) (ic , jc) can be obtained using moments of image alongeach axis divided by total mass of image (Corke, 2011):
=i mmc
10
00 (12)
=j mmc
01
00 (13)
where m10 and m01 are the moment of image around i and j axes andm00 is the total mass of image. Inertia matrix of image can be furtherdefined as (Corke, 2011):
= ⎡⎣
⎤⎦
Jμ μμ μ
02 11
11 20 (14)
where μ02 and μ20 are central second order moment (moments of in-ertia) and μ11 is axial second order moment (product of inertia). Theequivalent ellipse is the ellipse that has the same inertia matrix as thefracture. The eigenvalues and eigenvectors of J are related to the radiiof ellipse and the orientation of its major and minor axes. The radii ofthe equivalent ellipse are:
=a λm
2 1
00 (15)
=b λm
2 2
00 (16)
where λ1 and λ2 are eigenvalues of J. Orientation (θ) of equivalentellipse (or fracture) is calculated using:
=tan θγγ
1
2 (17)
where γ1 and γ2 are values of eigenvector's elements obtained form J(Corke, 2011).
3. Result and discussion
Several 2D and 3D examples of fracture networks are considered inthis study. A number of realizations are produced and similarities be-tween them and the original coal images are quantified using differentstatistical and physics-based methods. Note that the aim of stochasticmodeling is not to exactly reproduce the petrophysical properties (e.g.permeability), but the goal is generating an ensemble of models thatcan manifest the natural variabilities. This means that an exact
reproduction of permeability requires another round of samplingamong the produced realizations in this study. Thus, we are more in-terested in producing internally diverse (i.e. similarity between thegenerated models) and, at the same time, externally similar models (i.e.similarity between the generated models and original coal samples).
3.1. 2D modeling
An arbitrary 2D subset from the bright coal with a size of 248 × 248pixels is extracted from the difference image. This image is shown inFig. 2(a). Then, 100 realizations are generated using the described sto-chastic algorithm and six of these models are presented in Fig. 2(b). Tobetter reproduce the existing directional distribution of coal cleats in thissample, a rectangular template and overlap size with long direction per-pendicular to face cleats is considered. The results indicate that the pro-duced fracture networks strongly represent the original fracture network.
For numerical evaluation of simulated images, autocorrelationfunction (ACF) (Box et al., 2015) are computed for both the original andreconstructed images in X and Y directions (Fig. 3). As illustrated inFig. 3, ACFs of realizations are in agreement with the original image,which indicates that the reconstructed images resemble the originalstructure statistically. As demonstrated by the ACF, the generatedmodels show a reasonable variation in terms of structures and fracturedistribution. Such a variation is one of the preliminary goals of usingthe stochastic modeling as we are interested in high quality and, at thesame time, variable fracture networks.
To perform a numerical comparison between the fractures net-works, 2D simulated coal images are segmented and, then, the con-nectivity, average fractures length and fractures orientation are com-puted (see Fig. 4). As can be seen, the produced realizations cover awide range of those properties, compared to the original image. Theseresults indicate that the proposed stochastic algorithm can successfullypreserve the connectivity of fracture network (Fig. 4a, b) and thefracture segment length (Fig. 4c). The similarity between the originaland simulated images in terms of fracture orientation is also quantifiedand the results are shown in Fig. 4(d), which also demonstrate the ty-pical perpendicular coal cleats.
3.2. 3D modeling
3D coal samples provide more information regarding the spatialcomplexity and heterogeneity of fractures. In this section, the algorithmis tested on two complex 3D coal samples, Case I and Case II.
As previously mentioned, DFN method is one of the most popular
(a) (b)Fig. 2. (a) 2D difference image of coal sampleand (b) six realizations generated by theCCSIM algorithm.
S. Karimpouli et al. International Journal of Coal Geology 179 (2017) 153–163
157

methods for the characterization of fractured media. Thus, the proposedalgorithm is compared with the DFN method for Case I coal sample,both qualitatively and quantitatively.
3.3. 3D example: Case I
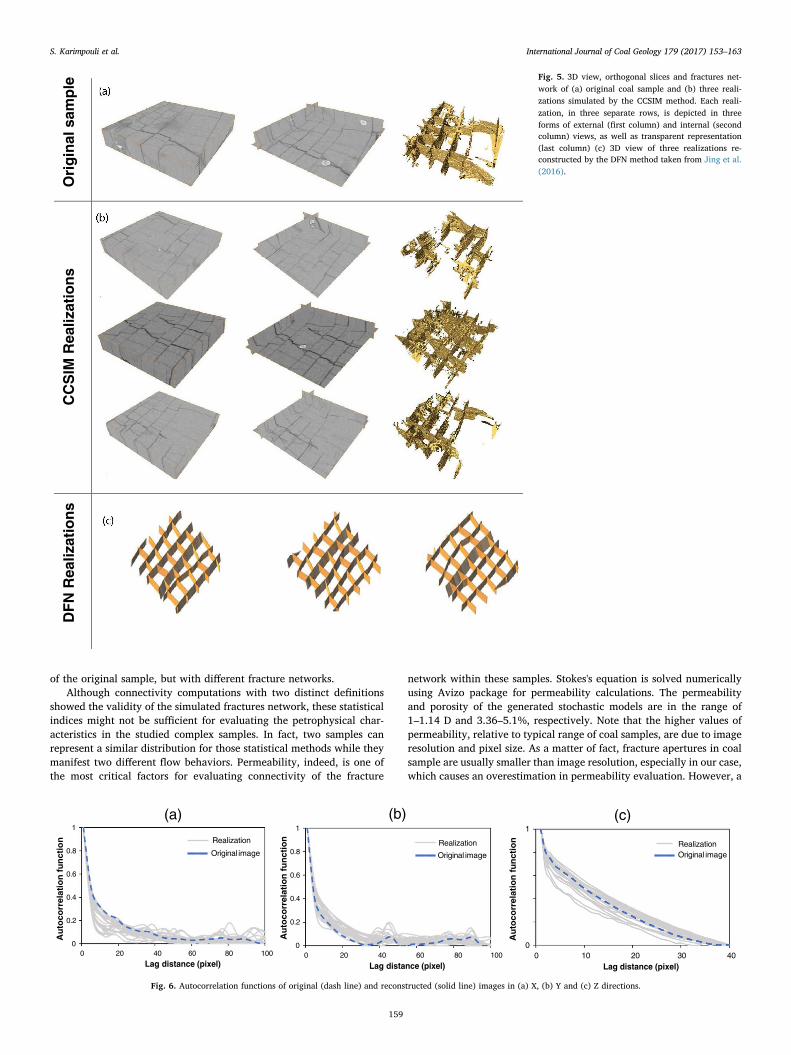
This example represents a 3D complex sample which has been usedby Jing et al. (2017, 2016). The results of DFN modeling for this sampleare also available, which allows comparing the proposed method withthe DFN method. The image is a cubic subset of 248 × 248 × 48 voxels,a 3D view, orthogonal slices and fracture network are provided inFig. 5(a).
The CCSIM algorithm is used and 50 realizations are produced. Forcapturing a representative pattern, a rectangular cube template andoverlap are chosen. Three realizations along with their correspondingfractures network are shown in Fig. 5(b). Visual inspection of 3Dimages demonstrates that the simulated cleat networks are completelyreproduced. These realizations resemble the original fractures network,while perpendicular patterns of coal cleat network are perfectly mi-micked using the proposed algorithm. Similar structures, to those of the
original image, can be seen in the produced realizations. Short-rangeconnectivities (e.g. lower right side) are also reproduced in the firstand, similarly, in the third realizations.
For a direct comparison with DFN models, three realizations re-constructed by Jing et al. (2016) are illustrated in Fig. 5(c). As can beseen, the DFN models are extremely simplified and they do not containthe existing complexity of the original sample. They, indeed, cannotrealistically represent heterogeneity of the coal sample because they arerestricted to some predefined statistical distributions. These results, onthe other hand, demonstrate the strong ability of CCSIM for modeling ofcoal fracture network in comparison with DFN method.
ACFs of 3D realizations in X, Y and Z directions are also computedand plotted in Fig. 6. The results indicate that the simulated samplespreserve the main statistical trends of the original sample, which im-plies that they can be accounted as valid and accurate samples.
Similar to the 2D sample, numerical properties of the fracture net-works are computed in this example and the results are shown in Fig. 7.It is observed that connectivity, average fracture length and orientationare well reproduced in the simulated samples. A comparison betweenthese results shows that the 3D simulated samples resemble properties
(a)1
(b) 1
0.8 0.8
0.6 0.6
0.4 0.4
0.2 0.2
0 0 20 40 60 80 100
Lag distance (pixel)
0 0 20 40 60 80 100
Lag distance (pixel)
Realization
Original image
Realization
Original imageA
uto
corr
elat
ion
fu
nct
ion
Au
toco
rrel
atio
n f
un
ctio
n
Fig. 3. Comparison of the ACFs of the original (dash line) and reconstructed (solid line) images in (a) X and (b) Y directions.
(a)40
(b) 30
30 20
20
10 10
0 300 400 500 600
Connectivity index (CI)
(c) 30
0 4.12.1 1.6
Normalized number of intersections (NNI)
(d) 80
60 20
40
10 20
0 11 13 15 17
Average fractures length (pixel)
0 -90 -60 -30 0 30 60 90
Fracture orientation
Original image
Realization
Original image
Realization
Original image
Realization
Realization
Original image
Fre
qu
ency
Fre
qu
ency
Fre
qu
ency
Fre
qu
ency
Fig. 4. Histogram of (a) connectivity index (CI), (b) normalized number of intersections (NNI), (c) average fractures length and (d) fractures orientation of 100 realizations (solid line).Original values are shown with a dashed line in each case.
S. Karimpouli et al. International Journal of Coal Geology 179 (2017) 153–163
158
of the original sample, but with different fracture networks.Although connectivity computations with two distinct definitions
showed the validity of the simulated fractures network, these statisticalindices might not be sufficient for evaluating the petrophysical char-acteristics in the studied complex samples. In fact, two samples canrepresent a similar distribution for those statistical methods while theymanifest two different flow behaviors. Permeability, indeed, is one ofthe most critical factors for evaluating connectivity of the fracture
network within these samples. Stokes's equation is solved numericallyusing Avizo package for permeability calculations. The permeabilityand porosity of the generated stochastic models are in the range of1–1.14 D and 3.36–5.1%, respectively. Note that the higher values ofpermeability, relative to typical range of coal samples, are due to imageresolution and pixel size. As a matter of fact, fracture apertures in coalsample are usually smaller than image resolution, especially in our case,which causes an overestimation in permeability evaluation. However, a
(b) (a) (c) 1 1 1
RealizationOriginal image 0.8 0.8
0.6 0.6
0.4 0.4
0.2 0.2
0 0 0 0 20 40 60 80 100 0 20 40 60 80 100 0 10 20
Lag distance (pixel)30 40
Lag distance (pixel) Lag distance (pixel)
Au
toco
rrel
atio
n f
un
ctio
n
Au
toco
rrel
atio
n f
un
ctio
n
Au
toco
rrel
atio
n f
un
ctio
n
Original image
Realization Realization
Original image
Fig. 6. Autocorrelation functions of original (dash line) and reconstructed (solid line) images in (a) X, (b) Y and (c) Z directions.
Ori
gin
al s
amp
leC
CS
IM R
ealiz
atio
ns
DF
N R
ealiz
atio
ns
Fig. 5. 3D view, orthogonal slices and fractures net-work of (a) original coal sample and (b) three reali-zations simulated by the CCSIM method. Each reali-zation, in three separate rows, is depicted in threeforms of external (first column) and internal (secondcolumn) views, as well as transparent representation(last column) (c) 3D view of three realizations re-constructed by the DFN method taken from Jing et al.(2016).
S. Karimpouli et al. International Journal of Coal Geology 179 (2017) 153–163
159

calibration method such as the one described in Ramandi et al. (2016a)can be implemented.
To perform another quantitative comparison between the originaland simulated samples, the permeability-porosity trend of originalsample is first calculated. For this purpose, several rectangular cubicsubsets with a size of 200 × 200 × 48 voxels are extracted from theoriginal sample and their permeability and porosity are computed ac-cordingly (Dvorkin et al., 2011). The permeability-porosity trend ofsimulated samples would follow this trend if they contain a similarnetwork (Karimpouli and Tahmasebi, 2017). The simulated samples aresegmented using the same steps that are taken for the original image.Then porosity and permeability parameters are calculated and thenormalized permeability (i.e., permeability ratio of realization to ori-ginal sample) are plotted in Fig. 8. It is seen that the permeability andporosity of the simulated samples are well distributed around the trendof original sample. This indicates that their connectivities are very si-milar to the original sample even if they contain different fracturenetworks. To have a comparison with DFN method, results generated bythis method (Jing et al., 2017) were also normalized to the permeabilityof original sample and were also plotted in Fig. 8. It is obvious that DFN
results are overestimated, since they simplify the nature of cleat system.On the other hand, DFN results indicate a smaller range of porosity.This implies that the CCSIM method can produce samples with highervariability of fracture networks and structures, and simultaneouslypreserve physical and statistical properties of the coal sample.
3.4. 3D example: Case II
The previous coal sample of Case I represents a typical cleat networkwith nearly homogeneous background. As mentioned, coal samplesgenerally contain macerals (organic matters), minerals, pores, a natu-rally fractured network (cleat) and induced fractures. Due to inability ofthe previous methods such as DFN, most of these crucial features arenot considered. In this study, however, all such critical features are usedand reproduced, which results in a more representative realization. Todemonstrate such an ability, a more heterogeneous 3D sample con-taining macerals, minerals, pores, cleats and induced fractures is usedin Case II. Fig. 9(a) shows a 3D view, orthogonal slices and highlightedfractures network of this sample. The CCSIM algorithm is implementedand 50 realizations are produced. Fig. 9(b) represents three realizationssimulated by this method. The results indicate that the fracture net-works and less-fractured porous dull bands and minerals are reasonablysimulated. A visual inspection of these images demonstrates that thehigh heterogeneity of the original sample is preserved in all realiza-tions.
To evaluate the connectivity of the fracture network numerically,permeability and porosity of both original and simulated samples arecomputed and compared. Permeability-porosity trend in the originalsample is determined using several subsets extracted from the originalsample with a size of 1003 voxels. This trend is considered as a re-ference trend for evaluating the simulated samples. Then, permeabilityand porosity of the generated realizations were computed and nor-malized permeability values were plotted on Fig. 10. As can be seen, thepermeability values of the simulated samples are distributed near thereference trend. This indicates that the simulated samples contain asimilar fracture network, compared to that of the original image even ifcontaining different structures. The 3D sample used in Fig. 8 lacked
(a) (b) 40 20
Original image
Realization
Original image
Realization 30
20 10
10
0 0 350 450 550 650 1.4 1.6 1.8 2
Normalized number of intersections (NNI)
(d)
Connectivity index (CI)
(c) 20 100
Original image
Realization RealizationOriginal image
80
60 10
40
20
0 0 10 12 14 16 -90 -60 -30 0 30 60 90
Average fracture length (pixels) Fracture orientation
Fre
qu
ency
F
req
uen
cy
Fre
qu
ency
F
req
uen
cy
Fig. 7. Histogram of (a) connectivity index (CI), (b) normalized number of intersections (NNI), (c) average fractures length and (d) fractures orientation of 100 realizations (solid line).Original values are shown with a dash line in each case.
2
1
0 2 3 4 5 6
Original trend
DFN
CCSIM
Original Sample
Fig. 8. Permeability ratio-porosity plot of original (square) and simulated samples by theCCSIM (circle) and DFN (diamond) methods. The dashed line represents a fitted line overthe permeabilities of each of the smaller subsets.
S. Karimpouli et al. International Journal of Coal Geology 179 (2017) 153–163
160

features such as cleats or high-density minerals and the required in-formation for applying DFN were simply extracted. However, thesample in Fig. 10 is very heterogeneous. An interlaced form of coalcleats, macerals and secondary fractures made it, almost, impossible tofind appropriate input parameters for the DFN method. This example,indeed, indicates that simple reconstruction methods such as DFN failto apply on very heterogeneous coal samples.
4. Conclusions
Micro-CT images have emerged as a promising source for identi-fying the heterogeneity in coal samples. Such images show that coalformations are complex and heterogeneous. Numerical methods such asECM, DCM and DFN method cannot consider all of the identified
heterogeneity in coal networks. Such methods usually disregard the realcomplexity by replacing them with overall distributions. In this study,the micro-CT images of coal samples are used in the CCSIM algorithmby which high quality realizations, based on a direct use of the actualcoal samples, are generated.
2D and 3D results show that both coal matrix and secondary frac-tures are properly reproduced using the CCSIM method. This algorithmcan be used with very large 3D coal samples in a multiscale frameworkand, thus, both small- and large-scale features can be reproduced.Comparison of these results with the DFN method indicates a significantimprovement in terms of reproducing the existing heterogeneity in themicro-CT image. To evaluate the simulated images numerically, direc-tional autocorrelation functions, connectivity, average length and or-ientation of fractures are computed. The results demonstrate that themain statistical and petrophysical properties of the original sample arewell reproduced. For evaluating the connectivity of the fracture net-work, in addition, permeability-porosity study is also conducted.Permeability results in the simulated samples are fallen on the referencetrend. This means, even with different fracture network and porosityvalue, fracture connectivity resembled the main structure of originalsample.
Lastly, we demonstrate that the combination of micro-CT images ofcoal samples and CCSIM algorithm provides a powerful tool for re-constructing samples with high-level of heterogeneity of coal matrixand fracture network. This study represents remarkable improvementsin this field. In future work, detailed works are recommended to focuson conditional and more efficient multiscale reconstruction of coalsamples.
Acknowledgments
MS thanks Tim Senden for his continued support.
Ori
gin
al s
amp
le(a)
(b)
CC
SIM
Rea
lizat
ion
sFig. 9. 3D view, orthogonal slices and highlighted fracturesnetwork of (a) original coal sample and (b) three realizationsreconstructed by the CCSIM method.
2
1
0 4 5 6 7 8
Original trendOriginal sampleCCSIM
Fig. 10. Permeability ratio-porosity plot of original (square) and simulated samples bythe CCSIM (circle) methods. The trend of original sample (dash line) is obtained usingextracted sub-samples.
S. Karimpouli et al. International Journal of Coal Geology 179 (2017) 153–163
161

Appendix A. Fast Fourier Transform.
Transformation of a 3D digital image DI(x,y,z) with grid dimensions of DIu×DIv×DI ω can be expressed using:
∑ ∑ ∑= ⎡⎣
+ + ⎤⎦=
−
=
−
=
−
( )u v w x y z x y zDI DI DI OL OL OL[ ( , , )] ( ω) ( , , ) exp 2πi ω ω ω ,x
OL
y
OL
z
OL
x x y y zz
0
1
0
1
0
1x y z
where, ω=( ωx, ωy, ωz). The inverse of the above equation is then calculated by.
∑ ∑ ∑=× ×
+ +=
−
=
−
=
−
x y z x y zDIOL OL OL
DI OL OL OL( , , ) 1 ( ω , ω , ω ) exp[2πi( ω ω ω )].u v w
OL OL OL
x y z x u y y z zω 0
1
ω 0
1
ω 0
1
x
u
y
v
z
w
According to the shift theorem for Fourier transforms,
⊗ =(f g) f( ω)g( ω),ω
according to which
⊗ = − ∗x y z x y z x y z x y zDI OL DI OL[ ( , , ) ( , , )] { [ ( , , ) ]. [ ( , , )]},ω T1
T
where * denotes the complex conjugate of the quantity and −1 denotes the inverse Fourier transform.
References
Alghalandis, Y.F., 2017. ADFNE: open source software for discrete fracture network en-gineering, two and three dimensional applications. Comput. Geosci. 102, 1–11.http://dx.doi.org/10.1016/j.cageo.2017.02.002.
Blunt, M.J., Bijeljic, B., Dong, H., Gharbi, O., Iglauer, S., Mostaghimi, P., Paluszny, A.,Pentland, C., 2013. Pore-scale imaging and modelling. Adv. Water Resour. 51,197–216. http://dx.doi.org/10.1016/j.advwatres.2012.03.003.
Box, G.E.P., Jenkins, G.M., Reinsel, G.C., Ljung, G.M., 2015. Time Series Analysis:Forecasting and Control. John Wiley & Sons.
Cacas, M.C., Ledoux, E., de Marsily, G., Barbreau, A., Calmels, P., Gaillard, B., Margritta,R., 1990. Modeling fracture flow with a stochastic discrete fracture network: cali-bration and validation: 2. The transport model. Water Resour. Res. 26, 491–500.http://dx.doi.org/10.1029/WR026i003p00491.
Chan, T.F., Vese, L.A., 2001. Active contours without edges. IEEE Trans. Image Process.10, 266–277. http://dx.doi.org/10.1109/83.902291.
Clarkson, C.R., Bustin, R.M., 1997. Variation in permeability with lithotype and maceralcomposition of cretaceous coals of the Canadian Cordillera. Int. J. Coal Geol. 33,135–151. http://dx.doi.org/10.1016/S0166-5162(96)00023-7.
Clarkson, C.R., Marc Bustin, R., 1996. Variation in micropore capacity and size dis-tribution with composition in bituminous coal of the Western Canadian SedimentaryBasin: implications for coalbed methane potential. Fuel 75, 1483–1498. http://dx.doi.org/10.1016/0016-2361(96)00142-1.
Close, J.C., 1993. Natural Fractures in Coal, in: Hydrocarbons from Coal. The AmericanAssociation of Petroleum Geologists, USA, pp. 119–132.
Close, J.C., Mavor, M.J., 1991. Influence of coal composition and rank on fracture de-velopment in Fruitland coal gas reservoirs of of San Juan Basin. In: Coalbed MethaneWest. North Am. Rocky Mt. Assoc. Geol., pp. 109–121.
Cnudde, V., Boone, M.N., 2013. High-resolution X-ray computed tomography in geos-ciences: a review of the current technology and applications. Earth-Sci. Rev. http://dx.doi.org/10.1016/j.earscirev.2013.04.003.
Cooley, J.W., Tukey, J.W., 1965. An algorithm for the machine calculation of complexFourier series. Math. Comput. 19, 297. http://dx.doi.org/10.2307/2003354.
Corke, P., 2011. Robotics, Vision and Control: Fundamental Algorithms in MATLAB.Springer.
Crelling, J.C., 1989. Separation and Characterization of Coal Macerals: Accomplishmentsand Future Possibilities.
Duhamel, P., Vetterli, M., 1990. Fast Fourier transforms: a tutorial review and a state ofthe art. Signal Process. 19, 259–299.
Dvorkin, J., Derzhi, N., Diaz, E., Fang, Q., 2011. Relevance of computational rock physics.Geophysics 76 (5), E141–E153. http://dx.doi.org/10.1190/geo2010-0352.1.
Gao, F., Stead, D., Kang, H., 2014. Numerical investigation of the scale effect and ani-sotropy in the strength and deformability of coal. Int. J. Coal Geol. 136, 25–37.http://dx.doi.org/10.1016/j.coal.2014.10.003.
Golab, A.N., Knackstedt, M.A., Averdunk, H., Senden, T., Butcher, A.R., Jaime, P., 2010.3D porosity and mineralogy characterization in tight gas sandstones. Lead. Edge 29,1476–1483. http://dx.doi.org/10.1190/1.3525363.
Golab, A., Ward, C.R., Permana, A., Lennox, P., Botha, P., 2013. High-resolution three-dimensional imaging of coal using microfocus X-ray computed tomography, withspecial reference to modes of mineral occurrence. Int. J. Coal Geol. 113, 97–108.http://dx.doi.org/10.1016/j.coal.2012.04.011.
Hamawand, I., Yusaf, T., Hamawand, S.G., 2013. Coal seam gas and associated water: areview paper. Renew. Sust. Energ. Rev. 22, 550–560. http://dx.doi.org/10.1016/j.rser.2013.02.030.
Hao, Y., Fu, P., Carrigan, C.R., 2013. Application of a Dual-Continuum Model forSimulation of Fluid Flow and Heat Transfer in Fractured Geothermal Reservoirs, in:The 38th Stanford Geothermal Workshop.
Heriawan, M.N., Koike, K., 2008. Identifying spatial heterogeneity of coal resourcequality in a multilayer coal deposit by multivariate geostatistics. Int. J. Coal Geol. 73,
307–330. http://dx.doi.org/10.1016/j.coal.2007.07.005.Heriawan, M.N., Koike, K., 2015. Coal quality related to microfractures identified by CT
image analysis. Int. J. Coal Geol. 140, 97–110. http://dx.doi.org/10.1016/j.coal.2015.02.001.
Jing, L., 2003. A review of techniques, advances and outstanding issues in numericalmodelling for rock mechanics and rock engineering. Int. J. Rock Mech. Min. Sci. 40,283–353. http://dx.doi.org/10.1016/S1365-1609(03)00013-3.
Jing, Y., Armstrong, R.T., Ramandi, H.L., Mostaghimi, P., 2016. Coal cleat reconstructionusing micro-computed tomography imaging. Fuel 181, 286–299. http://dx.doi.org/10.1016/j.fuel.2016.04.127.
Jing, Y., Armstrong, R.T., Mostaghimi, P., 2017. Rough-walled discrete fracture networkmodelling for coal characterisation. Fuel 191, 442–453. http://dx.doi.org/10.1016/j.fuel.2016.11.094.
Karacan, C., Okandan, E., 2000. Fracture/cleat analysis of coals from Zonguldak Basin(northwestern Turkey) relative to the potential of coalbed methane production. Int. J.Coal Geol. 44, 109–125. http://dx.doi.org/10.1016/S0166-5162(00)00004-5.
Karacan, C.Ö., Ruiz, F.A., Cotè, M., Phipps, S., 2011. Coal mine methane: a review ofcapture and utilization practices with benefits to mining safety and to greenhouse gasreduction. Int. J. Coal Geol. 86, 121–156. http://dx.doi.org/10.1016/j.coal.2011.02.009.
Karimpouli, S., Tahmasebi, P., 2015. Conditional reconstruction: an alternative strategyin digital rock physics. Geophysics 81. http://dx.doi.org/10.1190/GEO2015-0260.1.
Karimpouli, S., Tahmasebi, P., 2017. A hierarchical sampling for capturing permeabilitytrend in rock physics. Transp. Porous Media 116, 1057–1072. http://dx.doi.org/10.1007/s11242-016-0812-x.
Ketcham, R., Slottke, D.T., Sharp, J.M., 2010. Three-dimensional measurement of frac-tures in heterogeneous materials using high-resolution X-ray computed tomography.Geosphere 6, 499. http://dx.doi.org/10.1130/GES00552.1.
Latham, J.-P., Xiang, J., Belayneh, M., Nick, H.M., Tsang, C.-F., Blunt, M.J., 2013.Modelling stress-dependent permeability in fractured rock including effects of pro-pagating and bending fractures. Int. J. Rock Mech. Min. Sci. 57, 100–112. http://dx.doi.org/10.1016/j.ijrmms.2012.08.002.
Laubach, S.E., Tremain, C.M., 1991. Regional coal fracture patterns and coalbed methanedevelopment. In: The 32nd US Symposium on Rock Mechanics (USRMS), (Norman,Oklahoma).
Laubach, S.E., Marrett, R.A., Olson, I.E., Scott, A.R., 1998. Characteristics and origins ofcoal cleat: a review. Int. J. Coal Geol. 35, 175–207.
Liang, Y., 2016. Rock fracture skeleton tracing by image processing and quantitativeanalysis by geometry features. J. Geophys. Eng. 13, 273.
Lichtner, P.C., 2000. Critique of dual continuum formulations of multicomponent reactivetransport in fractured porous media. In: Dyn. Fluids Fract. Rock, pp. 281–298.
Lorig, L.J., Darcel, C., Damjanac, B., Pierce, M., Billaux, D., 2015. Application of discretefracture networks in mining and civil geomechanics. Min. Technol. 124, 239–254.
Mazumder, S., Wolf, K.-H., Elewaut, K., Ephraim, R., 2006. Application of X-ray com-puted tomography for analyzing cleat spacing and cleat aperture in coal samples. Int.J. Coal Geol. 68, 205–222.
Moinfar, A., Varavei, A., Sepehrnoori, K., Johns, R.T., 2013. Development of a coupleddual continuum and discrete fracture model for the simulation of unconventionalreservoirs. In: SPE Reservoir Simulation Symposium. Society of Petroleum Engineers.
Moore, T.A., 2012. Coalbed methane: a review. Int. J. Coal Geol. 101, 36–81. http://dx.doi.org/10.1016/j.coal.2012.05.011.
Mostaghimi, P., Armstrong, R.T., Gerami, A., Hu, Y., Jing, Y., Kamali, F., Liu, M., Liu, Z.,Lu, X., Ramandi, H.L., 2016. Pore Scale Characterisation of Coal: An UnconventionalChallenge. Abu Dhabi Int. Pet. Exhib, Conf.
Mostaghimi, P., Armstrong, R.T., Gerami, A., Hu, Y., Jing, Y., Kamali, F., Liu, M., Liu, Z.,Lu, X., Ramandi, H.L., Zamani, A., Zhang, Y., 2017. Cleat-scale characterisation ofcoal: an overview. J. Nat. Gas Sci. Eng. 39, 143–160. http://dx.doi.org/10.1016/j.jngse.2017.01.025.
Odgaard, A., Gundersen, H.J.G., 1993. Quantification of connectivity in cancellous bone,with special emphasis on 3-D reconstructions. Bone 14, 173–182. http://dx.doi.org/
S. Karimpouli et al. International Journal of Coal Geology 179 (2017) 153–163
162

10.1016/8756-3282(93)90245-6.Oppenheim, A.V., 1999. Discrete-Time Signal Processing. Pearson Education India.Otsu, N., 1975. A threshold selection method from gray-level histograms. Automatica 11,
23–27.Pan, Z., Connell, L.D., 2012. Modelling permeability for coal reservoirs: a review of
analytical models and testing data. Int. J. Coal Geol. 92, 1–44. http://dx.doi.org/10.1016/j.coal.2011.12.009.
Pruess, K., 1985. A practical method for modeling fluid and heat flow in fractured porousmedia. Soc. Pet. Eng. J. 25, 14–26. http://dx.doi.org/10.2118/10509-PA.
Purl, R., Evanoff, J.C., Brugler, M.L., 1991. Measurement of coal cleat porosity and re-lative permeability characteristics. In: SPE Gas Technology Symposium. Society ofPetroleum Engineers. http://dx.doi.org/10.2118/21491-MS.
Quackenbush, L.J., 2004. A review of techniques for extracting linear features fromimagery. Photogramm. Eng. Remote. Sens. 70, 1383–1392. http://dx.doi.org/10.14358/PERS.70.12.1383.
Ramandi, H.L., Armstrong, R.T., Mostaghimi, P., Saadatfar, M., Pinczewsk, W.V., 2015. X-ray micro-computed tomography imaging for coal characterization. In: SPE AsiaPacific Unconventional Resources Conference and Exhibition. Society of PetroleumEngineers. http://dx.doi.org/10.2118/177017-MS.
Ramandi, H.L., Armstrong, R.T., Mostaghimi, P., 2016a. Micro-CT image calibration toimprove fracture aperture measurement. Case Stud. Nondestruct. Test. Eval. 6, 4–13.http://dx.doi.org/10.1016/j.csndt.2016.03.001.
Ramandi, H.L., Mostaghimi, P., Armstrong, R.T., 2016b. Digital rock analysis for accurateprediction of fractured media permeability. J. Hydrol. http://dx.doi.org/10.1016/j.jhydrol.2016.08.029.
Ramandi, H.L., Mostaghimi, P., Armstrong, R.T., Saadatfar, M., Pinczewski, W.V., 2016c.Porosity and permeability characterization of coal: a micro-computed tomographystudy. Int. J. Coal Geol. 154–155, 57–68. http://dx.doi.org/10.1016/j.coal.2015.10.001.
Robinson, P.C., 1983. Connectivity of fracture systems-a percolation theory approach. J.Phys. A Math. Gen. 16, 605.
Sakellariou, A., Arns, C.H., Sheppard, A.P., Sok, R.M., Averdunk, H., Limaye, A., Jones,A.C., Senden, T.J., Knackstedt, M.A., 2007. Developing a virtual materials laboratory.Mater. Today 10, 44–51. http://dx.doi.org/10.1016/S1369-7021(07)70307-3.
Sakhaee-Pour, A., Wheeler, M.F., 2016. Effective flow properties for cells containingfractures of arbitrary geometry. SPE J. 21, 0965–0980. http://dx.doi.org/10.2118/167183-PA.
Serra, J., 1986. Introduction to mathematical morphology. Comput. Vision, Graph. ImageProcess. 35, 283–305. http://dx.doi.org/10.1016/0734-189X(86)90002-2.
Sheppard, A.P., Sok, R.M., Averdunk, H., 2004. Techniques for image enhancement andsegmentation of tomographic images of porous materials. Phys. A Stat. Mech. Appl.339, 145–151. http://dx.doi.org/10.1016/j.physa.2004.03.057.
Sheppard, A., Latham, S., Middleton, J., Kingston, A., Myers, G., Varslot, T., Fogden, A.,Sawkins, T., Cruikshank, R., Saadatfar, M., Francois, N., Arns, C., Senden, T., 2014.Techniques in helical scanning, dynamic imaging and image segmentation for im-proved quantitative analysis with X-ray micro-CT. Nucl. Instruments Methods Phys.Res. B 324, 49–56. http://dx.doi.org/10.1016/j.nimb.2013.08.072.
Suárez-Ruiz, I., Crelling, J.C., 2008. Applied Coal Petrology: The Role of Petrology in CoalUtilization. Academic Press.
Tahmasebi, P., 2017. Structural adjustment for accurate conditioning in large-scalesubsurface systems. Adv. Water Resour. 101. http://dx.doi.org/10.1016/j.advwatres.2017.01.009.
Tahmasebi, P., Sahimi, M., 2015a. Geostatistical simulation and reconstruction of porousmedia by a cross-correlation function and integration of hard and soft data. Transp.Porous Media 107, 871–905. http://dx.doi.org/10.1007/s11242-015-0471-3.
Tahmasebi, P., Sahimi, M., 2015b. Reconstruction of nonstationary disordered materialsand media: watershed transform and cross-correlation function. Phys. Rev. E 91,32401. http://dx.doi.org/10.1103/PhysRevE.91.032401.
Tahmasebi, P., Sahimi, M., 2016a. Enhancing multiple-point geostatistical modeling: 1.Graph theory and pattern adjustment. Water Resour. Res. 52, 2074–2098.
Tahmasebi, P., Sahimi, M., 2016b. Enhancing multiple-point geostatistical modeling: 2.Iterative simulation and multiple distance function. Water Resour. Res. 52,2099–2122. http://dx.doi.org/10.1002/2015WR017807.
Tahmasebi, P., Sahimi, M., Caers, J., 2014. MS-CCSIM: accelerating pattern-based geos-tatistical simulation of categorical variables using a multi-scale search in Fourierspace. Comput. Geosci. 67, 75–88. http://dx.doi.org/10.1016/j.cageo.2014.03.009.
Tahmasebi, P., Javadpour, F., Sahimi, M., 2015a. Three-dimensional stochastic char-acterization of shale SEM images. Transp. Porous Media 110, 521–531. http://dx.doi.org/10.1007/s11242-015-0570-1.
Tahmasebi, P., Javadpour, F., Sahimi, M., 2015b. Multiscale and multiresolution mod-eling of shales and their flow and morphological properties. Sci Rep 5, 16373. http://dx.doi.org/10.1038/srep16373.
Tahmasebi, P., Javadpour, F., Sahimi, M., 2016a. Stochastic shale permeability matching:three-dimensional characterization and modeling. Int. J. Coal Geol. 165, 231–242.http://dx.doi.org/10.1016/j.coal.2016.08.024.
Tahmasebi, P., Javadpour, F., Sahimi, M., Piri, M., 2016b. Multiscale study for stochasticcharacterization of shale samples. Adv. Water Resour. 89, 91–103. http://dx.doi.org/10.1016/j.advwatres.2016.01.008.
Tahmasebi, P., Sahimi, M., Kohanpur, A.H., Valocchi, A., 2016c. Pore-scale simulation offlow of CO2 and brine in reconstructed and actual 3D rock cores. J. Pet. Sci. Eng.http://dx.doi.org/10.1016/j.petrol.2016.12.031.
Tahmasebi, P., Sahimi, M., Andrade, J.E., 2017. Image-based modeling of granular porousmedia. Geophys. Res. Lett. http://dx.doi.org/10.1002/2017GL073938.
Ting, F.T.C., 1977. Origin and spacing of cleats in coal beds. J. Press. Vessel. Technol. 99,624. http://dx.doi.org/10.1115/1.3454584.
Wolf, K.-H.A.A., van Bergen, F., Ephraim, R., Pagnier, H., 2008. Determination of thecleat angle distribution of the RECOPOL coal seams, using CT-scans and imageanalysis on drilling cuttings and coal blocks. Int. J. Coal Geol. 73, 259–272. http://dx.doi.org/10.1016/j.coal.2007.06.001.
Wu, Y.Y.-S., 2000. On the effective continuum method for modeling multiphase flow,multicomponent transport, and heat transfer in fractured rock. In: Dynamics of Fluidsin Fractured Rock. American Geophysical Union. http://dx.doi.org/10.1029/GM122p0299.
Yao, Y., Liu, D., Che, Y., Tang, D., Tang, S., Huang, W., 2009. Non-destructive char-acterization of coal samples from China using microfocus X-ray computed tomo-graphy. Int. J. Coal Geol. 80, 113–123. http://dx.doi.org/10.1016/j.coal.2009.08.001.
S. Karimpouli et al. International Journal of Coal Geology 179 (2017) 153–163
163