international energy agency - uic - international … · association representing the railway...
TRANSCRIPT

6

INTERNATIONAL ENERGY AGENCY
The International Energy Agency (IEA), an autonomous agency, was established in November 1974. Its primary mandate was – and is – two-fold: to promote energy security amongst its member
countries through collective response to physical disruptions in oil supply, and provide authoritative research and analysis on ways to ensure reliable, affordable and clean energy for its 29 member countries and beyond. The IEA carries out a comprehensive programme of energy co-operation among its member countries, each of which is obliged to hold oil stocks equivalent to 90 days of its net imports. The Agency’s aims include the following objectives:
n Secure member countries’ access to reliable and ample supplies of all forms of energy; in particular, through maintaining effective emergency response capabilities in case of oil supply disruptions.
n Promote sustainable energy policies that spur economic growth and environmental protection in a global context – particularly in terms of reducing greenhouse-gas emissions that contribute to climate change.
n Improve transparency of international markets through collection and analysis of energy data.
n Support global collaboration on energy technology to secure future energy supplies and mitigate their environmental impact, including through improved energy
efficiency and development and deployment of low-carbon technologies.
n Find solutions to global energy challenges through engagement and dialogue with non-member countries, industry, international
organisations and other stakeholders.IEA member countries:
Australia Austria
Belgium Canada
Czech RepublicDenmark
EstoniaFinland
FranceGermany
GreeceHungary
Ireland Italy
JapanKoreaLuxembourgNetherlandsNew Zealand NorwayPolandPortugalSlovak RepublicSpainSweden
SwitzerlandTurkey
United KingdomUnited States
The European Commission also participates in
the work of the IEA.
© OECD/IEA, 2015International Energy Agency
9 rue de la Fédération 75739 Paris Cedex 15, France
www.iea.org
Please note that this publication is subject to speci�c restrictions that limit its use and distribution.
The terms and conditions are available online at www.iea.org/t&c/
Together
SecureSustainable
Page02_2015_A4_Q.indd 1 07-09-2015 17:31:09
2
UIC: the international professional association representing the railway sector
UIC, the worldwide railway association, groups counts 200 members in 95 countries, including railway companies, infrastructure managers, rail transport operators and rail service providers. UIC’s members represent over 1 million kilometres of tracks, 2 900 billion passenger-km, 10 000 billion tonne-km and a workforce of 7 million railway staff.
The UIC's main missions include understanding the business needs of the rail community, developing programmes of innovation to meet those needs and preparing and publishing professional railway standards that facilitate the implementation of the innovative solutions. The train and education of the people called upon to use these innovative solutions is vital and the organisation of training schemes is a core component in ensuring the competency of tomorrow’s generation of rail personnel.
Representing rail with a wide range of international organisations such as the UN and cooperating with all organisations specialising in rail matters and transport issues right around the world is one of the prime raisons d’être of the UIC. UIC maintains and develop close cooperation links with all actors in the rail transport �eld, including manufacturers, railway associations, public authorities.The UIC Energy Environment & Sustainability (EES) Platform manages 5 expert networks (Energy & CO2, Emissions, Sustainable Mobility, Noise and Sustainable Land Use) and a portfolio of projects focusing on the development of best practice, benchmarking for environmental sustainability and reporting of corporate and social responsibility. For info www.uic.org (http://www.uic.org).
UIC MEMBERS 2016
WWW.UIC.ORG
3


ForewordThe International Energy Agency (IEA) and the International Union of Railways (UIC) are pleased to jointly publish the �fth edition of the data handbook on “Energy Consumption and CO2 Emissions” in the global railway sector. This publication marks the �fth year of cooperation between the two organizations and aims at providing insightful information, each year covering a special feature. In the past, these topics have ranged from the energy mix in the rail sector to the cost and sustainability impacts associated with rail infrastructure to vehicle ef�ciency. The success of past editions has encouraged us to continue this valuable joint effort.
This new edition takes into account the Paris Agreement, the historic outcome of the 21st UNFCC Conference of Parties in December 2015 in which more than 180 countries pledged to take steps to reduce greenhouse gas emissions. Part 2 of this year’s handbook emphasizes the analysis and the evaluation of rail sector and national targets, also compared to other modes of transport. The results of our analysis indicate that historical evolution of speci�c energy consumption and speci�c CO2 emissions from rail are on track to achieving the 2030 and 2050 UIC sustainability targets, moving the rail sector towards the 2 Degree Scenario (2DS) outlined in the IEA Energy Technology Perspectives publication.
One important �nding is that rail transport offers a more sustainable alternative to most other transport modes, both in terms of energy use and carbon emissions per passenger-kilometre or tonne-kilometre, and is anticipated to continue to do so over the coming decades. Setting targets helps in understanding the scale of investments needed to support sustainable transport. Monitoring performances is also important to foster this shift, as it highlights the developments of the transport system and guides policy action aiming for its increased sustainability.
With each new edition, the rail and energy data continue to improve as a result of the close cooperation between the IEA and the UIC. For this 2016 Handbook, the main improvements result from the collection of more detailed and accurate energy data from UIC members and their commitment through the Climate Responsibility Pledge, and the latest IEA Energy Technology Perspectives data. In addition, the direct data collection from railways, which covers over 90% of the global rail transport activity, and the incorporation of this information into the IEA Mobility Model have increased the consistency of the data and provided a more solid background for the analysis presented in this handbook.
The IEA and UIC strongly believe in the capacity of the rail sector to monitor and improve energy consumption practices. We are hopeful that this assessment of the railway sector’s performance will help to provide solid and consistent information to policy and decision makers, promoting the role of sustainable transport as one of the key actors towards a more energy ef�cient and low carbon future.
Jean-Pierre Loubinoux
International Union of Railways Director General
Fatih Birol
International Energy Agency Executive Director
5

Acknowledgments
This publication has been made possible thanks to UIC railway members, who have contributed to UIC statistics on railway activity, energy consumption, and CO2 emissions, and to the IEA Energy Data Centre, which has collected and managed energy balances and CO2 emissions data from fuel combustion.
The Handbook has been coordinated by Marine Gorner and Renske Schuitmaker under the supervision of Pierpaolo Cazzola, for the IEA, and by Gabriel Castañares Hernandez for UIC.
A special mention goes to the cooperation of Nicholas Craven, Cheul-Kyu Lee, Aurelia Kollros, Takumi Ishii and Zhangshan Zhao (UIC) for the completion of this work and to the contributions from UIC members improving the data collection.
Gratitude is also extended to the Sustainable Development Foundation for its technical support, especially to Raimondo Orsini, Massimo Ciuf�ni, Luca Refrigeri, Daniela Cancelli, Valeria Gentili, Camille Courouble and Ilaria Indri.
Infographic design: UICwww.uic.com
Printed by Acinnov’
6

Railway Handbook 2016
Energy Consumption and CO2 Emissions
Focus on Sustainability Targets


Index
Index of Figures
Index of Tables
Introduction
Part I: The Railway Sector Main data World
Europe
USA
Japan
Russian Federation
India
People’s Republic of China
Part II: Focus on Sustainability Targets
The UIC Low Carbon Rail Transport Challenge and the UIC Climate Responsibility Pledge
The UIC-CER Commitment at European Level
Examples of targets set by rail companies
Trajectories of improvement and targets set by different transport sectors
Current performance and planned evolution in railway activity shares, in speci�c energy consumptions and CO2 emissions by sector, according to IEA ETP 2016
Intended Nationally Determined Contributions (INDCs) and Railway sector
Actions and technologies supporting future reductions and improvements
Methodology Notes
Glossary
References
10
13
15
17
18
28
37
45
53
61
69
79
82
86
92
94
100
103
107
109
111
114
9
Index of Figures
19
20
20
21
21
22
22
23
23
24
24
25
25
26
27
27
29
30
30
31
31
32
32
33
33
34
35
35
36
38
39
39
40
40
41
41
42
42
EU28
USA
WorldFig. 1: Share of CO2 emissions from fuel combustion by sector, 2013
Fig. 2: Total CO2 emissions from fuel combustion by sector, 1990-2013
Fig. 3: Share of �nal energy consumption by sector, 2013
Fig. 4: Total �nal energy consumption by sector, 1990-2013
Fig. 5: Transport sector CO2 emissions by mode, 1990-2013
Fig. 6: Share of railway CO2 emissions by geographic area, 2013
Fig. 7: Railway passenger transport activity by geographic area, 1975-2013
Fig. 8: Railway freight transport activity by geographic area, 1975-2013
Fig. 9: Share of electri�ed railway tracks in selected countries and geographic areas,
1975-2013
Fig. 10: Global high-speed lines with speed >250 km/h in operation and expected future
developments, 1975-2015
Fig. 11: High-speed lines with speed >250 km/h in operation by country, 2015
Fig. 12: High-speed activity as a share of total passenger railway activity, 1990-2013
Fig. 13: Railway �nal energy consumption by fuel, 1990-2013
Fig. 14: World electricity production mix evolution, 1990-2013
Fig. 15: Railway speci�c energy consumption, 1975-2013
Fig. 16: Railway speci�c CO2 emissions, 1975-2013
Fig. 17: Share of CO2 emissions from fuel combustion by sector, 2013
Fig. 18: Total CO2 emissions from fuel combustion by sector, 1990-2013
Fig. 19: Share of �nal energy consumption by sector, 2013
Fig. 20: Total �nal energy consumption by sector, 1990-2013
Fig. 21: Transport sector CO2 emissions by mode, 1990-2013
Fig. 22: Passenger and freight transport activity - all modes, 1995-2013
Fig. 23: Passenger and freight railway activity and High-Speed activity as a share of total
passenger railway activity, 1975-2013
Fig. 24: Length and share of electri�ed and non-electri�ed railway tracks, 1975-2013
Fig. 25: Railway �nal energy consumption by fuel, 1990-2013
Fig. 26: EU28 Railway energy sources mix evolution, 1990-2013
Fig. 27: EU28 electricity production mix evolution, 1990-2013
Fig. 28: Railway speci�c energy consumption, 1990-2013
Fig. 29: Railway speci�c CO2 emissions, 1990-2013
Fig. 30: Share of CO2 emissions from fuel combustion by sector, 2013
Fig. 31: Total CO2 emissions from fuel combustion by sector, 1990-2013
Fig. 32: Share of �nal energy consumption by sector, 2013
Fig. 33: Total �nal energy consumption by sector, 1990-2013
Fig. 34: Transport sector CO2 emissions by mode, 1990-2013
Fig. 35: Passenger and freight transport activity - all modes, 1990-2013
Fig. 36: Passenger and freight railway activity, 1975-2013
Fig. 37: Length of railway tracks, 1975-2013
Fig. 38: Railway �nal energy consumption by fuel, 1990-2013
10

43
44
44
46
47
47
48
48
49
49
50
50
51
52
52
54
55
55
56
56
57
57
58
58
59
60
60
62
63
63
64
64
65
65
66
66
67
68
68
Russia
Fig. 39: National electricity production mix evolution, 1990-2013
Fig. 40: Railway speci�c energy consumption, 1975-2013
Fig. 41: Railway speci�c CO2 emissions, 1975-2013
Fig. 42: Share of CO2 emissions from fuel combustion by sector, 2013
Fig. 43: Total CO2 emissions from fuel combustion by sector, 1990-2013
Fig. 44: Share of �nal energy consumption by sector, 2013
Fig. 45: Total �nal energy consumption by sector, 1990-2013
Fig. 46: Transport sector CO2 emissions by mode, 1990-2013
Fig. 47: Passenger and freight transport activity - all modes, 2000-2013
Fig. 48: Passenger and freight railway activity, 1975-2013
Fig. 49: Length and share of electri�ed and non-electri�ed railway tracks, 1975-2013
Fig. 50: Railway �nal energy consumption by fuel, 1990-2013
Fig. 51: National electricity production mix evolution, 1990-2013
Fig. 52: Railway speci�c energy consumption, 1975-2013
Fig. 53: Railway speci�c CO2 emissions, 1975-2013
Fig. 54: Share of CO2 emissions from fuel combustion by sector, 2013
Fig. 55: Total CO2 emissions from fuel combustion by sector, 1995-2013
Fig. 56: Share of �nal energy consumption by sector, 2013
Fig. 57: Total �nal energy consumption by sector, 1995-2013
Fig. 58: Transport sector CO2 emissions by mode, 1995-2013
Fig. 59: Passenger and freight transport activity - all modes, 2004-2013
Fig. 60: Passenger and freight railway activity, 1975-2013
Fig. 61: Length and share of electri�ed and non-electri�ed railway tracks, 1975-2013
Fig. 62: Railway �nal energy consumption by fuel, 1995-2013
Fig. 63: National electricity production mix evolution, 1990-2013
Fig. 64: Railway speci�c energy consumption, 1975-2013
Fig. 65: Railway speci�c CO2 emissions, 1975-2013
Fig. 66: Share of CO2 emissions from fuel combustion by sector, 2013
Fig. 67: Total CO2 emissions from fuel combustion by sector, 1995-2013
Fig. 68: Share of �nal energy consumption by sector, 2013
Fig. 69: Total �nal energy consumption by sector, 1990-2013
Fig. 70: Transport sector CO2 emissions by mode, 1990-2013
Fig. 71: Passenger and freight transport activity - all modes, 2005-2013
Fig. 72: Passenger and freight railway activity, 1975-2013
Fig. 73: Length and share of electri�ed and non-electri�ed railway tracks, 1975-2013
Fig. 74: Railway �nal energy consumption by fuel, 1990-2013
Fig. 75: National electricity production mix evolution, 1990-2013
Fig. 76: Railway speci�c energy consumption, 2000-2013
Fig. 77: Railway speci�c CO2 emissions, 2000-2013
India
Japan
11

70
71
71
72
72
73
73
74
74
75
76
76
83
83
88
89
90
91
96
96
97
99
100
101
102
104
Fig. 78: Share of CO2 emissions from fuel combustion by sector, 2013
Fig. 79: Total CO2 emissions from fuel combustion by sector, 1995-2013
Fig. 80: Share of �nal energy consumption by sector, 2013
Fig. 81: Total �nal energy consumption by sector, 1990-2013
Fig. 82: Transport sector CO2 emissions by mode, 1990-2013
Fig. 83: Passenger and freight transport activity - all modes, 1990-2013
Fig. 84: Passenger and freight railway activity, 1975-2013
Fig. 85: Length and share of electri�ed and non-electri�ed railway tracks, 1975-2013
Fig. 86: Railway �nal energy consumption by fuel, 2000-2013
Fig. 87: National electricity production mix evolution, 1990-2013
Fig. 88: Railway speci�c energy consumption, 1990-2013
Fig. 89: Railway speci�c CO2 emissions, 1990-2013
Fig. 90: World speci�c rail energy consumption evolution per traf�c unit (TU) between
1990 and 2013, compared to 2030 and 2050 targets
Fig. 91: World speci�c rail CO2 emissions evolution per traf�c unit (TU) between
1990 and 2013 compared to 2030 and 2050 targets
Fig. 92: UIC-Europe Railways speci�c energy consumption evolution (passenger and freight
services) between 1990 and 2013, compared to UIC-CER 2030 and 2050 targets
at EU level
Fig. 93: UIC-Europe Railways speci�c CO2 emissions evolution (passenger and freight
services) between 1990 and 2013, compared to UIC-CER 2030 and 2050 targets
at EU level (including dual reporting)
Fig. 94: UIC-Europe Railways total CO2 emissions evolution (including dual reporting)
between 1990 and 2013 compared to EU targets and UIC Strategy 2030
and 2050 target
Fig. 95: Share of renewable energy consumption of all European sectors and the EU rail
sector (according to the market based approach) compared to EU targets
Fig. 96: Comparison between UIC Low Carbon Rail Transport Challenge Targets and
CO2-eq mitigation potential by 2030 – Passenger service
Fig. 97: Comparison between UIC Low Carbon Rail Transport Challenge Targets and
CO2-eq mitigation potential by 2030 – Freight service
Fig. 98: Current Well-to-Wheel GHG intensities of passenger and freight
transport activity, 2015
Fig. 99: Car sector CO2 emissions, fuel consumptions and targets
Fig. 100: Shares of passenger rail activity by scenario
Fig. 101: Speci�c energy intensity for different modes of transport according to
the 4 Degree and 2 Degree scenario
Fig. 102: Speci�c CO2-eq intensity for different modes of transport according to
the 4 Degree and 2 Degree scenario
Fig. 103: Map of countries that include rail projects in their (I)NDCs and targets related
SustainabilityTargets
SustainabilityTargets
SustainabilityTargets
Global Targets
European targets
Intermodal Comparison
China
12

19
26
29
34
38
43
46
51
54
59
62
67
70
75
86
88
89
90
92
105
106
Table 1: World transport modal share, 2013
Table 2: World railway energy fuel mix, 1990-2013
Table 3: EU28 transport modal share, 2013
Table 4: EU28 railway energy sources mix, 1990-2013
Table 5: USA transport modal share, 2013
Table 6: USA railway energy sources mix, 1990-2013
Table 7: Japan transport modal share, 2013
Table 8: Japan railway energy sources mix, 1990-2013
Table 9: Russia transport modal share, 2013
Table 10: Russia railway energy sources mix, 1995-2013
Table 11: India transport modal share, 2013
Table 12: India railway energy sources mix, 1990-2013
Table 13: China transport modal share, 2013
Table 14: China railway energy sources mix, 2000-2013
Table 15: UIC-CER Railway sector targets overview at European level
Table 16: Environmental Strategy Reporting System (ESRS) data monitoring dashboard -
Speci�c passenger and freight energy consumption
Table 17: Environmental Strategy Reporting System (ESRS) data monitoring dashboard -
Speci�c passenger and freight CO2 emissions
Table 18: Environmental Strategy Reporting System (ESRS) data monitoring dashboard -
Total CO2 emissions
Table 19: Examples of targets set by rail companies
Table 20: Examples in rail-speci�c (I)NDC measures in a selection of countries
Table 21: (I)NDCs target for CO2 emissions
Index of tables13


Introduction
The production of the Railway Handbook 2016 has been an important opportunity to strengthen the collaboration between the IEA and the UIC. This relationship has served to enrich and improve the knowledge of activity, energy and emissions data associated with the railway sector. The previous editions of the Handbook are freely available from the UIC website.
The data provided within this handbook are derived from the synchrony of UIC rail infrastructure, activity, and energy use statistics (UIC 2015a; UIC 2015b) and IEA data on energy consumption and CO2 emissions by end-use sector and fuel type (IEA 2015a; IEA, 2015b). For this year’s edition, substantial improvements have been introduced regarding data collection from the main regions presented in the publication. Russia, Japan, USA, China, India and Korea have made particularly noteworthy strides to improve the caliber of data within the report.
As in previous editions, Part I of this year’s Handbook is dedicated to presenting the most signi�cant data and trends concerning energy consumption and CO2 emissions from the rail sector, focusing on the most important Regions in terms of rail activity, namely EU 28, USA, Japan, Russia, India and China. This serves to place a spotlight on the regions and countries which cumulatively accounted for 89% of passenger-kilometres and 84% of tonne-kilometres travelled globally in 2013. In addition, statistics illuminating rail-related CO2 emissions, passenger activities, freight activities, and electri�cation rates at a regional and global level are published within this section.
Furthermore, this Part pays particular attention to the growing role of high-speed trains in the rail sector, including but not limited to global coverage and the number of kilometres (in operation, construction, and planning phases). The sector of high-speed rail infrastructure was dominated by China in 2013, as it hosts 60% of the global High-Speed rail infrastructure, followed by Europe which accounts for a share of 24%.
In general, projections and trends regarding energy consumption, CO2 emissions, and rail activity described in the previous editions are con�rmed in this year’s handbook. However, compared to the previous edition, the continuous improvement of calculation methods and analytical models produced minor changes in the world rankings with regards to the energy intensity and carbon intensity indicators. According to the Railway Handbook 2016 data, China has the lowest energy consumption
15

per passenger-kilometre (40 kJ/pkm) and the lowest CO2 emissions per passenger-kilometre (7 gCO2/pkm), while Russia holds the lowest rate of energy consumption per tonne-km for goods transport by rail (86 kJ/tkm) and the lowest speci�c CO2 emissions from freight (9 gCO2/tkm).
In the context of the historic outcome of the 21st Conference of Parties in December last year, it was decided to dedicate Part II of the Railway Handbook 2016 to sustainability targets, framing an overview of the targets set by railway companies and countries alike. Part II also compares these targets with targets set for other modes of transport. The analysis con�rms that the rail sector has continuously reduced its speci�c energy consumption and CO2 emissions since 1990, and that this evolution is in line with the UIC Low Carbon Rail Transport Challenge targets for 2030 and 2050. Additionally, the analysis con�rms that the rail sector offers the most ef�cient land-based mode of transport per passenger-kilometre and tonne-kilometre compared to other modes of transport.
At a global level, the UIC targets for reducing its speci�c energy use and CO2 emissions has proven to be in line with the trajectory of the 2 Degree Scenario (2DS) outlined in the IEA Energy Technology Perspectives publication (IEA 2016a). Additionally, the UIC targets for the European rail sector are consistence with the trajectory set out in the IEA 2DS.
Part II also zooms in on commitments made by single countries to achieve the climate goals of the Paris Agreement. In this context, an analysis is included of the Intended Nationally Determined Contributions (INDCs) - representing the outlined actions individual countries intend to take under the Paris Agreement - aimed at understanding the extent to which single countries include the transport sector and the rail sector in their pledges.
Setting sustainability targets are paramount in the pursuit of minimizing the effects of climate change. Meaningful goals and analysis provide a mechanism by which to monitor progress. Concurrently, strong commitments serve as a foundation on which substantive and effective policy can be developed. Tenacious implementation of sustainability objectives and recurrent monitoring of sector performance are indispensable elements to realizing the goals set out by the international community.
16

Part I: The Railway Sector
Main Data

The transport sector was responsible for emitting 7.5 billion tCO2 in 2013. The share of CO2 emissions from transport has continuously increased since 2010, rising from 22.7% in 2010 to 23.4% in 2013. In 2013, 3.5% of transport CO2 emissions were due to the rail sector, while railways transported 8% of the world’s passengers and goods.
The rail sector accounted for 2% of the total energy used in the transport sector, in 2013. The rail sector was for 57% fuelled by oil products and for 36.4% by electricity.
In 2013, six regions and countries (EU 28, US, Russia, China, India, Japan) were responsible for 78% of overall CO2 emissions of the rail sector, of which a quarter was emitted by China.
Coal consumption in rail has dramatically fallen between 1990 and 2013. In the same period electricity use in rail has increased from 17.2% to 36.4%, including a signi�cant rise in renewable electricity sources in the total energy mix of railways (from 3.4% to 8.7%).
Global railway passenger activity grew by 133% between 1975 and 2013. China and India were the major contributors to this growth, with an eight-fold increase in railway activity, while EU28 activity grew by 10% in the same period. Freight activity has increased by 78% since 1975. USA, Russia and China are the top countries for freight transport on rail in terms of tonne-kilometers carried.
The share of electri�ed railway tracks has increased by 163% between 1975 and 2013 at world level. China and Korea increased their share of respectively 325% and 343% from 1990 to 2013.
The total length of high-speed lines in operation was more than 10 times higher in 2015 compared to 1990. China has taken the lead in high speed rail deployment and was hosting 60% of all high speed lines globally in 2015. Globally, high-speed passenger activity has almost doubled between 2000 and 2013.
In 2013, the speci�c energy consumption of rail passenger transport was 138 kJ/pkm, while the speci�c energy consumption of rail freight transport was 129 kJ/tkm. Railways speci�c energy consumption decreased by 63% and 48% in passenger and freight services respectively, between 1975 and 2013.
Speci�c CO2 emissions in the rail sector have been following a similar improvement rate: they dropped by 60% in passenger services and by 38% in freight services between 1975 and 2013.
World
Key Facts18
Wo
rld

Fig. 1: Share of CO2 emissions from fuel combustion by sector, 2013
Table 1: World transport modal share, 2013
Note: Electricity and heat production related emissions are reallocated to the end-use sectors. In transport, all the emissions from electricity and heat production are reallocated to rail.
Source: Elaboration by Susdef based on IEA (2015a)
Source: Elaboration by IEA based on IEA (2016b), UIC (2015a) and UNCTAD (2014)
19
Wo
rld
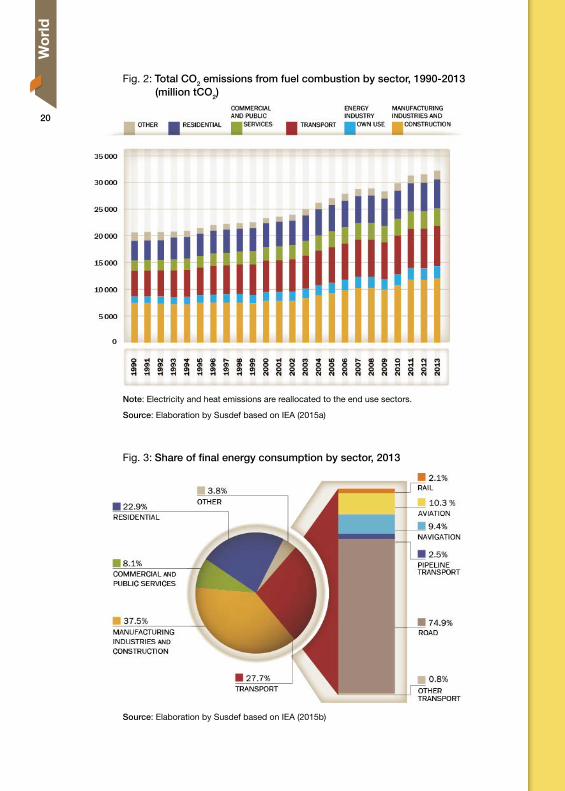
Fig. 3: Share of �nal energy consumption by sector, 2013
Source: Elaboration by Susdef based on IEA (2015b)
Fig. 2: Total CO2 emissions from fuel combustion by sector, 1990-2013 (million tCO2)
Note: Electricity and heat emissions are reallocated to the end use sectors.
Source: Elaboration by Susdef based on IEA (2015a)
20
Wo
rld

Fig. 5: Transport sector CO2 emissions by mode, 1990-2013 (million tCO2 - left, share of rail in global CO2 emissions - right)
Note: Electricity and heat emissions are reallocated to the end-use sectors. In transport, all the emissions from electricity and heat production are reallocated to rail.
Source: Elaboration by Susdef based on IEA (2015a)
Fig. 4: Total �nal energy consumption by sector, 1990-2013 (PJ)
Source: Elaboration by Susdef based on IEA (2015b)
21
Wo
rld

Source: Elaboration by IEA based on UIC (2015a)
Fig. 7: Railway passenger transport activity by geographic area, 1975-2013 (trillion pkm)
Note: All the emissions from electricity and heat production in transport have been reallocated to rail.
Source: Elaboration by Susdef based on IEA (2015a)
Fig. 6: Share of railway CO2 emissions by geographic area, 2013
22
Wo
rld

Fig. 8: Railway freight transport activity by geographic area, 1975-2013 (trillion tkm)
Source: Elaboration by IEA based on UIC (2015a)
Fig. 9: Share of electri�ed railway tracks in selected countries and geographic areas, 1975-2013
Note: The USA are not displayed in this chart because of a lack of data.
Source: Elaboration by IEA based on UIC (2015a)
23
Wo
rld

Fig. 10: Global high-speed lines (>250 km/h) in operation and expected future developments, 1975-2015 (thousand km)
Source: Elaboration by IEA on UIC (2015a)
Source: Elaboration by Susdef on IEA and UIC (2015a)
Fig. 11: High-speed lines (>250 km/h) in operation by country (km), 2015
24
Wo
rld

Source: Elaboration by IEA based on UIC (2015a)
Fig. 12: High-speed activity as a share of total passenger railway activity, 1990-2013 (billion pkm)
1990
1995
2000
2001
2002
2003
2004
2005
2006
2007
2008
2009
2010
2011
2013
2012
0
500
1 000
1 500
2 000
2 500
3 000
3 500
2013
2012
2011
2010
2009
2008
2007
2006
2005
2004
2003
2002
2001
2000
1995
1990
0%
2%
4%
6%
8%
10%
12%
14%
HS PASSENGER% HS PASSENGER OTHER PASSENGER
1990
1991
1992
1993
1994
1995
1996
1997
1998
1999
2000
2001
2002
2003
2004
2005
2006
2007
2008
2009
2010
2011
2013
2012
ELECTRICITY (NUCLEAR)
ELECTRICITY (RENEWABLE)
ELECTRICITY (FOSSIL)OIL PRODUCTS BIOFUELSCOAL (NUCLEAR) (RENEWABLE) (FOSSIL)
1990
1991
1992
1993
1994
1995
1990
1991
1992
1993
1994
1995
1996
1997
1998
1999
2000
2001
2002
2003
2004
2005
2006
2007
2008
2009
2010
2011
2012
2013
0
500
1 000
1 500
2 000
2 500
Note: See Methodology Notes p. 109
Source: Elaboration by Susdef based on IEA (2015b)
Fig. 13: Railway �nal energy consumption by fuel, 1990-2013 (PJ)
25
Wo
rld

Fig. 14: World electricity production mix evolution, 1990-2013
Table 2: World railway energy fuel mix, 1990-2013
Source: IEA (2015b)
OIL PRODUCTS
COAL PRODUCTS
BIOFUELS
1990ENERGY MIX BY SOURCE
SUMMARY BY SOURCE TYPE
58.0%24.8%0.0%
17.2%10.9%2.9%3.4%
3.9%8.0%
2013
57.3%5.6%0.7%
36.4%24.5%
ELECTRICITY
of which Fossil
of which Nuclearof which Renewable
FOSSIL SOURCE
NUCLEAR
RENEWABLE
1990
93.7%2.9%3.4%
2013
87.4%3.9%8.7%
Note: See Methodology Notes p. 109
Source: Elaboration by Susdef based on IEA (2015b)
1990
1991
1992
1993
1994
1995
1996
1997
1998
1999
2000
2001
2002
2003
2004
2005
2006
2007
2008
2009
2010
2011
2013
2012
OIL PRODUCTS GAS NUCLEAR RENEWABLECOAL PRODUCTS
0%
10%
20%
30%
40%
50%
60%
70%
80%
90%
100%
1990
1991
1992
1993
1994
1995
1990
1991
1992
1993
1994
1995
1996
1997
1998
1999
2000
2001
2002
2003
2004
2005
2006
2007
2008
2009
2010
2011
2012
2013
26
Wo
rld

PASSENGER (kJ/pkm) FREIGHT (kJ/tkm)
2000
2001
2002
2003
2004
2005
2006
2007
2008
2009
2010
2011
2012
2013
1995
1990
1985
1980
1975
0
50
100
150
200
250
300
350
400
Fig. 15: Railway speci�c energy consumption, 1975-2013
Note: See Methodology Notes p. 109
Source: Elaboration by IEA and Susdef based on IEA (2016b) and UIC (2015a)
PASSENGER (g CO2 /pkm) FREIGHT (g CO2 /tkm)
2000
2001
2002
2003
2004
2005
2006
2007
2008
2009
2010
2011
2012
2013
1995
1990
1985
1980
1975
0
5
10
15
20
25
30
35
40
45
Fig. 16: Railway speci�c CO2 emissions, 1975-2013
Note: See Methodology Notes p. 109
Source: Elaboration by IEA and Susdef based on IEA (2016b) and UIC (2015a)
27
Wo
rld

Transport is the main source of CO2 emissions in the European Union: it was responsible for 1.1 billion tCO2 emissions in 2013 (31.6% of the European Union’s total CO2 emissions). The rail sector accounted for 1.5% of transport-related CO2 (about 17 million tCO2), while the rail share in transport activity of passengers and goods was 9.1% in 2013.
The contribution of rail to transport emissions has decreased by more than half since 1990.
The rail sector used 220 PJ of energy in 2013, 70% of which was provided by electricity.
The EU railway energy fuel mix shows an increase of renewable sources from 7.6% in 1990 to about 20% in 2013.
391 billion passenger-km were transported by rail in 2013. High speed rail accounted for 29% of this activity, seven times more than in 1990.
The electri�ed railway network has doubled in length between 1975 and 2013, totaling 221 000 km of tracks in 2013. The share of electri�ed tracks in the total railway network reached 61% in 2013.
Railway speci�c energy consumption dropped by 19.6% for passenger services and by 22.3% for freight services between 1990 and 2013.
Railway speci�c CO2 emissions fell by 41% for passenger services and 46% for freight services between 1990 and 2013.
Europe (EU28)
Key Facts28
EU
28

Table 3: EU28 transport modal share, 2013
Fig. 17: Share of CO2 emissions from fuel combustion by sector, 2013
Source: Elaboration by Susdef based on EC (2015) and UIC (2015a)
Note: Electricity and heat emissions are reallocated to the end-use sectors. In transport, all the emissions from electricity and heat production are reallocated to rail.
Source: Elaboration by Susdef based on IEA (2015a) and UIC (2015b)
29
EU
28

Fig. 18: Total CO2 emissions from fuel combustion by sector, 1990-2013 (million tCO2)
Fig. 19: Share of �nal energy consumption by sector, 2013
Source: Elaboration by Susdef based on IEA (2015b) and UIC (2015b)
Note: Electricity and heat emissions are reallocated to the end-use sectors.
Source: Elaboration by Susdef based on IEA (2015a) and UIC (2015b)
30
EU
28
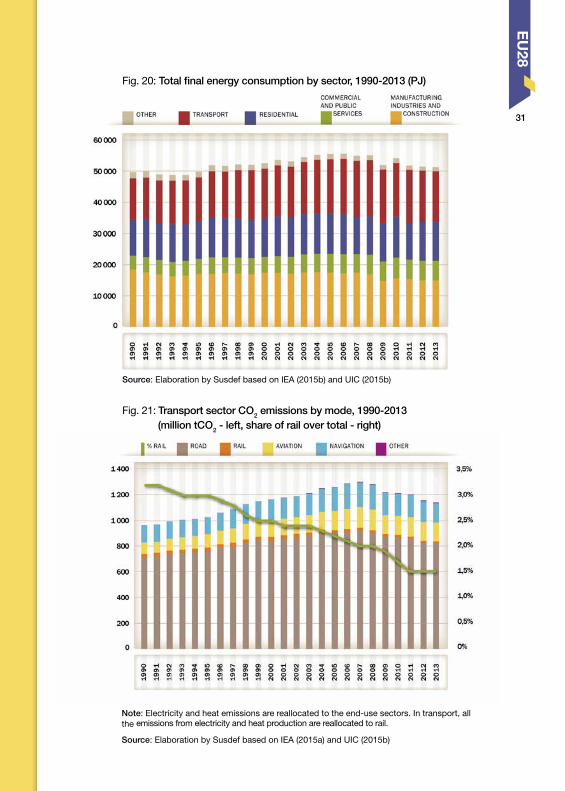
Source: Elaboration by Susdef based on IEA (2015b) and UIC (2015b)
Fig. 21: Transport sector CO2 emissions by mode, 1990-2013 (million tCO2 - left, share of rail over total - right)
Note: Electricity and heat emissions are reallocated to the end-use sectors. In transport, all the emissions from electricity and heat production are reallocated to rail.
Source: Elaboration by Susdef based on IEA (2015a) and UIC (2015b)
Fig. 20: Total �nal energy consumption by sector, 1990-2013 (PJ)
31
EU
28

Fig. 23: Passenger and freight railway activity and High-Speed activity as a share of total passenger railway activity (%), 1975-2013
Source: Elaboration by Susdef based on EC (2015) and UIC (2015a)
Source: Elaboration by IEA based on UIC (2015a)
Fig. 22: Passenger and freight transport activity - all modes, 1995-2013 (billion pkm and tkm – left, share of rail over total – right)
32
EU
28

Fig. 24: Length and share of electri�ed and non-electri�ed railway tracks, 1975-2013 (thousand km)
Source: Elaboration by IEA based on UIC (2015a)
Note: See Methodology Notes p. 109
Source: Elaboration by Susdef based on IEA (2015b) and UIC (2015b)
Fig. 25: Railway �nal energy consumption by fuel, 1990-2013 (PJ)
33
EU
28

Table 4: EU28 railway energy fuel mix, 1990-2013
Source: Elaboration by Susdef based on IEA (2015b) and UIC (2015b).
Fig. 26: EU28 Railway energy fuel mix evolution, 1990-2013
Note: See Methodology Notes p. 109
Source: Elaboration by Susdef based on IEA (2015b) and UIC (2015b)
34
EU
28

Source: IEA (2015b)
Fig. 27: EU28 electricity production mix evolution, 1990-2013
Fig. 28: Railway speci�c energy consumption, 1990-2013
Note: See Methodology Notes p. 109
Source: UIC (2015b)
35
EU
28

Fig. 29: Railway speci�c CO2 emissions, 1990-2013
Note: See Methodology Notes p. 109
Source: UIC (2015b)
36
EU
28

USA
In the USA, the transport sector was responsible for emitting 5.2 billion tCO2 (35% of total CO2 emissions) in 2013, representing the largest source of CO2 emissions of the country. The USA transport sector has the largest contribution to its national total in terms of CO2 emissions of the countries and regions examined in this Handbook.
2.2% of transport CO2 emissions were caused by the rail sector (about 40 million tCO2).
0.1% of passenger-km and 33% of goods (in tonne-km) were transported by rail in 2013.
The rail sector used about 540 PJ of �nal energy in 2013, of which 92.8% were provided by oil products, because of the low electri�cation rate of US railway lines.
USA railways used close to 3% of biofuels (15 PJ) in their energy mix in 2013, the highest share among global railways.
Both passenger and freight transport activity increased between 1975 and 2013. Rail freight activity has more than doubled while rail passenger activity has increased by 69%, since 1975.
Between 1975 and 2013, energy consumption per passenger-km decreased by 32% and energy consumption per freight tonne-km decreased by 58%.
CO2 emissions per passenger-km (passenger speci�c emissions) decreased by 28% between 1975 and 2013, while freight speci�c emissions decreased by 58% in the same period.
Key Facts37
US
A

Fig. 30: Share of CO2 emissions from fuel combustion by sector, 2013
Table 5: USA transport modal share, 2013
* Note: Navigation’s passenger activity has a value of 0.03%, corresponding to 647 million passenger-km.
Source: Elaboration by Susdef based on UIC (2015a) and NTS (2015)
Note: Electricity and heat emissions are reallocated to the end-use sectors. In transport, all the emissions from electricity/heat production are reallocated to rail.
Source: Elaboration by Susdef based on IEA (2015a)
38
US
A

Source: Elaboration by Susdef based on IEA (2015b)
Note: Electricity and heat emissions are reallocated to the end-use sectors.
Source: Elaboration by Susdef based on IEA (2015a)
Fig. 31: Total CO2 emissions from fuel combustion by sector, 1990-2013 (million tCO2)
Fig. 32: Share of �nal energy consumption by sector, 2013
39
US
A

Source: Elaboration by Susdef based on IEA (2015b)
Note: Electricity and heat emissions are reallocated to the end-use sectors. In transport, all the emissions from electricity and heat production are reallocated to rail.
Source: Elaboration by Susdef based on IEA (2015a)
Fig. 34: Transport sector CO2 emissions by mode, 1990-2013 (million tCO2 - left, share of rail over total - right)
Fig. 33: Total �nal energy consumption by sector, 1990-2013 (PJ)
40
US
A

Fig. 36: Passenger and freight railway activity, 1975-2013
Source: Elaboration by Susdef based on UIC (2015a) and NTS (2015)
Source: Elaboration by IEA based on UIC (2015a)
Fig. 35: Passenger and freight transport activity - all modes, 1990-2013 (billion pkm and tkm – left, share of rail over total – right)
41
US
A

Fig. 37: Length of railway tracks, 1975-2013 (thousand km)
Fig. 38: Railway �nal energy consumption by fuel, 1990-2013 (PJ)
Source: Elaboration by IEA based on UIC (2015a)
Note: See Methodology Notes p. 109
Source: Elaboration by Susdef based on IEA (2015b)
42
US
A
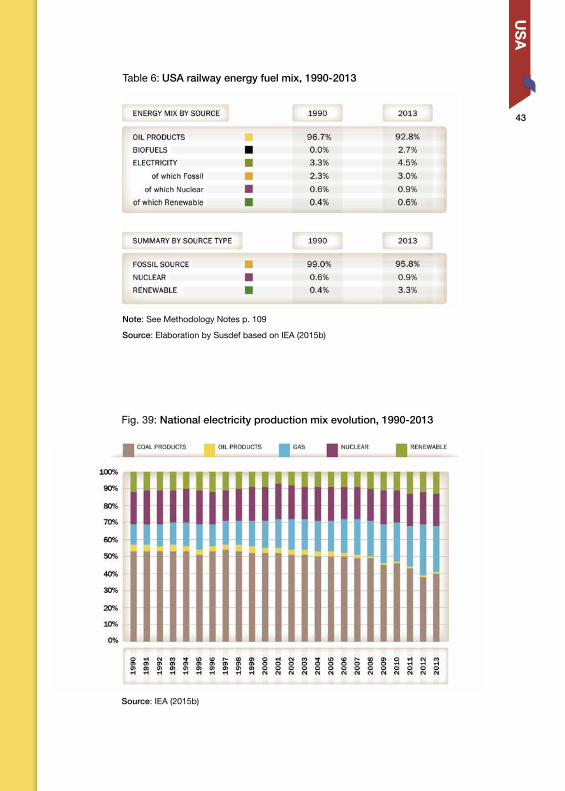
Table 6: USA railway energy fuel mix, 1990-2013
Note: See Methodology Notes p. 109
Source: Elaboration by Susdef based on IEA (2015b)
Fig. 39: National electricity production mix evolution, 1990-2013
Source: IEA (2015b)
43
US
A

Fig. 40: Railway speci�c energy consumption, 1975-2013
Fig. 41: Railway speci�c CO2 emissions, 1975-2013
Note: See Methodology Notes p. 109
Source: Elaboration by IEA and Susdef based on IEA (2016b) and UIC (2015a)
Note: See Methodology Notes p. 109
Source: Elaboration by IEA and Susdef based on IEA (2016b) and UIC (2015a)
44
US
A

Japan
In Japan, the transport sector was responsible for 20% of total CO2 emissions in 2013 and 4.6% of transport emissions were due to the rail sector.
The share of rail in total transport activity was of 28.9% for passenger services and 5% for freight services.
In 2013, 90% of the energy used in Japan was provided by electricity. The share of nuclear electricity in the national electricity production mix has decreased from 18% to 1% after the Fukushima accident of 2011. This has mainly been replaced by natural gas. As a result, CO2 emissions in the railway sector have increased by 25% between 2010 and 2013.
In the railway energy fuel mix, diesel consumption decreased from 17.4% to 10.3% between 1990 and 2013, which was replaced by the use of electricity.
387 billion passenger-km were transported by rail in 2013, a 29% increase since 1975. High speed rail accounted for 23% of this activity.
The electri�ed railway network covers about 19 000 km, and the proportion of electri�ed tracks increased by a 48% between 1975 and 2013. The electri�ed network represents 70% of the total rail network in Japan.
Railway speci�c energy consumption dropped by 9% for passenger service and by 24% for freight between 1975 and 2013.
Railway speci�c CO2 emissions dropped by 8% for passenger services and 18% for freight services between 1975 and 2013.
Key Facts45
Japan

Source: Elaboration by Susdef based on JSY (2015), IEA (2016b), UIC (2015a)
Table 7: Japan transport modal share, 2013
Fig. 42: Share of CO2 emissions from fuel combustion by sector, 2013
Note: Electricity and heat emissions are reallocated to the end-use sectors. In transport, all the emissions from electricity and heat production are reallocated to rail.
Source: Elaboration by Susdef based on IEA (2015a)
46
Jap
an

Fig. 44: Share of �nal energy consumption by sector, 2013
Fig. 43: Total CO2 emissions from fuel combustion by sector, 1990-2013 (million tCO2)
Source: Elaboration by Susdef based on IEA (2015b)
Note: Electricity and heat emissions are reallocated to the end-use sectors.
Source: Elaboration by Susdef based on IEA (2015a)
47
Japan
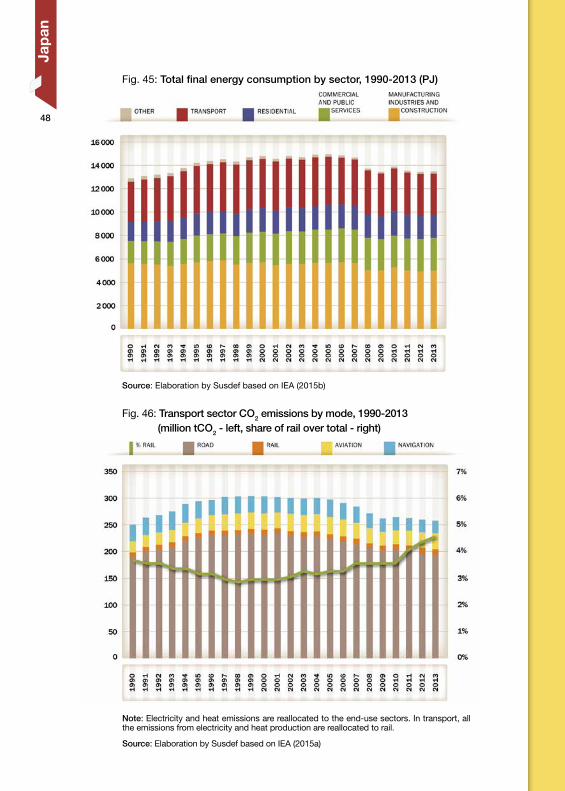
Fig. 45: Total �nal energy consumption by sector, 1990-2013 (PJ)
Fig. 46: Transport sector CO2 emissions by mode, 1990-2013 (million tCO2 - left, share of rail over total - right)
Source: Elaboration by Susdef based on IEA (2015b)
Note: Electricity and heat emissions are reallocated to the end-use sectors. In transport, all the emissions from electricity and heat production are reallocated to rail.
Source: Elaboration by Susdef based on IEA (2015a)
48
Jap
an

Source: Elaboration by Susdef based on JSY (2015), IEA (2016b), UIC (2015a)
Source: Elaboration by IEA based on UIC (2015a)
Fig. 47: Passenger and freight transport activity - all modes, 2000-2013 (billion pkm and tkm – left, share of rail over total – right)
Fig. 48: Passenger and freight railway activity and High-Speed activity as a share of total passenger railway activity (%), 1975-2013
49
Japan

Fig. 49: Length and share of electri�ed and non-electri�ed railway tracks, 1975-2013 (thousand km)
Fig. 50: Railway �nal energy consumption by fuel, 1990-2013 (PJ)
Source: Elaboration by IEA based on UIC (2015a)
Note: See Methodology Notes p. 109
Source: Elaboration by Susdef based on IEA (2015b)
50
Jap
an

Fig. 51: National electricity production mix evolution, 1990-2013
Table 8: Japan railway energy fuel mix, 1990-2013
Source: IEA (2015b)
Note: See Methodology Notes p. 109
Source: Elaboration by Susdef based on IEA (2015b)
51
Japan
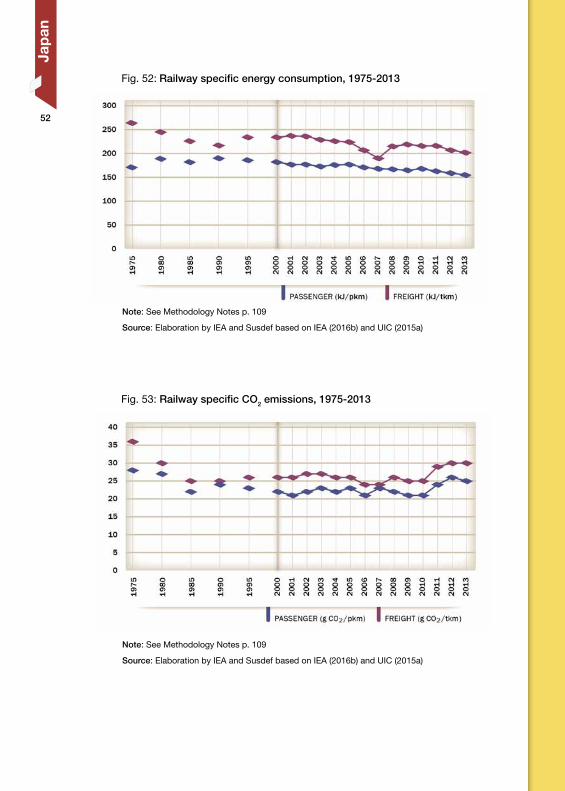
Fig. 52: Railway speci�c energy consumption, 1975-2013
Fig. 53: Railway speci�c CO2 emissions, 1975-2013
Note: See Methodology Notes p. 109
Source: Elaboration by IEA and Susdef based on IEA (2016b) and UIC (2015a)
Note: See Methodology Notes p. 109
Source: Elaboration by IEA and Susdef based on IEA (2016b) and UIC (2015a)
52
Jap
an

Russian Federation
The rail sector is responsible for 14% of transport’s CO2 emissions and 5.5% of transport’s energy use. Rail’s share of total transport activity reached 28.5% for passenger services and about 87% for freight services in 2013, making it the �rst transport mode in the country.
Pipeline transport is the second largest source of CO2 in transport (20.1% of total transport emissions) after road (46.5% of transport emissions), followed by rail with a contribution of 14% to total transport emissions.
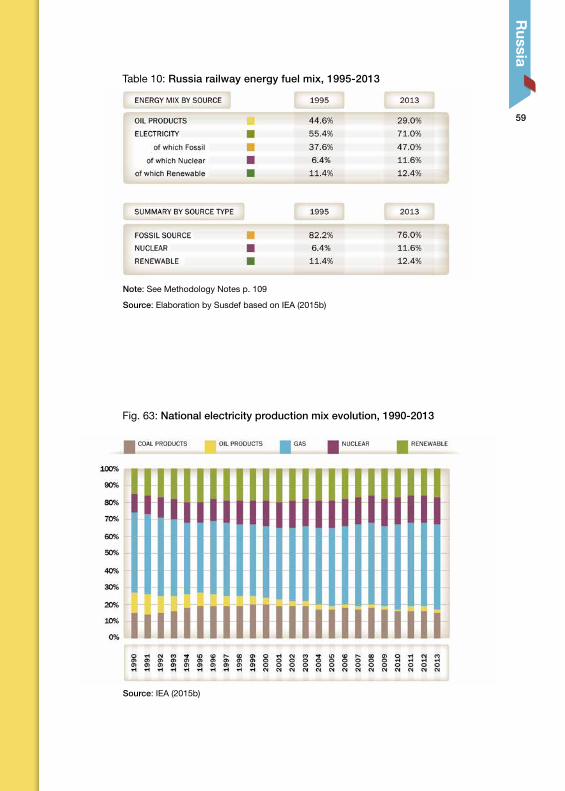
The amount of energy used in the transport sector was close to 250 PJ in 2013. The use of oil products in the railway energy fuel mix declined from 44.6% in 1995 to 29% in 2013. This decline in oil products use occurred in parallel with a growth in electricity use over the same period, from 55.4% in 1995 to 71% in 2013. The share of nuclear electricity in the electricity mix has doubled over the same period.
140 billion passenger-km and about 2 200 billion tonne-km were transported by rail in 2013. Freight rail activity has increased by 83% between 1995 and 2013.
The Russian railway network extension, in terms of km of tracks, has increased by 58% between 1975 and 2013. Over the same period, the total length of electri�ed railway tracks has more than doubled and accounted for 57% of the total network in 2013.
Railway speci�c energy consumption dropped by 20% for passenger services and by 46% for freight services between 1975 and 2013.
Speci�c CO2 emissions from rail freight services decreased by 25% between 1975 and 2013, while speci�c CO2 emissions from rail passenger services increased from 19.9 gCO2/pkm to 24.1 gCO2/pkm in the same period.
Key Facts53
Russia

Fig. 54: Share of CO2 emissions from fuel combustion by sector, 2013
Table 9: Russia transport modal share, 2013
Source: Elaboration by Susdef based on OECD (2016), UIC (2015a) and Rosstat (2015)
Note: Electricity and heat emissions are reallocated to the end-use sectors. In transport, all the emissions from electricity and heat production are reallocated to rail.
Source: Elaboration by Susdef based on IEA (2015a)
54
Rus
sia

Fig. 55: Total CO2 emissions from fuel combustion by sector, 1995-2013 (million tCO2)
Fig. 56: Share of �nal energy consumption by sector, 2013
Source: Elaboration by Susdef based on IEA (2015b)
Note: Electricity and heat emissions are reallocated to the end-use sectors.
Source: Elaboration by Susdef based on IEA (2015a)
55
Russia

Note: Electricity and heat emissions are reallocated to the end-use sectors. In transport, all the emissions from electricity and heat production are reallocated to rail.
Source: Elaboration by Susdef based on IEA (2015a)
Fig. 57: Total �nal energy consumption by sector, 1995-2013 (PJ)
Fig. 58: Transport sector CO2 emissions by mode, 1995-2013 (million tCO2 - left, share of rail over total - right)
Source: Elaboration by Susdef based on IEA (2015b)
56
Rus
sia

Source: Elaboration by Susdef based on OECD (2016), UIC (2015a) and Rosstat (2015)
Source: Eleboration by IEA based on UIC (2015a)
Fig. 59: Passenger and freight transport activity - all modes, 2004-2013 (billion pkm and tkm – left, share of rail over total – right)
Fig. 60: Passenger and freight railway activity, 1975-2013
57
Russia
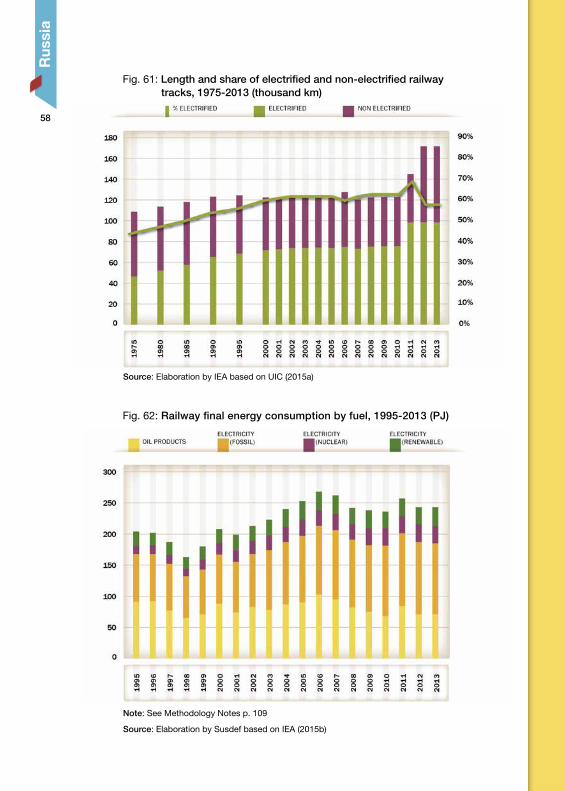
Fig. 61: Length and share of electri�ed and non-electri�ed railway tracks, 1975-2013 (thousand km)
Note: See Methodology Notes p. 109
Source: Elaboration by Susdef based on IEA (2015b)
Source: Elaboration by IEA based on UIC (2015a)
Fig. 62: Railway �nal energy consumption by fuel, 1995-2013 (PJ)
58
Rus
sia
Note: See Methodology Notes p. 109
Source: Elaboration by Susdef based on IEA (2015b)
Fig. 63: National electricity production mix evolution, 1990-2013
Source: IEA (2015b)
Table 10: Russia railway energy fuel mix, 1995-2013
59
Russia

Fig. 64: Railway speci�c energy consumption, 1975-2013
Note: See Methodology Notes p. 109
Source: Elaboration by IEA and Susdef based on IEA (2016b) and UIC (2015a)
Note: See Methodology Notes p. 109
Source: Elaboration by IEA and Susdef based on IEA (2016b) and UIC (2015a)
Fig. 65: Railway speci�c CO2 emissions, 1975-2013
60
Rus
sia

India
The transport sector was responsible for 13.5% of total CO2 emissions in 2013 (equal to 250 million tCO2), increasing its share about 3.5 times from 1990. 9.7% of transport emissions were generated by the rail sector (amounting to about 24.7 million tCO2). Rail’s share of total transport activity was 12.6% for passengers transport, and 33.3%% for freight transport.
The rail sector used about 170 PJ of energy in 2013, two thirds of which were provided by oil products. The share of coal products in the rail energy mix in 1990 was as high as 50% and it was entirely phased out by 1997.
Over the same period, the use of oil products in Indian railways increased from 36.6% to 67.3% of the total energy mix, and the use of electricity grew from 8.5% to 32.7% of the total energy mix. The share of renewable electricity sources in the total energy mix also increased from 2.1% to 5.5% over that period.
These changes in energy sources allowed for a reduction of the share of rail transport CO2 emissions from 24% in 1990 to less than 10% in 2013, while rail activity doubled in the same period.
India is the country with the highest rail passenger activity with over 1 trillion passenger-km carried in 2013. This number is seven times larger than what it was in 1975. Similarly, freight activity increased with a factor 5.5 between 1975 and 2013.
The electri�ed railway network’s length has tripled between 1975 and 2013. This electri�cation brought the share of electri�ed tracks in the total railway network to 55% in 2013.
Rail’s speci�c energy consumption has dropped by 42% for passenger services and by 27% for freight services between 2000 and 2013.
Rail’s speci�c CO2 emissions fell by 37% for passenger services and by 24% for freight services between 2000 and 2013.
Key Facts61
Ind
ia

Fig. 66: Share of CO2 emissions from fuel combustion by sector, 2013
Table 11: India transport modal share, 2013
Note: Electricity and heat emissions are reallocated to the end-use sectors. In transport, all the emissions from electricity/heat production are reallocated to rail.
Source: Elaboration by Susdef based on IEA (2015a)
Source: Elaboration by Susdef based on OECD (2016), UIC (2015a) and SYB (2015)
62
Ind
ia

Fig. 68: Share of �nal energy consumption by sector, 2013
Note: Electricity and heat emissions are reallocated to the end-use sectors.
Source: Elaboration by Susdef based on IEA (2015a)
Source: Elaboration by Susdef based on IEA (2015b)
Fig. 67: Total CO2 emissions from fuel combustion by sector, 1995-2013 (million tCO2)
63
Ind
ia

Fig. 70: Transport sector CO2 emissions by mode, 1990-2013 (million tCO2 - left, share of rail over total - right)
Fig. 69: Total �nal energy consumption by sector, 1990-2013 (PJ)
Source: Elaboration by Susdef based on IEA (2015b)
Note: Electricity and heat emissions are reallocated to the end-use sectors. In transport, all the emissions from electricity and heat production are reallocated to rail.
Source: Elaboration by Susdef based on IEA (2015a)
64
Ind
ia

Source: Elaboration by Susdef based on OECD (2016), UIC (2015a) and SYB (2015)
Source: Eleboration by IEA based on UIC (2015a)
Fig. 71: Passenger and freight transport activity - all modes, 2005-2013 (billion pkm and tkm – left, share of rail over total – right)
Fig. 72: Passenger and freight railway activity, 1975-2013
65
Ind
ia

Note: See Methodology Notes p. 109
Source: Elaboration by Susdef based on IEA (2015b)
Source: Elaboration by IEA based on UIC (2015a)
Fig. 73: Length and share of electri�ed and non-electri�ed railway tracks, 1975-2013 (thousand km)
Fig. 74: Railway �nal energy consumption by fuel, 1990-2013 (PJ)
66
Ind
ia

Source: IEA (2015b)
Note: See Methodology Notes p. 109
Source: Elaboration by Susdef based on IEA (2015b)
Fig. 75: National electricity production mix evolution, 1990-2013
Table 12: India railway energy fuel mix, 1990-2013
67
Ind
ia

Note: See Methodology Notes p. 109
Source: Elaboration by IEA and Susdef based on IEA (2016b) and UIC (2015a)
Note: See Methodology Notes p. 109
Source: Elaboration by IEA and Susdef based on IEA (2016b) and UIC (2015a)
Fig. 76: Railway speci�c energy consumption, 2000-2013
Fig. 77: Railway speci�c CO2 emissions, 2000-2013
68
Ind
ia
People’s Republic of China
CO2 emissions from the transport sector increased by a factor 3 between 2000 and 2013, mainly because of the rapid growth of the road transport sector, which CO2 emissions increased from 186 to 611 million tCO2 within the same period.
The rail sector was responsible for 8.2% of transport CO2 emissions and 4.7% of China’s energy use in 2013. In the same year, the contribution of CO2 emissions from rail activity to China’s total transport CO2 emissions amounted to 10.1% for passenger services and 17.2% for freight services.
The share of the rail sector’s CO2 emissions decreased from 37% of total transport CO2 emissions in 1990 to less than 10% in 2013, mainly due to the growth of road transport and the increasing use of electricity in railway operations.
Rail’s �nal energy use was close to 273 PJ in 2013, of which 36% results from oil products and at 64% from electricity. The share of electricity use in the rail sector grew with a factor 3 between 2000 and 2013, with an increasing contribution of renewable electricity sources in the same period (from 3.8% in 2000 to 13.1% in 2013).
With more than 2.5 trillion tonne-km in 2013, China has the highest freight rail activity globally (with nearly a 6-fold increase between 1975 and 2013). Within the same period, passenger rail activity increased with a factor 8 reaching a total of 794 billion passenger-km.
The share of electri�ed tracks in the railway network has increased progressively from 1% in 1975 to 42% in 2013. A rapid development of high-speed lines took place in the past �fteen years: by 2015, China had built about 18 000 km of high-speed lines, while the �rst high-speed line was completed in 2003. Consequently, a rapid increase of high-speed passenger activity has taken place, from 2% of total rail passenger activity in 2009 to 18% in 2013.
Railway speci�c energy consumption dropped by 44% for passenger services and by 52% for freight services between 1990 and 2013.
The passenger carbon intensity has remained fairly stable with a decrease of -7% from 1990 to 2013, while the freight carbon intensity has dropped by -32% in the same period.
Key Facts69
China

Fig. 78: Share of CO2 emissions from fuel combustion by sector, 2013
Table 13: China transport modal share, 2013
Source: Elaboration by Susdef based on UIC (2015a) and CNBS (2014)
Note: Electricity and heat emissions are reallocated to the end-use sectors. In transport, all the emissions from electricity/heat production are reallocated to rail.
Source: Elaboration by Susdef based on IEA (2015a)
70
Chi
na

Fig. 79: Total CO2 emissions from fuel combustion by sector, 1995-2013 (million tCO2)
Fig. 80: Share of �nal energy consumption by sector, 2013
Source: Elaboration by Susdef based on IEA (2015b)
Note: Electricity and heat emissions are reallocated to the end-use sectors.
Source: Elaboration by Susdef based on IEA (2015a)
71
China
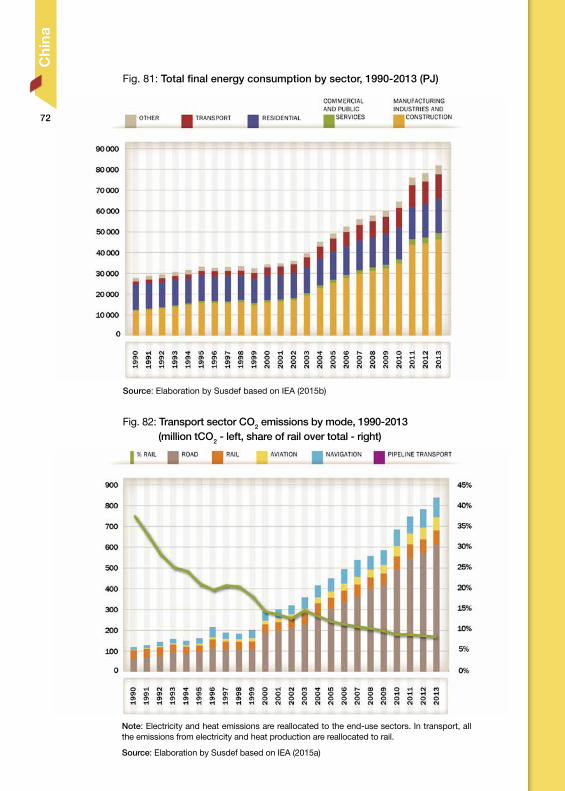
Fig. 81: Total �nal energy consumption by sector, 1990-2013 (PJ)
Fig. 82: Transport sector CO2 emissions by mode, 1990-2013 (million tCO2 - left, share of rail over total - right)
Source: Elaboration by Susdef based on IEA (2015b)
Note: Electricity and heat emissions are reallocated to the end-use sectors. In transport, all the emissions from electricity and heat production are reallocated to rail.
Source: Elaboration by Susdef based on IEA (2015a)
72
Chi
na

Fig. 83: Passenger and freight transport activity - all modes, 1990-2013 (billion pkm and tkm – left, share of rail over total – right)
Fig. 84: Passenger and freight railway activity and High-Speed activity as a share of total passenger railway activity, 1975-2013
Source: Elaboration by Susdef based on UIC (2015a) and CNBS (2014)
Source: Elaboration by IEA based on UIC (2015a)
73
China

Fig. 85: Length and share of electri�ed and non-electri�ed railway tracks, 1975-2013 (thousand km)
Fig. 86: Railway �nal energy consumption by fuel, 2000-2013 (PJ)
Source: Elaboration by IEA based on UIC (2015a)
Note: See Methodology Notes p. 109
Source: Elaboration by Susdef based on IEA (2016b), IEA (2015b) and UIC (2015a)
74
Chi
na

Fig. 87: National electricity production mix evolution, 1990-2013
Table 14: China railway energy fuel mix, 2000-2013
Source: IEA (2015b)
Note: See Methodology Notes p. 109
Source: Elaboration by Susdef based on IEA (2016b), IEA (2015b) and UIC (2015a)
75
China

Fig. 88: Railway speci�c energy consumption, 1990-2013
Fig. 89: Railway speci�c CO2 emissions, 1990-2013
Note: See Methodology Notes p. 109
Source: Elaboration by IEA and Susdef based on IEA (2016b) and UIC (2015a)
Note: See Methodology Notes p. 109
Source: Elaboration by IEA and Susdef based on IEA (2016b) and UIC (2015a)
76
Chi
na


Part II:Focus on
Sustainability Targets

80
The year 2015 has been marked by the historic Paris Agreement. With its Low Carbon Rail Transport Challenge, UIC has committed to reducing speci�c �nal energy consumption per traf�c unit (-50% by 2030 and -60% by 2050) and speci�c average CO2 emissions from train operations (-50% by 2030 and -75% by 2050), relative to a 1990 baseline. The UIC has also set a modal shift target aiming at achieving a 50% increase of the passenger-km share of rail in total passenger transport by 2030 compared to 2010, and a 100% increase by 2050. In the case of rail freight transport, the target is to achieve the same freight activity (in tonne-km) as the road transport sector by 2030, and a 50% higher activity than the road transport sector by 2050.
The rates of improvement of rail energy and CO2 intensity were in line with the 2030 and 2050 targets in 2013 (latest collected data): speci�c energy consumption has reduced by 37% between 1990 and 2013, and speci�c CO2 emissions have reduced by 30% in the same period.
Before taking global commitments, UIC and the Community of European Railways and Infrastructure Companies (CER) had already rati�ed targets for the improvement of energy and CO2 performance in the European railway sector by 2020, 2030 and 2050. Additionally, in order to improve the accounting for CO2 emissions relative to the procurement of renewable electricity by railway operators, the UIC has adopted in 2014 the “dual reporting approach” (market-based and location-based) recommended by the GHG Protocol Scope1.
The UIC-CER set targets for European Railways: 30% speci�c CO2 emission reduction by 2020 compared to a 1990 baseline. Additionally, by 2030 the speci�c CO2 emissions from train operations have to be reduced by 50% compared to base year 1990. By 2030, the European railways also aim to keep their total CO2 emission from train operations stable compared to base year 1990, taking into account a projected traf�c increase. Targets on energy ef�ciency have to be achieved by 2030 and 2050, respectively -30% and -50% of speci�c energy consumption.
FOCUS
Key Facts
1 GHG Protocol Scope 2 Guidance, carried out by the World Resources Institute, seeks to develop a globally accepted GHG accounting and reporting standard (WRI 2015). The dual reporting approach includes a physical approach and a market approach. Physical approach: using CO2 emission factors based on the physical �ows of electricity between the point of generation and consumption (location based). Market approach: physical emission factors are adjusted to re�ect the purchase of renewable energy by consumers, including certi�cates and guarantees of origin (market based).
Sus
tain
abili
ty T
arge
ts
81
The monitoring of CO2 emissions carried out by the UIC ESRS (Environmental Strategy Reporting System) highlights that the performance of European railway companies were in line with the above-mentioned targets for 2020, 2030 and 2050. Considering the market-based approach, railways have already achieved the 2020 target for speci�c CO2 emissions. The target for total CO2 emissions were already achieved in 2006 considering both the location-based and market-based approaches; the absolute targets of emissions have to be more prudential since they must take future increases of railways activity into account.
Comparing CO2 emissions, energy consumptions and corresponding targets with the estimated ETP 2DS trends emerges as the UIC target are more conservative also in this case. UIC targets were set according to expected forecasts of EU members and ETP 2DS are projections for the best case on policies and technologies implementation on mitigation to climate change
The share of renewable energy used by the European railway sector is higher than the renewable energy share of all European end-use sectors taken together. European railways have already achieved the EU Climate Package target of using 20% renewable energy in 2011by 2020. Electri�cation and green procurement played a key role in achieving this target.
In parallel to the targets set for the rail sector as a whole, a number of railway companies are showing initiative by setting their own energy and sustainability goals.
Railways are currently more energy and CO2 ef�cient per traf�c unit than most other transport modes. Railways will likely remain among the most sustainable transport modes in 2030, even when sustainability commitments from stakeholders operating in other transport modes are accounted for.
The Energy Technology Perspectives 2016 publication (IEA, 2016a) suggests that a large increase in the share of high-speed rail in total transport activity is required to achieve the "2-degree scenario" (2DS), as this would reduce the average carbon intensity of long distance passenger transport.
In the context of the COP21 event held in Paris in 2015, 75% of the World's countries has established strategies and targets to improve the environmental performance of their transport sector within their Intended Nationally Determined Contributions (INDCs). One-�fth of the transport-related INDCs include measures in the railway sector.
Sustainability Targets

82
At the UN Climate Summit in September 2014, UIC presented the Low Carbon Rail Transport Challenge. This initiative sets out a vision for the developments of the railway sector at the global level as a sustainable alternative to other modes of transportation that are more carbon intensive such as road transport and aviation. The challenge includes three sets of voluntary targets: to improve rail ef�ciency, to decarbonise electricity supply, and to achieve a more sustainable balance of transport modes.
UIC is committed to reducing speci�c �nal energy consumption per traf�c unit (50% by 2030 and 60% by 2050) and speci�c average CO2 emissions per traf�c units from train operations (50% by 2030 and 75% by 2050), all relative to a 1990 baseline. In order to reach these goals, railway operators are investing in electrifying trains, improving load factors, procuring more ef�cient rolling stock, developing more ef�cient energy and traf�c management systems, and promoting ef�cient driving.
In 2015, UIC has also launched the Modal Shift Challenge calling for investments that encourage a shifting towards rail transport and away from more carbon intensive transport options (UN, 2014b). The goal of this action is to achieve a 50% increase in the share of rail in passenger transport (measured in passenger-km) by 2030 compared to 2010, followed by a 100% increase by 2050. For land-based freight transport, the target is to achieve the same level of rail activity (in tonne-km) as the road transport sector (mainly represented by trucks) by 2030, achieving a share that is 50% greater than 2010 levels by 2050.
One key component of the Modal Shift Challenge is the Railway Climate Responsibility Pledge, which sets out industry actions to complement the targets set for railways world-wide. During the 2015 Train to Paris event, a programme focused on raising awareness to the role rail can play in the overcoming the climate challenge, this pledge was presented to high level representatives of the United Nations. The Climate Responsibility pledge was well received, having been signed by more than 60 UIC members, representing the majority of global rail activity.
The UIC Low Carbon Rail Transport Challenge and the UIC Climate Responsibility Pledge
Sus
tain
abili
ty T
arge
ts

83
Fig. 90: World speci�c rail energy consumption evolution per traf�c unit (TU) between 1990-2013 compared to 2030 and 2050 targets (1990=100)
Fig. 91: World speci�c rail CO2 emissions evolution per traf�c unit (TU) between 1990 and 2013 compared to 2030 and 2050 targets (1990=100)
Source: Elaboration by SUSDEF based on IEA (2016b), UIC (2015a) and UIC (2015d)
Note: See Methodology Notes p. 109; the IEA 2 Degree Scenario, or 2DS, describes an energy system consistent with an emissions trajectory with a 50% chance of limiting average global temperature increase to 2°C.
Source: Elaboration by SUSDEF based on IEA (2016b), UIC (2015a) and UIC (2015d)
Note: See Methodology Notes p. 109; the IEA 2 Degree Scenario, or 2DS, describes an energy system consistent with an emissions trajectory with a 50% chance of limiting average global temperature increase to 2°C.
Sustainability Targets

8484
Sus
tain
abili
ty T
arge
ts
Railway Climate Responsibility Pledge
On the low carbon track
The worldwide railway community is aware that a shift towards sustainable transport is essential to achieve the internationally agreed goal of limiting climate change to a rise in average global temperature of no more than 2 degrees Celsius. The rail sector is the most emissions efficient transport mode, but as a major transport mode we acknowledge our responsibility and that further improvement is needed. This pledge sets out ambitious but achievable goals for the sectors contribution towards the solution to climate change. As a member of the worldwide community of railway operators and infrastructure managers, I commit to take a leading role in the actions to prevent climate change, by reducing my company’s carbon footprint and supporting a shift towards a more sustainable balance of transport modes. In order to achieve this, I pledge to: 1. reduce my company’s specific energy consumption and CO2 emission, and through this contribute to the UIC
“Low Carbon Rail Transport Challenge” and its global 2030/2050 targets, presented in 2014 at the UN Climate Summit;
2. stimulate modal shift to rail in national and international markets, by working in partnership with key
stakeholders; 3. actively communicate climate friendly initiatives undertaken by my company during the year 2016 and
beyond, in order to raise awareness, acceptance and recognition of the role of sustainable transport as a part of the solution to climate change;
4. report data on my company’s specific energy consumption and CO2 emissions to UIC on a regular basis, in
order to promote and demonstrate the continuous improvement of railway sector at international level. .....................................................................................................
Place, date
..................................................................................................... Signature
.....................................................................................................
First name, family name, title of signee

85
Case Study
Reducing the carbon footprintin the Dutch railway sector
Achieving the ambitious targets set out by the Low Carbon Rail Transport Challenge requires the commitment of each railway operator to improve its energy ef�ciency, reducing its environmental impact by mitigating their CO2 emissions.
In 2015 the Dutch Minister of Transport and the Dutch National Railways took a decisive �rst step by signing into law CO2-vision 2050, a plan which sets targets aimed at reducing the company’s carbon footprint (NS, 2015).
This plan is in line with the following UIC Challenge Targets:
• Full CO2 neutral railway sector (CO2 emissions from energy and materials) by 2050
• Improve energy ef�ciency by 35% by 2030 and 40% by 2050 compared to 2013
• Reduce emissions by supporting modal shift from other modes of transport to rail.
Signature of the Dutch Carbon Vision 2050 for railways by representatives of the Dutch Government, ProRail and NS (photo © Dutch Government)
Sustainability Targets

86
The UIC-CER Commitment at European Level
The EU emphasized the importance of setting medium and long term targets for the reduction of CO2 emissions (EU, 2007). The railway sector is in a position of competitive advantage in regards to carbon intensity compared to other transport modes. Nonetheless, the sector will continue its efforts of reducing CO2 emissions in the future.
In 2008 the Community of European Railway and Infrastructure Companies (CER) agreed on a CO2 reduction target for the European railway sector. The approved targets were a 30% speci�c CO2 emission reduction by 2020 compared to a 1990 baseline and a 50% reduction of speci�c CO2 emissions from train operations by 2030 compared to 1990. Additionally, the European railways aim to keep their total CO2 emission from train operations at the level of 1990, counterbalancing the effect of projected traf�c increase (UIC and CER, 2010).
The UIC Environmental Strategy Reporting System (ESRS) has been created as a comprehensive instrument which allows the overall procedure of data collection, analysis, reporting, tracking of indicators, and data sharing to be structured in a clear and transparent way. Today, it is the main instrument used to monitor the environmental performance of the European railway sector in achieving the four target goals set by the UIC/CER Sustainable Mobility Strategy 2030 (UIC, 2015c).
Table 15: UIC-CER Railway sector targets overview at European level
Source: UIC (2015c)
Sus
tain
abili
ty T
arge
ts

87
The next step for increasing the reliability of the UIC Environment Strategy Reporting System (ESRS) is to de�ne a transparent methodology for monitoring the purchase of green electricity (electricity produced void of net CO2 emissions) by railway companies. Operating electri�ed rolling stock on green electricity is one of the key factors in reducing CO2 emissions in the rail sector. The Zero Carbon Project was developed in this context and allows the reporting of Guarantees of Origin (GOs) according to the GHG Protocol guidelines within the UIC Environmental Strategy, to reduce CO2 emissions with targets for 2030 and a vision for carbon-free rail by 2050.
Following the UIC Zero-Carbon Project, the UIC ESRS adopted the Dual Reporting Approach a methodology employed to most accurately represent both the movement and purchase of green electricity.
In this framework, CO2 reporting is conducted according to two complementary approaches:
• The physical approach: using CO2 emission factors based on the physical �ows of electricity between the point of generation and consumption (location based).
• The market approach: physical emission factors are adjusted to re�ect the purchase of renewable energy by consumers, including certi�cates and guarantees of origin (market based).
This approach follows the Greenhouse Gas (GHG) Protocol (Scope 2 Guidance) developed by the World Resources Institute (WRI) and the World Business Council for Sustainable Development (WBCSD) (WRI, 2015).
Sustainability Targets

88
Fig. 92: UIC-Europe Railways speci�c energy consumption evolution (passenger and freight services) between 1990 and, 2013, compared to UIC-CER 2030 and 2050 targets at EU level
Table 16: Environmental Strategy Reporting System (ESRS) data monitoring dashboard - Speci�c passenger and freight energy consumption
Source: Elaboration by SUSDEF based on UIC (2015b) and IEA (2016b)
Note: See Methodology Notes p. 109; the IEA 2 Degree Scenario, or 2DS, describes an energy system consistent with an emissions trajectory with a 50% chance of limiting average global temperature increase to 2°C.
Source: UIC (2015b)
Note: the linear expected performance is the overall performance that was necessary to achieve between 1990 and 2013 in order to be on track to achieving the 2030 target, when assuming a linear improvement between 1990 and the 2030 target. This indicator is used for comparison purposes with the real performance number, showing historical improvements.
Sus
tain
abili
ty T
arge
ts

89
Fig. 93: UIC-Europe Railways speci�c CO2 emissions evolution (passenger and freight services) between 1990 and 2013, compared to UIC-CER 2030 and 2050 targets at EU level (including dual reporting)
Table 17: Environmental Strategy Reporting System (ESRS) data monitoring dashboard - Speci�c passenger and freight CO2 emissions
Source: Elaboration by SUSDEF based on UIC (2015b) and IEA (2016b)
Note: See Methodology Notes p. 109; the IEA 2 Degree Scenario, or 2DS, describes an energy system consistent with an emissions trajectory with a 50% chance of limiting average global temperature increase to 2°C.
Source: UIC (2015b)
Note: the linear expected performance is the overall performance that was necessary to achieve between 1990 and 2013 in order to be on track to achieving the 2030 target, when assuming a linear improvement between 1990 and the 2030 target. This indicator is used for comparison purposes with the real performance number, showing historical improvements.
Sustainability Targets

90
Fig. 94: UIC-Europe Railways total CO2 emissions evolution (including dual reporting) between 1990 and 2013 compared to EU targets and UIC Strategy 2030 and 2050 target (1990=100)
Table 18: Environmental Strategy Reporting System (ESRS) data monitoring dashboard - Total CO2 emissions
Source: Elaboration by SUSDEF based on UIC (2015b), EU (2008) and EU (2014)
Note: The EU Climate Package and the EU Energy Strategy set targets for the transport sector as a whole. This includes the railway sector.
Source: UIC (2015b)
Note: the linear expected performance is the overall performance that was necessary to achieve between 1990 and 2013 in order to be on track to achieving the 2030 target, when assuming a linear improvement between 1990 and the 2030 target. This indicator is used for comparison purposes with the real performance number, showing historical improvements.
Sus
tain
abili
ty T
arge
ts

91
Fig. 95: Share of renewable energy consumption of all European sectors and the EU railway sector (according to the market based approach) compared to EU targets
Source: Elaboration by SUSDEF based on UIC (2015b) and EUROSTAT (2016)
Note: EU All sectors describes the trend of the share of renewable energy in the EU’s gross �nal energy consumption. According to the EC 2009/28/EC directive, gross �nal energy consumption refers to the energy commodities delivered for energy purposes to industry, transport, households, services including public services, agriculture, forestry and �sheries, including the consumption of electricity and heat by the energy branch for electricity and heat production and including losses of electricity and heat in distribution and transmission. EU Railways describes the trend of the share of renewable energy (according to the market-based approach) in the European Railway sector.
Sustainability Targets
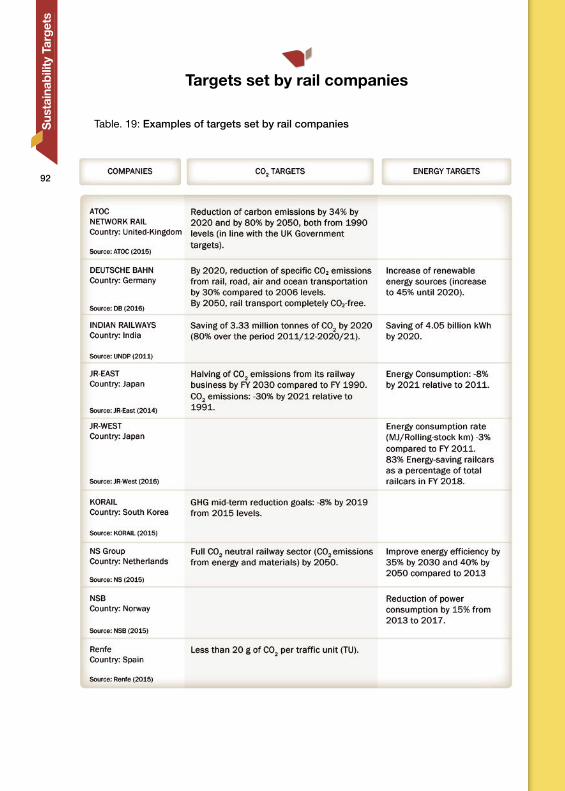
92
Targets set by rail companies
Table. 19: Examples of targets set by rail companies Sus
tain
abili
ty T
arge
ts
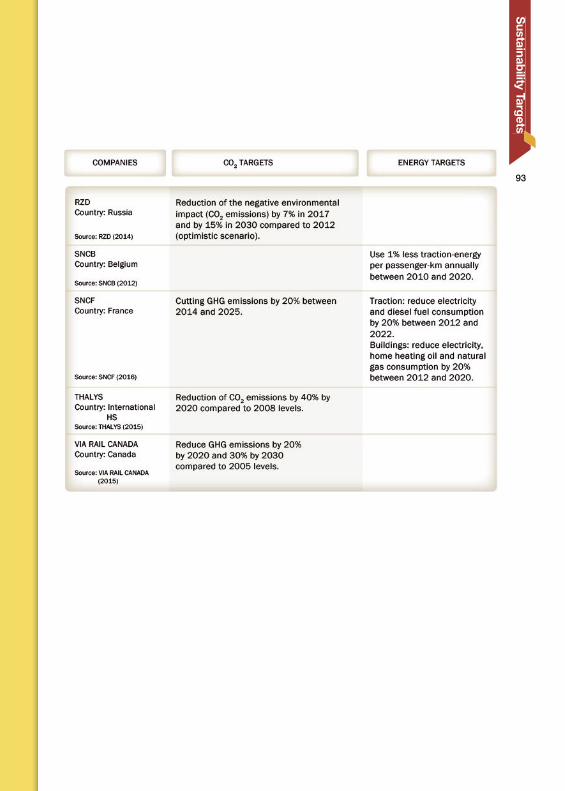
93
Sustainability Targets
94
Targets set by rail, road, maritime, and aviation transport sectors
This section evaluates CO2 reduction targets for different modes of transport. The characteristics and types of targets are different in nature and, in most cases, they cannot be directly compared.
• Existing regulations on the fuel economy of passenger cars, light commercial vehicles, and trucks take into account the average performance of new vehicle registrations. Currently, the vehicle’s CO2 emissions and energy consumption are determined through laboratory tests relying on a standardized driving cycle and the use of metrics that relate energy consumption or CO2 emissions to vehicle km. Targets aiming to reduce CO2 emissions/km for new vehicle registrations have been adopted in most car markets, affecting roughly three vehicles sold out of four. Compared to 2014, the US and the EU require annual reductions of speci�c CO2 emissions/km of passenger cars of 4.1% and 3.8%, respectively, until 2025 and 2021 (ICCT, 2016; EU, 2014b; EEA, 2016). The annual improvement rate required in China to meet 2020 regulatory targets since the 2014 baseline equals 5.9% per year (ICCT, 2016).
• Regulations developed in maritime transport (via the Energy Ef�ciency Design Index implemented by the International Maritime Organization) target new vehicle registrations since 2015, requiring a minimum energy ef�ciency level for different ship type and size segments. This uses a metric that accounts for changes in carrying capacity. The 30% improvement required for new ships by 2025 (against the baseline of ships built between 2000 and 2010), compared to the 10% needed in 2015, translates into an annual energy ef�ciency improvement of around 2.5% for new ships entering the �eet between 2015 and 2025 (IMO, 2011).
• The railway sector set CO2 emission mitigation targets focusing on the energy and carbon intensity of their operational performance (and in some company cases to their rolling vehicle stock rather than new registrations). The metric adopted in this case links energy use or GHG emissions with activity parameters that also embed loads or occupancy rates (e.g. transport unit, passenger km and tonne km, rather than vehicle km). The global UIC rail target set a reduction of speci�c CO2 emissions of 75% between 1990 and 2050 (UIC, 2014). Given the improvements achieved to the latest available year (2013), this means that speci�c CO2 emissions per transport unit need to decline by 1.2% per year until 2050. In addition, UIC and CER set two targets for the European sector: one for the passenger rail sector and one for the freight rail sector, requiring each sector to reduce its speci�c CO2 emissions (per pkm and tkm, respectively) with 50% between 1990 and 2030 (UIC and CER, 2010). For the passenger sector, improvements achieved until 2013 require a rate of reduction for speci�c CO2 emissions between 2013 and 2030 of 1.4%. For freight rail, the 2030 target was already very close to be achieved in 2013.
Sus
tain
abili
ty T
arge
ts

95
• The aviation sector set its own aspirational goals looking directly at the GHG emission envelope of the sector: stabilization of GHG emissions by 2020 (or carbon-neutral growth), and halving by 2050 compared to 2005 (UN, 2014a and ATAG, 2016). Several contributions are expected to be needed to meet these goals: energy ef�ciency improvements derived from technology developments, lower carbon intensity of energy carriers attributed to to fuel switching, energy savings derived from operational improvements (such as the increase in load factors), and GHG emission reductions derived from carbon offsets in other sectors thanks to market based mechanisms. In addition to this, the International Civil Aviation Organization (ICAO) has also introduced an aspirational goal to improve energy ef�ciency by 2% per year until 2050, speci�cally looking at operational and technical improvements (ICAO, 2010 and ICAO, 2013). The metric for this target is relating to the volume of fuel used per revenue tonne km. The aviation sector is also developing a regulation imposing binding energy ef�ciency and CO2 reduction targets for the aviation sector.
Figures 96 and 97 show the estimated CO2 emissions for all modes of transport by 2030 compared to historical �gures from, 2010, suggesting that rail will remain the transport mode with the lowest carbon intensity in 2030.
Sustainability Targets
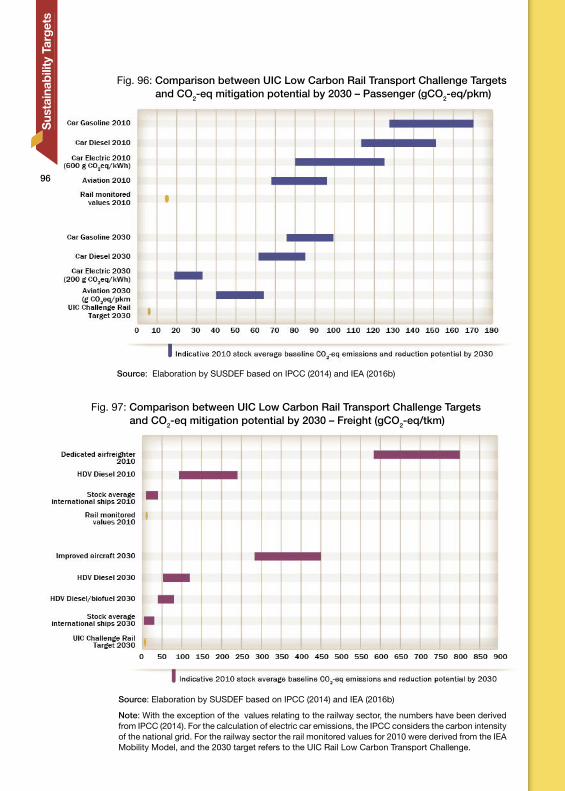
96
Fig. 96: Comparison between UIC Low Carbon Rail Transport Challenge Targets and CO2-eq mitigation potential by 2030 – Passenger (gCO2-eq/pkm)
Source: Elaboration by SUSDEF based on IPCC (2014) and IEA (2016b)
Fig. 97: Comparison between UIC Low Carbon Rail Transport Challenge Targets and CO2-eq mitigation potential by 2030 – Freight (gCO2-eq/tkm)
Source: Elaboration by SUSDEF based on IPCC (2014) and IEA (2016b)
Note: With the exception of the values relating to the railway sector, the numbers have been derived from IPCC (2014). For the calculation of electric car emissions, the IPCC considers the carbon intensity of the national grid. For the railway sector the rail monitored values for 2010 were derived from the IEA Mobility Model, and the 2030 target refers to the UIC Rail Low Carbon Transport Challenge.
Sus
tain
abili
ty T
arge
ts

97
Fig. 98: Current Well-to-Wheel GHG intensities of passenger and freight transport activity, 2015
Source: IEA (2016a)
Sustainability Targets

98
Focus on regulatory policies targeting passenger carsand light commercial vehicles
Fuel economy standards play a signi�cant role in national fuel ef�ciency policies. When properly implemented, fuel ef�ciency legislation can effectively reduce the energy use and GHG emissions of road transport vehicles, having even broader impacts in countries with booming car and truck markets. Long lasting and consistent fuel economy standards have the capacity to have sizeable impacts on the reduction of fossil energy use, even in the presence of rebound effects, such as the increase of the average mileage due to lower costs per km travelled. In the last decade, several governments have established or proposed ef�ciency standards for light-duty vehicles, including passenger cars, light trucks (a de�nition used in North America for large passenger cars, such as Sport Utility Vehicles and pick-ups) and light commercial vehicles. Fuel economy standards for cars are now in place for about three quarters of new registrations of passenger cars (GFEI, 2015) and nearly half of those of new trucks (IEA, 2016b).
Selected examples of regulatory developments, focusing on the major global economies, are provided below (GFEI, 2016):
• Fuel economy regulations for passenger cars were �rst introduced in China in 2005. During Phase I and Phase II, individual models were required to meet speci�c thresholds, which were differentiated on the basis of vehicle weight. Corporate average fuel consumption targets were established with the introduction of Phase III (2012-15). Phase IV, which took effect on January 1st 2016, targets an average speci�c fuel consumption for new car sales of 5.0 L/100 km by 2020 (based on the NEDC) (TransportPolicy, 2016).
• Voluntary CO2 emission standards were �rst introduced in the European Union in 1998, and they became mandatory in 2009. The 2015 target of 130 g CO2/km for passenger cars was met in advance in the case of France (EEA, 2015). By 2021, CO2 emissions of passenger cars should reach 95 g CO2/km (based on NEDC), and those of LCVs are required to attain 147 g CO2/km (based on NEDC) (TransportPolicy, 2016).
• In January 2014, the Indian government enacted a regulation on the CO2 intensity of new cars taking effect in April 2016 (TransportPolicy, 2016). The regulation establishes a �eet target of 130 g CO2/km for 2016, which will go down to 113 g CO2/km in 2021 (based on NEDC) (TransportPolicy, 2016).
• Fuel economy standards have a long history in Japan. The �rst regulation was put in place in 1979, and applied �rst to 1985 vehicles. The Top Runner Program, introduced in 1999, required all vehicles in a given weight class to exceed the fuel economy of the best performing model within three to ten years (TransportPolicy, 2016). Fuel economy labelling has also been mandatory since the year 2000 (ICCT, 2015). Japanese fuel economy standards have resulted in ambitious improvement targets in the past. Recent regulatory targets (for 2020) are less aggressive than in Europe, despite the fact that average national new sales fuel economies in Europe and Japan in 2013 were similar in magnitude.
Sus
tain
abili
ty T
arge
ts

99
Fig. 99: Fuel consumption and CO2 reduction (g CO2/vkm) targets for passenger cars
Source: ICCT (2016)
• Fuel economy regulations were �rst established in the United States 1970s. The Corporate Average Fuel Economy (CAFE) standards were introduced in 1975. Fuel economy labelling of new cars was introduced as early as 1978 (ICCT, 2015). Even if the United States pioneered their introduction, the historical evolution of regulatory limits underwent distinct phases, including decades (late 1980s, 1990s and early 2000s) of stagnation. This resulted in deteriorating fuel economy due to a market shift towards larger vehicles. In 2009, the stringency of fuel economy improvements for models entering the market between 2012 and 2016 was strengthened considerably. Compared to 2009, by 2016 average CO2 emissions per km must be reduced by 26% (of about 4.2% per year). Targets were extended to 2025 and will require a 35% reduction of the average fuel use per km from 2016 (TransportPolicy, 2016).
Figure 99 provides a summary of emission trajectories and proposed regulatory targets for passenger cars in selected countries and global regions.
Sustainability Targets

100Fig. 100: Shares of passenger rail activity by scenario
Source: IEA (2016b)
Note: The IEA 2 Degree Scenario, or 2DS, describes an energy system consistent with an emissions trajectory with a 50% chance of limiting average global temperature increase to 2°C. The IEA 4 Degree Scenario takes into account recent pledges by countries to limit emissions and improve energy ef�ciency, which help limit the long-term temperature increase to 4°C. The 6DS is largely an extension of current trend. In this scenario the average global temperature rise above pre-industrial levels is projected to reach almost 5.5°C in the long term and almost 4°C by the end of this century.
Current performance and planned evolution in railway activity shares, in speci�c energy consumptions and CO2
emissions by sector, according to IEA ETP 2016
Sus
tain
abili
ty T
arge
ts

101
Fig. 101: Speci�c energy intensity for different modes of transport according to the 4 Degree (top) and 2 Degree (bottom) scenario, (kJ/TU)
Source: Elaboration by SUSDEF based on IEA (2016b)
Note: The IEA 2 Degree Scenario, or 2DS, describes an energy system consistent with an emissions trajectory with a 50% chance of limiting average global temperature increase to 2°C. The IEA 4 Degree Scenario takes into account recent pledges by countries to limit emissions and improve energy ef�ciency, which help limit the long-term temperature increase to 4°C.
Sustainability Targets

102
Fig. 102: Speci�c CO2-eq intensity for different modes of transport according to the 4 Degree (top) and 2 Degree (bottom) scenario, (gCO2-eq/TU)
Source: Elaboration by SUSDEF based on IEA (2016a)
Note: The IEA 2 Degree Scenario, or 2DS, describes an energy system consistent with an emissions trajectory with a 50% chance of limiting average global temperature increase to 2°C. The IEA 4 Degree Scenario takes into account recent pledges by countries to limit emissions and improve energy ef�ciency, which help limit the long-term temperature increase to 4°C.
Sus
tain
abili
ty T
arge
ts

103
Comparison to (I)NDCs targets
Intended Nationally Determined Contributions (INDCs) is a term used under the United Nations Framework Convention on Climate Change (UNFCCC) which refers to the actions that a national government intends to take under the Paris Agreement, which was adopted in December 2015 at the 21st session of the Conference of the Parties (COP21). Since the Nationally Determined Contributions are no longer considered “Intended” at the moment a Party joins the Paris Agreement, it is considered appropriate to use the acronym of (I)NDC, in order to avoid any misunderstanding between intended and approved. These actions together pursue to limit the average global temperature increase to 2°C. A detailed review by the Sustainable Low Carbon Transport Partnership (SLOCAT) of 160 (I)NDCs indicates that about 75% of (I)NDCs have proposed transport sector as a mitigation source and about 67% of (I)NDCs have highlighted speci�c transport mitigation measure (SLOCAT, 2016). However, only about 19% of (I)NDCs aim for an improvement of the railway sector. About 32 (I)NDCs prioritize improvements regarding the railway sector as a signi�cant emission mitigation measure. These (I)NDCs mostly focus on proposals concerning a shift of transport activity from other transport modes to low carbon rail transport, improving energy ef�ciency of railway operations, and reducing speci�c CO2 emissions from train operations (SLOCAT, 2016).
Figure 103 shows all countries that have included mitigation measures related to the railway sector in their (I)NDCs, with some detailed examples in Table 20.
Sustainability Targets

104
Fig. 103: Map of countries that include rail projects in their (I)NDCs and targets related
Source: Elaboration by SUSDEF based on UNFCC (2015) and SLOCAT (2016)
Sus
tain
abili
ty T
arge
ts

105
Table 20: Examples in rail-speci�c (I)NDC measures in a selection of countries
Sustainability Targets

106
Table 21: (I)NDCs target for total CO2 emissions
Source: Elaboration by SUSDEF based on UNFCCC (2015)
Source: Elaboration by SUSDEF based on UNFCC (2015) and SLOCAT (2016)
Sus
tain
abili
ty T
arge
ts

107
Actions and technologies supporting future improvements in the railway sector
Energy ef�ciency improvement is one of the main objectives of railways companies in the context of achieving their environmental and operational objectives.
Improvement efforts in the railway sector can be divided into four primary categories:
Area 1 - Measures related to the design of the infrastructure, installations, and rolling stock
• Ef�cient infrastructure reducing braking in locomotives, leading to a reduction of energy lossesExample: constructing an upward gradient at the entrance of a station has been proven to result in a savings of 5% in energy consumption from friction and 23% in energy consumption from braking (Shu-Ta Yeh, 2003).
• New train design to reduce drag resistanceExample: a 25% aerodynamic drag reduction leads to a 15% reduction in energy consumption (Turner, 2013).
• Introducing of new materials for light-weight rolling stockExample: composite materials may reduce energy consumption by 5% (REFRESCO Project, 2016).
• Use of renewable energy sources to supply non-operational energy needs (stations, etc.)
Area 2 - Power traction
• Electri�cation of railway lines to replace diesel tractionExample: rail electri�cation could reduce energy consumption by 19-33% (Network Rail, 2009).
• Deployment of new technologies reducing losses in the traction chainExamples:
○ an AC asynchronous traction motor with Insulated Gate Bipolar Transistor (IGBT) inverters may reduce the energy consumption by 15% (UIC, 2003).
○ the inclusion of reversible substations in the power supply system, mainly in DC electricity lines, will allow the recovery of the kinetic energy lost in braking, leading to energy savings between 7% and 15% (Zamora D. 2011).
• Acquisition of new rolling stock using alternative fuels (such as liquid gas or hydrogen fuel cells)
Sustainability Targets
108
Area 3 - Technologies that allow energy savings in ancillary systems
• On-board ancillary systemsExamples: Heating, Ventilating and Air Conditioning (HVAC) technologies or new lighting systems
• Infrastructure’s ancillary systemExample: new ef�cient point heaters with improved insulations and regulation have yielded average energy savings of 30% compared to conventional point heaters (Eltherm GmbH, 2016).
Area 4 - Smart Energy Management
• Improved operational proceduresExample: increasing the load factor can lead to reductions in the speci�c energy consumption (kWh/pkm). (García Álvarez and Lukaszewicz, 2010) suggest a range of reduction between 15% and 17%.
• Energy ef�cient drivingExample: eco-driving systems or knowledge and experience sharing between drivers can cut energy consumption to 25% (B-Logistics, 2016).
• Introduction of Energy Storage Systems in the power networkExample: improved energy management may lead to a reduction in energy use between 10% and 30%, with a substantial reduction in power peaks (50%) (Steiner, 2006); smart grid technologies have the capacity to reduce power peaks in speci�c network locations and demonstrated the ability to reduce energy use by 11% (MERLIN Project, 2015).
Sus
tain
abili
ty T
arge
ts

Methodology Notes
Railway speci�c energy consumption (�g. 15, 28, 40, 52, 64, 76) and speci�c CO2 emissions (�g. 16, 29, 41, 53, 65, 77) – indicators building
Railway speci�c energy consumption and speci�c CO2 emissions are mainly based on UIC data. The railway companies provide UIC with their tractive stock’s total energy consumption split by electric/diesel and passenger/freight activity. These total energy consumptions are combined with pkm and tkm data (allocated to diesel and electricity according to the repartition of passenger and freight train-km), allowing the calculation of energy intensities for passenger and freight activity where company data are available. When railway companies do not report any energy consumption to UIC, speci�c energy consumption is estimated using three representative classes of energy intensities: with a low, middle and high energy intensity range approximating the range of values observed for countries where data are reported. One of these three classes is then allocated to countries or regions with insuf�cient data. The selection of the energy intensity class adopted for speci�c country level estimates is based on an attempt to minimize inconsistencies with the rail energy consumption reported in the IEA World Energy Balances. This approach can lead to limited inconsistencies with total energy consumption and CO2 emissions in rail, as the latter use the IEA World Energy Balances as a source.For a selection of countries/regions – EU, India, Japan, Russia, USA – energy intensities are also calibrated by accounting for additional information (on energy use and related activity) provided by major rail transport operators to UIC on a bilateral basis. Energy intensities are combined with direct CO2 emissions from fuel combustion (tank-to-wheel CO2 emissions) and CO2 emissions resulting from the production and transformation of fuels and electricity (well-to-tank CO2 emissions) to evaluate CO2 emission intensities. The emission factors used for this purpose are taken from the IEA Mobility Model.
Railway speci�c energy consumption and speci�c CO2 emissions – consistency improvement
In some cases, �gures showing speci�c energy consumption and speci�c CO2 emissions differ from the �gures in previous Railway Handbook editions. IEA and UIC continue to work together to improve energy and emissions statistics with respect to data reported by UIC members, including speci�c energy and emissions data for rail tractive stock. From the 2015 edition of the Handbook, pkm and tkm data have been systematically derived from train-km and the corresponding load factors, improving the internal consistency of the data. In addition, energy intensity estimates for passenger
109

rail services bene�tted from the revision of speci�c energy consumption per train-km (see methodology note on railway speci�c energy consumption and speci�c CO2 emissions).
Railway energy fuel mix (Fig 13, 25, 38, 50, 62, 74, 86; Table 2, 4, 6, 8, 10, 12, 14)
The railway energy fuel mix has been calculated. The railway energy fuel mix indicates in what proportion different energy sources are being used for rail traction. By applying the electricity mix of the respective country or region to the portion of electric energy used, it is possible to obtain the energy fuel mix shown. In this edition the railway fuel mix is also aggregated by type of source (fossil, renewable, nuclear).
Speci�c world rail energy consumption (�g. 90) and CO2 emissions (�g. 91) evolution per traf�c unit (TU) between 1990 and 2013 compared to 2030 and 2050 targets
The dataset used for these graphs is a combination of data from the IEA Mobility Model and other sources - mainly UIC Statistics which presents data directly obtained from railway operators (this covered 91% of global energy consumption and 86% of the total world CO2 emissions by railways in 2013)
Scope of data
The IEA/UIC Railway Handbook intends to provide a global overview of the rail sector, including key world regions. A large amount of effort is dedicated to compile and align different data sources, in order to include the most detailed and accurate indicators possible to the publication. However, the scope and level of detail may vary from one data source to the other. In particular, it should be noted that:
• rail energy use and CO2 emissions data taken from IEA Statistics (sources referred to as "IEA, 2015a" and "IEA, 2015b") cover all national rail operations, including high-speed, intercity, suburban and urban rail services.
• rail activity, energy use and network extension data are taken from the UIC International Railway statistics publication, the Environmental Performance Database (sources referred to as "UIC, 2015a" and "UIC, 2015b") and bilateral communications between the UIC and rail transport operators. Activity data available in the UIC International Railway Statistics include primarily high-speed and intercity rail services. Suburban or urban rail services are excluded, unless companies also operating long-distance rail services include in their data submission to UIC. In order to align to the UIC International Railway Statistics as closely as possible, suburban and urban rail services are excluded, to the extent possible, from the results reported for the EU, Japan, India, Russia and the USA. That is, those regions where additional data on activity and energy use have been bilaterally collected by UIC (see also the methodology note on "Railway speci�c energy consumption and speci�c CO2 emissions - indicators building"). In future editions, the IEA and the UIC are going to continue to work closely to keep improving the scoping and quality of the data presented in the Railway Handbook.
110

Glossary
Electri�ed trackTrack provided with an overhead catenary or a conductor rail to permit electric traction..
Electri�ed lineLine with one or more electri�ed running tracks.
Energy consumption by rail transportFinal energy consumed by tractive vehicles for traction, train services and facilities (heating, air conditioning, lighting etc.).
Gross tonne-kilometre hauledUnit of measurement representing the movement over a distance of one kilometre of one tonne of hauled vehicles (and railcars) and contents.
Passenger-kilometre (pkm)Unit of measurement representing the transport of one passenger over a distance of one kilometre.
Tractive StockIncludes locomotives and self-propelled carriages using electricity or diesel (EMU-Electric Multiple Units and DMU-Diesel Multiple Units).
Train-kilometreUnit of measurement representing the movement of a train over one kilometre.
Traf�c Unit (TU) The sum of passenger kilometre and tonne kilometre.
Joule (J)Unit of measurement of energy consumption.Kilojoule: 1 kJ = 1 000 JMegajoule: 1 MJ = 1 x 10⁶ JGigajoule: 1 GJ = 1 x 10⁹ JTerajoule: 1 TJ = 1 x 10¹² JPetajoule: 1 PJ = 1 x 10¹⁵ J
Tonne of oil equivalent (TOE)Unit of measurement of energy consumption: 1 TOE = 41.868 GJ
111

CERCommunity of European Railway and Infrastructure Companies (CER) is the association representing the interests of European Railways Operators and Railways Infrastructure Companies in Brussels. CER Members covers 73% of the European rail network length, 80% of the European rail freight business and 96% of rail passenger operations in Europe.
EU Climate Package and EU Climate StrategyThe 2020 package is a set of binding legislation to ensure the EU meets its climate and energy targets for the year 2020. The package sets three key targets: 20% cut in greenhouse gas emissions (from 1990 levels), 20% of EU energy from renewables, 20% improvement in energy ef�ciency. The targets were set by EU leaders in 2007 and enacted in legislation in 2009. The 2030 climate and energy framework sets three key targets for the year 2030: At least 40% cuts in greenhouse gas emissions (from 1990 levels), at least 27% share for renewable energy, at least 27% improvement in energy ef�ciency. The framework was adopted by EU leaders in October 2014. It builds on the 2020 climate and energy package.
ICAOThe International Civil Aviation Organization (ICAO) is a UN specialized agency, established by States in 1944 to manage the administration and governance of the Convention on International Civil Aviation (Chicago Convention). ICAO works with the Convention’s 191 Member States and industry groups to reach consensus on international civil aviation Standards and Recommended Practices (SARPs) and policies in support of a safe, ef�cient, secure, economically sustainable and environmentally responsible civil aviation sector. IEA Mobility Model (MoMo)The IEA mobility model (MoMo) is a technical-economic database spreadsheet and simulation model that enables detailed global and regional projections of transport activity, vehicle activity, energy demand, and well-to-wheel GHG and pollutant emissions according to user-de�ned policy scenarios to 2050. It represents all major motorised transport modes (road, rail, shipping and air) providing passenger and freight services.
112

OECD Organisation for Economic Co-operation and Development.Member countries are: Australia, Austria, Belgium, Canada, Chile, Czech Republic, Denmark, Estonia, Finland, France, Germany, Greece, Hungary, Iceland, Ireland, Israel, Italy, Japan, Korea, Luxembourg, Mexico, Netherlands, New Zealand, Norway, Poland, Portugal, Slovak Republic, Slovenia, Spain, Sweden, Switzerland, Turkey, United Kingdom and United States of America.
OECD North America: Canada, Mexico and United States of America.OECD Europe: Austria, Belgium, Czech Republic, Denmark, Estonia, Finland, France, Germany, Greece, Hungary, Iceland, Ireland, Italy, Luxembourg, Netherlands, Norway, Poland, Portugal, Slovak Republic, Slovenia, Spain, Sweden, Switzerland, Turkey and United Kingdom.Other OECD: Australia, Chile, Israel, Japan, Korea and New Zealand.
SUSDEF Sustainable Development Foundation founded in 2008 by companies, business associations and sustainability experts, it is a not for pro�t think-tank based in Rome aimed at encouraging the transition towards a green economy. The Foundation relies on a network of 100 associated green companies and more than 50 top level senior experts and young talents in the sustainable development �eld.
113

References
AMTRAK 2015, Amtrak 2014 Sustainability Report. AMTRAK, 2015
ATAG 2016, Facts and Figures. Internet: http://www.atag.org/facts-and-�gures.html. Accessed: September 2016
ATOC 2009, Energy consumption and CO2 impacts of High Speed Rail: ATOC analysis for Greengauge 21. Richard Davies, Leigh Thompson. ATOC, April 2009
B-Logistics 2016, E-drivers Project. Presentation by Laurent Joseph & David Delpire. B-Logistics. Paris, 2016. Internet: http://www.uic.org/forms/IMG/pdf/07_sncb_log_edrivers_das_ws_uic_160210.pdf
CNBS 2014, China Statistical Yearbook 2014. China statistics Press, National Bureau of Statistics of China, Beijing.
DB 2016, Climate protection at Deutsche Bahn - Deutsche Bahn Website. Internet: http://www.deutschebahn.com/en/sustainability/environmental_pioneer/db_and_climate_protection.html. Accessed: September 2016
EC 2015, EU Transport in �gures – Statistical Pocketbook 2015. Publications of�ce of the European Union, Luxembourg.
EEA 2015, Monitoring CO2 emissions from new passenger cars and vans in 2014. European Environment Agency, 2015
EEA 2016, News: Reported CO2 emissions from new cars continue to fall. Internet: http://www.eea.europa.eu/highlights/reported-co2-emissions-from-new
Eltherm GmbH 2016, Railway Heating Systems. Innovations in heat tracing (brochure). Internet: http://eltherm.com/355/rail-and-point-heating. Accessed: July 2016.
EU 2007, European Council 8/9 March 2007 - Presidency Conclusions, Brussels Internet: https://www.consilium.europa.eu/uedocs/cms_data/docs/pressdata/en/ec/93135.pdf
EU 2008, 20 20 by 2020 Europe's climate change opportunity. COMMUNICATION FROM THE COMMISSION TO THE EUROPEAN PARLIAMENT, THE COUNCIL, THE EUROPEAN ECONOMIC AND SOCIAL COMMITTEE AND THE COMMITTEE OF THE REGIONS. January 2008, Brussels
EU 2014a, Conclusions European Council, 23-24 October. October, Brussels Internet: http://www.consilium.europa.eu/uedocs/cms_data/docs/pressdata/en/ec/145397.pdf
114
EU 2014b, Regulation (EU) No 333/2014 of the European Parliament and of the Council of 11 March 2014 Internet: http://eur-lex.europa.eu/legal-content/EN/TXT/PDF/?uri=CELEX:32014R0333&from=EN
EUROSTAT 2016, Renewable energy statistics Database. EUROSTAT. Internet: http://ec.europa.eu/eurostat/statistics-explained/index.php/Renewable_energy_statistics. Accessed April 2016
García Álvarez, A. and Lukaszewicz, P. 2010, Energy and cost advantages of wide-body trains. CTF. Zaragoza, 2010.
GFEI 2015, International comparison of light-duty vehicle fuel economy: Evolution over 8 years from 2005 to 2013. OECD/IEA 2016.
GFEI 2016, Technology and policy drivers of the fuel economy of new light-duty vehicles. OECD/IEA 2016.
ICAO 2010, Resolutions adopted by the ICAO assembly – 37th Session. November 2010 Internet: http://www.icao.int/Meetings/AMC/Assembly37/Documents/ProvisionalEdition/a37_res_prov_en.pdf
ICAO 2013, Resolutions adopted by the ICAO assembly – 38th Session. November 2013 Internet: http://www.icao.int/Meetings/a38/Documents/Resolutions/a38_res_prov_en.pdf
ICCT 2015, A Review and Evaluation of Vehicle Fuel Ef�ciency Labeling and Consumer Information Programs. APEC Secretariat, 2015
ICCT 2016, Info and tools: Global passenger vehicle standards. On-line data service. Internet: http://www.theicct.org/info-tools/global-passenger-vehicle-standards. Accessed: September, 2016
IEA 2015a, CO2 Emissions from Fuel Combustion. On-line data service. Internet: http://data.iea.org/. Accessed February 9, 2016.
IEA 2015b, World Energy Balances. On-line data service. Internet: http://data.iea.org/. Accessed February 9, 2016.
IEA 2016a, Energy Technology Perspectives 2016, www.iea.org/etp.
IEA 2016b, IEA Mobility Model (MoMo). IEA 2016
INDC 2015, Submitted Intended Nationally Determined Contributions Website, UNFCC. Internet: http://www4.unfccc.int/submissions/indc/Submission%20Pages/submissions.aspx Accessed: June 2016
IMO 2011, Annex 19 - Resolution MEPC.203(62), Adopted on 15 July 2011 Internet: http://www.imo.org/en/OurWork/Environment/PollutionPrevention/AirPollution/Documents/Technical%20and%20Operational%20Measures/Resolution%20MEPC.203%2862%29.pdf
115

IPCC 2014, Climate Change 2014: Mitigation of Climate Change Tab.8.3, Chapter 8. Sims R., R. Schaeffer, F. Creutzig, X. Cruz-Núñez, M. D’Agosto, D. Dimitriu, M.J. Figueroa Meza, L. Fulton, S. Kobayashi, O. Lah, A. McKinnon, P. Newman, M. Ouyang, J.J. Schauer, D. Sperling, and G. Tiwari, 2014: Transport. In: Climate Change 2014: Mitigation of Climate Change. Contribution of Working Group III to the Fifth Assessment Report of the Intergovernmental Panel on Climate Change [Edenhofer, O., R. Pichs-Madruga, Y. Sokona, E. Farahani, S. Kadner, K. Seyboth, A. Adler, I. Baum, S. Brunner, P. Eickemeier, B. Kriemann, J. Savolainen, S. Schlömer, C. von Stechow, T. Zwickel and J.C. Minx (eds.)]. Cambridge University Press, Cambridge, United Kingdom and New York, NY, USA.
JR-East 2014, CSR Report 2014. East Japan Railway Company. Tokyo, October 2014.
JR-West 2016, JR-West CSR Company Website. Internet: https://www.westjr.co.jp/global/en/about-us/csr/environment/. Accessed March 2016
JSY 2015, Japan Statistical Yearbook 2015, Statistics Bureau, Ministry of Internal Affairs and Communications, Japan.
KORAIL 2015, 2014 KORAIL Sustainability Report. Korean Railroad Corporation, Daejeon Metropolitan City.
MERLIN Project 2015, Sustainable and intelligent management of energy for smarter railway systems in Europe: an integrated optimization approach - Position paper for agent integration and interaction. MERLIN Project, December 2015. Internet: http://www.merlin-rail.eu/wp-content/uploads/2016/01/D7.2_Position_paper_for_agent_integration_and_interaction.pdf Network Rail 2009, Network RUS electri�cation. United Kingdom
NS 2015, Annual Report 2015. NS, Utrecht
NSB 2015, Annual Report 2015. NSB Group, Oslo.
NTS 2015, National Transport Statistics U.S. Bureau of Transportation Statistics. Internet: http://www.rita.dot.gov/bts/subject_areas. Accessed: June 2016.
OECD 2016, OECD Statistics Extract. On-line data service. Internet: http//stats.oecd.org/. Accessed: June 2016.
REFRESCO Project 2013, Towards a REgulatory FRamework for the usE of Structural new materials in railway passenger and freight CarbOdyshells. Internet: http://www.refresco-project.eu/
RENFE 2015, El ferrocarril y la cumbre de Cambio Climático 2015 COP21 París. RENFE, Madrid.
116
Rosstat 2015, Russia in �gures. Russian Federal Statistics Service. Internet: http://www.gks.ru/wps/wcm/connect/rosstat_main/rosstat/en/�gures/transport/. Accessed: June 2016
RZD 2014, Environmental Strategy of JSC "Russian Railways" for the period till 2017 and the prospect of up to 2030. Internet: http://doc.rzd.ru/doc/portal/ru?STRUCTURE_ID=704&layer_id=5104&refererLayerId=5103&id=6415. Accessed: March 2016
Shu-Ta Yeh 2003, Integrated analysis of vertical alignments and speed pro�les for rail transit routes. Shu-Ta Yeh, Master of Science, 2003.
SNCB 2012, SNCB Corporate Social Responsibility Report 2011. SNCB, Brussels.
SNCF 2016, SNCF Website. Internet: http://www.sncf.com/en/our-commitments/consuming-less-energy. Accessed: March 2016.
SLOCAT 2016, LPAA Transport Initiatives Progress Take Action on the Implementation of the Paris Agreement on Climate Change and the 2030 Global Goals on Sustainable Development. Partnership on Sustainable Low Carbon Transport, 2016.
Steiner 2006, Improving Overall Energy Ef�ciency of Traction Vehicles. Dr. Michael Steiner, Dr. Johannes Scholten. Bombardier Transportation, Mannheim, Germany, 2006.
SYB 2015, India Statistical Yearbook 2014, Indian Ministry of Statistics and Programme Implementation.
THALYS 2015, 40% less CO2 emissions by 2020: Thalys, supported by WWF, is the �rst European railway undertaking to sign up to the Science Based Targets. Press Release. 28 October 2015, Brussels
TransportPolicy 2016, Transport Policy Website. ICCT and Dieselnet. Internet: www.TransportPolicy.net. Accessed: September 2016
Turner 2013, Resistance is futile: how aerodynamics inform train design. Railway-Tecnology.com Internet: http://www.railway-technology.com/features/feature-aerodynamic-train-design-arrowedge-union-paci�c-bombardier-ze�ro/. Julien Turner, 2013
UIC 2003, EVENT Evaluation of Energy Ef�ciency Technologies for Rolling Stock and Train Operation of Railways Project. International Union of Railways, Paris
UIC and CER 2010, Moving towards Sustainable Mobility: European Rail Sector Strategy 2030 and beyond. International Union of Railways, Paris.
117
UIC 2014, Low Carbon Rail Transport Challenge Action Plan. International Union of Railways, Paris.
UIC 2015a, International Railway Statistics 2014, Statistics Centre of the International Union of Railways, Paris.
UIC 2015b, UIC Environmental Performance Database 2015. International Union of Railways, Paris.
UIC 2015c, UIC Environment Strategy Reporting System – Methodology and Policy. International Union of Railways, Paris
UIC and FFE 2016, State of the art of the new technologies for the energy ef�ciency and CO2 reductions in the railway system. International Union of Railways, Paris.
UIC and FFE 2016b, New steps in the energy ef�ciency in the railway sector. International Union of Railways, Paris.
UN 2014a, Transport - Aviation Action Plan. United Nations, Climate Summit 2014. New York. Internet: http://www.un.org/climatechange/summit/wp-content/uploads/sites/2/2014/09/TRANSPORT-Aviation-Action-plan.pdf
UN 2014b, Transport - Railway Action Plan. United Nations, Climate Summit 2014. New York. Internet: http://www.un.org/climatechange/summit/wp-content/uploads/sites/2/2014/07/TRANSPORT-Action-Plan-UIC.pdf
UNCTAD 2014, Review of Maritime Transport 2014. UNCTAD/RMT/2013. United Nations Conference on Trade and Development. Geneva, 2014.
UNDP 2011, Project: Improving energy ef�ciency in the Indian Railways system, UNDP 2011
UNFCC 2015, Submitted Intended Nationally Determined Contributions Website. Internet: http://www4.unfccc.int/submissions/indc/Submission%20Pages/submissions.aspx Accessed: June 2016
VIA RAIL CANADA 2015, Sustainable Mobility Report 2015. VIA RAIL CANADA, Montréal.
WRI 2015, GHG Protocol Scope 2 Guidance. World Resources Institute, Washington.
Zamora D. 2011, La subestación reversible de corriente continua. David Zamora, ALSTOM, 2011.
118

This report is the result of a collaborative effort between the International Energy Agency (IEA) and the International Union of Railways (UIC). Users of this report shall take their own independent business decisions at their own risk and, in particular, without undue reliance on this report. Nothing in this report shall constitute professional advice, and no representation or warranty, express or implied, is made in respect to the completeness or accuracy of the contents of this report. Neither the IEA nor the UIC accepts any liability whatsoever for any direct or indirect damages resulting from any use of this report or its contents. A wide range of experts reviewed drafts. However, the views expressed do not necessarily represent the views or policy of either the UIC, or its member companies, or of the IEA, or its individual Member countries.
Copyright © 2016the OECD/International Energy Agency and
the International Union of Railways
Disclaimer
119

6