international differences in the cost of equity capital
TRANSCRIPT

University of Pennsylvania University of Pennsylvania
ScholarlyCommons ScholarlyCommons
Accounting Papers Wharton Faculty Research
6-2006
International Differences in the Cost of Equity Capital: Do Legal International Differences in the Cost of Equity Capital: Do Legal
Institutions and Securities Regulation Matter? Institutions and Securities Regulation Matter?
Luzi Hail University of Pennsylvania
Christian Leuz
Follow this and additional works at: https://repository.upenn.edu/accounting_papers
Part of the Accounting Commons, and the International Business Commons
Recommended Citation Recommended Citation Hail, L., & Leuz, C. (2006). International Differences in the Cost of Equity Capital: Do Legal Institutions and Securities Regulation Matter?. Journal of Accounting Research, 44 (3), 485-531. http://dx.doi.org/10.1111/j.1475-679X.2006.00209.x
This paper is posted at ScholarlyCommons. https://repository.upenn.edu/accounting_papers/65 For more information, please contact [email protected].

International Differences in the Cost of Equity Capital: Do Legal Institutions and International Differences in the Cost of Equity Capital: Do Legal Institutions and Securities Regulation Matter? Securities Regulation Matter?
Abstract Abstract This paper examines international differences in firms’ cost of equity capital across 40 countries. We analyze whether the effectiveness of a country’s legal institutions and securities regulation is systematically related to cross-country differences in the cost of equity capital. We employ four different models using analyst forecasts to estimate firms’ implied cost of capital. We find that countries with extensive securities regulation and strong enforcement mechanisms exhibit lower levels of cost of capital than countries with weak legal institutions, even after controlling for various risk and country factors. The effects are strongest for institutions providing information to investors and enabling them to privately enforce their contracts. We also show that, consistent with theory, these effects become substantially smaller or insignificant as capital markets become more integrated.
Keywords Keywords international finance, cost of equity, disclosure, legal system, law and finance
Disciplines Disciplines Accounting | International Business
This journal article is available at ScholarlyCommons: https://repository.upenn.edu/accounting_papers/65

International Differences in the Cost of Equity Capital: Do Legal Institutions and Securities Regulation Matter?*
Luzi Hail
Institute for Accounting and Control
University of Zurich
and
Christian Leuz The Wharton School
University of Pennsylvania
November 2003
Abstract This paper examines international differences in firms’ cost of equity capital across 40 countries. We analyze whether the effectiveness of a country’s legal institutions and securities regulation is systematically related to cross-country differences in the cost of equity capital. We employ four different models using analyst forecasts to estimate firms’ implied cost of capital. We find that countries with extensive securities regulation and strong enforcement mechanisms exhibit lower levels of cost of capital than countries with weak legal institutions, even after controlling for various risk and country factors. The effects are strongest for institutions providing information to investors and enabling them to privately enforce their contracts. We also show that, consistent with theory, these effects become substantially smaller or insignificant as capital markets become more integrated.
JEL classification: G14, G15, G38, G30, K22, M41
Key Words: International finance, Cost of equity, Disclosure, Legal system, Law and finance * We thank Yakov Amihud, Ray Ball, Gauri Bhat, Wayne Guay, Ole-Kristian Hope, Bob Holthausen, Rafael La Porta, David Larcker, Felix Oberholzer, Shiva Rajgopal, Terry Shevlin, Surjit Tinaikar, Joe Weber, Peter Wysocki, Stephen Young and workshop participants at Harvard Business School, Rutgers University, Singapore Management University, University of Chicago and University of Washington for helpful comments on earlier drafts. We also thank Bryan Chao, Nick Vedder and Ian Weiliang for their research assistance. Luzi Hail acknowledges the financial support by the Commission for the Advancement of Young Scientists and Scholars of the University of Zurich. Analyst forecast data has been generously provided by I/B/E/S (Thomson Financial).

1
1. Introduction
In this paper, we examine international cost of equity capital differences across 40 countries.
Recent research suggests that countries’ legal institutions are a key determinant of financial
market development, capital and ownership structures, dividend policies, and firms’ equity
valuations (e.g., La Porta et al, 1997, 2000a and 2002). Based on this evidence, we investigate
whether the effectiveness of a country’s legal institutions has a systematic influence on its firms’
cost of equity capital, over and above traditional risk and country factors.
Well-functioning legal systems protect investors; they confer rights on investors, e.g., to
receive information, and enforce financial contracts. As a result, effective legal institutions
reduce monitoring and enforcement costs to investors, which may in turn reduce the expected
rate of return that investors demand for their capital. Prior studies suggest that effective legal
institutions increase firms’ equity valuations (e.g., La Porta et al., 2002). However, these results
may reflect the effects of legal systems on firms’ cash flows, for instance, by reducing
expropriation or expanding growth opportunities, rather than the effects on the risk premium
demanded by investors. Thus, it is still an open question whether the quality of legal institutions
manifests in systematic differences in firms’ cost of capital. Moreover, as capital markets around
the world become more integrated, country-specific factors may lose their importance for firms’
cost of capital (e.g., Harvey, 1991; Bekaert and Harvey, 1995). To explore these issues and to
shed some light on the mechanism through which legal institutions affect valuations, we examine
whether differences in countries’ securities regulation, i.e., disclosure rules and enforcement,
explain international differences in cost of capital.
We focus on securities regulation requiring disclosures because it is often justified with the
argument that it reduces firms’ cost of capital (e.g., Levitt, 1998). Economic theory suggests that

2
a firm’s commitment to disclosure reduces information asymmetries between the firm and its
investors and among investors (see Verrecchia, 2001, for a survey). However, it is unclear
whether the reduction in information asymmetry also lowers the firm’s cost of capital. An effect
on the cost of capital requires that differences in disclosure lead to differences in non-
diversifiable risk. A recent paper by Easley and O’Hara (2002) provides support for this notion.
Empirical evidence at the firm level also suggests that firms providing more disclosures
have a lower cost of capital (e.g., Botosan, 1997; Hail, 2002).1 However, tests of this relation
within one country rely on voluntary disclosures, which may not constitute a commitment to
disclosure, and are prone to selection bias (Leuz and Verrecchia, 2000). In contrast, securities
regulation mandates disclosures at the country (or exchange) level, resulting in a commitment if
it is properly enforced. Thus, cross-country settings provide a promising way to explore the link
between securities regulation and the cost of capital.
Our analysis is based on the cost of equity capital implied in share prices and analyst
forecasts. We use four different models suggested in the literature to compute the implied cost
of capital from 1992 to 2001 for firms from 40 countries.2 We find significant differences in the
cost of equity capital across countries. Traditional risk factors, i.e., size, volatility and the book-
to-market ratio explain a substantial portion of the cross-sectional variation. We also find that
country factors capturing differences in inflation rates and macroeconomic variability are
significantly related to international cost of capital differences. Together, these factors explain
more than 60% of the country-level variation in the cost of equity capital around the world.
1 A related finding is that firms with higher earnings quality enjoy lower levels of cost of capital (e.g., Francis et al., 2003).
2 See Claus and Thomas (2001), Gebhardt et al. (2001), Ohlson and Jüttner-Nauroth (2000), and Easton (2004).

3
Next, we introduce proxies for the effectiveness of a country’s legal institutions into the
analysis. We find that securities regulation and legal institutions explain variation in the cost of
equity capital, even after controlling for risk and country factors. Firms in countries with strong
securities regulation, i.e., extensive disclosure rules and strong legal enforcement, display
significantly lower cost of capital. The findings suggest that the effects are strongest for
institutions mandating the disclosure of information and enabling investors to privately enforce
their contracts. We perform numerous sensitivity analyses mitigating concerns that these results
are driven by correlated omitted variables or endogeneity of the institutional variables.
We further investigate to what extent the effect of legal institutions and disclosure regulation
differs by capital market integration. If investors can invest freely around the world, the quality
of securities regulation of any particular country may become less important. Using several
proxies, we find that the effects are strongest for markets that are least integrated. Among
countries with integrated capital markets, extensive disclosure requirements continue to be
negatively associated with the cost of capital, but the effect is smaller in magnitude. However,
the enforcement variables are generally insignificant. These findings are consistent with the
notion that, in integrated markets, risk is priced globally and that there are local factors under
segmentation (e.g., Bekaert and Harvey, 1995; Harvey, 1995; Karolyi and Stulz, 2002).
Our study builds on recent advances in the finance literature on the role of legal institutions
in financial market development and firm valuations (see La Porta et al., 2000b, for a survey).
We extend this literature by presenting evidence that the effectiveness of securities regulation
and supporting legal institutions is systematically related to international differences in the
implied cost of equity capital. Our paper complements the studies by La Porta et al. (2003)
showing that securities regulation explains cross-sectional variation in financial development,

4
Bhattacharya and Daouk (2002) demonstrating that enforcement of insider trading regulations
lowers firms’ cost of capital, Frost et al. (2001) suggesting that disclosure requirements by stock
exchanges increase market liquidity, and Lee and Ng (2002) demonstrating that firms in corrupt
countries trade at lower multiples. Our study also relates to recent work on the institutional
determinants of corporate transparency (e.g., Bushman et al., 2003; Leuz et al., 2003).
Our paper is most closely related to a study by Lombardo and Pagano (2000b). They
document that proxies broadly capturing the quality of the legal framework are positively
associated with returns on equity using realized stock returns, dividend yields, and price-earnings
ratios. However, the latter proxies are likely to also capture differences in firms’ profitability
and growth opportunities, i.e., cash-flow effects, which could explain the difference to our
findings. In this paper, we employ valuation models and forecast data to compute ex ante
estimates for the cost of capital, which are less likely to reflect cash-flow effects.
Our work also contributes to the international finance literature. This study is one of the first
to systematically analyze international cost of capital differences using analyst forecasts for a
large set of countries around the world. Prior studies are generally based on realized stock
returns and find that the explanatory power of the international CAPM is fairly low. This result
is often attributed to market segmentation (e.g., Harvey, 1995). The issue can be addressed by
jointly estimating the ex ante cost of capital and the degree of market integration (Bekaert and
Harvey, 1995). However, standard techniques to obtain unbiased estimates of expected returns
from realized stock returns require fairly long time-series because economic events often have
opposite effects on the expected and the realized return (e.g., Stulz, 1999). An alternative
approach is to use country credit-risk ratings (Erb et al., 1996), which are available for a broad
cross-section of countries but based on survey data.

5
In contrast, our study builds on models that estimate the ex ante rate of return required by
investors based on market data and analyst forecasts. Aside from being novel at the descriptive
level, our evidence complements prior return-based studies in providing further evidence on the
cross-sectional determinants of international cost of capital differences and on the mitigating role
of market integration.
Finally, we document that implied cost of capital models produce estimates that are highly
associated with traditional risk and country factors. This finding for a cross-section of 40
developed and developing countries complements recent work validating implied cost of capital
estimates based on US data (e.g., Botosan and Plumlee, 2002; Guay et al., 2003) and for the G7
countries (Lee et al., 2003).
The paper is organized as follows. Section 2 describes the sample and the construction of
the implied cost of capital estimates. In Section 3, we present our base results relating traditional
risk and country factors to firms’ cost of capital. In Sections 4 and 5, we present the empirical
tests for the legal factors and the mitigating effect of market integration, respectively. Section 6
concludes the study.
2. Data and Research Design
To compute the cost of capital proxies, we obtain financial data from Worldscope and
analyst forecasts and share price information from I/B/E/S. We download all firms contained in
Worldscope from 1992 to 2001 and match them to firms covered in I/B/E/S. To be included in
the cost of capital computation, we require each observation to have one-year-ahead and two-
year-ahead, non-negative earnings forecasts, either a long-term growth forecast or a three-year-
ahead earnings forecast, and a contemporaneous share price. All data are measured in local
currency and taken as of month 10 after the fiscal-year end. We deliberately choose to compute

6
our estimates ten months after the fiscal-year end to assure that financial data are publicly
available and priced at the time of our computations.3 These data requirements lead to a sample
of 36,202 firm-years. We eliminate firm-years (a) if there are less than five observations for the
country in that year, (b) if the inflation rate for the country in that year is above 25% and (c) if
we do not have institutional data for the country.4 The final sample consists of 35,122 firm-year
observations from 40 countries between 1992 and 2001.
For each firm-year observation, we compute the ex ante cost of capital implied in
contemporaneous stock price and analyst forecast data. We use four different models suggested
in Claus and Thomas (2001), Gebhardt et al. (2001), Ohlson and Jüttner-Nauroth (2000) as
implemented by Gode and Mohanram (2002), and in Easton (2004). Each approach is a
variation on discounted cash flow valuation, either using the residual income or the discounted
dividend model. The valuation model provides the link between the current stock price and the
estimates of future cash flows or (abnormal) earnings. The basic idea of all four approaches is to
substitute price and analyst forecasts into the valuation equation and to back out the cost of
capital as the internal rate of return that equates current stock price and the sequence of expected
(abnormal) earnings or cash flows derived from forecasts. Thus, the models make an explicit
attempt to separate cash flow (or numerator) and cost of capital (or denominator) effects.
The individual models differ with respect to the use of analyst forecast data, the assumptions
regarding short-term and long-term growth, the explicit forecasting horizon, and how inflation is
incorporated into the steady-state terminal value. In the Appendix, we summarize the four
3 We repeat the analyses using month +7 data. In this case, we have a slightly smaller sample, i.e., 339 country-years, but the results are similar and the inferences and conclusions are the same.
4 The last criterion is obviously necessary for our institutional analysis. The two other criteria were imposed to prevent extreme country-years from unduly affecting our regressions. However, the results do not hinge on these criteria and are very similar without them.

7
models, describe their key assumptions and data requirements, and explain our implementation
in the international setting. Botosan and Plumlee (2002) and Guay et al. (2003) provide detailed
comparisons based on US data.
Next, we compute country-year medians of the cost of capital estimates. We do so for
several reasons. First, the basic idea of this study is to exploit variation in securities regulation
across countries to tease out the effects of such regulation on cost of capital estimates. That is,
we are interested in systematic differences across countries. Second, the legal variables vary only
at the country level. Finally, a country-year analysis does not give undue weight to large
countries with many firm-year observations.5
Table 1 reports descriptive statistics for the implied cost of capital estimates. Panel A
provides descriptive information on the distribution of the four models’ estimates. It shows that
the Gebhardt et al. model generally yields the lowest estimates. The three other models are fairly
close and on average around 12 percent. All four models provide estimates that are within
reasonable ranges. Panel B reports the correlation coefficients and shows that all four estimates
are highly correlated. The Gebhardt et al. estimates exhibit the lowest correlations. This finding
likely results from the long explicit forecasting horizon and the incorporation of industry
information, both of which are distinct features of the Gebhardt et al. model.6
As there is little consensus in the literature, which of the models works best or even how to
evaluate the models, we simply average over the four proxies and use the resulting variable,
rAVG, in our main analyses. Panels A and B provide descriptive statistics and correlation
coefficients for the average cost of capital.
5 We later check that this approach does not give undue weight to small countries. See Sections 4.2 and 5. 6 As a robustness check, we compute Gebhardt et al. estimates over a 9-year and a 15-year forecasting horizon.
The resulting estimates are very close to those of the 12-year horizon, exhibiting correlations of 0.9 or higher.

8
Panel C reports for each sample country the number of firm-year observations used to
compute the cost of capital estimates, the number of country-year observations available for our
analyses as well as descriptive information on the institutional variables used in subsequent
analyses. We also provide the time-series average cost of capital by country. The panel shows
considerable variation in the cost of capital across countries. However, simple comparisons
across countries can be misleading because they do not control for various factors known to
affect firms’ cost of capital. We therefore control for a number of risk and country factors before
we introduce the institutional variables into the analysis.
An important factor is the inflation rate. Analyst forecasts are expressed in nominal terms
and local currency, which implies that the resulting estimates for the cost of capital reflect
countries’ expected inflation rates. This effect explains, for instance, the relatively low cost of
capital estimate for Japan, which experienced deflation over parts of the sample period. Thus, it
is important to control for international differences in expected inflation rates.
One approach is to subtract the expected future inflation rates from the cost of capital
estimates and to conduct a regression analysis on the resulting inflation-adjusted estimates.
However, this approach essentially forces a coefficient of minus one on the inflation proxy. As
the market’s expectation for future inflation is only imperfectly observable, we prefer to
introduce a separate control variable for cross-sectional differences in inflation. This approach
lets the data determine the relation between the inflation proxy and the cost of capital estimate.
We expect the coefficient to be positive but smaller than one, as any measurement error biases
the coefficient towards zero. We compute monthly inflation rates for each country using the
consumer price indices provided in the Datastream and Worldbank databases and use the median
of next year’s monthly inflation rates as a proxy for the expected future inflation.

9
Another factor is time-series variation in the risk-free interest rates. It is common in
international studies to convert local returns into U.S. dollar returns and use the U.S. Treasury
bill as a proxy for the risk-free rate in all countries (e.g., Harvey, 1995). This approach
essentially assumes that exchange rates reflect inflation differences across countries and that time
preferences and real rates are similar across countries. Thus, expressing returns in excess of the
T-bill rate controls for time-series variation in the risk-free rate over time. In our country-year
analysis, the T-bill rate is a yearly constant and hence year-fixed effects easily control for time-
series variation in the risk-free rate.7
We also introduce a number of risk factors. Based on prior empirical studies on the cross-
sectional determinants of returns, we expect the cost of capital to be negatively associated with
firm size and to be positively associated with stock return volatility (or beta) and the book-to-
market ratio (e.g., Fama and French, 1992, 1993). We measure size as the firm’s market
capitalization as of the fiscal year end, return variability as the standard deviation of monthly
stock returns over the last twelve months and the book-to-market ratio as the ratio of book value
to market value of equity.
The Fama and French three-factor model loosely motivates these three variables. We use
the return variability rather than the beta factor for two reasons. First, the estimation of beta
presupposes a stance on the degree of capital market integration. If capital markets are
integrated, it is appropriate to use the world market portfolio (e.g., Solnik, 1974; Stulz, 1981).
But we do not know whether our sample markets are integrated into the world market. In fact,
one reason for using the implied cost of capital approach is that it does not require a choice of a
market portfolio and hence avoids one of the difficulties return-based studies face in an
7 We check in Section 4.2 that our results are not unduly affected by differences in real rates across countries.

10
international context. Second, prior studies find that future returns in emerging markets exhibit
no or even a negative relation with beta factors computed with respect to the world market
portfolio (e.g., Harvey, 1995; Erb et al., 1996).
We also note that there is some debate in the literature about the inclusion of the book-to-
market ratio in implied cost of capital regressions (e.g., Gode and Mohanram, 2002). However,
aside from its empirical relevance in asset pricing models, we think it is important to control for
book-to-market differences, in particular in an international setting. The book-to-market ratio
captures differences in firms’ growth opportunities. Moreover, prior studies show that book-to-
market ratios (or Tobin’s Qs) differ markedly across countries (e.g., La Porta et al., 2002). Thus,
to be conservative, we include the book-to-market ratio in our models.8
In addition to the three risk factors, we include industry controls in all our regressions.
Fama and French (1997) find that there is substantial variation in factor loadings across
industries. We use the industry classification in Campbell (1996) to construct our industry
controls. At the country level, it makes sense to also control for differences in macro-economic
variability and a country’s exposure to global economic risks and shocks (Ferson and Harvey,
1998). Furthermore, differences in risk-sharing opportunities across countries can affect
corporate investment, e.g., lead to more or less specialization and risk taking, which in turn can
affect the variability of aggregate output or performance (Obstfeld, 1994).
To capture cross-country differences in economic variability, we consider four variables: (1)
the standard deviation of annual earnings per share over the last five years scaled by total assets
per share, (2) the standard deviation of accounting returns on equity over the last five years, (3)
the standard deviation of the residuals from a regression of annual GDP growth rates on a time
8 Our results for institutional variables are generally stronger if we do not include the book-to-market ratio.

11
index over the sampling period, and (4) the coefficient of variation of yearly average exchange
rates (US$ to local currency) over the sampling period.9
The first two variables are based on firm-level data, but like all other variables they are
measured as a country-year median. Hence, they are likely to capture the country-level
variability of the economic processes. Consistent with this claim, we find that all four variables
are highly correlated. Factor analysis shows that there is only one factor in the data with an
eigenvalue above one. We therefore summarize the four variables into a single control variable
for macro variability using the first principal component.
The final control variable captures differences in forecast bias, which is not a risk factor.
But as the cost of capital estimates rely on analyst forecasts, we are concerned that international
differences in the forecasting behavior could “mechanically” affect our results. For instance, if
forecasts in a particular country tend to be optimistic but market participants understand this bias
and properly adjust prices, implied cost of capital models yield upwardly biased estimates. Hope
(2003a and 2003b) shows that forecast accuracy differs significantly across countries and that
forecast accuracy is related to firms’ disclosure policies.
We compute forecast bias at the country-year level using firm-level forecast errors. We
define the forecast error as the mean one-year-ahead consensus forecast minus the actual
earnings reported in I/B/E/S. Thus, if forecasts tend to be optimistic, the forecast bias variable
assumes positive values and we expect a positive coefficient if markets back out the bias.
Table 2 presents summary statistics and correlation coefficients for the control variables
described in this section. There is considerable cross-sectional variation in all variables and most
9 One issue is that market-based as well as macro-economic proxies may reflect the effects of legal institutions. For instance, good legal institutions may manifest in lower beta factors or GDP volatility. In general, such effects should make it harder for us to find significant relations for the institutional variables in presence of market-based or macro-economic controls. To be sure, we address this issue in Section 4.2.

12
variables are significantly correlated. The bottom row of Panel B also reports correlation
coefficients for the average cost of capital and the control variables. The average cost of capital
displays the predicted correlations with all control variables.
3. Regression Results for Traditional Risk and Country Factors
In this section, we establish that cross-sectional differences in the implied cost of capital are
systematically related to risk and country factors in the predicted fashion. Similarly, Botosan
and Plumlee (2002) and Gode and Mohanram (2002) validate implied cost of capital estimates
by showing that they are related to proxies capturing various sources of risk. The regressions in
Table 3 provide a benchmark for our institutional analysis.
The first model controls for inflation, firm size, beta, book-to-market ratio, industry and year
effects. As explained in Section 2, we introduce year-fixed effects to capture time-series
variation in the risk-free rate. Table 3 shows that this model already explains 59% of the cross-
sectional variation in the implied cost of capital across 40 countries. All control variables are
highly significant and have the predicted sign. As predicted, the coefficient on inflation is
smaller than one. We discussed in Section 2 that this finding probably reflects measurement
error in the proxy for the expected inflation.10
In the next model, we replace the beta factor with return variability. Although beta is
positively associated with the implied cost of capital, its association is weaker than the
association of return variability. Moreover, we find that beta is insignificant once we include all
other control variables, whereas return volatility is not. Thus, to be conservative, we use return
variability in our regressions. The results for the institutional variables are even stronger if we
10 Illustrating the measurement issue, the contemporaneous inflation rate yields a smaller coefficient and lower R2
than the one-year-ahead realized inflation rate, which we use to proxy for the expected inflation. Note, however, that our results are not affected by this choice.

13
use the beta factor instead of return variability, and very similar to those reported in Sections 4
and 5 if we include both variables together.
As capital structures differ across countries and have a predictable effect on the cost of
equity capital, we also check whether adding financial leverage as control alters our findings.
We find (but do not tabulate) that leverage is insignificant if either the beta factor or return
variability are used in the model, suggesting that these variables sufficiently control for capital
structure differences across countries.
In the third model, we add a variable controlling for macroeconomic variability. As
explained in Section 2, we use the first principal component of four proxies: earnings per share
variability, ROE variability, volatility in GDP growth and exchange rate variability. At the
country-year level, the four proxies are highly correlated, which is why we summarize them
using the first principal component. However, the results are not materially affected if we use
any one of them instead of the principal component. In all cases, the coefficient on the proxy for
macro variability is positive and highly significant.
In the fourth (or full) model, we also control for differences in forecast bias across countries.
Table 2 shows that there is variation in forecasting behavior across countries and that forecast
bias is positively correlated with the average cost of capital. However, in Table 3, the coefficient
on forecast bias is not significant. Thus, our cost of capital estimates do not appear to be
significantly biased due to differences in forecasting behavior across countries.11 Overall, the
full model explains more than 61% of the country-level variation in the implied cost of equity
capital around the world.
11 Our results in Table 4 are very similar if we use forecast accuracy, i.e., the absolute value of the forecast error, or the two-year ahead forecast error as control variable.

14
4. The Role of Securities Regulation and Legal Institutions
4.1 Main Results
In this section, we examine whether differences in countries’ securities regulation, i.e.,
disclosure rules and enforcement, can explain international differences in cost of capital, over
and above those factors previously introduced into the model.
Economic theory suggests that a firm’s commitment to disclosure reduces information
asymmetries between the firm and its investors and among investors (e.g., Verrecchia, 2001).
Security regulation effectively commits firms to certain disclosures and hence likely reduces
information asymmetries. However, it is unclear whether the reduction in information
asymmetry also lowers the firm’s cost of capital. The key question is whether differences in
disclosure lead to non-diversifiable differences in risk. Easley and O’Hara (2002) present a
model where information asymmetries among traders in secondary share markets result in an
information risk premium in the cost of capital and where leveling the playing field among
traders reduces the cost of capital.
Lombardo and Pagano (2000a) argue that effective legal institutions reduce (out-of-pocket)
monitoring and enforcement costs to investors. Specifically, securities regulation provides
extensive information to investors as well as ways to enforce financial contracts, thereby
reducing monitoring costs and hence the expected return that firms have to offer investors as
compensation. Alternatively, it is also possible that effective legal institutions primarily manifest
in firms’ cash flows, for instance, by expanding growth opportunities or reducing expropriation,
in which case they do not result in systematic cost of capital differences.
To explore these issues, we analyze variables that capture cross-country differences in
securities regulation, i.e., disclosure rules and enforcement. We build on a recent study by La

15
Porta et al. (2003) analyzing the role of securities regulation for financial market development.
Their study provides an index for a country’s disclosure requirements applicable to equity
offerings at the largest stock exchange. It consists of several sub-indices scoring disclosure
requirements in the areas of directors’ compensation, ownership structure and inside ownership,
contracts and related-party transactions.
The disclosure requirements index is our primary variable to measure international
differences in disclosure rules. We do not use variables that capture disclosure practice, such as
the CIFAR index, because our study focuses on the role of legal institutions and securities
regulation. Variables such as the CIFAR index also capture voluntary disclosures by firms,
which makes it harder to attribute the estimated effects to securities regulation. We further
address this issue in our sensitivity analyses in Section 4.2.
La Porta et al. (2003) also provide two indices for the enforcement of securities regulation.
The public enforcement index is comprised of various sub-indices and measures the power of the
market supervisor and the severity of the legal sanctions. The burden of proof index measures
how difficult it is for investors to recover losses from directors, distributors of securities (e.g.,
investment banks) and accountants. It can be thought of as a private enforcement index.
In addition, we use the rule of law as an enforcement variable. This variable stems from La
Porta et al. (1997) and broadly captures the overall quality of the legal system, e.g., how well a
country’s laws are enforced. It has been extensively used in the literature as a general
enforcement variable.12 The other two variables, burden of proof and public enforcement, are
more specific to the enforcement of securities regulation.
12 La Porta et al. (1997) provide several other variables capturing the effectiveness of the legal system. They are all highly correlated with the rule of law variable. Aggregating them into an enforcement variable yields similar results. See also Berkowitz et al. (2003).

16
Table 4 presents the regression results using the full set of controls. The findings for the
other models including fewer controls are very similar and typically stronger than those reported
in Table 4. We find that disclosure requirements in securities offerings are negatively and
significantly associated with the level of the cost of capital. The effect is roughly 1.1% or 110
basis points, going from the 25th to the 75th percentile of the disclosure requirements index.
Similarly, the two enforcement variables that are specific to securities regulation, i.e., burden of
proof and public enforcement, are negatively and significantly associated with the cost of capital.
The difference in cost of capital between the 25th and the 75th percentile is roughly 70 basis
points for either variable. The rule of law variable exhibits a negative coefficient as well.
However, in the full model, the effect is not significant at conventional levels.
We extend our analysis to capture both rules and enforcement simultaneously because prior
research suggests that rules are unlikely to be effective without proper enforcement (e.g.,
Bhattacharya and Daouk, 2002; Berkowitz et al., 2003). However, this logic implies that the
rules and enforcement variables should exhibit a relatively high correlation, which may cause
multi-collinearity problems. We find that this problem arises for the three securities regulation
variables from La Porta et al. (2003), which exhibit correlations around 0.50 or higher.
Bearing this issue in mind, we jointly introduce the disclosure requirements index and one of
the enforcement variables into the model. For rule of law, we find that both variables are
negatively and significantly associated with the cost of capital, suggesting that both rules and
enforcement matter. Using the burden of proof index as enforcement variable, only the
disclosure requirements variable is significant. We obtain a similar result when we jointly
introduce the disclosure and the public enforcement indices. The insignificance of the
enforcement variables are likely to be manifestations of the collinearity problem discussed

17
above, but the coefficient magnitudes also seem to indicate that with respect to the cost of
capital, disclosure requirements are more important than the associate enforcement mechanisms.
However, separately adding a rule and an enforcement variable to the model does not
properly capture the complementary nature of the underlying constructs. That is, securities
regulation is unlikely to be effective if either disclosure rules or enforcement of these rules is
weak. To capture this complementary relation and address the collinearity issue, we conduct a
factor analysis for the four institutional variables. We find that there are two principal factors in
the data. The first factor exhibits high loadings for all three variables specific to securities
regulation, indicating that all three variables capture the same construct, presumably the overall
effectiveness of a country’s securities regulation. The second factor displays high loadings with
the rule of law and to a lesser extent with the disclosure requirements variable. We view this
factor as capturing the overall quality of the legal system.
Based on these findings, we summarize the four institutional variables using the first two
principal components. Introducing them into the model, we find that both variables are
negatively associated with the cost of equity capital (last column in Table 4). These findings
suggest that both the effectiveness of securities regulation and the overall quality of a country’s
legal system matter for the cost of equity capital.
4.2 Sensitivity of the Findings
We conduct a number of sensitivity analyses to validate our findings. First, we address
concerns about correlated omitted variables. Next, we address potential econometric problems,
e.g., serial correlation and endogeneity of the institutional variables. Finally, we analyze whether
our findings are sensitive to sample composition. Table 5 summarizes these sensitivity analyses.
For brevity, we tabulate only the coefficients and t-statistics of the institutional variables.

18
Prior work shows that per-capita GDP partially explains differences in financing, ownership,
and payout policies across countries. Consequently, we re-estimate our primary regressions
using per-capita GDP as an additional control variable. We find that the coefficient on GDP is
generally negative, but never significant. Panel A in Table 5 shows that the previously
documented relations between the institutional variables and the cost of capital are not affected
and, if anything, become slightly more significant once GDP is included into the model.
Notably, the rule of law variable becomes significant at the 10% level.
Next, we investigate whether our results are robust to controls for the size of a country’s
equity market. La Porta et al. (1997 and 2003) provide evidence that equity market development
is an outcome of strong legal institutions. For this reason, equity market development may not
be an appropriate right-hand side variable due to its endogenous relation with the legal variables.
But we are not interested in the effect of equity market size per se; we solely test whether our
results are sensitive to its inclusion in the model. Using the yearly ratio of equity market
capitalization to GDP as a control, we find that our results and inferences are not materially
affected (Panel A, Table 5). The coefficients of the institutional variables slightly increase in
magnitude and statistical significance compared to those reported in Table 4.13
We further check whether differences in voluntary disclosures influence our findings. The
cost of capital estimates also reflect firms’ voluntary disclosure practices. Thus, to the extent
that firms can privately commit to certain disclosures, we may overstate the effect of securities
regulation. To address this concern and capture variation in disclosure practice, we introduce the
CIFAR disclosure index as an additional control variable (e.g., Bushman et al., 2003). We lose
13 We also check whether our results are robust to controls for differences in market liquidity (e.g., Amihud and Mendelson, 1986). Our results are very similar to those in Table 4 if we add yearly share turnover to the model.

19
six country-year observations, as the index is not available for Sri Lanka. We find that the
coefficient on the CIFAR index has a negative sign, but is only marginally significant. Our
institutional variables continue to be significant, although the coefficients are slightly attenuated
(Panel A, Table 5). Thus, our results do not appear to be driven primarily by differences in
firms’ voluntary disclosures.14
A different concern is that our design assumes that differences in the nominal risk-free rate
stem only from differences in expected inflation rates. Although this assumption is common in
the international finance literature, it is likely that real interest rates differ across countries,
reflecting among other things different saving rates or interest rate regimes.15 Thus, it would be
desirable to control for the real risk-free rate in each country. However, such rates are not
readily available. Short-term interest rates on government securities capture such differences,
but they are not truly risk-free for most emerging market economies and likely to reflect the
quality of a country’s institutional structure. For this reason, our main regressions follow the
standard approach controlling for inflation differences only. To check the sensitivity of our
results to this approach, we replace the proxy for the expected inflation rate with the local short-
term interest rate using yields of local treasury bills, central bank papers or inter-bank loans
provided by Datastream. The last row of Panel A in Table 5 shows that the institutional
variables continue to be significant and that the results are very similar to those reported in
Table 4.
14 Alternatively, we include a country’s mean analyst following as an additional control variable because Lang and Lundholm (1996) show that analyst following and firms’ voluntary disclosures are related. The results are very similar to those reported in Table 4.
15 Return-based studies typically convert local currency returns to US$ returns and use the US T-bill yield as risk-free rate (e.g., Harvey, 1991), assuming that inflation differences are properly reflected in the exchange rates and time preferences are similar across countries.

20
The preceding tests alleviate concerns that our results are driven by correlated omitted
variables. We now address concerns about the endogeneity of our right-hand side variables.
One issue is that market-based control variables may also reflect the effects of legal institutions.
For instance, La Porta et al. (2002) show that well-functioning legal institutions lead to higher
equity valuations, i.e., to differences in book-to-market ratios and market capitalizations.
Similarly, good legal institutions may manifest in lower return variability. In principle, such
effects should make it harder for us to find significant relations for the institutional variables
once market-based controls are included.
To be sure, we re-estimate our models using accounting-based controls, which are less
susceptible to the above effects. That is, we replace market capitalization, return variability and
book-to-market ratio with total assets and financial leverage, and scale the forecast bias variable
by assets (rather than price) per share. Panel B of Table 5 reports the results from these
regressions. All four institutional variables are highly significant and have the predicted sign.16
A remaining issue is that the institutional variables themselves may be endogenous. The
concern is less reverse causality than selection bias, as countries choose their securities
regulation. To address this issue, we need an instrument that predicts securities regulation at the
first stage but is not correlated with the cost of equity capital at the second stage (except through
securities regulation). Several prior studies use a country’s legal origin as an instrument because
they have been determined a long time ago, but at the same time are correlated with many
institutional variables (e.g., La Porta et al., 2003; Leuz et al., 2003). We follow these studies and
find that a binary variable indicating an English legal origin is a valid instrument for three of the
16 As similar argument can be made for several variables entering the construction of our proxy for macro-economic variability, we also drop this variable from the model. Again, the findings are very similar to those in Table 4.

21
four institutional variables. We are unable to find a proper instrument for the rule of law
variable.
Thus, we estimate three instrumental variable (IV) regressions using the accounting-based
model, which is more likely to have exogenous controls. Panel B of Table 5 shows that the three
institutional variables continue to be negatively associated with the cost of capital. The IV
coefficient on the disclosure requirements index is similar to the OLS coefficient and even
increases in magnitude for the burden of proof and public enforcement indices.17 These findings
alleviate endogeneity concerns for the securities regulation variables. In addition, these findings
mitigate concerns that our main results are driven by correlated omitted variables. By
construction, an IV regression assures that second-stage residuals are uncorrelated with the
instrumented variable, i.e., the securities regulation variables.
Next, we address that our analysis is based on pooled regressions where the same country
enters the sample up to ten times. Moreover, a country with a below-average cost of capital in
one year is likely to have a lower-than-average cost of capital in other years. Such serial
correlation among the cost of capital estimates may result in biased t-statistics (and precludes
Fama-MacBeth regressions). Thus, we estimate Prais-Winsten regressions with panel-corrected
standard errors. These regressions allow for heteroscedasticity, within-panel serial correlation,
and cross-sectional dependence, and are more conservative than feasible generalized least
squares estimation (e.g., Beck and Katz, 1995; Greene, 2000).18 Panel B of Table 5 shows that
three of the four institutional coefficients are significant at the 5% level, except the public
enforcement variable, which is only marginally significant (p=0.118).
17 The first-stage F-statistics are 160.01, 37.36 and 109.26, respectively, suggesting that there is no problem with weak instruments. Note further that the IV results are similar if the full (market-based) model is used.
18 We also estimate regressions using feasible generalized least squares. The results and inferences are similar.

22
We also estimate country-fixed effects based on firm-level regressions and then regress the
country-fixed effects on the institutional variables. This approach has two advantages. First,
each country enters the regression only once. Second, it controls economic heterogeneity across
countries at the firm-year level, which is likely to be more precise and addresses the question of
whether aggregating the data to country-year medians influences the results.
Panel C of Table 5 reports regressions of the country-fixed effects on the institutional
variables. In a second set of regressions, we include the per-capita GDP as an additional control.
In both sets of regressions, the disclosure requirements index exhibits a significantly negative
association with the country-fixed effects and the coefficient magnitude is very similar to
Table 4. The burden of proof variable also produces results that are quite similar to those of
Table 4. Interestingly, the rule of law variable exhibits a significantly negative and much larger
coefficient than before. In contrast, the public enforcement index is not significant.
As the country-fixed effects capture observed and unobserved heterogeneity in the cost of
capital across countries, it is also interesting to see how much variation in the fixed effects is
explained by the institutional variables. We find that the disclosure requirements index and, in
particular, the rule of law variable explain a substantial portion of the variation in the fixed
effects. When introduced together, the two variables are highly significant and explain more
than 29% of the total variation (not tabulated).19
Finally, we investigate two issues related to sample composition. First, the securities
regulation variables from La Porta et al. (2003) are measured as of December 2000. However,
our analysis exploits data from 1992 to 2001 and hence assumes that securities regulation stays
19 We obtain similar results for the first two principal components of the institutional variables, SECREG and LEGQUAL. See also Table 4.

23
constant over the sample period. Presumably, securities regulation and legal institutions change
only slowly. We nevertheless perform regressions using data from 2000 and 2001, i.e., the time
period surrounding the measurement of the three securities regulation variables. As shown in the
last row of Panel B in Table 5, the results and inferences in these regressions are similar to those
in Table 4. However, the coefficients increase relative to Table 4, suggesting that measurement
error in the institutional variables over the earlier years attenuates the coefficients in Table 4.
Next, we investigate whether a country-year analysis gives undue weight to small countries
and ignores that the medians are based on varying numbers of firm-year observations. We
address this issue with a weighted least squares regression giving more weight to country-year
observations that are based on more firm-year observations and presumably more precise. The
results (not tabulated) are similar to those reported in Table 4, except for the public enforcement
index, which is no longer significant. We also note that the magnitudes of the estimated
coefficients on the institutional variables become smaller. As these regressions essentially give
more weight to integrated countries, the next section suggests an explanation for this finding.
Overall, the results appear to be quite robust. Firms in countries with extensive disclosure
rules and strict enforcement enjoy a lower cost of equity capital than firms in countries with
weak securities regulation. The effects are strongest for rules that mandate the disclosure of
information to investors, but they are also present for institutions that facilitate the private
enforcement of contracts, either by providing an effective legal system or by lowering the burden
of proof, and to a lesser extent for public enforcement institutions.
5. Do the Effects Differ in Integrated and Segmented Markets?
In this section, we analyze whether the previously documented effects differ by market
integration. Both theory and prior empirical evidence suggest that country-specific factors

24
become less important in asset pricing as markets become more integrated (e.g., Bekaert and
Harvey, 1995; Stulz, 1999). Similar evidence is available from ADR programs, which result in
market integration at the firm level (e.g., Errunza and Miller, 2000). The basic idea is that, if
investors are allowed to invest freely around the world, risk is shared and priced globally, which
should reduce firms’ cost of capital (Karolyi and Stulz, 2002). Thus, in integrated markets, the
effects of legal institutions of any particular country may become partially diversifiable.
Similarly, Lombardo and Pagano (2000a) show in an analytical model that the effects of legal
institutions may depend on whether countries’ capital markets are integrated or segmented.
To explore these issues, we use two binary variables to capture capital market integration.
The first variable is equal to one if the country’s equity market is in the MSCI Developed
Markets Index and zero otherwise. The second variable is based on portfolio flows across
countries and captures more directly to what extent capital flows freely across borders. We
create a binary variable and assign the value of one (zero) if the sum of a country’s portfolio
inflows and outflows divided by its GDP is above (below) the median.20 Panel C in Table 1
provides descriptive information on the two classifications.
We then interact the integration dummies with the institutional variables from Table 4. We
introduce both the main and the interaction effect into the model. In essence, this specification
estimates separate slope coefficients for the institutional variables in integrated and segmented
markets. Table 6 presents the regression results using the full set of controls. For brevity, we
tabulate only the interaction effect and the main effects of the institutional variable and the
respective integration proxy.
20 In additional analyses (not tabulated), we use the correlation of a country’s equity market index with the MSCI world market index estimated from 1990 to 1995 by Erb et al. (1996) as an integration variable. We assign countries exhibiting a correlation above (below) the median a value of one (zero). The results using this integration variable are very similar to those reported in Table 6.

25
We find that the main effect of capital market integration is negative and significant in all
specifications. That is, capital market integration is associated with a lower cost of equity
capital, confirming prior findings in the international finance literature (see Karolyi and Stulz,
2002, for a survey). The interaction effects are positive and significant in all regressions. This
finding indicates that the effect of securities regulation is smaller in integrated markets.21
Despite this effect, extensive disclosure requirements continue to be negatively associated with
the cost of equity capital in integrated markets. The effect of disclosure regulation in integrated
markets is around 0.5% or 50 basis points going from the 25th to the 75th percentile of the
disclosure variable. For the enforcement variables, the interaction effect is generally of a similar
magnitude as the main effect, resulting in an insignificant Wald test for the sum of the
coefficients α1 and α2. This finding suggests that, among integrated markets, there is generally
no relation between the enforcement variables and the cost of equity capital.
Correspondingly, the marginal effects of extensive disclosure requirements and strong
enforcement are much larger in segmented countries. For instance, using the portfolio flows as
partitioning variable, the estimated effect of disclosure requirements on the cost of equity capital
is over 220 basis points, going from the 25th to the 75th percentile of the disclosure variable. This
decline in the cost of capital translates roughly into a 20-percent market value premium, holding
expected cash flows constant.22 Thus, in segmented markets, cost of capital differences alone
can explain substantial valuation effects related to countries’ legal systems, as for instance in
La Porta et al. (2002).
21 This finding also provides an explanation for why Lee et al. (2003) find insignificant coefficients for three institutional variables from La Porta et al. (1998) included in some of their models. Their sample comprises firms from the G7 countries, which probably have the most integrated capital markets.
22 Evaluating at the sample mean, we can roughly gauge the effect as follows: (1/(0.1177-0.022)/(1/0.1177)).

26
We again conduct a number of robustness checks. First, we estimate separate regressions
for integrated and segmented markets using the two binary integration variables to partition the
sample. In these regressions, the coefficients of the other control variables are not constrained to
be constant across integrated and segmented markets. The results of these regressions are not
tabulated as they are very similar to the findings reported in Table 6.
Second, as in Section 4.2, we check whether our results are sensitive to the inclusion of
controls for per-capita GDP, equity market size or voluntary disclosures. Adding either of the
variables to the model or using local short-term rates instead of the expected inflation proxy does
not materially alter the results presented in Table 6. The results are also similar if we use Prais-
Winsten regressions with panel-corrected standard errors instead of OLS regressions.
Finally, we conduct our analysis based on the country-fixed effects introducing the
integration variables as main and interaction effect. We again find that the effects are
substantially attenuated for integrated capital markets and much stronger for segmented
economies. Thus, the results in Table 6 appear to be fairly robust.
6. Conclusion
In this paper, we examine international differences in firms’ cost of equity capital across 40
countries. We analyze whether differences in countries’ legal institutions and, in particular, in
securities regulation are systematically related to international cost of capital differences. From a
theoretical perspective, this link is a priori not obvious. It depends on the degree of market
integration and the question of whether disclosure regulation and legal enforcement manifest in
systematic risk differences across countries.
Our analysis is based on four different models estimating the ex ante cost of equity capital
implied in share prices and analyst forecasts. We estimate the cost of capital for 40 developed

27
and developing countries between 1992 and 2001 and document substantial variation across
countries. These differences are largely explained by traditional risk factors, i.e., size, volatility
and the book-to-market ratio, as well as country factors capturing international differences in
inflation rates and macroeconomic variability. Together, these factors explain more than 60% of
the country-level variation in the implied cost of equity capital around the world. These findings
suggest that implied cost of capital models provide reasonable estimates in international settings.
When we introduce legal institutions into the analysis, we find that firms in countries with
strong legal institutions display lower levels of cost of capital than they do in countries with
weak legal systems, even after controlling for risk and country factors. In particular, the cost of
capital is systematically lower in countries with strong securities regulation, i.e., extensive
disclosure rules and strong legal enforcement. Our findings suggest that the effects are strongest
for institutions that mandate disclosure to investors, but they are also present for other
institutions that facilitate the enforcement of financial contracts, either by providing effective
courts or by lowering the burden of proof in securities litigation.
We further investigate to what extent the effect of the legal institutions and securities
regulation differs by market integration and economic development. Using several proxies, we
find that the effects are strongest for markets that are least integrated. In fact, the effects are
substantially smaller or even insignificant among countries with integrated capital markets.
These findings are consistent with the notion that, in integrated markets, risk is priced globally.
Furthermore, they suggest that, for integrated markets, prior evidence showing that corporate
valuations increase with the quality of the legal institutions primarily reflects differences in the
cash flows, e.g., stemming from expropriation, rather than cost of capital effects. For segmented

28
markets, our findings confirm the role of local factors and show that the effect of securities
regulation on the cost of equity capital can be substantial.
Finally, several caveats are in order. First, our study focuses exclusively on the link
between legal institutions and firms’ equity cost of capital. It is conceivable that countries with
weak securities regulation and relatively high cost of equity capital have created institutions that
lower the cost of debt. Consequently, our evidence does not speak to firms’ overall (or
weighted) cost of capital.
Second, as many legal institutions are complementary, variables characterizing countries’
legal institutions tend to be highly correlated. For this reason, it is difficult to disentangle the
marginal effects of particular legal institutions. Thus, our evidence should be interpreted
cautiously, keeping complementarities among legal institutions in mind.
Lastly, our results may be subject to sample truncation bias. The data requirements of
implied cost of capital models screen out lesser known firms without analyst coverage.
Moreover, we do not observe firms for which the cost of publicly traded equity capital is
prohibitive and which are not listed. Both effects are more likely to occur in countries with weak
institutions, suggesting that, in these countries, the better known and more international firms
enter our sample. As these firms are likely to have a lower cost of equity capital, the effects of
legal institutions and securities regulation may be understated in our study.

29
APPENDIX
Implied Cost of Equity Capital Models
Claus and Thomas (2001):
( )( )
( )( )( )( )T
CTCT
TtCTTtT
CT
tCTttt
rgrgbvrx
rbvrx
bvP+−
+⋅−+
+⋅−
+= −+
=
−+∑ 11ˆ
1
ˆ 1+
1
1+
ττ
ττ
Model-specific assumptions: The model is based on residual income valuation. It uses earnings per share forecasts up to five years ahead to derive the expected future abnormal earnings sequence. At time T = 5, it is assumed that nominal (abnormal) earnings grow at a rate g equal to the expected inflation rate. As a proxy for g, we use the yearly median of country-specific, one-year-ahead realized monthly inflation rates. Note that g sets a lower bound to the cost of capital estimates. Gebhardt, Lee and Swaminathan (2001):
( )( )
( )( )TGLSGLS
TtGLSTtT
GLS
tGLSttt rr
bvrxr
bvrxbvP+
⋅−++
⋅−+= ++
=
−+∑ 1ˆ
1ˆ +1
1
1+
ττ
ττ
Model-specific assumptions: The model is based on residual income valuation. It assumes explicit (abnormal) earnings forecasts for a period of three years. Thereafter, future earnings are derived by linearly fading the forecasted accounting return on equity to the sector-specific median return. We compute the historic three-year averages in a given country and year for the industrial, service and financial sector. We replace negative target returns by the country-year medians. From T = 12 on abnormal earnings are assumed to remain constant. Ohlson and Jüttner-Nauroth (2000): ( ) ( ) ( )ltOJltttOJstOJtt grgxdrgrxP −−⋅+⋅= +++ 111 ˆˆˆ Model-specific assumptions: Following the implementation in Gode and Mohanram (2002), the short-term growth rate gst is estimated as the average between the forecasted percentage change in earnings from year t+1 to t+2 and the five-year growth forecast provided by financial analysts on I/B/E/S. The model requires a positive change in forecasted earnings. The long-term earnings growth rate glt incorporates the effect of inflation. We use the yearly country-specific median of one-year-ahead realized monthly inflation rates. Note that glt provides a lower bound for the cost of capital estimates. Modified PEG ratio model by Easton (2004): ( ) 2
112 ˆˆˆ PEGttPEGtt rxdrxP +++ −⋅+= Model-specific assumptions: Abnormal earnings are defined as forecasted earnings for period t+2, plus the earnings from re-invested, period t+1 dividends, less normal earnings expected based on the period t+1 forecast. The model assumes that so-defined abnormal earnings persist in perpetuity and requires positive changes in forecasted earnings. Notes:
tP = Market price of a firm’s stock at date t
tbv = Book value per share at the beginning of the fiscal year
τ+tbv = Expected future book value per share at date t+τ , where ττττ ++−++ −+= tttt dxbvbv ˆˆ1
τ+tx̂ = Expected future earnings per share for period (t+τ–1, t+τ) using either explicit analyst forecasts or future earnings derived from growth forecasts g, gst, and glt, respectively
τ+td̂ = Expected future net dividends per share for period (t+τ–1, t+τ), derived from the dividend payout ratio times the earnings per share forecast τ+tx̂
ltst ggg ,, = Expected (perpetual, short-term or long-term) future growth rate
PEGOJGLSCT rrrr ,,, = Implied cost of capital estimates calculated as the internal rate of return solving the above valuation equations, respectively
30
APPENDIX (continued)
General Assumptions and Data Requirements
To calculate cost of capital estimates we require current stock price data and analyst
forecasts for at least two periods ahead. We obtain this information from the I/B/E/S database. If
explicit forecasts for the periods t+3 through t+5 are missing, we use analyst forecasts of long-
term earnings growth instead. We use only positive earnings forecasts and growth rates.
All estimates are mean analyst consensus forecasts and are taken as of month +10 after the
fiscal-year end. The time lag ensures that financial data are publicly available at the time we
compute the cost of capital estimate. As a sensitivity check, we also use data from month +7 and
obtain very similar results.
Net dividends are forecasted up to the finite forecast horizon as a constant fraction of
expected future earnings per share. We define the dividend payout ratio as the historic three-year
average for the firm. If the average cannot be computed (because of missing data) or is outside
the range of zero and one, we replace it by the country-year median payout ratio. Expected future
inflation rates and the implied cost of equity capital estimates are restricted to be positive.
Negative cost of capital estimates are set equal to missing. Negative or missing estimates for the
expected inflation are replaced by the long-run median inflation for the country estimated from
1992 to 2001. We obtain all financial data from the Worldscope database. Inflation data are
gathered from the Datastream and Worldbank databases.
To check whether our results are driven primarily by inflation and growth assumptions in
the terminal value computations, we re-estimate the models using a constant 3% inflation rate for
all countries. The resulting estimates have a slightly lower variance, as expected, but exhibit
correlations above 0.9 with the original estimates and produce very similar results.

31
References
Amihud, Yakov and Haim Mendelson, 1986, Asset pricing and the bid-ask spread, Journal of Financial Economics 32, 223-249.
Beck, Nathaniel and Jonathan Katz, 1995, What to do (and not to do) with time-series cross-section data, American Political Science Review 89, 634-647.
Bekaert, Geert and Campbell Harvey, 1995, Time-varying world market integration, The Journal of Finance 50, 403-444.
Berkowitz, Daniel, Katharina Pistor, and Jean-François Richard, 2003. Economic development, legality and the transplant effect, European Economic Review 47, 165-195.
Bhattacharya, Utpal and Hazem Daouk, 2002, The world price of insider trading, Journal of Finance 57, 75-108.
Botosan, Christine and Marlene Plumlee, 2002, Assessing the construct validity of alternative proxies for the expected cost of equity capital, Working Paper, University of Utah.
Botosan, Christine, 1997, Disclosure level and the cost of equity capital, The Accounting Review 72, 323-349.
Bushman, Robert, Joseph Piotroski, and Abbie Smith, 2003, What determines corporate transparency? Journal of Accounting Research, forthcoming.
Campbell, John, 1996, Understanding risk and return, Journal of Political Economy 104, 298-345.
Claus, James and Jacob Thomas, 2001, Equity premia as low as three percent? Evidence from analysts’ earnings forecasts for domestic and international stock markets, Journal of Finance 56, 1629-1666.
Easley, David and Maureen O’Hara, 2002, Information and the cost of capital, Working Paper, Cornell University.
Easton, Peter, 2004, PE ratios, PEG ratios, and estimating the implied expected rate of return on equity capital, The Accounting Review 79, forthcoming.
Erb, Claude, Campbell Harvey, and Tadas Viskanta, 1996, Expected returns and volatility in 135 countries, The Journal of Portfolio Management, 46-58.
Errunza, Vihang and Darius Miller, 2000, Market Segmentation and the Cost of Capital in International Equity Markets, Journal of Financial and Quantitative Analysis 35, 577-600.
Fama, Eugene and Kenneth French, 1992, The cross sections of expected stock returns, The Journal of Finance 47, 427-466.

32
Fama, Eugene and Kenneth French, 1993, Common risk factors on the returns of stocks and bonds, Journal of Financial Economics 33, 3-57.
Fama, Eugene and Kenneth French, 1997, Industry costs of equity, Journal of Financial Economics 43, 153-194.
Ferson, Wayne and Campbell Harvey, 1998, Fundamental determinants of national equity market returns: A perspective on conditional asset pricing, Journal of Banking & Finance 21, 1625-1665.
Francis, Jennifer, Ryan LaFond, Per Olsson, Katherine Schipper, 2003, Costs of capital and earnings attributes, Working Paper, Duke University and University of Wisconsin.
Frost, Carol, Elizabeth Gordon, Andrew Hayes, 2001, Stock exchange disclosure and market liquidity: An analysis of 50 international exchanges, Working paper, Rutgers University and Ohio State University.
Gebhardt, William, Charles Lee, and Bhaskaran Swaminathan, 2001, Toward an implied cost of capital, Journal of Accounting Research 39, 135-176.
Gode, Dan and Partha Mohanram, 2002, Inferring cost of capital using the Ohlson-Juettner model. Working paper, New York University.
Greene, William, 2000, Econometric analysis, 4th edition, Upper Saddle River, NJ: Prentice-Hall.
Guay, Wayne, S. P. Kothari, and Susan Shu, 2003, Properties of implied cost of capital using analysts’ forecasts, Working Paper, The Wharton School, MIT, and Boston College.
Hail, Luzi, 2002, The impact of voluntary corporate disclosures on the ex-ante cost of capital for Swiss firms, European Accounting Review 11, 741-773.
Harvey, Campbell, 1991, The world price of covariance risk, The Journal of Finance 46, 111-158.
Harvey, Campbell, 1995, Predictable risk and returns in emerging markets, The Review of Financial Studies 8, 773-816.
Hope, Ole-Kristian, 2003a, Firm-level disclosures and the relative roles of culture and legal origin, Working Paper, University of Toronto.
Hope, Ole-Kristian, 2003b, Disclosure practices, enforcement of accounting standards and analysts' forecast accuracy: An international study, Journal of Accounting Research 41, 235-273.
Karolyi, Andrew and Rene Stulz, 2002, Are financial assets priced locally or globally? NBER Working Paper 8994.

33
Lang, Mark and Russell Lundholm, 1996, Corporate disclosure policy and analyst behavior, The Accounting Review 71, 467-492.
La Porta, Rafael, Florencio Lopez-de-Silanes, Andrei Schleifer, 2003, What works in securities laws? Working paper, Harvard University and Yale University.
La Porta, Rafael, Florencio Lopez-de-Silanes, Andrei Schleifer, Robert Vishny, 1997, Legal determinants of external finance, Journal of Finance 52, 1131-1150.
La Porta, Rafael, Florencio Lopez-de-Silanes, Andrei Schleifer, Robert Vishny, 2000a, Agency problems and dividend policies around the world, The Journal of Finance 55, 1-33.
La Porta, Rafael, Florencio Lopez-de-Silanes, Andrei Schleifer, Robert Vishny, 2000b, Investor protection and corporate governance, Journal of Financial Economics 58, 3-27.
La Porta, Rafael, Florencio Lopez-de-Silanes, Andrei Schleifer, Robert Vishny, 2002, Investor protection and corporate valuation, The Journal of Finance 57, 1147-1170.
Lee, Charles and David Ng, 2002, Corruption and international valuation: Does virtue pay?, Working paper, Cornell University.
Lee, Charles, David Ng and Bhaskaran Swaminathan, 2003, The cross-section of international cost of capital, working paper, Cornell University.
Leuz, Christian and Robert Verrecchia, 2000, The economic consequences of increased disclosure, Journal of Accounting Research 38, 91-124.
Leuz, Christian, DJ Nanda and Peter Wysocki, 2003, Earnings management and investor protection: An international comparison, Journal of Financial Economics 69, 505-527.
Levitt, Arthur, 1998, The importance of high quality accounting standards, Accounting Horizons 12, 79-82.
Lombardo, Davide and Marco Pagano, 2000a, Law and equity markets: A simple model, in: Convergence and diversity of corporate governance regimes and capital markets, Luc Renneboog et al. (eds), Oxford University Press.
Lombardo, Davide and Marco Pagano, 2000b, Legal determinants of the return on equity, CSEF Working paper 24.
Obstfeld, Maurice, 1994, Risk-taking, global diversification, and growth, American Economic Review 84, 1310-1329.
Ohlson, James and Beate Jüttner-Nauroth, 2000, Expected EPS and EPS growth as determinants of value, Working paper, New York University.
Solnik, Bruno, 1974, An equilibrium model of the international capital market, Journal of Economic Theory 8, 500-524.

34
Stulz, Rene, 1981, A model of international asset pricing, Journal of Financial Economics 9, 383-406.
Stulz, Rene, 1999, Globalization, corporate finance, and the cost of capital, Journal of Applied Corporate Finance 12, 8-25.
Verrecchia, Robert, 2001, Essays on disclosure, Journal of Accounting and Economics 32, 91-180.

Panel A: Distributional Statistics for the Cost of Capital Estimates
Percentile
Variable N Min. Q2
rCT 358 3.89% 10.72%
rGLS 358 1.32% 8.47%
rOJ 358 6.05% 12.95%
rPEG 358 5.32% 12.34%
rAVG 358 4.57% 11.00%
Panel B: Pearson Correlation Coefficients among Cost of Capital Estimates
Variable
rGLS**
rOJ** **
rPEG** ** **
rAVG** ** ** **
(continued)
TABLE 1
Descriptive Statistics for the Implied Cost of Capital Estimates, Legal and Integration Variables
11.77% 9.81% 13.18% 3.06%
13.08% 11.01% 29.80%
24.30%
0.923
0.957
14.39% 3.32%
r PEG
0.915
0.557
0.499
0.751
0.613
0.949
0.862
0.955
r CT r GLS r OJ
13.77%
8.78%
11.46%
6.50%
11.45%
9.17%
10.48%
15.63%
13.16%
3.53%
3.53%
3.33% 25.23%
24.78%
30.06%
Mean Q1 Q3Standard DeviationMax.
The cost of capital estimates are based on 35,122 firm-year observations from 40 countries between 1992 and2001, for which sufficient Worldscope financial data, I/B/E/S forecast and pricing data, and legal institutionaldata exist. The computations use country-year medians. We have 358 country-years for our analysis, afterexcluding country-years with less than five individual firm observations or with inflation rates above 25%. Theimplied cost of capital estimates, r CT, rGLS, rOJ and rPEG, are derived as the internal rate of return in the Claus andThomas (2001), the Gebhardt et al. (2001), the Ohlson and Jüttner-Nauroth (2000), and the Easton (2004)models, respectively. These models are described in more detail in the Appendix. r AVG is the mean of the fourestimates for the implied cost of equity capital. All estimates use mean analyst consensus forecasts and arecalculated as of month +10 after the fiscal-year end. ** indicates statistical significance at the 1% level (two-tailed).

Panel C: Sample Information, Cost of Capital Estimates, Legal and Integration Variables by Country
CountryArgentinaAustraliaAustriaBelgiumBrazilCanadaChileDenmarkEgyptFinlandFranceGermanyGreeceHong KongIndiaIndonesiaIrelandIsraelItalyJapanKorea (South)MalaysiaMexicoNetherlandsNew ZealandNorwayPakistanPeruPhilippinesPortugalSingaporeSouth AfricaSpainSri LankaSwedenSwitzerlandTaiwanThailandUnited KingdomUnited States
Total (Average)
0.88
0.49
0.23 0.44 0.60 0.67
0.29 0.29 0.31 0.38
0.63 0.77 0.50 0.88
0.29 0.40 0.25 0.50
0.00 0.54 0.83 0.15
0.44 0.02 0.88 0.69
0.15 0.46 0.83 0.75
0.27 0.31 0.48 0.69
0.13 0.56 0.90 0.60
PUBENF0.50 0.85 0.17
0.75 1.00
0.56
0.25 0.50 0.75 0.50
0.75 0.75 0.75 0.33
0.33 1.00 0.75 0.75
0.33 0.75 0.33 0.25
0.17 0.75 0.75 0.75
0.75 0.75 0.33 0.75
0.75 0.25 0.67 0.75
0.50 0.25 0.17 0.50
1.00
0.74
PROOF0.17 0.75 0.08 0.17 0.50 1.00
1.00 0.85 0.63 0.86
0.44 0.78 0.19 1.00
0.25 0.27 0.87 0.86
1.00 1.00 1.00 0.30
0.90 0.54 0.68 0.54
0.40 0.78 0.48 0.83
0.92 0.62 0.82 0.42
1.00 0.42 1.00 0.90
0.58
LAW0.54 1.00 1.00 1.00 0.63 1.00 0.70
1.00
0.25 0.25 0.00 0.92 0.17 0.25 0.33 0.42 0.58
0.50 0.83 0.92 0.83
0.75 0.50 0.67 0.58
0.17 0.83 0.50 1.00
0.50 0.42 0.58 0.50
0.67 0.67 0.92 0.58
0.50 0.58 0.83 0.75
0.25 0.50 1.00 0.33
DISREQ
20
0011
1011
0110
0100
0001
1011
0100
0111
0101
0011
11
35,122 358 12.09% 21
4,267 10 9.75% 4,155
00
11
10
10
00
00
11
01
00
11
10
00
01
11
01
01
01
11
10.75 0.50 0
10 10.15% 433 10 12.17% 699 10 9.92%
TABLE 1 (continued)
948 10 10.17% 818 10 11.52%
59 6 15.64% 636 10 10.18% 941 9 15.86% 855 10 9.35% 179 9 9.95% 324 10 12.99%
58 6 15.93% 75 7 17.21%
478 10 12.51% 327 10 10.55%
FLOW
1,063 10 11.74%
r AVGFirm-Years Country-Years DEV
260 8 14.82% 1,248 10 9.75%
970 10 14.29% 3,391 10 6.48%
759 10 9.92% 48 5 10.95%
183 8 12.32% 404 9 14.93% 728 9 14.01%
1,193 10 13.42% 316 8 10.80%
1,598 10 9.62% 2,116 10 9.86%
491 10 12.60% 15 2 21.00%
575 10 10.30% 147 10 12.15%
1,560 10 10.04% 324 7 18.55% 478 9 10.28% 228 8 10.49%
8 1,596 10 10.01%
179 11.40%
The first two columns provide the number of firm- and country-years by country. r AVG is the mean of the four estimates for the implied cost of equity capital as described in theAppendix. The table reports time-series averages of r AVG. DISREQ measures the level of disclosure regulation based on an index of disclosure requirements in securities offeringsfrom La Porta et al. (2003). The level of enforcement is measured by three alternative variables from La Porta et al. (1997 and 2003, respectively): (1) LAW represents the rule oflaw index (divided by 10), (2) PROOF is the burden of proof index, and (3) PUBENF equals the index of public enforcement. The two binary measures of capital marketintegration are: (1) DEV is equal to one if the country’s equity market is classified as developed in the MSCI database, (2) FLOW is equal to one for countries with above-medianportfolio inflows and outflows in percent of the GDP, as reported by the IMF for 2001.

Panel A: Distributional Statistics
Percentile
Variable
INFL
SIZE
BETA
RVAR
BMR
MVAR
FBIAS
Panel B: Pearson Correlation Coefficients
Variable INFL SIZE BETA RVAR BMR MVAR FBIAS
SIZE
BETA
RVAR ** ** **
BMR ** ** **
MVAR ** ** ** ** **
FBIAS ** ** **
rAVG** ** ** ** ** ** **
TABLE 2
Descriptive Statistics for the Control Variables
0.200 0.018 0.002 0.007 358 0.007 -0.055 0.000
0.284
0.367
0.010-0.041
0.427 0.211
0.034
0.482 0.151
0.136
0.298
-0.354
-0.021
-0.236
-0.086
-0.2440.204
0.047 -0.334
-0.453 -0.154 7.933 1.626
358 3.54% -3.81% 1.52% 2.61% 4.62% 20.02% 3.33%
358 709.0 32.5 283.8 458.1 718.3 8,898.6 1,024.0
Q3 DeviationMax.N Mean Min. Q1
Standard
358 0.104 0.046 0.077 0.099 0.118 0.273 0.036
Q2
358 0.600 0.131 0.436 0.573 0.696 1.895 0.234
358 -0.011 -1.307 -0.764
358 0.863 -0.653 0.592 0.788 1.060 2.708 0.475
0.1540.430
0.188
0.347
-0.005
0.233
0.381
0.210
0.405
The sample is based on 35,122 firm-year observations from 40 countries between 1992 and 2001, for whichsufficient Worldscope financial data, I/B/E/S forecast and pricing data, and legal institutional data exist. The tablereports country-year medians. We have 358 country-years for our analysis, after excluding country-years with lessthan five individual firm observations or with inflation rates above 25%. INFL is the yearly median of country-specific, one-year-ahead realized monthly inflation rates. SIZE stands for US$ market value of outstanding equity(in millions). We use the natural log of the size variable to compute correlations. BETA is measured relative to theworld market index and estimated based on a five-year market model regression. We require at least 24 monthlyobservations to calculate market beta. RVAR is the returns variability computed as annual standard deviation ofmonthly stock returns. BMR is the ratio of accounting book value to market value of equity. Financial data aremeasured as of the fiscal-year end, BETA, RVAR and the cost of capital as of month +10. MVAR is the firstprincipal component of four proxies for macroeconomic variability: (1) the country-year median standarddeviation of annual earnings per share over the last five years scaled by total assets per share, (2) the country-yearmedian standard deviation of accounting returns on equity over the last five years, (3) the standard deviation of theresiduals from a regression of annual GDP growth rates on a time index over the sampling period, and (4) thecoefficient of variation of yearly average exchange rates (US$ to local currency) over the sampling period. FBIASis the one-year-ahead analyst forecast error (mean forecast minus actual) scaled by forecast-period stock price.rAVG is the mean of the four estimates for the implied cost of equity capital as described in the Appendix. **indicates statistical significance at the 1% level (two-tailed).

Variable
N
Intercept ** * * **
INFL ** ** ** **
SIZE ** ** ** **
BETA ** – – –
RVAR – ** ** **
BMR ** ** ** **
MVAR – – ** **
FBIAS – – –
included included included included
R2
F-Stat ** ** ** **
0.297 0.278 0.286
rAVGit = α0 + α1INFLit + α2SIZEit + α3BETAit + α4RVARit + α5BMRit + α6MVARit
+ α7FBIASit + ∑α jIndustry Controlsit + ∑αkYear Controlst + εit
358
0.134
358
0.112 0.112 0.117
0.133
– -0.009 -0.006 -0.006 -0.006
(2.68)
(5.46)
0.003 0.003
+ 0.024 0.024 0.024
+ 0.195 0.143
(5.36)
(2.59)0.086
(-2.91)
(2.86)
(4.26)
(2.79)
(-2.89)
(2.61)
(4.28)
(5.55)
(-3.44)
(4.01)
(4.10)
61.3%
+
(2.85)
(6.88)
(-4.82)
+
+ 0.358
+ 0.009
(2.58)(2.42)
(1.11)
13.7 15.2 15.0 14.6
58.9% 59.7% 61.1%
358 358
Model 2 Model 3
0.021(3.16)
Industry and Year Controls
TABLE 3
Regression Analysis of the Implied Cost of Capital on Risk and Country Control Factors
Model 4Pred. Sign Model 1
(2.38)
The sample comprises 358 country-year medians from 40 countries over the ten-year period from 1992 to 2001.The dependent variable, rAVG, is the mean of the four estimates for the implied cost of equity capital as describedin the Appendix. INFL is the yearly median of country-specific, one-year-ahead realized monthly inflation rates.SIZE stands for US$ market value of outstanding equity (in thousands). We use the natural log of the size variablein the analysis. BETA is measured relative to the MSCI world market index and estimated based on a five-yearmarket model regression. We require at least 24 monthly observations to calculate market beta. RVAR is thereturns variability computed as annual standard deviation of monthly stock returns. BMR is the ratio ofaccounting book value to market value of equity. Financial data are measured as of the fiscal-year end, BETA,RVAR and the cost of capital as of month +10. MVAR is the first principal component of four proxies formacroeconomic variability: (1) the country-year median standard deviation of annual earnings per share over thelast five years scaled by total assets per share, (2) the country-year median standard deviation of accountingreturns on equity over the last five years, (3) the standard deviation of the residuals from a regression of annualGDP growth rates on a time index over the sampling period, and (4) the coefficient of variation of yearly averageexchange rates (US$ to local currency) over the sampling period. FBIAS is the one-year-ahead analyst forecasterror (mean forecast minus actual) scaled by forecast-period stock price. Industry controls based on theclassification in Campbell (1996) and year controls are included in the regressions but not reported. The tablereports OLS coefficient estimates and t-statistics based on robust standard errors (in parentheses). ** and *indicate statistical significance at the 1% and 5% levels (two-tailed), respectively.

Variable
N
Rules ** ** * * **
Enforcement ** ** * **
Intercept ** ** ** ** ** ** ** **
INFL ** ** ** ** ** ** ** **
SIZE # * * ** # #
RVAR ** # ** ** * ** ** *
BMR ** ** ** ** ** ** ** **
MVAR ** * ** ** ** ** ** **
FBIAS
included included included included included included included included
R2
F-Stat ** ** ** ** ** ** ** **
0.121 0.171
(1.25)
0.155 0.147
(1.31) (1.17)
0.105
0.003
(2.44)
(2.77) (3.55)
0.003
(2.98)
(2.47) (3.52)
(-1.15) (-1.70)
(4.76) (5.47)
0.087
0.003
(2.90)
0.022
(3.87)
0.003
(2.76)
0.021
SECREG &LEGQUAL
358
PUBENF
358
DISREQ &
15.8 14.0 14.0 15.8
0.093
(1.30)
63.8% 63.4% 63.4% 63.9%
0.098
(1.43)
0.091
(1.30)
0.003 0.003
(3.00) (2.92)
0.021 0.023
(3.72) (3.67) (4.16)
(3.57) (2.45)
0.134 0.174 0.175 0.131
(-1.84) (-1.05)
-0.002 -0.003 -0.004 -0.002
0.290 0.266
(3.65) (4.02)
(5.47) (4.93)
0.202 0.151
0.266 0.288
(4.17) (3.51)
0.169 0.182
(-1.97) (-0.74)
-0.023
(-2.28)
-0.005
-0.029
(-3.85)
-0.020-0.016 -0.018
LAW PROOFPUBENF
358 358
PROOFDISREQ & DISREQ &
358 358
(-3.53) (-3.05)
TABLE 4
Regression Analysis of the Implied Cost of Capital on Rules and Enforcement Variables and Additional Controls
rAVGit = α0 + α1DISREQi + α2Enforcementi + α3INFLit + α4SIZEit + α5RVARit + α6BMRit
+ α7MVARit + α8FBIASit + ∑α jIndustry Controlsit + ∑αkYear Controlst + εit
–
PredictedSign DISREQ
358
LAW
358
14.4 16.3
(3.68)
-0.026
(-3.56)
-0.013
(-1.25)
(3.66)
Industry and Year Controls
14.1 14.4
+ 0.0890.074
(1.16)(0.98)
0.091 0.091
0.003
62.4%63.3% 61.5% 62.4%
0.003
(2.90) (2.89)
+ 0.172
0.021
+
(4.39)
(1.85)
+ 0.025
(3.51)
(-1.80)
0.271+
(2.83)
(-1.97)
0.024
0.159
–
(4.89)
(-2.46)
–
0.288
(5.41)
-0.004
0.289 0.293
(5.63)(5.62)
-0.005-0.005 -0.004
(4.32)
(3.10)
(-2.65)
(3.14)
(4.01)
0.157
0.022
-0.006
(-0.92)
-0.004
(-3.72)
-0.006
(-2.70)
-0.023
(-2.53)
The sample comprises 358 country-year medians from 40 countries over the ten-year period from 1992 to 2001. The dependent variable, r AVG, is the mean of the four estimatesfor the implied cost of equity capital as described in the Appendix. DISREQ measures the level of disclosure regulation based on an index of disclosure requirements insecurities offerings from La Porta et al. (2003). The level of enforcement is measured by three alternative variables from La Porta et al. (1997 and 2003, respectively): (1)LAW represents the rule of law index (divided by 10), (2) PROOF is the burden of proof index, and (3) PUBENF equals the index of public enforcement. SECREG (forsecurities regulation) and LEGQUAL (for quality of the legal system) are the first two principal components of the above institutional variables. INFL is the yearly median ofcountry-specific, one-year-ahead realized monthly inflation rates. SIZE stands for US$ market value of outstanding equity (in thousands). We use the natural log of the sizevariable in the analysis. RVAR is the returns variability computed as annual standard deviation of monthly stock returns. BMR is the ratio of accounting book value to marketvalue of equity. Financial data are measured as of the fiscal-year end, RVAR and the cost of capital as of month +10. MVAR is the first principal component of four proxiesfor macroeconomic variability, i.e., country-level earnings variability and ROE variability, volatility in GDP growth rates, and exchange rate variability. See Table 3 fordetails. FBIAS is the one-year-ahead analyst forecast error (mean forecast minus actual) scaled by forecast-period stock price. Industry controls based on the classification inCampbell (1996) and year controls are included in all regressions but not reported. The table reports OLS coefficient estimates and t-statistics based on robust standard errors(in parentheses). **, *, and # indicate statistical significance at the 1%, 5%, and 10% levels (two-tailed), respectively.

Variable N
Panel A: Potential Correlated Omitted Variables
Per-capita GDP 358 ** # ** **
Equity market 357 ** ** **
size
Disclosure 352 ** ** *
practice
Local short- 358 ** ** *
term rates
Panel B: Alternative Specifications and Estimation Methods
Accounting-based 358 ** ** ** **
controls only
Accounting-based 358 ** ** **
controls & 2SLS
Panel-corrected 358 * * *
standard errors
Years 2000 & 73 ** * *
2001 only
Panel C: Regression of Country-Fixed Effects on Rules and Enforcement Variables
Country-fixed 40 * ** #
effects
R2
Country-fixed 40 * ** *
effects plus GDP
R2
(-3.03) (-1.33) (-3.14) (-2.45)
-0.023 -0.014 -0.014 -0.015
-0.016
(-3.70)
TABLE 5
Sensitivity Analyses for Regressions of the Implied Cost of Capital on Rules and Enforcement Variables and Additional Controls
-0.027
(-3.74)
-0.019
(-3.08)
DISREQ LAW
(-3.15)
(-0.49)
14.5%
-0.032 -0.033
(-2.05)
10.0%
-0.026 -0.074
20.7%
27.9% 14.3%
-0.026
(-1.99)(-3.42)
-0.027 -0.039 -0.022
-0.027
(-1.87)
(-3.14)
-0.022 -0.005 -0.013
(-2.99)
PROOF PUBENF
-0.019
(-3.90) (-1.21) (-4.36) (-3.34)
-0.031 -0.013 -0.021
(-1.69)
-0.010
(-0.73)
1.4%7.0%
(-2.20)
-0.013
8.2%
-0.015
(-2.01) (-1.10)
-0.020
(-4.54) (-3.30) (-4.01) (-3.19)
-0.019
-0.027 – -0.037 -0.035
(-2.84) (-2.60) (-2.88)
-0.033 -0.025 -0.021 -0.022
(-1.97) (-2.27) (-2.20) (-1.56)
-0.056 -0.007 -0.031 -0.032
(-3.42) (-0.29) (-2.32) (-2.11)
The sample comprises 358 country-year medians from 40 countries over the ten-year period from 1992 to 2001.The dependent variable, rAVG, is the mean of the four estimates for the implied cost of equity capital as described inthe Appendix. Panel A reports only the coefficients (t-statistics) of the institutional variables, but the full set ofcontrols (see Model 4 in Table 3) plus one of the following variables are included: (1) the natural log of per-capitaGDP (in constant 1995 US$), (2) the size of equity markets as measured by the overall market capitalization inpercent of GDP, (3) a country’s disclosure practice using the CIFAR index (La Porta et al., 1997), (4) the yearlymedian of the nominal local yields on short-term treasury bills, central bank papers or inter-bank loans, as reportedin Datastream. Panel B presents the coefficients (t-statistics) using (1) accounting-based controls only, i.e., thenatural log of US$ total assets (in thousands) for SIZE and the ratio of total liabilities to total assets (financialleverage) instead of RVAR and BMR, (2) accounting-based controls and two-stage-least-squares estimation withthe English legal origin as instrument (where appropriate), (3) Prais-Winsten regressions with panel-correctedstandard errors (Beck and Katz, 1995), and (4) observations from the years 2000 and 2001 only. For panel C, wefirst estimate firm-level regressions using the full set of controls plus country-fixed effects. We subsequentlyregress these country-fixed effects on the institutional variables (and per-capita GDP). **, *, and # indicatestatistical significance at the 1%, 5%, and 10% levels (two-tailed), respectively.
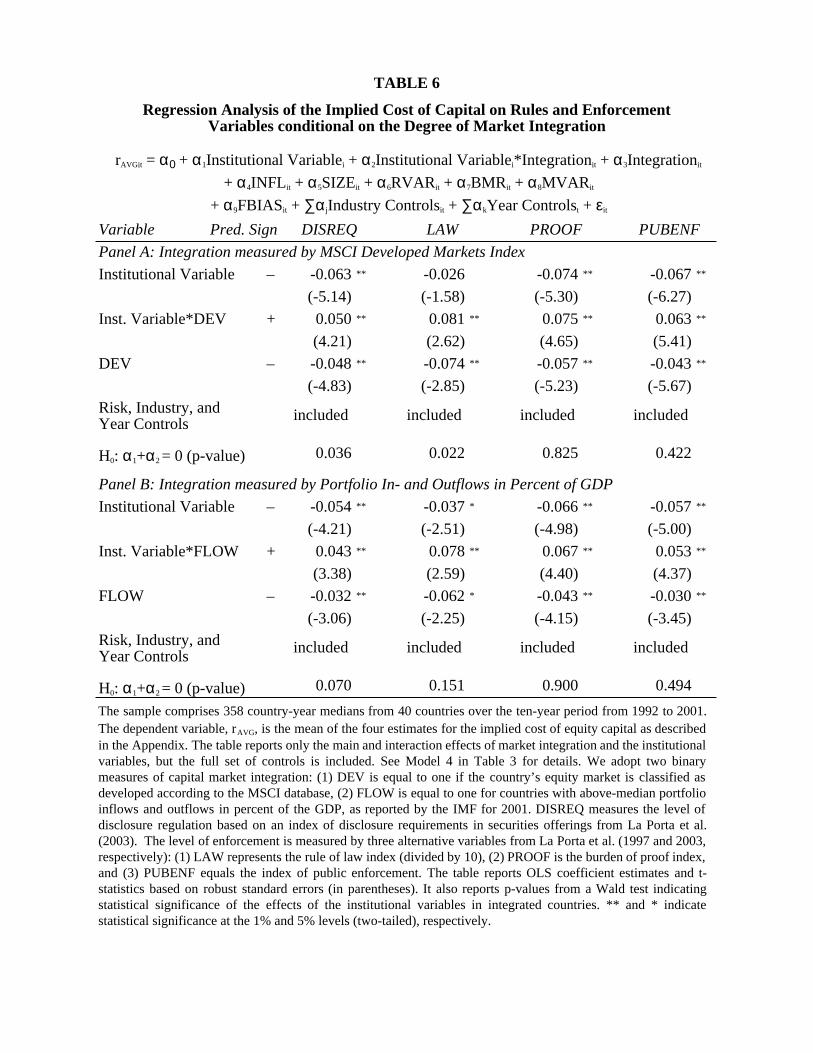
Variable
Panel A: Integration measured by MSCI Developed Markets Index
Institutional Variable – ** ** **
Inst. Variable*DEV + ** ** ** **
DEV – ** ** ** **
included included included included
H0: α1+α2 = 0 (p-value)
Panel B: Integration measured by Portfolio In- and Outflows in Percent of GDP
Institutional Variable – ** * ** **
Inst. Variable*FLOW + ** ** ** **
FLOW – ** * ** **
included included included included
H0: α1+α2 = 0 (p-value)
Pred. Sign
(-5.00)
0.053
DISREQ LAW PROOF PUBENF
-0.067
(-6.27)
0.063
(5.41)
(4.37)
-0.043
(-4.15)
-0.043
(-5.67)
0.422
-0.066 -0.057
(-4.98)
0.900
-0.030
(-3.45)
0.494
0.067
(4.40)
-0.062
(-2.51)
0.078
(2.59)
(-2.25)
0.151
-0.074
(-5.30)
0.075
(4.65)
-0.057
(-5.23)
0.825
-0.037
(-3.06)
0.070
-0.026
(-1.58)
0.081
(2.62)
-0.074
(-2.85)
0.022
0.043
(3.38)
-0.032
0.036
-0.054
(-4.21)
Risk, Industry, and Year Controls
Risk, Industry, and Year Controls
TABLE 6
Regression Analysis of the Implied Cost of Capital on Rules and Enforcement Variables conditional on the Degree of Market Integration
rAVGit = α0 + α1Institutional Variablei + α2Institutional Variablei*Integrationit + α3Integrationit
+ α4INFLit + α5SIZEit + α6RVARit + α7BMRit + α8MVARit
+ α9FBIASit + ∑α jIndustry Controlsit + ∑αkYear Controlst + εit
-0.063
(-5.14)
0.050
(4.21)
-0.048
(-4.83)
The sample comprises 358 country-year medians from 40 countries over the ten-year period from 1992 to 2001.The dependent variable, rAVG, is the mean of the four estimates for the implied cost of equity capital as describedin the Appendix. The table reports only the main and interaction effects of market integration and the institutionalvariables, but the full set of controls is included. See Model 4 in Table 3 for details. We adopt two binarymeasures of capital market integration: (1) DEV is equal to one if the country’s equity market is classified asdeveloped according to the MSCI database, (2) FLOW is equal to one for countries with above-median portfolioinflows and outflows in percent of the GDP, as reported by the IMF for 2001. DISREQ measures the level ofdisclosure regulation based on an index of disclosure requirements in securities offerings from La Porta et al.(2003). The level of enforcement is measured by three alternative variables from La Porta et al. (1997 and 2003,respectively): (1) LAW represents the rule of law index (divided by 10), (2) PROOF is the burden of proof index,and (3) PUBENF equals the index of public enforcement. The table reports OLS coefficient estimates and t-statistics based on robust standard errors (in parentheses). It also reports p-values from a Wald test indicatingstatistical significance of the effects of the institutional variables in integrated countries. ** and * indicatestatistical significance at the 1% and 5% levels (two-tailed), respectively.