intermediaries in international trade: direct versus indirect · pdf file ·...
TRANSCRIPT
Working Paper Research
Intermediaries in international trade : Direct versus indirect modes of export
by Andrew B. Bernard, Marco Grazzi and Chiara Tomasi
October 2010 No 199
NBB WORKING PAPER No. 199 - OCTOBER 2010
Editorial Director Jan Smets, Member of the Board of Directors of the National Bank of Belgium
Editoral
On October 14-15, 2010 the National Bank of Belgium hosted a Conference on "International trade: threats and opportunities in a globalised world". Papers presented at this conference are made available to a broader audience in the NBB Working Paper Series (www.nbb.be). Statement of purpose:
The purpose of these working papers is to promote the circulation of research results (Research Series) and analytical studies (Documents Series) made within the National Bank of Belgium or presented by external economists in seminars, conferences and conventions organised by the Bank. The aim is therefore to provide a platform for discussion. The opinions expressed are strictly those of the authors and do not necessarily reflect the views of the National Bank of Belgium. Orders
For orders and information on subscriptions and reductions: National Bank of Belgium, Documentation - Publications service, boulevard de Berlaimont 14, 1000 Brussels. Tel +32 2 221 20 33 - Fax +32 2 21 30 42 The Working Papers are available on the website of the Bank: http://www.nbb.be. © National Bank of Belgium, Brussels All rights reserved. Reproduction for educational and non-commercial purposes is permitted provided that the source is acknowledged. ISSN: 1375-680X (print) ISSN: 1784-2476 (online)

Intermediaries in International Trade:
direct versus indirect modes of export∗
Andrew B. Bernard†
Tuck School of Business at Dartmouth, CEPR & NBER
Marco Grazzi‡
LEM Scuola Superiore S.Anna
Chiara Tomasi§
LEM Scuola Superiore S.Anna & Universita’ degli Studi di Trento
September 2010
Abstract
This paper contributes to the relatively new literature on the role of intermediaries in internationaltrade. Using Italian firm-level data, we document significant differences between exporters of differenttypes and highlight the role of country-specific fixed cost in the choice of direct versus indirect modesof export. Recent theoretical work suggests that intermediaries are typically providing solutions tocountry-specific fixed costs. Our empirical results largely confirm this relationship. Measures ofcountry fixed costs are positively associated with intermediary exports both in the aggregate andwithin firms. In contrast, proxies for variable trade costs are largely not correlated with differencesbetween direct and indirect exports.
∗The statistical exercises which follow would not have been possible without the valuable help of the Italian StatisticalOffice (ISTAT) and in particular of Roberto Monducci.
†100 Tuck Hall, Hanover, NH 03755, USA, tel: +1 603 646 0302, email: [email protected]‡P.za Martiri della Liberta’, 33 56127 Pisa Italy. tel: +39-50-883341, email: [email protected]§P.za Martiri della Liberta’, 33 56127 Pisa Italy, tel: +39-50-883343, email: [email protected]
1

Intermediaries in International Trade
1 Introduction
The growing availability of firm-level data has contributed to the blooming of both theoretical and
empirical literatures that highlight firm heterogeneity as important for the understanding of interna-
tional trade. Since the initial empirical papers of Bernard and Jensen (1995, 1999); Roberts and Tybout
(1997) and the theoretical models of Melitz (2003) and Bernard et al. (2003), a major focus in interna-
tional trade has been on the relationship between firm characteristics, most notably productivity, and
the firm participation in international trade. As a result a great deal of effort has been devoted to
the investigation and understanding of differences between exporting and non-exporting firms. It was
only recently, however, that attention shifted to the differences existing among trading firms and to the
nature of their activities (Bernard et al.; 2010b; Ahn et al.; 2010; Antras and Costinot; 2010). These
papers point out that there exist both manufacturers that organize the production and distribution of
their goods abroad as well as intermediaries that specialize in distribution.
The present paper examines the extent to which intermediaries contribute to Italian exports. We in-
vestigate the role of intermediaries in exports and examine how they differ from manufacturing firms. In
particular, we highlight the characteristics of the destination market that are associated with a greater
export role for intermediaries. We combine data on cross-border transactions from Italian custom
records with comprehensive information at the firm level, including employment, turnover and industry
classification. Firms are assigned to 5-digit industries according to the main activity they report in the
Census of Business. Around one quarter of all exporters are intermediaries and they account for more
than ten percent of Italian exports. Intermediary exporters are smaller than manufacturing exporters in
terms of employment, sales and especially exports but they display higher sales per employee and com-
parable exports per employee. They also have higher industry diversification relative to manufacturing
exporters, but are less geographically diversified.
The mere existence of intermediaries suggests that they overcome barriers to international trade
at a lower cost than manufacturers for some range of goods and for some countries. We investigate
the market characteristics that are associated with the presence of intermediaries. The volume of
exports of intermediaries is less affected by geographic distance than that of manufacturers. Similarly,
intermediaries’ exports are also less affected by fixed costs such as market entry costs and quality of
governance in the country. Thus it would appear that the specific ‘technology’ available to intermediaries
enables them to better cope with higher, country-specific, fixed costs.
In the following we discuss existing theories and empirical work on exporting intermediaries in
Section 2. In Section 3, we describe the firm and country level data. We then document differences
between manufacturers and intermediaries and their exporting behavior in Section 4, and in Section 5,
we investigate the impact of a set of country variables on the volume of exports for the two types of
firms. Section 6 concludes.
2
Intermediaries in International Trade
2 Theoretical frameworks
Recent models of international trade emphasize the role that heterogeneity in productivity plays in
explaining the structure of international commerce. According to these models and a large quantity
of associated empirical work, more productive firms are more likely to engage in exporting and foreign
direct investment. While these frameworks have been extended to examine multiple destinations and
multiple products, they generally assume that trade occurs directly between producers in one country
and final consumers in another and do not account for the activity of intermediary firms in trade.
Early theoretical work on the role of intermediaries in international trade, e.g Rauch and Watson
(2004) and more recently Petropoulou (2007), model international trade as an outcome of search and
networks. Several new papers in the theoretical literature on intermediaries in exporting have taken
a more technological perspective based on models of heterogeneous firms (Ahn et al.; 2010; Akerman;
2010; Felbermayr and Jung; 2009).
New models of trade, in particular Akerman (2010) and Ahn et al. (2010), extend the heterogeneous
firm trade model of Melitz (2003) by introducing an intermediation technology which allows wholesalers
to exploit economies of scope in exporting. While all active firms serve the domestic market, now
manufacturers have a choice of how to potentially serve a foreign market. Domestic manufacturing
firms are allowed to choose between direct exports to a consumer in the foreign market and the use of
an intermediary firm who controls the goods as they cross the international border.1
While the details of the models vary, the general framework is similar. Exporting directly incurs a
fixed cost and a variable cost. Indirect exporting takes place through an intermediary firm, or using
intermediary ‘technology’. The intermediary is assumed to be able to lower the average fixed cost per
good exported by pooling the country or industry-specific fixed costs of exporting across more than
one good. This choice means that a number of manufacturing firms may export indirectly through a
wholesaler, rather than managing their own distribution networks, by paying an intermediary fixed cost,
which is smaller than their own fixed cost of direct export. In this more realistic setting, firms choose
to serve the foreign market either directly or through domestically-based export intermediaries.
Firms sort according to productivity into different export channels. As in the standard model of
Melitz (2003), the least productive firms serve only the domestic market while the most productive
firms can export directly by incurring the fixed cost of export and trade costs. A third category of firms
chooses to export indirectly through wholesalers. This third group, which looks like non-exporters in
the data, includes some firms who would not have been exporters in the absence of intermediaries and
some firms who would be marginal exporters in the absence of intermediaries.
Analogous to Helpman et al. (2004), we can compare graphically the profits generated by each type
1Blum et al. (2008) look the role of intermediaries largely from the perspective of the importing country whileRauch and Watson (2004) discuss when intermediary firms actually take possession of the goods.
3

Intermediaries in International Trade
ααα
d
xd
α xdxiα d
πi
fd
fi
fx
π
π
π
Figure 1: Profits from domestic sales, indirect and direct exports
of activity for firms with different productivity.2 The two solid lines in Figure 1 depict profits from the
domestic market (πd) and additional profits for firms that export directly (πxd). The profit functions
are increasing linear function of productivity (α) as more productive firms are able to charge a lower
price, capture a large market share and generate larger profits. The intercept of the domestic curve is
smaller in absolute value than that of export because the fixed costs that are incurred for selling on the
domestic market (fd) are lower than what a firm must pay to export directly abroad (fx). Moreover,
since there is a per unit variable cost of export, the slope of the profit function for direct exports is
flatter than the slope of the profit function for domestic production. These relationships introduce two
productivity cut-offs (αd and αx), that in turn indicate which ranges of productivity determine exit,
domestic sales only, or direct exports.
With the possibility of exporting through intermediaries, firms now have also an additional option
of using the intermediation ‘technology’ to export. By assumption the fixed costs in the intermediation
2In this example we assume that the firm itself has access to the intermediation technology. Akerman (2010) modelsintermediaries explicitly in a monopolistic competition setting. Intermediaries face fixed costs of exporting that areincreasing in the number of varieties handled by the exporter and their variable costs per variety include tariffs and thedomestic price of the variety. Producing firms view intermediaries as identical to any other domestic consumer and thusonly face domestic fixed costs of production. The resulting pictures and cutoffs are similar although his framework allowsfor a richer set of predictions on the size and scope of intermediaries.
4

Intermediaries in International Trade
technology are lower than the fixed costs of direct exporting and are greater than or equal to the fixed
costs of domestic sales; fi is between fd and fx in Figure 1. The degree to which the intermediation
fixed costs are lower than those of direct exporting depends on the combination of country, industry
and country-variety fixed costs of selling in the foreign market as discussed further below.
The dotted curve drawn in Figure 1 depicts profits for firms that export indirectly (πi) through
an intermediary. If using an intermediary does not affect the variable costs of exporting then all
manufacturers would employ the intermediation technology and export indirectly, πi (α) > πd (α) ∀α.
To allow for both direct and indirect exporting, the indirect exporter faces additional variable costs. In
Akerman (2010), the intermediary sets the export price of each variety as a standard mark-up over its
own marginal cost, where its marginal cost includes both variable trade costs and the domestic purchase
price of the variety, which is itself a mark-up over the variable cost of production.
The combination of lower fixed costs and higher variable costs at intermediaries introduces a third
productivity cut-off, αi, which is the zero-profit cutoff for exporting through an intermediary.3 If
αd < αi < αx then there will be an equilibrium with ’pure’ domestic producers and both direct and
indirect exporting. Firms with productivity levels below αd earn negative profits and exit the industry.
Firms with productivity levels between αd and αi, produce only for the domestic market. Firms with
productivity between αi and αxd, now can profitably access the foreign market through wholesalers.
Finally, firms with productivity levels above αxd produce for the domestic market and export directly.
Note that the group of firms with indirect exports includes some firms with productivity too low to find
it profitable to export directly, αi ≤ α < αx and some firms of higher productivity that prefer indirect
to direct exporting, αx ≤ α < αxd.
A firm’s decision regarding the mode of export is determined by variable and fixed trade costs,
which in turn also depends on country and product characteristics. The degree to which fixed costs are
reduced using intermediaries depends on the nature of the fixed cost, e.g. the combination of country,
industry and country-variety components. We can write the fixed costs of direct exporting of variety
k in industry j to country c as
fx = fc + fj + fkc
where fc is a fixed export cost common to all varieties exported to country c, fj is a fixed export cost
common to all varieties in industry j regardless of the number of destinations, and fkc is a fixed export
cost specific to the variety and country. The greater the share of idiosyncratic fixed costs, fkc, in total
fixed costs, fx, the lower the possibility for economies of scope and the lower the share of exports handled
by intermediaries. Both country and industry-specific fixed costs allow for the possibility of indirect
exporting. Exporting intermediaries may arise because they are able to share the country-specific fixed
3It is possible that no producer will choose to export through an intermediary if the increase in variable cost is sufficientlylarge.
5
Intermediaries in International Trade
cost of exporting across many industries and varieties and/or they may exist because they are able to
spread industry-specific fixed costs across varieties and destinations. Existing theoretical frameworks
typically ignore the possibility of industry-specific fixed costs but it remains an empirical question as
to whether intermediaries are country- or industry-specific relative to direct exporters.
The simple framework provides some clear predictions for the variation of direct and indirect trade
across countries. To the extent that intermediaries solve only the country-specific fixed costs of ex-
porting, e.g. each variety exported faces indirect fixed costs fi = fc/n + fkc, where n is the number
of varieties handled by the intermediary, the difference between direct and indirect fixed costs will be
increasing as country fixed costs rise.
The role of variable trade costs is less clear-cut in these models. A rise in variable trade costs that
affects both direct and indirect exporters such as tariffs or transportation costs, can increase, decrease
or leave unchanged the share of exports handled by intermediaries. In our empirical work we examine
the role of variable trade costs including distance and tariffs in determining the share of exports handled
by intermediaries.
2.1 Related empirical literature
Recent papers by Ahn et al. (2010), Akerman (2010) and Bernard et al. (2010b) examine various aspects
of intermediaries in exports for China, Sweden and the US respectively. None of the papers uses exactly
the same definition of an exporting intermediary so the results are not directly comparable to each other
or those presented below.4
Bernard et al. (2010b) document the role of intermediaries in US exports. They find that 35 percent
of US exporters are wholesalers accounting for 10 percent of US exports by value. Their work emphasizes
the differences in the attributes between exporters of different types. Among exporting firms, pure
wholesalers are much smaller than ‘producer-consumer’ firms in terms of employment, but only slightly
smaller in terms of exports per worker and domestic sales per worker.5 Other differences include the
types of products exported and the destinations served, wholesalers are more likely to export food-
related sectors and export to lower income countries.
Akerman (2010) reports slightly more exporting intermediaries than manufacturers and significant
differences between the two types of exporters. Intermediaries are smaller in terms of total turnover,
much smaller in terms of export value, but export more products and ship to more destinations.
Akerman (2010) regresses country-sector intermediary export shares on gravity variables and prox-
ies for country fixed export costs. Intermediary export shares increase in distance and measures of fixed
4Specifically, Ahn et al. (2010) define an intermediary as a firm with certain Chinese characters in its name, Akerman(2010) uses the main activity of the firm and includes both wholesalers and retailers and Bernard et al. (2010b) distinguishbetween pure wholesalers, pure retailers and two types of firms that mix manufacturing with wholesaling and retailing. Asdiscussed below we only consider firms with wholesaling as their main activity as intermediaries.
5‘Producer-consumer’ firms in Bernard et al. (2010b) include any firm with no reported employment in wholesaling orretailing and thus include both manufacturers and other service firms.
6
Intermediaries in International Trade
costs and fall with destination GDP.
In contrast with the other studies, Ahn et al. (2010) find much higher exports per firm for inter-
mediaries than direct exporters as well as many more destinations and products and products per
destination. Regressions of product-country intermediary export shares on country characteristics show
positive relationships for distance, tariffs and a measure of fixed costs and a negative relationship with
destination GDP.
3 Data
3.1 Firm level data
Our analysis of direct vs indirect modes of export is based upon two firm-level datasets collected by
the Italian statistical office (ISTAT), namely Statistiche del Commercio Estero (COE) and Archivio
Statistico Imprese Attive (ASIA).6 The COE dataset consists of all cross-border transactions performed
by Italian firms and it covers the period 1998-2003. COE includes the annual value of export transactions
of the firm disaggregated by destination countries.7 The data also record the number of 4-digit industries
that the firm has exported although the value of exports by industry are not available.8 The limitation
of the export data, specifically the lack of product-by-country exports at the firm level means that our
analysis is limited to an examination of the variation of exports across countries, both across and within
firms.
Using the unique identification code of the firm, we link the firm-level export data to ISTAT’s archive
of active firms, ASIA. In ASIA, firms are classified according to their main activity, as identified by
ISTAT’s standard codes for sectoral classification of business (5-digit ATECO). This information allows
us to distinguish between four broad categories of firms: manufacturers, wholesalers, retailers, and a
residual group including the remaining sectors.9 ASIA also contains information on firms’ operations
including the number of employees and total turnover. The combined dataset used for the analysis is
not a sample but rather includes all active firms.
6The database has been made available for work after careful screening to avoid disclosure of individual information.The data were accessed at the ISTAT facilities in Rome.
7The total value of the firm-country transaction, recorded in euros, is broken down into five broad categories of goods,Main Industrial Groupings, identified by EUROSTAT as energy, intermediate, capital, consumer durables and consumernon-durables which based on the Nace Rev. 2 classification, are defined by the Commission regulation (EC) n.656/2007of 14 June 2007. None of our results are sensitive to using these aggregate sector classifications.
8The 4-digit industries are classified according to the Classificazione dei Prodotti per Attivita’ Economica (CPATECO),which is the statistical classification of products by activity. The CPATECO corresponds up to the fourth digit tothe Classificazione delle Attivita’ Economiche (ATECO), which is the Italian classification for economic activities thatcorresponds, to a large extent, to the Eurostat NACE 1.1 taxonomy.
9In particular, we classify firms in sectors from 151 to 372 as manufacturers, and firms in sectors from 501 to 519 (withthe exclusion of 502 which concerns the activity of repair of motor vehicles) as wholesalers. Retailers are firms in sectors521 to 527, and Others contains the remaining sectors.
7

Intermediaries in International Trade
3.2 Country-level data
We complement the firm-level trade data with country characteristics including proxies for market size
and variable and fixed trade costs.10 For market size we use total GDP from the World Bank World
Development Indicators database. Variable trade costs may be either due to policy barriers, such as
tariffs and non-tariff barriers, or related to the cost of moving goods across borders, such as trans-
portation costs. Following the large gravity literature we proxy transportation costs with geographic
distance calculated using the great circle formula (Mayer and Zignago; 2005). As a proxy for policy
barriers we use a measure of country-level import tariffs calculated as the HS6 product-country import
tariffs weighted by aggregate Italian exports at the HS6 product level. Tariff data are taken from World
Integrated Trade System (WITS), and the data on Italian exports at the HS6 level are from the National
Statistical Office (www.coeweb.istat.it).11
As emphasized in the literature on firms and exporting (Roberts and Tybout; 1997; Melitz; 2003;
Bernard and Jensen; 2004; Bernard et al.; 2007; Eaton et al.; 2009), firms incur market-specific fixed
entry costs in order to enter foreign markets. These fixed costs can be related to the establishment
of a foreign distribution network, difficulties in enforcing contractual agreements, or the uncertainty of
dealing with foreign bureaucracies. We create two measures of country-level fixed costs. To generate
a proxy for the market-specific fixed costs of exporting to a country, we use information from three
measures from the World Bank Doing Business dataset: number of documents for importing, cost of
importing and time to import (Djankov et al.; 2006). Given the high level of correlation between these
variables, in our multivariate regression analysis, we use the primary factor (Market Costs) derived from
principal component analysis as that factor accounts for most of the variance contained in the original
indicators (see Table A1 in Appendix).
Data on the contracting environment are available from a variety of sources, e.g. World Bank,
Heritage Foundation, and Transparency International. To proxy for institutional quality we use in-
formation from the six variables in the World Bank’sGovernance dataset (Kaufman et al.; 2009):Voice
and Accountability, Political Stability and Absence of Violence/Terrorism, Government Effectiveness,
Regulatory Quality, Rule of Law, and Control of Corruption. As these six measures are highly corre-
lated, we follow Bernard et al. (2010a) and use the primary factor obtained from principal component
analysis,Governance Indicator, as our proxy for country governance quality.12
10More details on the country-level variables are available in the Appendix.11WITS contains the TRAINS database on bilateral tariffs at the six-digit level of the Harmonized System (HS) product
classification for about 5000 products and 200 countries. TRAINS provides information on four different type of tariffs:Most-Favored National Tariffs (MFN), Preferential Tariffs (PRF), Bound Tariffs (BND), and the effectively applied tariffs(AHS). We use the AHS tariff in our empirical analysis. The AHS tariff is the MFN Applied tariff, unless a preferentialtariff exists.
12Table A2 in Appendix reports the results of the principal component analysis for the governance measures.
8

Intermediaries in International Trade
3.3 Constructed country variables
Product and industry characteristics are expected to play a significant role in determining the share
of trade exported by intermediaries. Due to data limitations our analysis considers only cross-country
variation in intermediary export shares. To examine the role of product and industry characteristics
we aggregate several product-level measures to the country level. The first variable is a measure of
industry contract intensity developed by Nunn (2007) to measure the importance of relationship-specific
investment in intermediate inputs across industries. We concord Nunn’s original data, corresponding to
US I-O industries, to NAICS 2002.13 These product-level measures of relationship specificity are then
weighted by the share of Italian exports in the HS6 product-country to create a country-level measure
of relationship-specificity.
We also construct a country-level measure of the elasticity of substitution between varieties of
imported goods. The demand elasticities are estimated by Broda et al. (2006) and reported using the
first three digits of the Harmonized System codes. We then compute the country-level export elasticity
that is a weighted average of the demand elasticities for each HS3 product. The weights are given by
the share of Italian exports in the HS3 product-country. The greater the export elasticity for a given
destination the more likely that the exports are homogeneous rather than differentiated.
The third product characteristic is timeliness. We proxy the timeliness of a product by the share
of value of that product that is exported by air. This information is provided by ISTAT-COEWEB
for 10 broad product categories (NST classification). We convert the NST data to the HS product
classification and construct a country-level timeliness index using the shares of Italian exports in the
HS6 product-country as weights.
These constructed variables suffer from the likely endogeneity of product-country export shares and
we recognize that a complete analysis of the role of product characteristics in direct versus indirect
export modes would require firm-product-country level exports.
4 Manufacturers and Intermediaries
The focus of the present work is to investigate the role of intermediaries in exports. In this section
we document the extent of Italian intermediary exports, highlighting important stylized facts about
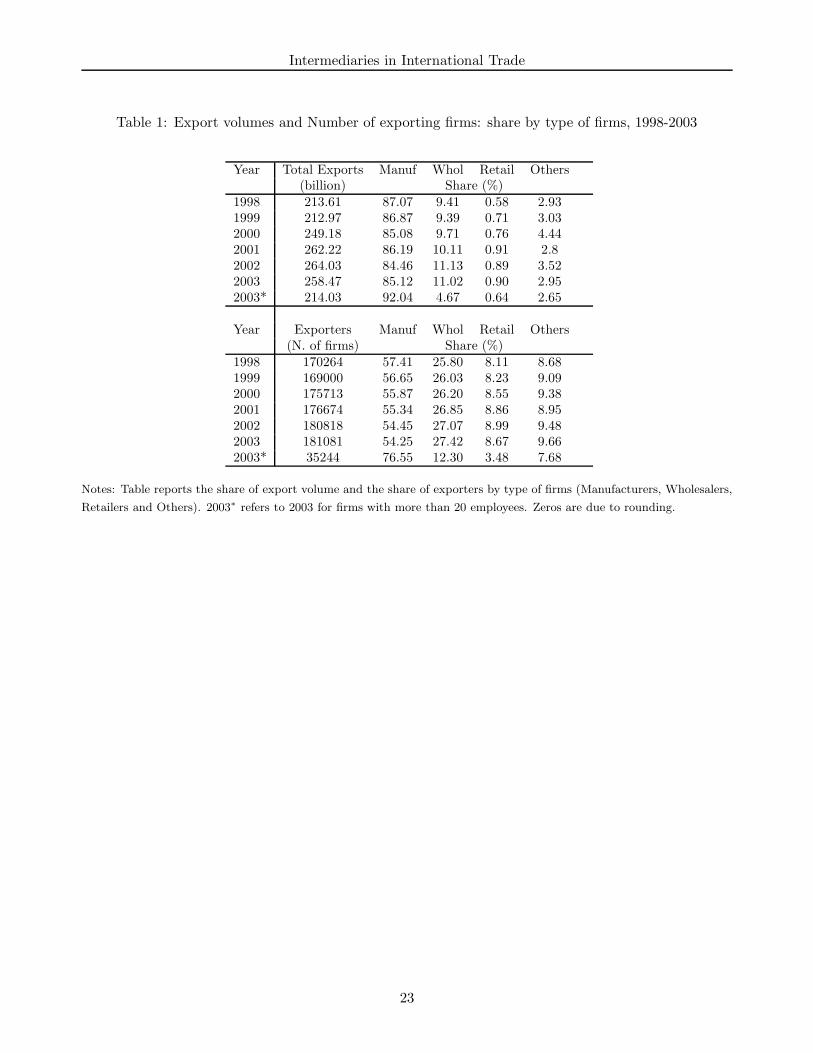
intermediaries and showing how they differ from manufacturing firms. Table 1 reports the total value
of exports and the relative share of four broad categories of firms: manufacturers, wholesalers, retailers,
and a residual group including the remaining sectors.
A preponderance of exports, more than 84 percent of the volume, is performed directly by manufac-
turing firms. Manufacturing exporters also represent more than 50 percent of exporting firms. However,
an increasing share of exports are conducted by the 27 percent of exporters that are wholesalers, rising
13See the Data Appendix for a description of the concordance procedure.
9

Intermediaries in International Trade
from 9.4 percent in 1998 to 11 percent of Italian exports in 2003. These figures are in line with those
reported for the US in Bernard et al. (2010b) where wholesalers are 35 percent of exporting firms and
control just over 10 percent of US exports. As in other countries, retailers are relatively minor players
in exporting, accounting for less than one percent of exports by value. As a result we focus on the role
of wholesalers as export intermediaries and will use the two terms interchangeably. Second, we observe
that wholesalers are, relative to manufacturers, of smaller size. Imposing a 20 employee threshold on
the database dramatically reduces the share of wholesalers’ exports from 11.02 percent to 4.67 percent
in 2003.
While intermediaries account for just 11 percent of Italian exports in 2003, there is substantial
variation across countries. Intermediary export shares range from a low of 3 percent for Malaysia to a
high of 41 percent for Cameroon and Sri Lanka. At the bottom of the interquartile range are countries
such as Belgium, Norway, France, New Zealand and China with intermediary export shares close to 9
percent; at the top of the interquartile range, we find Paraguay, Moldova, Malawi and Albania with
wholesaler export shares of 23 percent. Across destinations, intermediary export shares average 17
percent, suggesting that wholesalers are relatively more important in smaller markets.
4.1 Firm characteristics
In their work on US traders, Bernard et al. (2010b) find not only that traders differ from domestic firms,
but also that substantial heterogeneity exists between trading firms of different “types”. Our results
complement and extend that analysis by comparing manufacturers and wholesalers along a number
of dimensions: employment, total sales, export volume, the number of destination countries and the
number of industries exported.
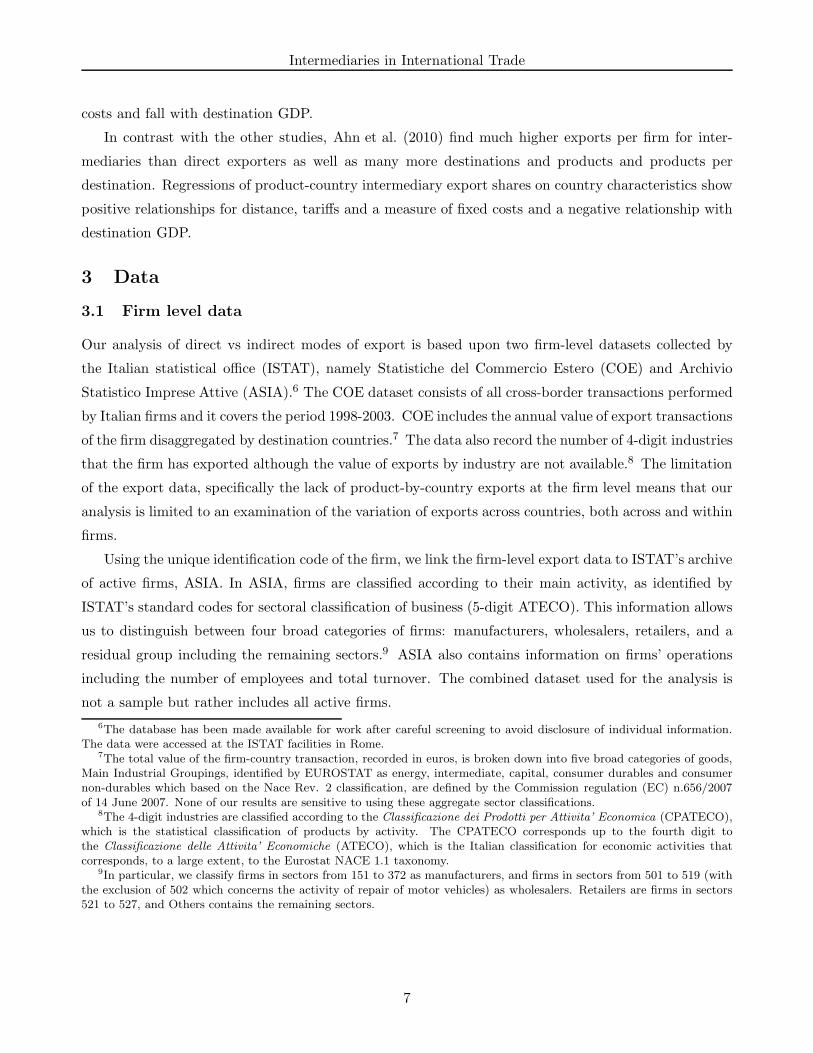
The top left panel of Figure 2 shows the distribution of employment for all wholesale and man-
ufacturing firms. The employment distribution for wholesalers clearly lies far to the left of that for
manufacturers. Overall intermediaries are much smaller in terms of number of employees. However,
when we proxy size with total sales (top right panel) the difference between the two distributions re-
mains but is greatly reduced. The differences between the panels implies that the sales per employee
ratio of wholesalers is much higher than that of manufacturers.14 In the bottom panels of Figure 2, we
show the size distributions for wholesale and manufacturing exporters. The relative ranking of the two
distributions is similar to that seen above although the distributions are shifted to the right as exporters
of both types are larger than purely domestic firms.
The figures are consistent with the idea that manufacturing firms are likely performing two activities,
the physical production of the goods and the intermediation of the goods to a downstream customer,
while wholesalers are only engaged in the latter activity. This distinction is important when attempting
to compare the exporting activities of wholesalers and manufacturers as the use of employment as
14We caution that sales per employee is not a good measure of firm productivity when comparing firms of different types.
10
Intermediaries in International Trade
.0001
.001
.01
.1
1
Pro
babi
lity
Den
sity
2 4 6 8 10Log(Number of Employees)
ManufacturersWholesalers
Size Distribution
.0001
.001
.01
.1
1
Pro
babi
lity
Den
sity
5 10 15 20 25Log(Sales)
ManufacturersWholesalers
Size Distribution
.0001
.001
.01
.1
1
Pro
babi
lity
Den
sity
2 4 6 8 10Log(Number of Employees)
ManufacturersWholesalers
Size Distribution for Exporting firms
.0001
.001
.01
.1
1
Pro
babi
lity
Den
sity
5 10 15 20 25Log(Sales)
ManufacturersWholesalers
Size Distribution for Exporting firms
Figure 2: Empirical density of firm size in 2003 - All firms (Top) and Exporters (Bottom). Size is proxiedby (log) number of employees (Left) and by (log) sales (Right). Densities estimates are obtained usingthe Epanenchnikov kernel with the bandwidth set using the optimal routine described in Silverman(1986).
a proxy for firm size may yield misleading comparisons. A manufacturing firm with 100 employees
will typically have lower sales and exports that a wholesale firm with the same employment. As a
consequence, we employ both employment and total sales in our analysis.
Figure 3 displays the binned relation between the log of volume of export and the log of employ-
ment.15 The plot reports the (log) number of employees a firm needs, on average, to attain a certain
amount of exports. The plot confirms that wholesalers require a smaller number of employees to attain
any given level of export volume.
To quantify the differences between manufacturers and wholesalers, we estimate the following cross-
15Binned plots allow for a succinct representation of the relation between two variables and avoid displaying cloudsof thousands of observations. Here data are binned in 15 classes according to their (log of) volume of export, and thex-coordinate is the average of every bin. The y-coordinate is the average (log of) employment within that bin.
11

Intermediaries in International Trade
1
1.5
2
2.5
3
3.5
4
4.5
5
5.5
Log(
Num
ber
of E
mpl
oyee
s)
6 8 10 12 14 16
Log(Export Volume)
Manufacturers
Wholesalers
Number of employees per level of export volume
Figure 3: Relation between number of employees and export volume, 2003. Data are binned in 15classes according to their (log of) volume of export, and the x-coordinate is the average of every bin(see text).
sectional OLS regression,
ln(Yf ) = c + β1DWf + β2D
Xf + β3(D
Wf · DX
f ) + εf (1)
where ln(Yf ) denotes the logarithm of either total sales, number of employees, or sales per employee
ratio. DWf is a dummy variable taking value one for wholesaler and zero for manufacturer; DX
f is a
dummy indicating if a firm is an exporter; and (DWf ∗DX
f ) is the interaction between the two dummies
and takes value one if a firm is a wholesaler exporter and zero otherwise. The results are presented in
Table 2.
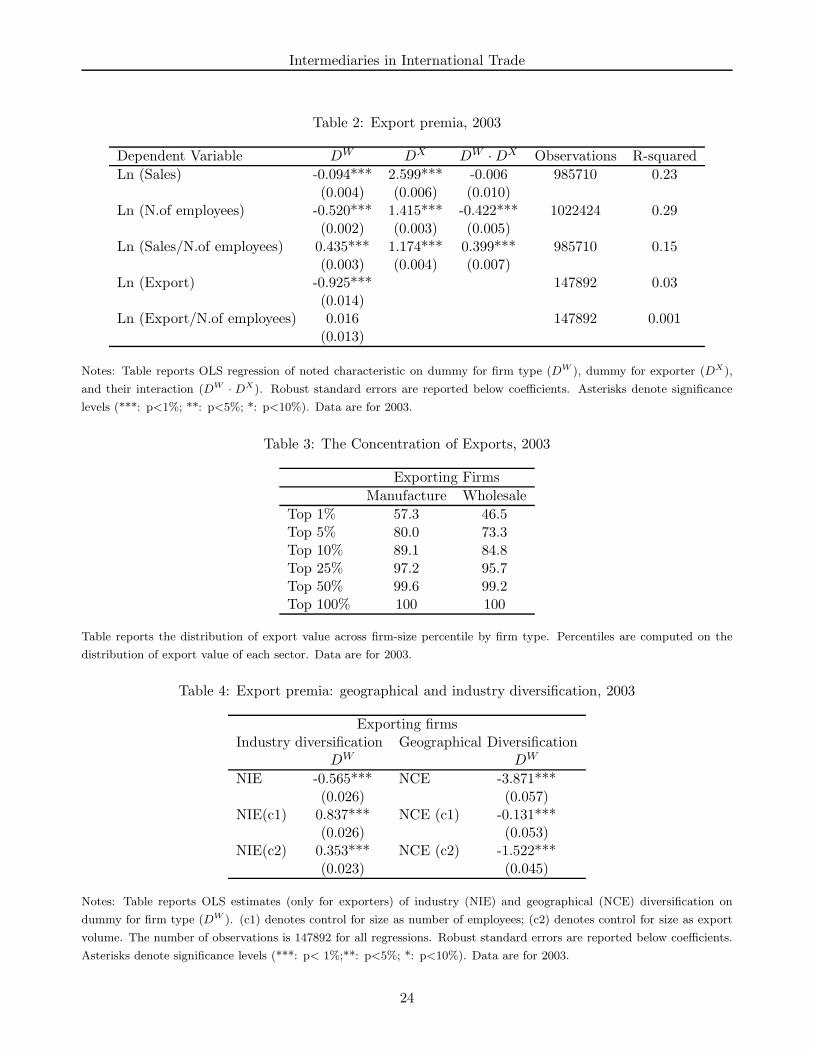
As expected, manufacturers are on average larger than wholesalers, 0.094 log points (9.9 percent)
in terms of sales and 0.52 log points (68 percent) larger in terms of employment, β1 is negative and
significant in both specifications. In contrast, sales per employee are substantially higher at wholesalers.
We also confirm the now-standard results that manufacturing exporters are dramatically larger and have
higher sales per employee than their domestic counterparts, β2 is large, positive and significant.
Perhaps unsurprisingly, we provide the first evidence that the selection of firms into exporting may
be working for wholesalers as well. Exporting wholesale firms have total sales 13.4 times larger than
non-exporting wholesalers and employ 2.7 times as many workers, β2 + β3 is positive and significant.
Sales per employee at exporting intermediaries are 4.8 times higher than at non-exporters.
Looking at exports in rows 4 and 5 of Table 2, we find that the value of exports at wholesalers is
also much smaller than that of manufacturing exporters but that this difference largely disappears when
considering exports per employee.
The regression results of Table 2 confirm the conclusions from the relative distributional plots in
Figure 2. In particular, the evidence on higher sales per employee, especially at exporters, supports
12

Intermediaries in International Trade
the idea of wholesalers focusing on just the intermediation portion of the activities carried out by
manufacturers.
Recent work on firm-level exports has emphasized the extreme concentration of exports in a small
number of firms. Bernard et al. (2009) report that the top 5 percent of US exporters account for 93
percent of total US exports in 2000. Similarly, Mayer and Ottaviano (2008) find concentrated exports
in a number of European countries including Germany, France, Hungary, and Norway in 2003. Table 3
reports the share of Italian export volume generated by different size classes computed using export
value and defined within each type. We find that wholesalers exports are less concentrated among
large firms than are direct exports by manufacturers. The largest 5 percent of manufacturing exporters
account for 80.0 percent of total exports by Italian manufacturing firms, while the top 5 percent of
wholesale exporters account for 73.3 percent of Italian wholesaler exports. These figures are similar to
those reported for the US by Bernard et al. (2010b).
4.2 Industry and Geographic Diversity
The theoretical models discussed in Section 2 generally focus on the role of intermediaries in solv-
ing the fixed cost problem for specific markets. In this section, we provide evidence on the presence
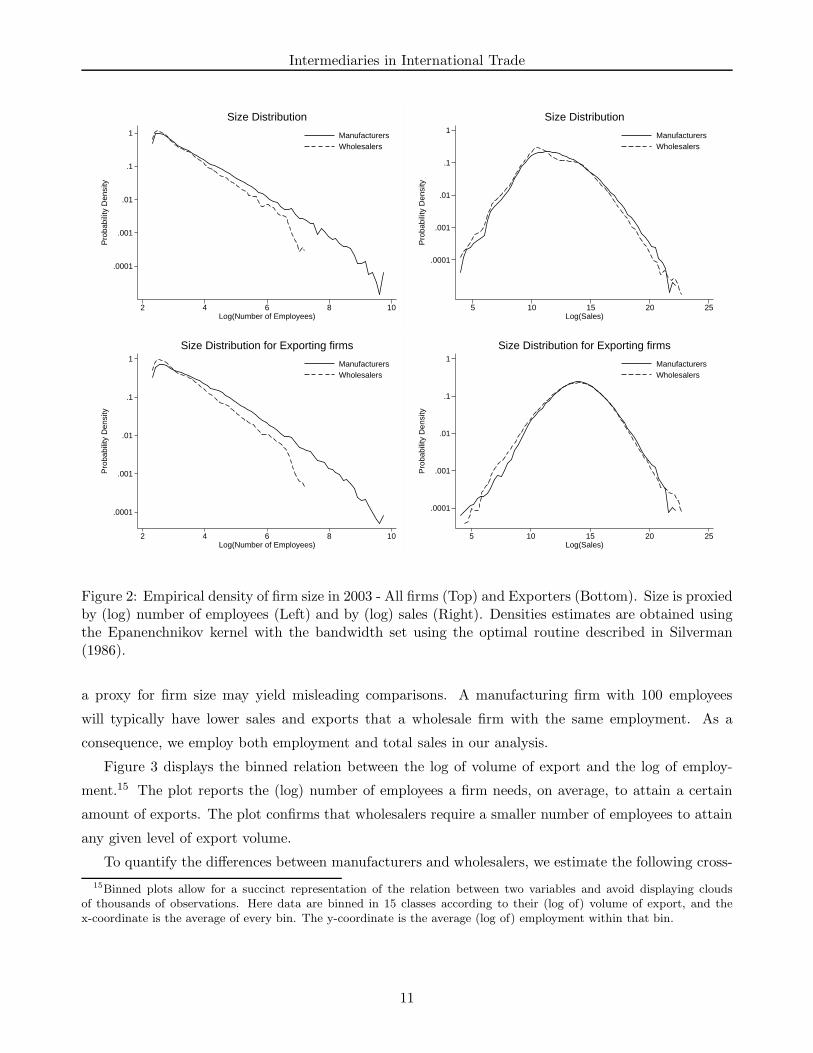
of intermediaries in markets and sectors. Figure 4 displays the relation between geographic and in-
dustry diversification of the firm and its size, distinguishing between wholesalers and manufacturers.
Geographical diversification is proxied by the Number of Countries of Export (NCE) and industry di-
versification by the Number of Industries Exported (NIE); size is represented both by employment and
export volume.
The evidence in Figure 4 suggests that the wholesalers’ technology does not convey them an advan-
tage in terms of geographic diversification, wholesalers export to fewer countries than do manufacturers
at similar levels of employment and exports.16 On the contrary, when considering the relation between
firm size and industry diversification (bottom panel), we find that at every size class wholesalers export
in more industries than manufacturers.
Considering only the sample of exporting firms, we investigate differences between manufacturers
and wholesalers in terms of industry and geographic diversification. In Table 4 we regress the number of
industries exported and the number of destination markets (NIE and NCE, respectively) on a dummy
variable, DWf , indicating if a firm is a wholesaler or a manufacturer,
Yf = c + γDWf + εf if DX
f = 1. (2)
The first row of Column 1 shows that, unconditionally, wholesale exporters export in fewer four-
16Ahn et al. (2010) report that Chinese intermediaries export to more products and to more countries than directexporters. However, as noted previously, intermediary export firms in the Chinese data are almost twice as large as directexporters in terms of total export volume.
13
Intermediaries in International Trade
0
5
10
15
20
25
30
35
40
Num
ber
of c
ount
ries
part
ners
0 2 4 6
Log(Number of Employees)
Manufacturers
Wholesalers
Geographical Diversification and Number of Employees
0
5
10
15
20
25
30
35
40
45
Num
ber
of c
ount
ries
part
ners
5 10 15 20
Log(Export Volume)
Manufacturers
Wholesalers
Geographical Diversification and Export Volume
0
2
4
6
8
10
12
14
Num
ber
of i
ndus
trie
s ex
port
ed
0 1 2 3 4 5
Log(Number of Employees)
Manucfaturers
Wholesalers
Industry Diversification and Number of Employees
0
2
4
6
8
10
12
14
16
Num
ber
of in
dust
ries
expo
rted
6 8 10 12 14 16
Log(Export Volume)
Manufacturers
Wholesalers
Industry Diversification and Export Volume
Figure 4: Relation between geographical diversification (Top) and industry diversification (Bottom) andnumber of employees (left); export volume (right), 2003. Data are binned in 15 classes according totheir (log of) x variable, and the x-coordinate is the average of every bin (see text).
14

Intermediaries in International Trade
b=−0.018(0.003)
0.2
.4.6
Inte
rmed
iary
Exp
ort S
hare
20 22 24 26 28 30Log (GDP)
Linear Fit Observed Value
Wholesale Export Share & Market Size
b=−0.009 (0.007)
0.2
.4.6
Inte
rmed
iary
Exp
ort S
hare
6 7 8 9 10Log (Distance)
Linear Fit Observed Value
Wholesale Export Share & Market Distance
Figure 5: Intermediary export share and gravity variables, 2003. Figures report the relationship betweenintermediary export share and gravity variables: (Left) Real GDP; (Right) Geographic distance. Eachpanel reports the coefficient, b, of a country-level univariate regressions for intermediary export share.Robust standard error is shown in parenthesis. Data are for 2003.
digit industries. However, including a control for firm size, either log employment or log export volume,
the coefficient becomes positive and significant; exporting intermediaries are active in a wider range
of industries compared to similarly-sized manufacturers. In contrast, intermediaries serve fewer export
markets even when adjusting for firm size. These results suggest that intermediaries are somewhat more
focused geographically and are able to overcome market-specific trade costs in order to export a wider
range of products.17
5 Exports by Intermediaries
The previous sections have shown that exporting wholesalers differ from manufacturing exporters in
terms of in size, geographic coverage and the number of industries exported. In the following we inves-
tigate the relationship of aggregate and firm exports by intermediaries and manufacturers to country
characteristics including fixed and variable trade costs.
5.1 Intermediary Export Share
We start by exploring the relationship between the overall intermediary export share by destination
market and the set of relevant explanatory variables (Figures 5-7). The correlation of intermediary
export shares by country with market size and distance is displayed in the two panels of Figure 5.
Wholesale export share is declining in log GDP, smaller markets have greater intermediary export
17A more detailed breakout of export value and exporting firms by type, number of destination countries and numberof exported industries is shown in Table A3 in the Industry and Country Appendix.
15

Intermediaries in International Trade
b=0.103 (0.023)
0.2
.4.6
Inte
rmed
iary
Exp
ort S
hare
1 1.5 2 2.5 3
Log (Number of documents required to import)
Linear Fit Observed Value
Wholesale Export Share & Number of documents required to import
b= 0.067 (0.014)
0.2
.4.6
Inte
rmed
iary
Exp
ort S
hare
6 7 8 9Log (Cost associated to import)
Linear Fit Observed Value
Wholesale Export Share & Costs associated to import
b=0.052 (0.009)
0.2
.4.6
Inte
rmed
iary
Exp
ort S
hare
1 2 3 4 5Log (Number of days required to import)
Linear Fit Observed Value
Wholesale Export Share & Number of days required to import
b=−0.037 (0.006)
0.2
.4.6
Inte
rmed
iary
Exp
ort S
hare
−2 −1 0 1 2Governance Indicator
Linear Fit Observed Value
Wholesale Export Share & Governance Indicator
Figure 6: Intermediary export share and country-level fixed costs, 2003. Figures report the relation-ship between intermediary export share and different proxies for fixed market entry costs: (Top Left)Number of documents for importing; (Top Right) Cost of importing; (Bottom Left) Time to import;(Bottom Right) Governance indicator. Each panel reports the coefficient, b, of a country-level univariateregressions for intermediary export share. Robust standard error is shown in parenthesis. Data are for2003.
shares, consistent with the idea that in smaller destination markets fixed entry costs have to be spread
over fewer units. In contrast there is no statistically significant relationship between distance, a common
proxy for variable trade costs, and the intermediary export share.
We turn next to the role of country fixed costs of trade, which are generally expected to be positively
related to intermediary trade shares. The two plots at the top and the one at the bottom left of Figure 6
display the relationship between the percentage of export volume that goes through intermediaries and
the three proxies for market-specific fixed costs provided by the World Bank Doing Business: number
of documents for importing, cost of importing and time to import, respectively. As found by Ahn et al.
(2010) and Akerman (2010), these measures of market access costs are positively and significantly related
to intermediary trade shares.
16
Intermediaries in International Trade
b=−0.028 (0.099)
0.2
.4.6
Inte
rmed
iary
Exp
ort S
hare
0 .1 .2 .3 .4 .5
Average product−country level import tariffs
Linear Fit Observed Value
Wholesale Export Share & Average product−country level import tariffs
b=−0.509 (0.101)
0.2
.4.6
Inte
rmed
iary
Exp
ort S
hare
.2 .4 .6 .8
Relationship−Specificity
Linear Fit Observed Value
Wholesale Export Share & Industry Relationship−Specificity Investments
b=0.009 (0.011)
0.2
.4.6
Inte
rmed
iary
Exp
ort S
hare
1 2 3 4 5Export Elasticity
Linear Fit Observed Value
Wholesale Export Share & Export Elasticity
b=−0.095 (0.057)
0.2
.4.6
Inte
rmed
iary
Exp
ort S
hare
0 .2 .4 .6Mode of transport
Linear Fit Observed Value
Wholesale Export Share & Mode of transport
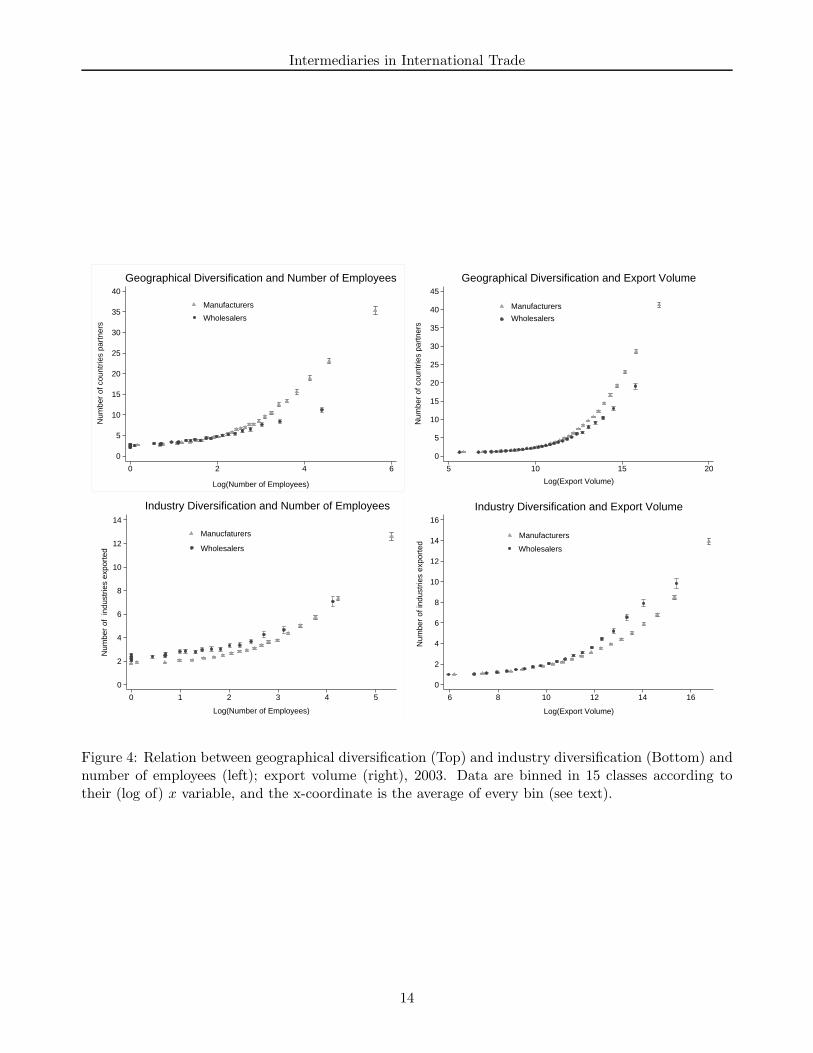
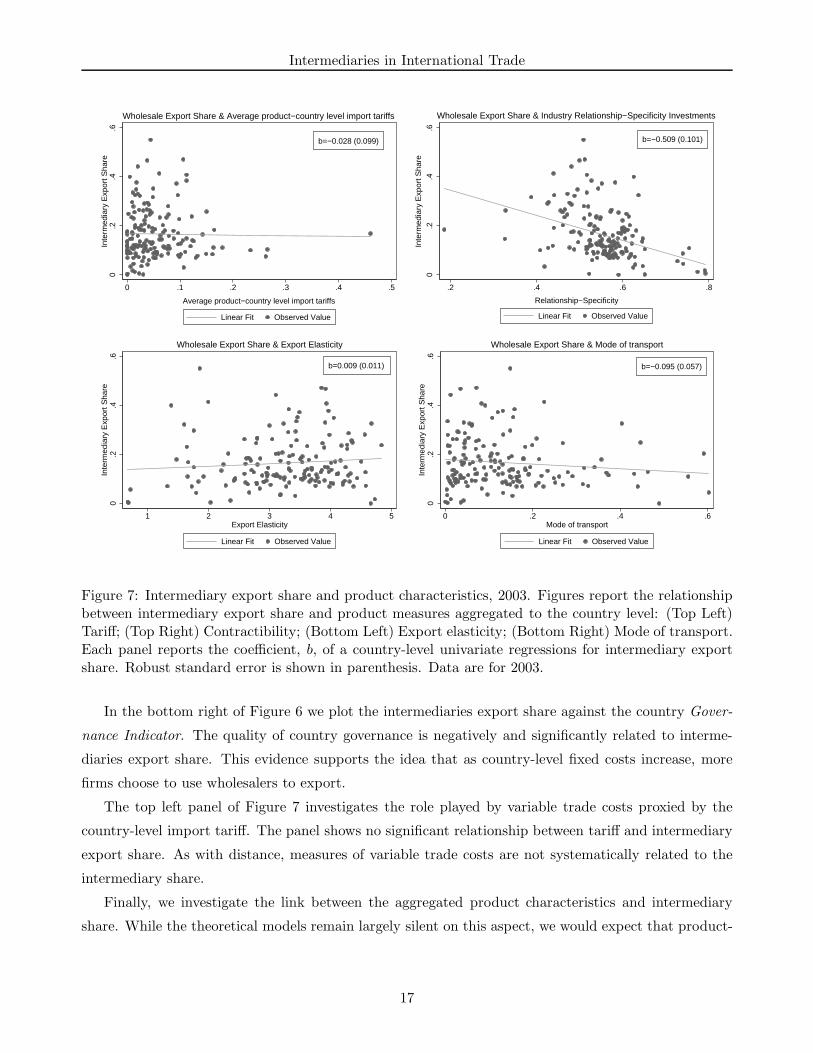
Figure 7: Intermediary export share and product characteristics, 2003. Figures report the relationshipbetween intermediary export share and product measures aggregated to the country level: (Top Left)Tariff; (Top Right) Contractibility; (Bottom Left) Export elasticity; (Bottom Right) Mode of transport.Each panel reports the coefficient, b, of a country-level univariate regressions for intermediary exportshare. Robust standard error is shown in parenthesis. Data are for 2003.
In the bottom right of Figure 6 we plot the intermediaries export share against the country Gover-
nance Indicator. The quality of country governance is negatively and significantly related to interme-
diaries export share. This evidence supports the idea that as country-level fixed costs increase, more
firms choose to use wholesalers to export.
The top left panel of Figure 7 investigates the role played by variable trade costs proxied by the
country-level import tariff. The panel shows no significant relationship between tariff and intermediary
export share. As with distance, measures of variable trade costs are not systematically related to the
intermediary share.
Finally, we investigate the link between the aggregated product characteristics and intermediary
share. While the theoretical models remain largely silent on this aspect, we would expect that product-
17
Intermediaries in International Trade
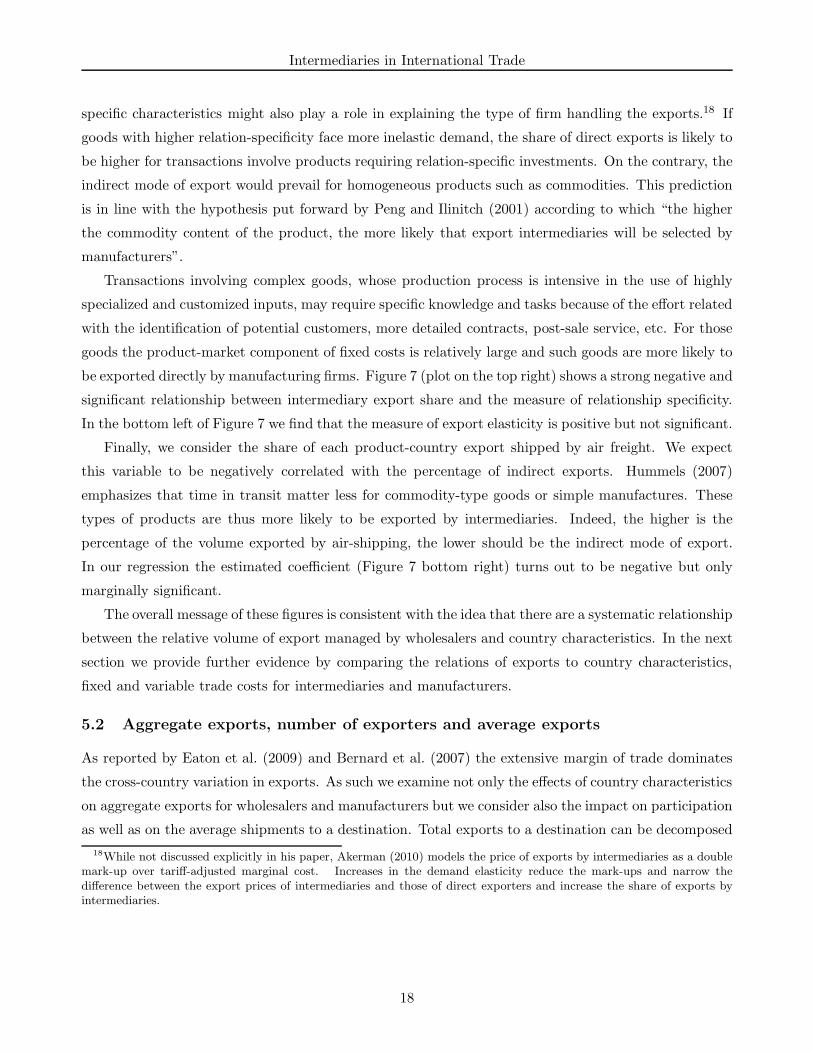
specific characteristics might also play a role in explaining the type of firm handling the exports.18 If
goods with higher relation-specificity face more inelastic demand, the share of direct exports is likely to
be higher for transactions involve products requiring relation-specific investments. On the contrary, the
indirect mode of export would prevail for homogeneous products such as commodities. This prediction
is in line with the hypothesis put forward by Peng and Ilinitch (2001) according to which “the higher
the commodity content of the product, the more likely that export intermediaries will be selected by
manufacturers”.
Transactions involving complex goods, whose production process is intensive in the use of highly
specialized and customized inputs, may require specific knowledge and tasks because of the effort related
with the identification of potential customers, more detailed contracts, post-sale service, etc. For those
goods the product-market component of fixed costs is relatively large and such goods are more likely to
be exported directly by manufacturing firms. Figure 7 (plot on the top right) shows a strong negative and
significant relationship between intermediary export share and the measure of relationship specificity.
In the bottom left of Figure 7 we find that the measure of export elasticity is positive but not significant.
Finally, we consider the share of each product-country export shipped by air freight. We expect
this variable to be negatively correlated with the percentage of indirect exports. Hummels (2007)
emphasizes that time in transit matter less for commodity-type goods or simple manufactures. These
types of products are thus more likely to be exported by intermediaries. Indeed, the higher is the
percentage of the volume exported by air-shipping, the lower should be the indirect mode of export.
In our regression the estimated coefficient (Figure 7 bottom right) turns out to be negative but only
marginally significant.
The overall message of these figures is consistent with the idea that there are a systematic relationship
between the relative volume of export managed by wholesalers and country characteristics. In the next
section we provide further evidence by comparing the relations of exports to country characteristics,
fixed and variable trade costs for intermediaries and manufacturers.
5.2 Aggregate exports, number of exporters and average exports
As reported by Eaton et al. (2009) and Bernard et al. (2007) the extensive margin of trade dominates
the cross-country variation in exports. As such we examine not only the effects of country characteristics
on aggregate exports for wholesalers and manufacturers but we consider also the impact on participation
as well as on the average shipments to a destination. Total exports to a destination can be decomposed
18While not discussed explicitly in his paper, Akerman (2010) models the price of exports by intermediaries as a doublemark-up over tariff-adjusted marginal cost. Increases in the demand elasticity reduce the mark-ups and narrow thedifference between the export prices of intermediaries and those of direct exporters and increase the share of exports byintermediaries.
18

Intermediaries in International Trade
into an extensive and intensive margin,
ln Xic = ln#firmsi
c + ln avgXic (3)
where ln Xic is the log of total exports by firms of type i to country c, #firmsi
c is the number of
exporting firms of type i to country c, and avgXic is the average exports per exporting firm of type i to
country c, where i indicates either manufacturers or wholesalers.19
In Tables 5-7, we regress log exports and its two components on a dummy for whether or not the
exports are done directly by a manufacturer or by an intermediary, on country characteristics and a full
set of interactions,i
lnXic = c1 + δ1D
W + β1Xc + γ1Xc ∗ DW + ε1c (4)
ln #firmsic = c2 + δ2D
W + β2Xc + γ2Xc ∗ DW + ε2c (5)
ln avgXic = c3 + δ3D
W + β3Xc + γ3Xc ∗ DW + ε3c . (6)
Throughout robust standard errors are clustered by country.
Table 5 shows the results for aggregate export by type. Results for the two gravity variables, GDP
and distance in column (1), confirm the typical findings that exports are higher to those countries
that have higher GDP and that are closer. Moreover, the results for GDP suggests that trade by
intermediaries is less sensitive to country size than exports by manufacturers. A one log point increase
in market size implies a 95 percent raise in manufacture exports, but only a 85 percent increase in
intermediary exports. The distance variable yields a surprising result. The interaction of wholesaler
type and distance has a negative and significant coefficient, suggesting that wholesale exports are more
sensitive to distance than direct exports.
In column (2) we add the measures of fixed and variable trade costs. Higher fixed costs of exporting,
proxied by the Market Costs measure, are negatively and significantly related to log exports. The
coefficient of the interaction with the intermediary dummy is positively and significant at the 10 percent
level suggesting that intermediaries are less affected by market-specific fixed costs.
Aggregate direct exports are not significantly related to country governance quality. However, the
interaction with the intermediary dummy is negative and significant. Better country governance, and
thus lower fixed costs, is associated with lower exports by wholesalers. These results conform closely to
the predictions that higher fixed costs of serving a market make it more difficult for direct exports and
more likely that trade will go through intermediaries. The tariff measure is insignificant for both types
of trade.
19Bernard et al. (2007) introduce this type of decomposition and report gravity regressions on firm and product extensivemargins separately. Due to the lack of availability of product-level data in our dataset we consider only the firm extensivemargin.
19
Intermediaries in International Trade
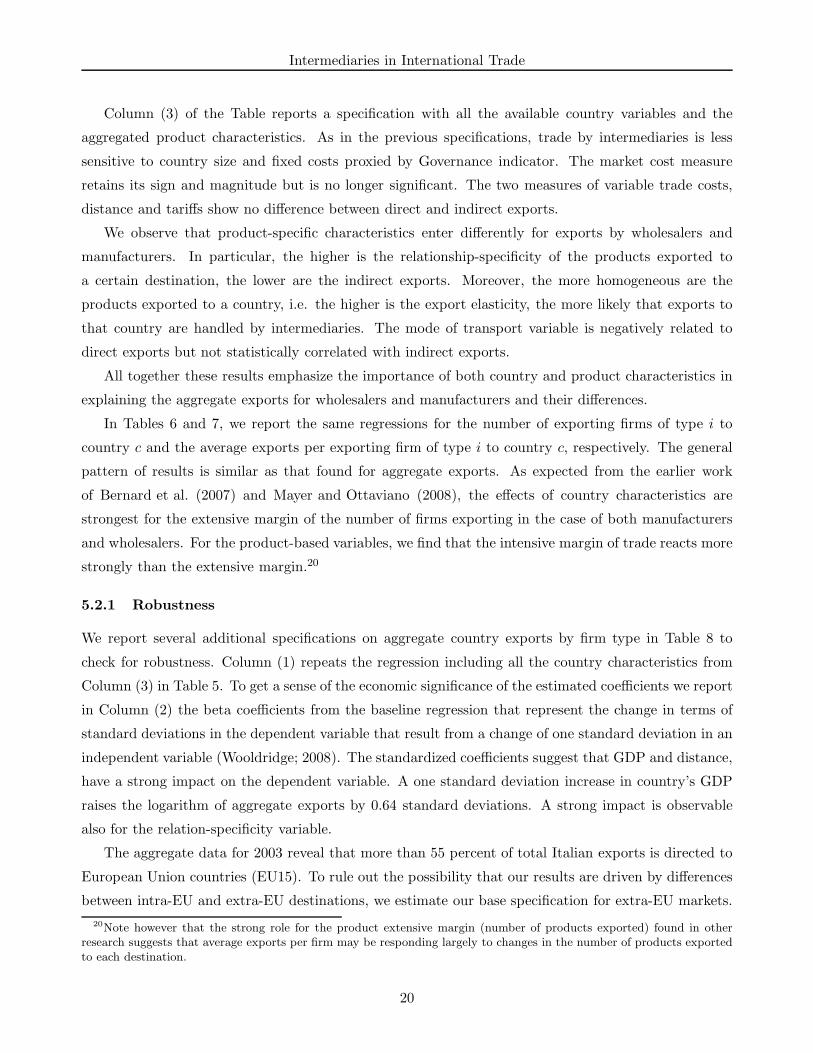
Column (3) of the Table reports a specification with all the available country variables and the
aggregated product characteristics. As in the previous specifications, trade by intermediaries is less
sensitive to country size and fixed costs proxied by Governance indicator. The market cost measure
retains its sign and magnitude but is no longer significant. The two measures of variable trade costs,
distance and tariffs show no difference between direct and indirect exports.
We observe that product-specific characteristics enter differently for exports by wholesalers and
manufacturers. In particular, the higher is the relationship-specificity of the products exported to
a certain destination, the lower are the indirect exports. Moreover, the more homogeneous are the
products exported to a country, i.e. the higher is the export elasticity, the more likely that exports to
that country are handled by intermediaries. The mode of transport variable is negatively related to
direct exports but not statistically correlated with indirect exports.
All together these results emphasize the importance of both country and product characteristics in
explaining the aggregate exports for wholesalers and manufacturers and their differences.
In Tables 6 and 7, we report the same regressions for the number of exporting firms of type i to
country c and the average exports per exporting firm of type i to country c, respectively. The general
pattern of results is similar as that found for aggregate exports. As expected from the earlier work
of Bernard et al. (2007) and Mayer and Ottaviano (2008), the effects of country characteristics are
strongest for the extensive margin of the number of firms exporting in the case of both manufacturers
and wholesalers. For the product-based variables, we find that the intensive margin of trade reacts more
strongly than the extensive margin.20
5.2.1 Robustness
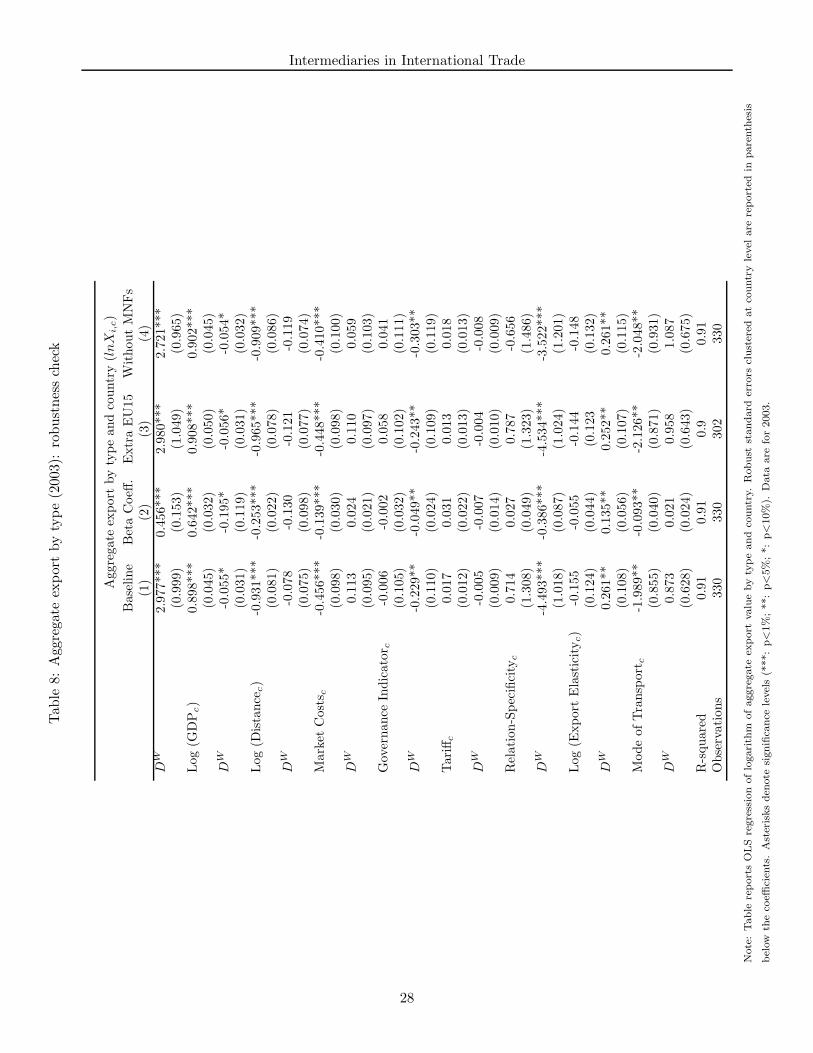
We report several additional specifications on aggregate country exports by firm type in Table 8 to
check for robustness. Column (1) repeats the regression including all the country characteristics from
Column (3) in Table 5. To get a sense of the economic significance of the estimated coefficients we report
in Column (2) the beta coefficients from the baseline regression that represent the change in terms of
standard deviations in the dependent variable that result from a change of one standard deviation in an
independent variable (Wooldridge; 2008). The standardized coefficients suggest that GDP and distance,
have a strong impact on the dependent variable. A one standard deviation increase in country’s GDP
raises the logarithm of aggregate exports by 0.64 standard deviations. A strong impact is observable
also for the relation-specificity variable.
The aggregate data for 2003 reveal that more than 55 percent of total Italian exports is directed to
European Union countries (EU15). To rule out the possibility that our results are driven by differences
between intra-EU and extra-EU destinations, we estimate our base specification for extra-EU markets.
20Note however that the strong role for the product extensive margin (number of products exported) found in otherresearch suggests that average exports per firm may be responding largely to changes in the number of products exportedto each destination.
20

Intermediaries in International Trade
Column (3) drops EU countries from the sample with no substantial changes to the results.
Some concerns may arise regarding the inclusion of multinationals in the analysis, as some of them
are classified as wholesalers in the Italian sectoral classification of business. We run again our baseline
model excluding these firms in column (4). The sign and the significance of the coefficients are all
unchanged.
5.3 Firm exports and country characteristics
In this section we further investigate the role of market characteristics in the choice of the export mode,
by taking a firm level perspective.
We regress the (log) firm-country export value on country characteristics and interact each charac-
teristic with a dummy for whether or not the firm is an intermediary,
ln Xfc = c + β1Xc + β2Xc ∗ DWf + δf + εfc (7)
where Xfc is the value the exports of firm f to country c, Xc is a vector of market characteristics, and
DWf is a dummy equaling one when the firm is a wholesaler and zero otherwise.
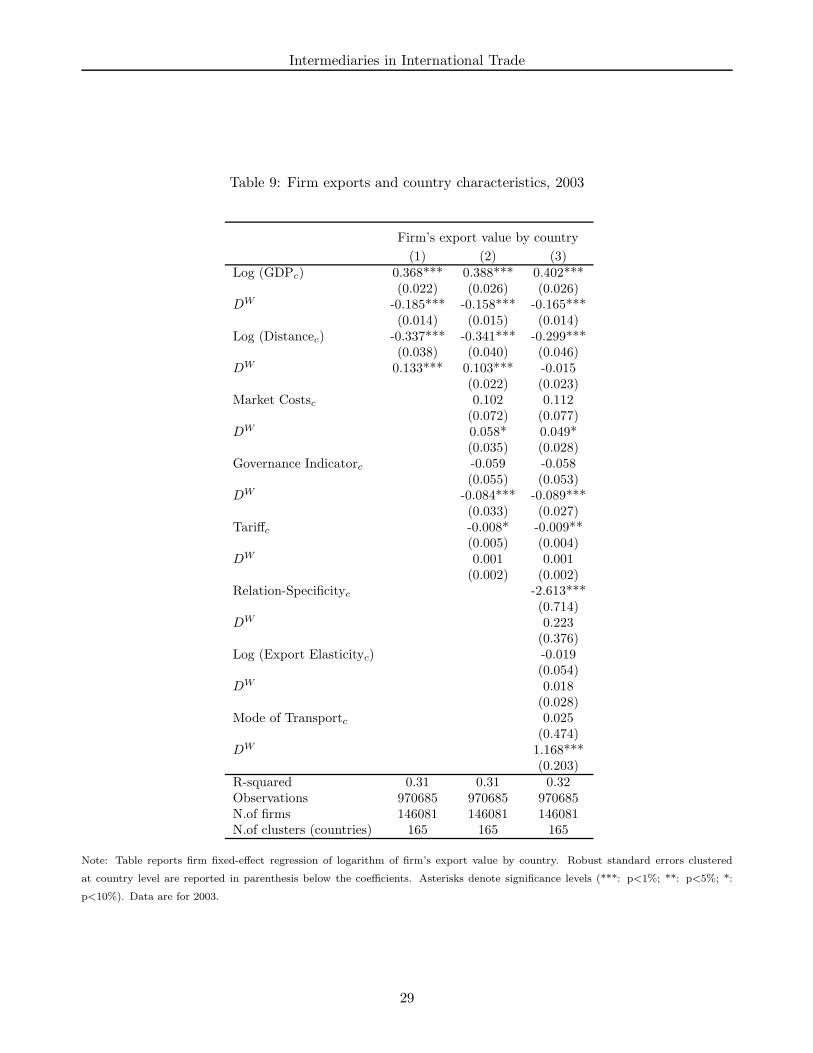
In Table 9, we estimate the equation controlling for firm fixed effects, δf , allowing us to examine the
within-firm variation of exports separately for intermediaries and manufacturers. Results for the two
gravity variables, GDP and distance, in column (1) confirm earlier findings that exports are higher to
those countries that are closer and have higher GDP. However, intermediary exporters are significantly
less sensitive to these country characteristics than their manufacturing counterparts. Market size is
positively related to firm’s export volume, but the effect is only half as strong for intermediaries as for
manufacturers. In contrast to the aggregate results, export values decrease as firms trade with more
distant markets, but less so for wholesalers. A one log point increase in distance implies a 21.0 percent
drop in manufacturer exports, but only a 14.1 percent decline for wholesaler exports.
Column (2) includes fixed and variable trade costs. For the gravity variables, GDP and distance,
the sign and the significance of the coefficients is the same as in the bivariate specification. Also
the magnitude of the coefficients changes only slightly. The two proxies for market entry costs,Market
Costs and Governance Indicator, show even sharper differences between wholesalers and manufacturers.
Manufacturers export volumes do not appear to vary with market or administrative costs. On the
contrary for wholesalers there is a positive relationships between fixed costs and export volumes. These
findings support the conjecture that the higher the fixed costs of exporting to a given country, the more
likely that the operation is carried out by intermediaries.
Column (3) includes all the variables. Although the magnitudes of the various coefficients have
changed with respect to other specifications, the overall message is unchanged. Export volume grows
with country GDP, but less so for wholesalers. Geographical distance and higher tariffs decrease exports
equally for manufacturers and wholesalers. Greater market fixed costs, either higher market costs or
21

Intermediaries in International Trade
weaker governance, are associated with higher exports by intermediaries. Firm level exports does not
seem to be much related to aggregated product variables
5.3.1 Robustness
We report several additional specifications in Table 10 to check for robustness. Column (1) repeats
the regression including all the country characteristics from Column (3) in Table 9. Column (2) drops
EU countries from the sample. Overall the results are quite similar with no changes in sign. The
governance indicator is larger and now is significantly positively correlated with direct exports while
the magnitudes of the coefficients on GDP and relationship specificity are smaller. In Column (3) we
drop all multinational firms from the sample. There are no substantial changes in sign, magnitude and
significance from the baseline results.
6 Conclusions
This paper contributes to the relatively new literature on the role of intermediaries in international
trade. Using Italian firm-level data, we document significant differences between exporters of different
types and highlight the role of country-specific fixed costs in the choice of direct versus indirect modes
of export.
Exporting intermediary firms are smaller than manufacturing exporters in terms of employment,
sales and exports but have higher sales per worker and comparable exports per worker. These differences
highlight the fact that direct manufacturing exporters are actually performing multiple activities, i.e.
production of the good and distribution of the good to the foreign market, while intermediaries only
perform the distribution activity.
Recent models of intermediaries in exporting focus on the role of fixed and variable costs in the
determination of the relative importance of direct and indirect exports across countries. We find that
intermediaries are more focused geographically and export a larger number of industries. This idea
that intermediaries are typically providing solutions to country-specific fixed costs is confirmed by the
empirical work. Measures of country fixed costs are positively associated with intermediary exports
both in the aggregate and within firms. In contrast, proxies for variable trade costs are largely not
associated with differences between direct and indirect exports. Further research is needed on the effect
of intermediaries on trade volumes, responses to aggregate shocks, and aggregate welfare.
22
Intermediaries in International Trade
Table 1: Export volumes and Number of exporting firms: share by type of firms, 1998-2003
Year Total Exports Manuf Whol Retail Others(billion) Share (%)
1998 213.61 87.07 9.41 0.58 2.931999 212.97 86.87 9.39 0.71 3.032000 249.18 85.08 9.71 0.76 4.442001 262.22 86.19 10.11 0.91 2.82002 264.03 84.46 11.13 0.89 3.522003 258.47 85.12 11.02 0.90 2.952003* 214.03 92.04 4.67 0.64 2.65
Year Exporters Manuf Whol Retail Others(N. of firms) Share (%)
1998 170264 57.41 25.80 8.11 8.681999 169000 56.65 26.03 8.23 9.092000 175713 55.87 26.20 8.55 9.382001 176674 55.34 26.85 8.86 8.952002 180818 54.45 27.07 8.99 9.482003 181081 54.25 27.42 8.67 9.662003* 35244 76.55 12.30 3.48 7.68
Notes: Table reports the share of export volume and the share of exporters by type of firms (Manufacturers, Wholesalers,
Retailers and Others). 2003∗ refers to 2003 for firms with more than 20 employees. Zeros are due to rounding.
23
Intermediaries in International Trade
Table 2: Export premia, 2003
Dependent Variable DW DX DW · DX Observations R-squared
Ln (Sales) -0.094*** 2.599*** -0.006 985710 0.23(0.004) (0.006) (0.010)
Ln (N.of employees) -0.520*** 1.415*** -0.422*** 1022424 0.29(0.002) (0.003) (0.005)
Ln (Sales/N.of employees) 0.435*** 1.174*** 0.399*** 985710 0.15(0.003) (0.004) (0.007)
Ln (Export) -0.925*** 147892 0.03(0.014)
Ln (Export/N.of employees) 0.016 147892 0.001(0.013)
Notes: Table reports OLS regression of noted characteristic on dummy for firm type (DW ), dummy for exporter (DX),
and their interaction (DW· D
X). Robust standard errors are reported below coefficients. Asterisks denote significance
levels (***: p<1%; **: p<5%; *: p<10%). Data are for 2003.
Table 3: The Concentration of Exports, 2003
Exporting Firms
Manufacture Wholesale
Top 1% 57.3 46.5Top 5% 80.0 73.3Top 10% 89.1 84.8Top 25% 97.2 95.7Top 50% 99.6 99.2Top 100% 100 100
Table reports the distribution of export value across firm-size percentile by firm type. Percentiles are computed on the
distribution of export value of each sector. Data are for 2003.
Table 4: Export premia: geographical and industry diversification, 2003
Exporting firmsIndustry diversification Geographical Diversification
DW DW
NIE -0.565*** NCE -3.871***(0.026) (0.057)
NIE(c1) 0.837*** NCE (c1) -0.131***(0.026) (0.053)
NIE(c2) 0.353*** NCE (c2) -1.522***(0.023) (0.045)
Notes: Table reports OLS estimates (only for exporters) of industry (NIE) and geographical (NCE) diversification on
dummy for firm type (DW ). (c1) denotes control for size as number of employees; (c2) denotes control for size as export
volume. The number of observations is 147892 for all regressions. Robust standard errors are reported below coefficients.
Asterisks denote significance levels (***: p< 1%;**: p<5%; *: p<10%). Data are for 2003.
24

Intermediaries in International Trade
Table 5: Aggregate export by type, 2003
Aggregate export by type and country (lnXi,c)
(1) (2) (3)DW 2.520*** 1.315 2.977***
(0.801) (0.974) (0.999)Log (GDPc) 0.956*** 0.860*** 0.898***
(0.036) (0.042) (0.045)DW -0.102*** -0.035 -0.055*
(0.032) (0.045) (0.031)Log (Distancec) -1.046*** -1.026*** -0.931***
(0.068) (0.069) (0.081)DW -0.232*** -0.277*** -0.078
(0.058) (0.062) (0.075)Market Costsc -0.510*** -0.456***
(0.099) (0.098)DW 0.133* 0.113
(0.073) (0.095)Governance Indicatorc -0.033 -0.006
(0.112) (0.105)DW -0.237** -0.229**
(0.117) (0.110)Tariffc 0.015 0.017
(0.012) (0.012)DW 0.001 -0.005
(0.008) (0.009)Relation-Specificityc 0.714
(1.308)DW -4.493***
(1.018)Log (Export Elasticityc) -0.155
(0.124)DW 0.261**
(0.108)Mode of Transportc -1.989**
(0.855)DW 0.873
(0.628)R-squared 0.88 0.90 0.91Observations 330 330 330
Note: Table reports OLS regression of logarithm of aggregate export value by type and country. Robust standard errors clustered
at country level are reported in parenthesis below the coefficients. Asterisks denote significance levels (***: p<1%; **: p<5%; *:
p<10%). Data are for 2003.
25

Intermediaries in International Trade
Table 6: Number of firms by type, 2003
Number of firms by type and country (lnFi,c)
(1) (2) (3)DW 3.029*** 2.434*** 2.538***
(0.477) (0.542) (0.525)Log (GDPc) 0.748*** 0.656*** 0.646***
(0.028) (0.029) (0.033)DW -0.118*** -0.084*** -0.078***
(0.016) (0.020) (0.021)Log (Distancec) -0.839*** -0.817*** -0.792***
(0.062) (0.061) (0.084)DW -0.186*** -0.205*** -0.024
(0.030) (0.030) (0.043)Market Costsc -0.309*** -0.319***
(0.084) (0.087)DW 0.043 0.056
(0.051) (0.046)Governance Indicatorc 0.108 0.110
(0.098) (0.092)DW -0.124** -0.110**
(0.053) (0.049)Tariffc 0.026* 0.025
(0.013) (0.015)DW -0.005 -0.005
(0.005) (0.005)Relation-Specificityc -1.058
(0.751)DW -1.573**
(0.490)Log (Export Elasticityc) 0.111
(0.069)DW 0.056
(0.050)Mode of Transportc 0.371
(0.676)DW -0.044
(0.305)R-squared 0.87 0.90 0.90Observations 330 330 330
Note: Table reports OLS regression of logarithm of number of firms by type and country. Robust standard errors clustered at country
level are reported in parenthesis below the coefficients. Asterisks denote significance levels (***: p<1%; **: p<5%; *: p<10%). Data
are for 2003.
26

Intermediaries in International Trade
Table 7: Average exports per firm by type, 2003
Average exports per firm by type and country (lnXi,c)
(1) (2) (3)DW -0.511 -1.120 0.438
(0.701) (0.841) (0.950)Log (GDPc) 0.208*** 0.204*** 0.252***
(0.031) (0.044) (0.040)DW 0.015 0.049 0.024
(0.029) (0.040) (0.029)Log (Distancec) -0.207*** -0.209*** -0.139**
(0.050) (0.057) (0.065)DW -0.047 -0.072 -0.054
(0.055) (0.060) (0.079)Market Costsc -0.201** -0.138*
(0.078) (0.081)DW 0.089 0.057
(0.088) (0.089)Governance Indicatorc -0.141 -0.116
(0.103) (0.094)DW -0.112 -0.119
(0.114) (0.108)Tariffc -0.011 -0.008
(0.008) (0.007)DW 0.005 0.001
(0.008) (0.008)Relation-Specificityc 1.773
(1.367)DW -2.920**
(1.081)Log (Export Elasticityc) -0.266**
(0.113)DW 0.204**
(0.106)Mode of Transportc -2.360***
(0.699)DW 0.916
(0.635)R-squared 0.47 0.50 0.57Observations 330 330 330
Note: Table reports OLS regression of logarithm of average exports per firm by type and country. Robust standard errors clustered
at country level are reported in parenthesis below the coefficients. Asterisks denote significance levels (***: p<1%; **: p<5%; *:
p<10%). Data are for 2003.
27
Intermediaries in International TradeTab
le8:
Agg
rega
teex
por
tby
type
(200
3):
robust
nes
sch
eck
Aggre
gate
export
by
type
and
countr
y(l
nX
i,c)
Base
line
Bet
aC
oeff
.E
xtr
aE
U15
Without
MN
Fs
(1)
(2)
(3)
(4)
DW
2.9
77***
0.4
56***
2.9
80***
2.7
21***
(0.9
99)
(0.1
53)
(1.0
49)
(0.9
65)
Log
(GD
Pc)
0.8
98***
0.6
42***
0.9
08***
0.9
02***
(0.0
45)
(0.0
32)
(0.0
50)
(0.0
45)
DW
-0.0
55*
-0.1
95*
-0.0
56*
-0.0
54*
(0.0
31)
(0.1
19)
(0.0
31)
(0.0
32)
Log
(Dis
tance
c)
-0.9
31***
-0.2
53***
-0.9
65***
-0.9
09***
(0.0
81)
(0.0
22)
(0.0
78)
(0.0
86)
DW
-0.0
78
-0.1
30
-0.1
21
-0.1
19
(0.0
75)
(0.0
98)
(0.0
77)
(0.0
74)
Mark
etC
ost
s c-0
.456***
-0.1
39***
-0.4
48***
-0.4
10***
(0.0
98)
(0.0
30)
(0.0
98)
(0.1
00)
DW
0.1
13
0.0
24
0.1
10
0.0
59
(0.0
95)
(0.0
21)
(0.0
97)
(0.1
03)
Gov
ernance
Indic
ato
r c-0
.006
-0.0
02
0.0
58
0.0
41
(0.1
05)
(0.0
32)
(0.1
02)
(0.1
11)
DW
-0.2
29**
-0.0
49**
-0.2
43**
-0.3
03**
(0.1
10)
(0.0
24)
(0.1
09)
(0.1
19)
Tari
ffc
0.0
17
0.0
31
0.0
13
0.0
18
(0.0
12)
(0.0
22)
(0.0
13)
(0.0
13)
DW
-0.0
05
-0.0
07
-0.0
04
-0.0
08
(0.0
09)
(0.0
14)
(0.0
10)
(0.0
09)
Rel
ation-S
pec
ifici
tyc
0.7
14
0.0
27
0.7
87
-0.6
56
(1.3
08)
(0.0
49)
(1.3
23)
(1.4
86)
DW
-4.4
93***
-0.3
86***
-4.5
34***
-3.5
22***
(1.0
18)
(0.0
87)
(1.0
24)
(1.2
01)
Log
(Export
Ela
stic
ity
c)
-0.1
55
-0.0
55
-0.1
44
-0.1
48
(0.1
24)
(0.0
44)
(0.1
23
(0.1
32)
DW
0.2
61**
0.1
35**
0.2
52**
0.2
61**
(0.1
08)
(0.0
56)
(0.1
07)
(0.1
15)
Mode
ofTra
nsp
ort
c-1
.989**
-0.0
93**
-2.1
26**
-2.0
48**
(0.8
55)
(0.0
40)
(0.8
71)
(0.9
31)
DW
0.8
73
0.0
21
0.9
58
1.0
87
(0.6
28)
(0.0
24)
(0.6
43)
(0.6
75)
R-s
quare
d0.9
10.9
10.9
0.9
1O
bse
rvations
330
330
302
330
Note
:Table
report
sO
LS
regre
ssio
noflo
gari
thm
ofaggre
gate
export
valu
eby
type
and
countr
y.R
obust
standard
erro
rscl
ust
ered
at
countr
yle
vel
are
report
edin
pare
nth
esis
bel
owth
eco
effici
ents
.A
ster
isks
den
ote
signifi
cance
level
s(*
**:
p<
1%
;**:
p<
5%
;*:
p<
10%
).D
ata
are
for
2003.
28
Intermediaries in International Trade
Table 9: Firm exports and country characteristics, 2003
Firm’s export value by country
(1) (2) (3)Log (GDPc) 0.368*** 0.388*** 0.402***
(0.022) (0.026) (0.026)DW -0.185*** -0.158*** -0.165***
(0.014) (0.015) (0.014)Log (Distancec) -0.337*** -0.341*** -0.299***
(0.038) (0.040) (0.046)DW 0.133*** 0.103*** -0.015
(0.022) (0.023)Market Costsc 0.102 0.112
(0.072) (0.077)DW 0.058* 0.049*
(0.035) (0.028)Governance Indicatorc -0.059 -0.058
(0.055) (0.053)DW -0.084*** -0.089***
(0.033) (0.027)Tariffc -0.008* -0.009**
(0.005) (0.004)DW 0.001 0.001
(0.002) (0.002)Relation-Specificityc -2.613***
(0.714)DW 0.223
(0.376)Log (Export Elasticityc) -0.019
(0.054)DW 0.018
(0.028)Mode of Transportc 0.025
(0.474)DW 1.168***
(0.203)R-squared 0.31 0.31 0.32Observations 970685 970685 970685N.of firms 146081 146081 146081N.of clusters (countries) 165 165 165
Note: Table reports firm fixed-effect regression of logarithm of firm’s export value by country. Robust standard errors clustered
at country level are reported in parenthesis below the coefficients. Asterisks denote significance levels (***: p<1%; **: p<5%; *:
p<10%). Data are for 2003.
29
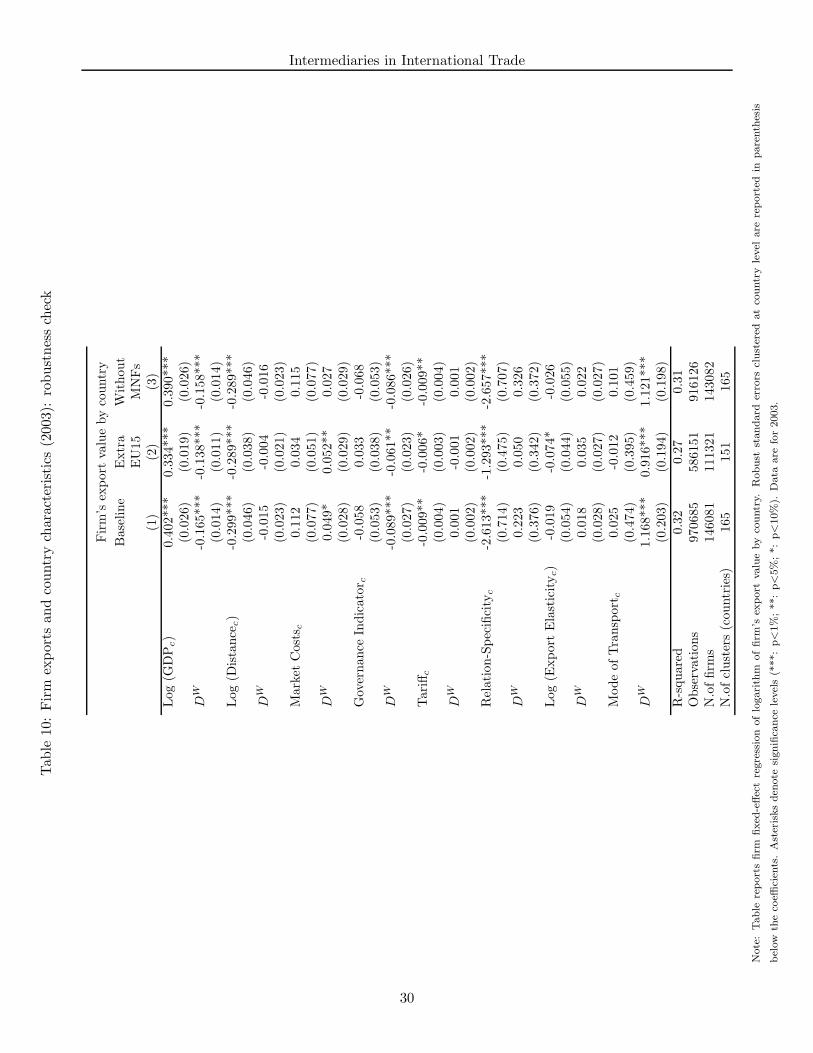
Intermediaries in International TradeTab
le10
:Fir
mex
por
tsan
dco
untr
ych
arac
teri
stic
s(2
003)
:ro
bust
nes
sch
eck
Fir
m’s
export
valu
eby
countr
y
Base
line
Extr
aW
ithout
EU
15
MN
Fs
(1)
(2)
(3)
Log
(GD
Pc)
0.4
02***
0.3
34***
0.3
90***
(0.0
26)
(0.0
19)
(0.0
26)
DW
-0.1
65***
-0.1
38***
-0.1
58***
(0.0
14)
(0.0
11)
(0.0
14)
Log
(Dis
tance
c)
-0.2
99***
-0.2
89***
-0.2
89***
(0.0
46)
(0.0
38)
(0.0
46)
DW
-0.0
15
-0.0
04
-0.0
16
(0.0
23)
(0.0
21)
(0.0
23)
Mark
etC
ost
s c0.1
12
0.0
34
0.1
15
(0.0
77)
(0.0
51)
(0.0
77)
DW
0.0
49*
0.0
52**
0.0
27
(0.0
28)
(0.0
29)
(0.0
29)
Gov
ernance
Indic
ato
r c-0
.058
0.0
33
-0.0
68
(0.0
53)
(0.0
38)
(0.0
53)
DW
-0.0
89***
-0.0
61**
-0.0
86***
(0.0
27)
(0.0
23)
(0.0
26)
Tari
ffc
-0.0
09**
-0.0
06*
-0.0
09**
(0.0
04)
(0.0
03)
(0.0
04)
DW
0.0
01
-0.0
01
0.0
01
(0.0
02)
(0.0
02)
(0.0
02)
Rel
ation-S
pec
ifici
tyc
-2.6
13***
-1.2
93***
-2.6
57***
(0.7
14)
(0.4
75)
(0.7
07)
DW
0.2
23
0.0
50
0.3
26
(0.3
76)
(0.3
42)
(0.3
72)
Log
(Export
Ela
stic
ity
c)
-0.0
19
-0.0
74*
-0.0
26
(0.0
54)
(0.0
44)
(0.0
55)
DW
0.0
18
0.0
35
0.0
22
(0.0
28)
(0.0
27)
(0.0
27)
Mode
ofTra
nsp
ort
c0.0
25
-0.0
12
0.1
01
(0.4
74)
(0.3
95)
(0.4
59)
DW
1.1
68***
0.9
16***
1.1
21***
(0.2
03)
(0.1
94)
(0.1
98)
R-s
quare
d0.3
20.2
70.3
1O
bse
rvations
970685
586151
916126
N.o
ffirm
s146081
111321
143082
N.o
fcl
ust
ers
(countr
ies)
165
151
165
Note
:Table
report
sfirm
fixed
-effec
tre
gre
ssio
nof
logari
thm
of
firm
’sex
port
valu
eby
countr
y.R
obust
standard
erro
rscl
ust
ered
at
countr
yle
vel
are
report
edin
pare
nth
esis
bel
owth
eco
effici
ents
.A
ster
isks
den
ote
signifi
cance
level
s(*
**:
p<
1%
;**:
p<
5%
;*:
p<
10%
).D
ata
are
for
2003.
30
Intermediaries in International Trade
Appendix
Data
As specified in Section 3.2 we complement the firm-level trade data with country characteristics including
proxies for market size and variable and fixed trade costs.
To proxy transportation costs we use data on geographic distance taken from CEPII. Distances are
calculated following the great circle formula, which uses latitudes and longitudes of the most important
city (in terms of population) or of the official capital.
As a proxy for policy barriers we use a measure of country-level import tariffs. Tariff data are
taken from World Integrated Trade System (WITS), a project jointly developed by the World Bank
and UNCTAD. WITS contains the TRAINS database on bilateral tariffs at the six-digit level of the
Harmonized System (HS) product classification for about 5000 products and 200 countries.
To generate a proxy for the market-specific fixed costs of exporting to a country, we use information
from the World Bank Doing Business (DB). The World Bank compiles procedural requirements for
importing a standardized cargo of goods by ocean transport. All documents needed by the exporters
and importers in each country to trade goods across the border are recorded, along with the time and
cost necessary for completion (for details, see Djankov et al.; 2006). For the purpose of our analysis we
use three variables: number of documents for importing includes all documents required per shipment
to import the goods from a given destination; cost of importing measures the fees levied on a 20-foot
container in US dollars; time to import reflects the number of days needed to import a container of
standard goods from a factory in the largest business city to a ship in the most accessible port. Data
are available from 2004 to 2010, while the last year of the Italian firm-level database is 2003. However,
given the low variability of these indicators, we take the average value over the available years.
In addition to country characteristics we examine the role of product and industry characteristics.
We aggregate several product-level measures to the country level.
The first variable that we consider is a measure of industry contract intensity developed by Nunn
(2007) to measure the importance of relationship-specific investment in intermediate inputs across in-
dustries. Nunn’s data are classified according to the industry classification of the US I-O table compiled
by the Bureau of Economic Activity. To match each I-O industry to an HS6 product, we follow several
steps. First, using information from Lawson et al. (2002) we construct a concordance between I-O in-
dustry classification and NAICS1997 code. Second, we convert data from NAICS1997 to NAICS2002.
Finally, we exploit the concordance between Harmonize System Codes and NAICS Industries developed
by Pierce and Schott (2009) to obtain the information on contract intensity at the level of HS6 product.
These product-level measures of relationship specificity are then weighted by the share of Italian exports
in the HS6 product-country.
31
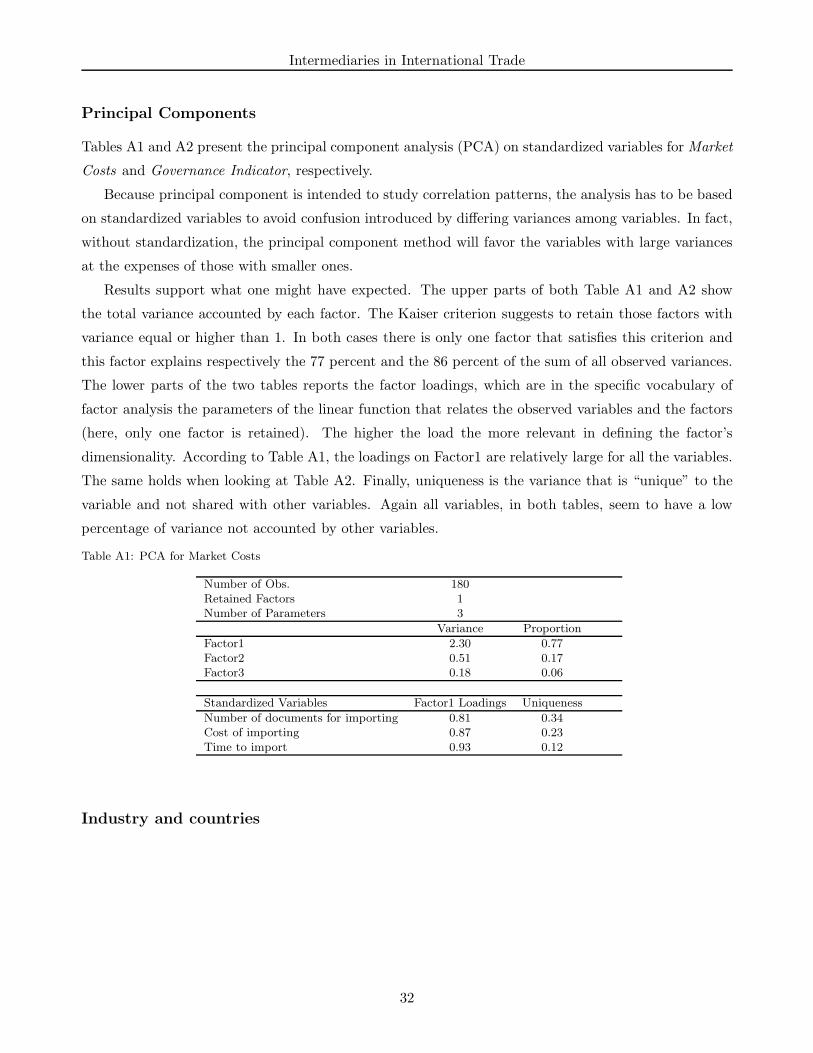
Intermediaries in International Trade
Principal Components
Tables A1 and A2 present the principal component analysis (PCA) on standardized variables for Market
Costs and Governance Indicator, respectively.
Because principal component is intended to study correlation patterns, the analysis has to be based
on standardized variables to avoid confusion introduced by differing variances among variables. In fact,
without standardization, the principal component method will favor the variables with large variances
at the expenses of those with smaller ones.
Results support what one might have expected. The upper parts of both Table A1 and A2 show
the total variance accounted by each factor. The Kaiser criterion suggests to retain those factors with
variance equal or higher than 1. In both cases there is only one factor that satisfies this criterion and
this factor explains respectively the 77 percent and the 86 percent of the sum of all observed variances.
The lower parts of the two tables reports the factor loadings, which are in the specific vocabulary of
factor analysis the parameters of the linear function that relates the observed variables and the factors
(here, only one factor is retained). The higher the load the more relevant in defining the factor’s
dimensionality. According to Table A1, the loadings on Factor1 are relatively large for all the variables.
The same holds when looking at Table A2. Finally, uniqueness is the variance that is “unique” to the
variable and not shared with other variables. Again all variables, in both tables, seem to have a low
percentage of variance not accounted by other variables.
Table A1: PCA for Market Costs
Number of Obs. 180Retained Factors 1Number of Parameters 3
Variance Proportion
Factor1 2.30 0.77Factor2 0.51 0.17Factor3 0.18 0.06
Standardized Variables Factor1 Loadings Uniqueness
Number of documents for importing 0.81 0.34Cost of importing 0.87 0.23Time to import 0.93 0.12
Industry and countries
32

Intermediaries in International Trade
Table A2: PCA for Governance Indicator
Number of Obs. 193Retained Factors 1Number of Parameters 6
Variance Proportion
Factor1 5.16 0.86Factor2 0.4 0.07Factor3 0.28 0.05Factor4 0.09 0.01Factor5 0.05 0.01Factor6 0.03 0.01
Standardized Variables Factor1 Loadings Uniqueness
Voice & Accountability 0.86 0.25Political Stability 0.85 0.27Government Effectiveness 0.96 0.09Regulatory Quality 0.95 0.1Rule of low 0.98 0.05Control of Corruption 0.96 0.09
Table A3: Industry and country extensive margins and the share of exports, 2003. Manufacturers vs. Wholesale
Manufacture
NCE1-5 6-10 11-20 21+ Total
% of exporting firms
NIE
1-5 61.9 10.55 7.29 3.17 82.916-10 1.95 2.16 3.43 3.39 10.9311-20 0.41 0.46 1.18 2.73 4.7821+ 0.06 0.05 0.19 1.08 1.38
Total 64.32 13.22 12.09 10.37 100
% of export value
NIE
1-5 4.37 4.07 6.5 11.19 26.146-10 0.79 1.99 4.07 12.83 19.6911-20 0.25 0.79 3.18 18.63 22.8521+ 0.12 0.19 1.5 29.51 31.33
Total 5.53 7.05 15.26 72.17 100
Wholesale
NCE1-5 6-10 11-20 21+ Total
% of exporting firms
NIE
1-5 75.49 6.79 2.83 0.81 85.926-10 3.8 2.02 1.76 0.82 8.411-20 1.54 0.86 0.95 0.77 4.1121+ 0.62 0.28 0.28 0.4 1.57
Total 81.45 9.94 5.82 2.79 100
% of export value
NIE
1-5 19.45 9.78 12.46 7.67 49.356-10 3.54 2.87 4.49 8.31 19.2111-20 2.69 2.41 3.39 7.36 15.8521+ 2.21 1.93 3.11 8.34 15.59
Total 27.88 16.98 23.45 31.68 100
Data are for 2003.
33
Intermediaries in International Trade
References
Ahn, J., Khandelwal, A. and Wei, S. (2010). The role of intermediaries in facilitating trade, Working
Paper 15706, National Bureau of Economic Research.
Akerman, A. (2010). A theory on the role of wholesalers in international trade based on economies of
scope, Research paper in Economics 1, Stockholm University, Department of Economics.
Antras, P. and Costinot, A. (2010). Intermediated trade, Working Paper 15750, NBER.
Bernard, A. B., Eaton, J., Jensen, J. B. and Kortum, S. S. (2003). Plants and productivity in interna-
tional trade, American Economic Review 93(4): 1268–1290.
Bernard, A. B. and Jensen, B. J. (1995). Exporters, jobs, and wages in U.S. manufacturing: 1976-87,
Brookings Papers on Economic Activity: Microeconomics 1995: 67–112.
Bernard, A. B. and Jensen, B. J. (1999). Exceptional exporter performance: cause, effect, or both?,
Journal of International Economics 47(1): 1–25.
Bernard, A. B. and Jensen, J. B. (2004). Why some firms export, The Review of Economics and
Statistics 86(2): 561–569.
Bernard, A. B., Jensen, J. B., Redding, S. J. and Schott, P. K. (2007). Firms in international trade,
Journal of Economic Perspectives 21(3): 105–130.
Bernard, A. B., Jensen, J. B., Redding, S. J. and Schott, P. K. (2010a). Intrafirm trade and product
contractibility, American Economic Review 100(2): 444–48.
Bernard, A. B., Jensen, J. B., Redding, S. J. and Schott, P. K. (2010b). Wholesalers and retailers in us
trade, American Economic Review 100(2): 408–13.
Bernard, A. B., Jensen, J. B. and Schott, P. K. (2009). Importers, exporters, and multinationals: A
portrait of firms in the U.S. that trade goods, in T. Dunne, J. Jensen and M. Roberts (eds), Producer
dynamics: New Evidence from Micro Data, University of Chicago Press.
Blum, B., Claro, S. and Horstmann (2008). Intermediation and the nature of trade costs: theory and
evidence, Unpublished.
Broda, C., Greenfield, J. and Weinstein, D. (2006). From groundnuts to globalization: A structural
estimate of trade and growth, Working Paper 12512, NBER.
Djankov, S., Freund, C. and Pham, C. S. (2006). Trading on time, Policy Research Working Paper
Series 3909, The World Bank.
34

Intermediaries in International Trade
Eaton, J., Kortum, S. S. and Kramarz, F. (2009). An anatomy of international trade: Evidence from
french firms, CEPR Discussion Papers 7111, C.E.P.R. Discussion Papers.
Felbermayr, G. and Jung, B. (2009). Trade intermediaries and the organization of exporters, Discussion
paper 309, University of Hohenheim, Department of Economics.
Helpman, E., Melitz, M. J. and Yeaple, S. R. (2004). Export versus fdi with heterogeneous firms,
American Economic Review 94(1): 300–316.
Hummels, D. (2007). Transportation costs and international trade in the second era of globalization,
Journal of Economic Perspectives 21(3): 131–154.
Kaufman, D., Kraay, A. and Mastruzzi, M. (2009). Governance matter viii: Aggregate and individual
governance indicators 1996-2008, Policy Research Paper 4978, World Bank.
Lawson, A. M., Bersani, K. S., Fahim-Nader, M. and Guo, J. (2002). Benchmark input-output accounts
of the united states, Survey of Current Business 82: 19–108.
Mayer, T. and Ottaviano, G. (2008). The happy few: The internationalisation of european firms,
Intereconomics: Review of European Economic Policy 43(3): 135–148.
Mayer, T. and Zignago, S. (2005). Market access in global and regional trade, Working Papers 2005-02,
CEPII research center.
Melitz, M. J. (2003). The impact of trade on intra-industry reallocations and aggregate industry
productivity, Econometrica 71(6): 1695–1725.
Nunn, N. (2007). Relationship-specificity, incomplete contracts, and the pattern of trade, The Quarterly
Journal of Economics 122(2): 569–600.
Peng, M. W. and Ilinitch, A. Y. (2001). Export intermediary firms: A not on export development
research, Journal of International Business Studies 29(3): 609–620.
Petropoulou, D. (2007). Information costs, networks and intermediation in international trade, Eco-
nomics series working papers, University of Oxford, Department of Economics.
Pierce, J. and Schott, P. (2009). A concordance between ten-digit U.S. Harmonized System Codes and
sic/naics product classes and industries, Working Paper 155486, NBER.
Rauch, J. E. and Watson, J. (2004). Network intermediaries in international trade, Journal of Economics
& Management Strategy 13(1): 69–93.
Roberts, M. J. and Tybout, J. R. (1997). The decision to export in colombia: An empirical model of
entry with sunk costs, American Economic Review 87(4): 545–64.
35

Intermediaries in International Trade
Silverman, B. W. (1986). Density Estimation for Statistics and Data Analysis, London: Chapman &
Hall/CRC.
Wooldridge, J. M. (2008). Introductory Econometrics: A modern approach 4E, South Western Educa-
tional Publishing.
36

NBB WORKING PAPER No. 199 - OCTOBER 2010 37
NATIONAL BANK OF BELGIUM - WORKING PAPERS SERIES 1. "Model-based inflation forecasts and monetary policy rules", by M. Dombrecht and R. Wouters, Research
Series, February 2000. 2. "The use of robust estimators as measures of core inflation", by L. Aucremanne, Research Series,
February 2000. 3. "Performances économiques des Etats-Unis dans les années nonante", by A. Nyssens, P. Butzen and
P. Bisciari, Document Series, March 2000. 4. "A model with explicit expectations for Belgium", by P. Jeanfils, Research Series, March 2000. 5. "Growth in an open economy: Some recent developments", by S. Turnovsky, Research Series, May
2000. 6. "Knowledge, technology and economic growth: An OECD perspective", by I. Visco, A. Bassanini and
S. Scarpetta, Research Series, May 2000. 7. "Fiscal policy and growth in the context of European integration", by P. Masson, Research Series, May
2000. 8. "Economic growth and the labour market: Europe's challenge", by C. Wyplosz, Research Series, May
2000. 9. "The role of the exchange rate in economic growth: A euro-zone perspective", by R. MacDonald,
Research Series, May 2000. 10. "Monetary union and economic growth", by J. Vickers, Research Series, May 2000. 11. "Politique monétaire et prix des actifs: le cas des États-Unis", by Q. Wibaut, Document Series, August
2000. 12. "The Belgian industrial confidence indicator: Leading indicator of economic activity in the euro area?", by
J.-J. Vanhaelen, L. Dresse and J. De Mulder, Document Series, November 2000. 13. "Le financement des entreprises par capital-risque", by C. Rigo, Document Series, February 2001. 14. "La nouvelle économie" by P. Bisciari, Document Series, March 2001. 15. "De kostprijs van bankkredieten", by A. Bruggeman and R. Wouters, Document Series, April 2001. 16. "A guided tour of the world of rational expectations models and optimal policies", by Ph. Jeanfils,
Research Series, May 2001. 17. "Attractive prices and euro - Rounding effects on inflation", by L. Aucremanne and D. Cornille,
Documents Series, November 2001. 18. "The interest rate and credit channels in Belgium: An investigation with micro-level firm data", by
P. Butzen, C. Fuss and Ph. Vermeulen, Research series, December 2001. 19. "Openness, imperfect exchange rate pass-through and monetary policy", by F. Smets and R. Wouters,
Research series, March 2002. 20. "Inflation, relative prices and nominal rigidities", by L. Aucremanne, G. Brys, M. Hubert, P. J. Rousseeuw
and A. Struyf, Research series, April 2002. 21. "Lifting the burden: Fundamental tax reform and economic growth", by D. Jorgenson, Research series,
May 2002. 22. "What do we know about investment under uncertainty?", by L. Trigeorgis, Research series, May 2002. 23. "Investment, uncertainty and irreversibility: Evidence from Belgian accounting data" by D. Cassimon,
P.-J. Engelen, H. Meersman and M. Van Wouwe, Research series, May 2002. 24. "The impact of uncertainty on investment plans", by P. Butzen, C. Fuss and Ph. Vermeulen, Research
series, May 2002. 25. "Investment, protection, ownership, and the cost of capital", by Ch. P. Himmelberg, R. G. Hubbard and
I. Love, Research series, May 2002. 26. "Finance, uncertainty and investment: Assessing the gains and losses of a generalised non-linear
structural approach using Belgian panel data", by M. Gérard and F. Verschueren, Research series, May 2002.
27. "Capital structure, firm liquidity and growth", by R. Anderson, Research series, May 2002. 28. "Structural modelling of investment and financial constraints: Where do we stand?", by J.-B. Chatelain,
Research series, May 2002. 29. "Financing and investment interdependencies in unquoted Belgian companies: The role of venture
capital", by S. Manigart, K. Baeyens, I. Verschueren, Research series, May 2002. 30. "Development path and capital structure of Belgian biotechnology firms", by V. Bastin, A. Corhay,
G. Hübner and P.-A. Michel, Research series, May 2002. 31. "Governance as a source of managerial discipline", by J. Franks, Research series, May 2002. 32. "Financing constraints, fixed capital and R&D investment decisions of Belgian firms", by M. Cincera,
Research series, May 2002.
NBB WORKING PAPER No. 199 - OCTOBER 2010 38
33. "Investment, R&D and liquidity constraints: A corporate governance approach to the Belgian evidence", by P. Van Cayseele, Research series, May 2002.
34. "On the origins of the Franco-German EMU controversies", by I. Maes, Research series, July 2002. 35. "An estimated dynamic stochastic general equilibrium model of the euro area", by F. Smets and
R. Wouters, Research series, October 2002. 36. "The labour market and fiscal impact of labour tax reductions: The case of reduction of employers' social
security contributions under a wage norm regime with automatic price indexing of wages", by K. Burggraeve and Ph. Du Caju, Research series, March 2003.
37. "Scope of asymmetries in the euro area", by S. Ide and Ph. Moës, Document series, March 2003. 38. "De autonijverheid in België: Het belang van het toeleveringsnetwerk rond de assemblage van
personenauto's", by F. Coppens and G. van Gastel, Document series, June 2003. 39. "La consommation privée en Belgique", by B. Eugène, Ph. Jeanfils and B. Robert, Document series,
June 2003. 40. "The process of European monetary integration: A comparison of the Belgian and Italian approaches", by
I. Maes and L. Quaglia, Research series, August 2003. 41. "Stock market valuation in the United States", by P. Bisciari, A. Durré and A. Nyssens, Document series,
November 2003. 42. "Modeling the term structure of interest rates: Where do we stand?", by K. Maes, Research series,
February 2004. 43. "Interbank exposures: An ampirical examination of system risk in the Belgian banking system", by
H. Degryse and G. Nguyen, Research series, March 2004. 44. "How frequently do prices change? Evidence based on the micro data underlying the Belgian CPI", by
L. Aucremanne and E. Dhyne, Research series, April 2004. 45. "Firms' investment decisions in response to demand and price uncertainty", by C. Fuss and
Ph. Vermeulen, Research series, April 2004. 46. "SMEs and bank lending relationships: The impact of mergers", by H. Degryse, N. Masschelein and
J. Mitchell, Research series, May 2004. 47. "The determinants of pass-through of market conditions to bank retail interest rates in Belgium", by
F. De Graeve, O. De Jonghe and R. Vander Vennet, Research series, May 2004. 48. "Sectoral vs. country diversification benefits and downside risk", by M. Emiris, Research series,
May 2004. 49. "How does liquidity react to stress periods in a limit order market?", by H. Beltran, A. Durré and P. Giot,
Research series, May 2004. 50. "Financial consolidation and liquidity: Prudential regulation and/or competition policy?", by
P. Van Cayseele, Research series, May 2004. 51. "Basel II and operational risk: Implications for risk measurement and management in the financial
sector", by A. Chapelle, Y. Crama, G. Hübner and J.-P. Peters, Research series, May 2004. 52. "The efficiency and stability of banks and markets", by F. Allen, Research series, May 2004. 53. "Does financial liberalization spur growth?", by G. Bekaert, C.R. Harvey and C. Lundblad, Research
series, May 2004. 54. "Regulating financial conglomerates", by X. Freixas, G. Lóránth, A.D. Morrison and H.S. Shin, Research
series, May 2004. 55. "Liquidity and financial market stability", by M. O'Hara, Research series, May 2004. 56. "Economisch belang van de Vlaamse zeehavens: Verslag 2002", by F. Lagneaux, Document series,
June 2004. 57. "Determinants of euro term structure of credit spreads", by A. Van Landschoot, Research series, July
2004. 58. "Macroeconomic and monetary policy-making at the European Commission, from the Rome Treaties to
the Hague Summit", by I. Maes, Research series, July 2004. 59. "Liberalisation of network industries: Is electricity an exception to the rule?", by F. Coppens and D. Vivet,
Document series, September 2004. 60. "Forecasting with a Bayesian DSGE model: An application to the euro area", by F. Smets and
R. Wouters, Research series, September 2004. 61. "Comparing shocks and frictions in US and euro area business cycle: A Bayesian DSGE approach", by
F. Smets and R. Wouters, Research series, October 2004. 62. "Voting on pensions: A survey", by G. de Walque, Research series, October 2004. 63. "Asymmetric growth and inflation developments in the acceding countries: A new assessment", by S. Ide
and P. Moës, Research series, October 2004. 64. "Importance économique du Port Autonome de Liège: rapport 2002", by F. Lagneaux, Document series,
November 2004.
NBB WORKING PAPER No. 199 - OCTOBER 2010 39
65. "Price-setting behaviour in Belgium: What can be learned from an ad hoc survey", by L. Aucremanne and M. Druant, Research series, March 2005.
66. "Time-dependent versus state-dependent pricing: A panel data approach to the determinants of Belgian consumer price changes", by L. Aucremanne and E. Dhyne, Research series, April 2005.
67. "Indirect effects – A formal definition and degrees of dependency as an alternative to technical coefficients", by F. Coppens, Research series, May 2005.
68. "Noname – A new quarterly model for Belgium", by Ph. Jeanfils and K. Burggraeve, Research series, May 2005.
69. "Economic importance of the Flemish maritime ports: Report 2003", by F. Lagneaux, Document series, May 2005.
70. "Measuring inflation persistence: A structural time series approach", by M. Dossche and G. Everaert, Research series, June 2005.
71. "Financial intermediation theory and implications for the sources of value in structured finance markets", by J. Mitchell, Document series, July 2005.
72. "Liquidity risk in securities settlement", by J. Devriese and J. Mitchell, Research series, July 2005. 73. "An international analysis of earnings, stock prices and bond yields", by A. Durré and P. Giot, Research
series, September 2005. 74. "Price setting in the euro area: Some stylized facts from Individual Consumer Price Data", by E. Dhyne,
L. J. Álvarez, H. Le Bihan, G. Veronese, D. Dias, J. Hoffmann, N. Jonker, P. Lünnemann, F. Rumler and J. Vilmunen, Research series, September 2005.
75. "Importance économique du Port Autonome de Liège: rapport 2003", by F. Lagneaux, Document series, October 2005.
76. "The pricing behaviour of firms in the euro area: New survey evidence, by S. Fabiani, M. Druant, I. Hernando, C. Kwapil, B. Landau, C. Loupias, F. Martins, T. Mathä, R. Sabbatini, H. Stahl and A. Stokman, Research series, November 2005.
77. "Income uncertainty and aggregate consumption”, by L. Pozzi, Research series, November 2005. 78. "Crédits aux particuliers - Analyse des données de la Centrale des Crédits aux Particuliers", by
H. De Doncker, Document series, January 2006. 79. "Is there a difference between solicited and unsolicited bank ratings and, if so, why?", by P. Van Roy,
Research series, February 2006. 80. "A generalised dynamic factor model for the Belgian economy - Useful business cycle indicators and
GDP growth forecasts", by Ch. Van Nieuwenhuyze, Research series, February 2006. 81. "Réduction linéaire de cotisations patronales à la sécurité sociale et financement alternatif", by
Ph. Jeanfils, L. Van Meensel, Ph. Du Caju, Y. Saks, K. Buysse and K. Van Cauter, Document series, March 2006.
82. "The patterns and determinants of price setting in the Belgian industry", by D. Cornille and M. Dossche, Research series, May 2006.
83. "A multi-factor model for the valuation and risk management of demand deposits", by H. Dewachter, M. Lyrio and K. Maes, Research series, May 2006.
84. "The single European electricity market: A long road to convergence", by F. Coppens and D. Vivet, Document series, May 2006.
85. "Firm-specific production factors in a DSGE model with Taylor price setting", by G. de Walque, F. Smets and R. Wouters, Research series, June 2006.
86. "Economic importance of the Belgian ports: Flemish maritime ports and Liège port complex - Report 2004", by F. Lagneaux, Document series, June 2006.
87. "The response of firms' investment and financing to adverse cash flow shocks: The role of bank relationships", by C. Fuss and Ph. Vermeulen, Research series, July 2006.
88. "The term structure of interest rates in a DSGE model", by M. Emiris, Research series, July 2006. 89. "The production function approach to the Belgian output gap, estimation of a multivariate structural time
series model", by Ph. Moës, Research series, September 2006. 90. "Industry wage differentials, unobserved ability, and rent-sharing: Evidence from matched worker-firm
data, 1995-2002", by R. Plasman, F. Rycx and I. Tojerow, Research series, October 2006. 91. "The dynamics of trade and competition", by N. Chen, J. Imbs and A. Scott, Research series, October
2006. 92. "A New Keynesian model with unemployment", by O. Blanchard and J. Gali, Research series, October
2006. 93. "Price and wage setting in an integrating Europe: Firm level evidence", by F. Abraham, J. Konings and
S. Vanormelingen, Research series, October 2006. 94. "Simulation, estimation and welfare implications of monetary policies in a 3-country NOEM model", by
J. Plasmans, T. Michalak and J. Fornero, Research series, October 2006.
NBB WORKING PAPER No. 199 - OCTOBER 2010 40
95. "Inflation persistence and price-setting behaviour in the euro area: A summary of the Inflation Persistence Network evidence ", by F. Altissimo, M. Ehrmann and F. Smets, Research series, October 2006.
96. "How wages change: Micro evidence from the International Wage Flexibility Project", by W.T. Dickens, L. Goette, E.L. Groshen, S. Holden, J. Messina, M.E. Schweitzer, J. Turunen and M. Ward, Research series, October 2006.
97. "Nominal wage rigidities in a new Keynesian model with frictional unemployment", by V. Bodart, G. de Walque, O. Pierrard, H.R. Sneessens and R. Wouters, Research series, October 2006.
98. "Dynamics on monetary policy in a fair wage model of the business cycle", by D. De la Croix, G. de Walque and R. Wouters, Research series, October 2006.
99. "The kinked demand curve and price rigidity: Evidence from scanner data", by M. Dossche, F. Heylen and D. Van den Poel, Research series, October 2006.
100. "Lumpy price adjustments: A microeconometric analysis", by E. Dhyne, C. Fuss, H. Peseran and P. Sevestre, Research series, October 2006.
101. "Reasons for wage rigidity in Germany", by W. Franz and F. Pfeiffer, Research series, October 2006. 102. "Fiscal sustainability indicators and policy design in the face of ageing", by G. Langenus, Research
series, October 2006. 103. "Macroeconomic fluctuations and firm entry: Theory and evidence", by V. Lewis, Research series,
October 2006. 104. "Exploring the CDS-bond basis", by J. De Wit, Research series, November 2006. 105. "Sector concentration in loan portfolios and economic capital", by K. Düllmann and N. Masschelein,
Research series, November 2006. 106. "R&D in the Belgian pharmaceutical sector", by H. De Doncker, Document series, December 2006. 107. "Importance et évolution des investissements directs en Belgique", by Ch. Piette, Document series,
January 2007. 108. "Investment-specific technology shocks and labor market frictions", by R. De Bock, Research series,
February 2007. 109. "Shocks and frictions in US business cycles: A Bayesian DSGE approach", by F. Smets and R. Wouters,
Research series, February 2007. 110. "Economic impact of port activity: A disaggregate analysis. The case of Antwerp", by F. Coppens,
F. Lagneaux, H. Meersman, N. Sellekaerts, E. Van de Voorde, G. van Gastel, Th. Vanelslander, A. Verhetsel, Document series, February 2007.
111. "Price setting in the euro area: Some stylised facts from individual producer price data", by Ph. Vermeulen, D. Dias, M. Dossche, E. Gautier, I. Hernando, R. Sabbatini, H. Stahl, Research series, March 2007.
112. "Assessing the gap between observed and perceived inflation in the euro area: Is the credibility of the HICP at stake?", by L. Aucremanne, M. Collin and Th. Stragier, Research series, April 2007.
113. "The spread of Keynesian economics: A comparison of the Belgian and Italian experiences", by I. Maes, Research series, April 2007.
114. "Imports and exports at the level of the firm: Evidence from Belgium", by M. Muûls and M. Pisu, Research series, May 2007.
115. "Economic importance of the Belgian ports: Flemish maritime ports and Liège port complex - Report 2005", by F. Lagneaux, Document series, May 2007.
116. "Temporal distribution of price changes: Staggering in the large and synchronization in the small", by E. Dhyne and J. Konieczny, Research series, June 2007.
117. "Can excess liquidity signal an asset price boom?", by A. Bruggeman, Research series, August 2007. 118. "The performance of credit rating systems in the assessment of collateral used in Eurosystem monetary
policy operations", by F. Coppens, F. González and G. Winkler, Research series, September 2007. 119. "The determinants of stock and bond return comovements", by L. Baele, G. Bekaert and K. Inghelbrecht,
Research series, October 2007. 120. "Monitoring pro-cyclicality under the capital requirements directive: Preliminary concepts for developing a
framework", by N. Masschelein, Document series, October 2007. 121. "Dynamic order submission strategies with competition between a dealer market and a crossing
network", by H. Degryse, M. Van Achter and G. Wuyts, Research series, November 2007. 122. "The gas chain: Influence of its specificities on the liberalisation process", by C. Swartenbroekx,
Document series, November 2007. 123. "Failure prediction models: Performance, disagreements, and internal rating systems", by J. Mitchell and
P. Van Roy, Research series, December 2007. 124. "Downward wage rigidity for different workers and firms: An evaluation for Belgium using the IWFP
procedure", by Ph. Du Caju, C. Fuss and L. Wintr, Research series, December 2007.
NBB WORKING PAPER No. 199 - OCTOBER 2010 41
125. "Economic importance of Belgian transport logistics", by F. Lagneaux, Document series, January 2008. 126. "Some evidence on late bidding in eBay auctions", by L. Wintr, Research series, January 2008. 127. "How do firms adjust their wage bill in Belgium? A decomposition along the intensive and extensive
margins", by C. Fuss, Research series, January 2008. 128. "Exports and productivity – Comparable evidence for 14 countries", by The International Study Group on
Exports and Productivity, Research series, February 2008. 129. "Estimation of monetary policy preferences in a forward-looking model: A Bayesian approach", by
P. Ilbas, Research series, March 2008. 130. "Job creation, job destruction and firms' international trade involvement", by M. Pisu, Research series,
March 2008. 131. "Do survey indicators let us see the business cycle? A frequency decomposition", by L. Dresse and
Ch. Van Nieuwenhuyze, Research series, March 2008. 132. "Searching for additional sources of inflation persistence: The micro-price panel data approach", by
R. Raciborski, Research series, April 2008. 133. "Short-term forecasting of GDP using large monthly datasets - A pseudo real-time forecast evaluation
exercise", by K. Barhoumi, S. Benk, R. Cristadoro, A. Den Reijer, A. Jakaitiene, P. Jelonek, A. Rua, G. Rünstler, K. Ruth and Ch. Van Nieuwenhuyze, Research series, June 2008.
134. "Economic importance of the Belgian ports: Flemish maritime ports, Liège port complex and the port of Brussels - Report 2006", by S. Vennix, Document series, June 2008.
135. "Imperfect exchange rate pass-through: The role of distribution services and variable demand elasticity", by Ph. Jeanfils, Research series, August 2008.
136. "Multivariate structural time series models with dual cycles: Implications for measurement of output gap and potential growth", by Ph. Moës, Research series, August 2008.
137. "Agency problems in structured finance - A case study of European CLOs", by J. Keller, Document series, August 2008.
138. "The efficiency frontier as a method for gauging the performance of public expenditure: A Belgian case study", by B. Eugène, Research series, September 2008.
139. "Exporters and credit constraints. A firm-level approach", by M. Muûls, Research series, September 2008.
140. "Export destinations and learning-by-exporting: Evidence from Belgium", by M. Pisu, Research series, September 2008.
141. "Monetary aggregates and liquidity in a neo-Wicksellian framework", by M. Canzoneri, R. Cumby, B. Diba and D. López-Salido, Research series, October 2008.
142 "Liquidity, inflation and asset prices in a time-varying framework for the euro area, by Ch. Baumeister, E. Durinck and G. Peersman, Research series, October 2008.
143. "The bond premium in a DSGE model with long-run real and nominal risks", by G. D. Rudebusch and E. T. Swanson, Research series, October 2008.
144. "Imperfect information, macroeconomic dynamics and the yield curve: An encompassing macro-finance model", by H. Dewachter, Research series, October 2008.
145. "Housing market spillovers: Evidence from an estimated DSGE model", by M. Iacoviello and S. Neri, Research series, October 2008.
146. "Credit frictions and optimal monetary policy", by V. Cúrdia and M. Woodford, Research series, October 2008.
147. "Central Bank misperceptions and the role of money in interest rate rules", by G. Beck and V. Wieland, Research series, October 2008.
148. "Financial (in)stability, supervision and liquidity injections: A dynamic general equilibrium approach", by G. de Walque, O. Pierrard and A. Rouabah, Research series, October 2008.
149. "Monetary policy, asset prices and macroeconomic conditions: A panel-VAR study", by K. Assenmacher-Wesche and S. Gerlach, Research series, October 2008.
150. "Risk premiums and macroeconomic dynamics in a heterogeneous agent model", by F. De Graeve, M. Dossche, M. Emiris, H. Sneessens and R. Wouters, Research series, October 2008.
151. "Financial factors in economic fluctuations", by L. J. Christiano, R. Motto and M. Rotagno, Research series, to be published.
152. "Rent-sharing under different bargaining regimes: Evidence from linked employer-employee data", by M. Rusinek and F. Rycx, Research series, December 2008.
153. "Forecast with judgment and models", by F. Monti, Research series, December 2008. 154. "Institutional features of wage bargaining in 23 European countries, the US and Japan", by Ph. Du Caju,
E. Gautier, D. Momferatou and M. Ward-Warmedinger, Research series, December 2008. 155. "Fiscal sustainability and policy implications for the euro area", by F. Balassone, J. Cunha, G. Langenus,
B. Manzke, J Pavot, D. Prammer and P. Tommasino, Research series, January 2009.
NBB WORKING PAPER No. 199 - OCTOBER 2010 42
156. "Understanding sectoral differences in downward real wage rigidity: Workforce composition, institutions, technology and competition", by Ph. Du Caju, C. Fuss and L. Wintr, Research series, February 2009.
157. "Sequential bargaining in a New Keynesian model with frictional unemployment and staggered wage negotiation", by G. de Walque, O. Pierrard, H. Sneessens and R. Wouters, Research series, February 2009.
158. "Economic importance of air transport and airport activities in Belgium", by F. Kupfer and F. Lagneaux, Document series, March 2009.
159. "Rigid labour compensation and flexible employment? Firm-Level evidence with regard to productivity for Belgium", by C. Fuss and L. Wintr, Research series, March 2009.
160. "The Belgian iron and steel industry in the international context", by F. Lagneaux and D. Vivet, Document series, March 2009.
161. "Trade, wages and productivity", by K. Behrens, G. Mion, Y. Murata and J. Südekum, Research series, March 2009.
162. "Labour flows in Belgium", by P. Heuse and Y. Saks, Research series, April 2009. 163. "The young Lamfalussy: An empirical and policy-oriented growth theorist", by I. Maes, Research series,
April 2009. 164. "Inflation dynamics with labour market matching: Assessing alternative specifications", by K. Christoffel,
J. Costain, G. de Walque, K. Kuester, T. Linzert, S. Millard and O. Pierrard, Research series, May 2009. 165. "Understanding inflation dynamics: Where do we stand?", by M. Dossche, Research series, June 2009. 166. "Input-output connections between sectors and optimal monetary policy", by E. Kara, Research series,
June 2009. 167. "Back to the basics in banking? A micro-analysis of banking system stability", by O. De Jonghe,
Research series, June 2009. 168. "Model misspecification, learning and the exchange rate disconnect puzzle", by V. Lewis and
A. Markiewicz, Research series, July 2009. 169. "The use of fixed-term contracts and the labour adjustment in Belgium", by E. Dhyne and B. Mahy,
Research series, July 2009. 170. "Analysis of business demography using markov chains – An application to Belgian data”, by F. Coppens
and F. Verduyn, Research series, July 2009. 171. "A global assessment of the degree of price stickiness - Results from the NBB business survey", by
E. Dhyne, Research series, July 2009. 172. "Economic importance of the Belgian ports: Flemish maritime ports, Liège port complex and the port of
Brussels - Report 2007", by C. Mathys, Document series, July 2009. 173. "Evaluating a monetary business cycle model with unemployment for the euro area", by N. Groshenny,
Research series, July 2009. 174. "How are firms' wages and prices linked: Survey evidence in Europe", by M. Druant, S. Fabiani and
G. Kezdi, A. Lamo, F. Martins and R. Sabbatini, Research series, August 2009. 175. "Micro-data on nominal rigidity, inflation persistence and optimal monetary policy", by E. Kara, Research
series, September 2009. 176. "On the origins of the BIS macro-prudential approach to financial stability: Alexandre Lamfalussy and
financial fragility", by I. Maes, Research series, October 2009. 177. "Incentives and tranche retention in securitisation: A screening model", by I. Fender and J. Mitchell,
Research series, October 2009. 178. "Optimal monetary policy and firm entry", by V. Lewis, Research series, October 2009. 179. "Staying, dropping, or switching: The impacts of bank mergers on small firms", by H. Degryse,
N. Masschelein and J. Mitchell, Research series, October 2009. 180. "Inter-industry wage differentials: How much does rent sharing matter?", by Ph. Du Caju, F. Rycx and
I. Tojerow, Research series, October 2009. 181. "Empirical evidence on the aggregate effects of anticipated and unanticipated US tax policy shocks", by
K. Mertens and M. O. Ravn, Research series, November 2009. 182. "Downward nominal and real wage rigidity: Survey evidence from European firms", by J. Babecký,
Ph. Du Caju, T. Kosma, M. Lawless, J. Messina and T. Rõõm, Research series, November 2009. 183. "The margins of labour cost adjustment: Survey evidence from European firms", by J. Babecký,
Ph. Du Caju, T. Kosma, M. Lawless, J. Messina and T. Rõõm, Research series, November 2009. 184. "Discriminatory fees, coordination and investment in shared ATM networks" by S. Ferrari, Research
series, January 2010. 185. "Self-fulfilling liquidity dry-ups", by F. Malherbe, Research series, March 2010. 186. "The development of monetary policy in the 20th century - some reflections", by O. Issing, Research
series, April 2010.
NBB WORKING PAPER No. 199 - OCTOBER 2010 43
187. "Getting rid of Keynes? A survey of the history of macroeconomics from Keynes to Lucas and beyond", by M. De Vroey, Research series, April 2010.
188. "A century of macroeconomic and monetary thought at the National Bank of Belgium", by I. Maes, Research series, April 2010.
189. "Inter-industry wage differentials in EU countries: What do cross-country time-varying data add to the picture?", by Ph. Du Caju, G. Kátay, A. Lamo, D. Nicolitsas and S. Poelhekke, Research series, April 2010.
190. "What determines euro area bank CDS spreads?", by J. Annaert, M. De Ceuster, P. Van Roy and C. Vespro, Research series, May 2010.
191. "The incidence of nominal and real wage rigidity: An individual-based sectoral approach", by J. Messina, Ph. Du Caju, C. F. Duarte, N. L. Hansen, M. Izquierdo, Research series, June 2010.
192. "Economic importance of the Belgian ports: Flemish maritime ports, Liège port complex and the port of Brussels - Report 2008", by C. Mathys, Document series, July 2010.
193. "Wages, labor or prices: how do firms react to shocks?", by E. Dhyne and M. Druant, Research series, July 2010.
194. "Trade with China and skill upgrading: Evidence from Belgian firm level data", by G. Mion, H. Vandenbussche, and L. Zhu, Research series, September 2010.
195. "Trade crisis? What trade crisis?", by K. Behrens, G. Corcos and G. Mion, Research series, September 2010.
196. "Trade and the global recession", by J. Eaton, S. Kortum, B. Neiman and J. Romalis, Research series, October 2010.
197. "Internationalization strategy and performance of small and medium sized enterprises", by J. Onkelinx and L. Sleuwaegen, Research series, October 2010.
198. "The internationalization process of firms: From exports to FDI?", by P. Conconi, A. Sapir and M. Zanardi, Research series, October 2010.
199. "Intermediaries in international trade: Direct versus indirect modes of export", by A. B. Bernard, M. Grazzi and C. Tomasi, Research series, October 2010.