interim results 2006/07 - investisfiles.investis.com/deb_intermis2006and2007/interims 2006-7... ·...
TRANSCRIPT

0
Interim Results 2006/07

1
Chris Woodhouse
Finance Director

2
Results Highlights
Gross Transaction Value + 5.8%
Like for Like Sales - 4.5%
Gross Margin % -
40 bps
Profit before Tax £105.5m
Net Debt £1,046m
Proposed Interim Dividend 2.5p per share
Underlying Earnings Per Share 9.5p
(b)
Note:
(a) Includes £1.9m of capitalised bank fees written off.
(b) Net Debt excludes debt capitalisation fees
(a)

3
Trading Results H1 2007
£m H1 07 H1 06 % Change
Gross Transaction Value
EBITDA
1,287.8
186.4
1,216.8
198.2
+ 5.8
- 6.0
Operating Profit 139.6 153.1 - 8.8
Interest (34.1) (74.6)
Profit before Tax 105.5 78.5 + 34.4
Taxation (31.4) (23.4)
Profit after tax 74.1 55.1 + 34.5
Underlying Earnings per Share 9.5p 11.1p

4
£m H1 07 H1 06 % Change
Reported Operating Profit 139.6 153.1 - 8.8
• IAS 17 Flat Lining of Lease Rentals 7.3 7.7
• Share Option Costs 1.5 8.8
Underlying Operating Profit 148.4 169.6 - 12.5
Pro forma Interest (32.2) (34.0)
Pro forma Profit Before Tax 116.2 135.6 - 14.3
Pro forma Taxation (34.6) (40.5)
Adjusted Profit Before Tax 81.6 95.1 - 14.2
Adjusted Earnings per Share 9.5p 11.1p
Underlying Profit
(b) (b)
Note:
(a) Excludes capitalised bank fees written off; £1.9m (2006: £2.0m).
(b) Calculated on the basis of 859 million shares in issue for the full period.
(a)

5
1,28
8
1,21
7
1,11
3
1,04
3
800
1,400
H1 04 H1 05 H1 06 H1 07
Tota
l Sal
es (£
m)
Sales Growth H1 History
LFL 0.9% 4.2% 0.6% -4.5%

6
Sales Growth H1 2007
LFL RochesStores
New DeptStores
New DesireStores
International
% G
row
th
(4.5%)
7.0%
2.4%
0.7%
0.2%
+ 5.8%

7
Own Bought69.2%
Own Bought69.9%
Own Bought70.7%
Concessions28.9%
Concessions28.0%
Concessions27.5%
International 1.9%
International 2.1%
International 1.8%
40% 50% 60% 70% 80% 90% 100%
Gross Margin Movement H1 07H1 2007
Gross Margin Benefit bps
Roches impact - 30
Other - 10
Total - 40
Roches impact driven by sales mix and initial low margins as legacy stock was cleared through.
H1 06
H1 07
H1 07 (Exc Roches)
Sal
es M
ix

8
H1 07 (Roches) H1 07 (Debenhams Eire)
Roches Integration
First Half Impact of the Ex-Roches stores mitigated in Second Half by:
Increasing Own Bought Mix
No legacy stock
Renegotiation of Concession rates.
Chain fully stocked
Concessions42.2%
Roche Legacy Stock18.3% Own Bought
39.5%
Own Bought80.1%
Concessions19.9%
Other0.0%

9
Roches First Half Operating Performance
£ m H1 07
Gross Transaction Value 84.6
Gross Margin 32.4
Gross Margin Rate 38.3%
Costs (32.1)
EBITDA 0.3
Depreciation (1.2)
Operating Profit (0.9)

10
Store Costs
£ m H1 07 H1 07
(Exc Roches)
H1 06
Payroll 126.3 111.5 108.0
% to Sales 9.8% 9.3% 8.9%
Store Rent UK GAAP 60.0 53.1 50.1
IFRS Adjustment 7.8 7.8 7.8
Total Store Rent 67.8 60.9 57.9
% to Sales (UK GAAP)
Energy
% to Sales
4.7%
12.8
1.0%
4.4%
12.0
1.0%
4.1%
8.1
0.7%
19 new stores versus H1 06 of which 14 were Department stores and 5 Desire by Debenhams stores.

11
Warehouse and Distribution
Daventry DC closed Nov 05; Bedford DC closed July 06.
£ m H1 07 H1 07
(Exc Roches)
H1 06
Labour 8.2 7.9 10.5
Property 6.4 6.3 7.9
Transport 8.7 7.7 8.3
Total Distribution 23.3 21.9 26.7
% to Sales 1.8% 1.8% 2.2%

12
Store Numbers and FootageSq Ft. (k) Dept Stores Desires Total
2006 Close 9,474 122 4 126
Dept Stores Openings • Roches Acquisition 594.5 9
• Llandudno 46.5 1
Desire Store Openings • Birmingham Fort 12.8 1
• Kirkcaldy 14.4 1
• Merthyr 13.2 1
H1 07 Close 10,155 132 7 139
Dept Stores Openings • Wigan * 20 -
• Warrington 75 1
Desire Store Openings • Altrincham 15 1
• Walton on Thames 12.5 1
2007 Forecast 10,278 133 9 142
* Resite (represents incremental space)

13
Capital Expenditure Mix: 1H 2007
New Stores27%
Roches37%
Systems9%
Store Maintenance
11%
Other14%
Modernisations2%
Total Spend: £44.5m

14
42.925.6
36.1 41.1
10.6
10.210.3
16.9
31.1 68.5 42.1
72.0
19.0
0
20
40
60
80
100
120
140
160
Cap
ital S
pend
(£ m
)
Roches StoresNew StoresModernisationsOther
Capital Expenditure
2004 2005 2006 2007Capex £/ Sq. Ft.
New Stores 121 108 107 106
88.5
104.3
149
84.6
Est.

15
Balance Sheet Highlights
H1 07 H1 06 Movement
Fixed Assets 1,586 1,559 27
Stock 231 226 5
Other Working Capital (342) (348) 6
Net Debt (1,032) (1,743) 711
Liabilities and Charges (322) (320) (2)
Shareholders’
Funds 121 (626) 747
Fixed Charge Cover 2.5
Net Debt / EBITDA 3.4 x
Pension Surplus 26.1
(a)
Notes:
(a) MAA to February.
(b) Net Debt including debt capitalisation fees of £14.1m
£m
(b)(a)

16
Operating Cash flow
£m H1 07 H1 06
Reported Operating Profit 139.6 153.1
Depreciation 43.6 42.4
Amortisation 3.2 2.3
Profit on Disposal - 0.4
EBITDA 186.4 198.2
Working Capital –
Trading (7.4) 5.7
– Pension (5.6) (0.5)
Capital Expenditure (44.5) (51.5)
Operating Cash flow before Exceptionals, Financing & Taxation 128.9 151.9
Net Debt 1,046 1,777
Note:
(a) Net Debt excludes debt capitalisation fees
(a)

17
Rob Templeman
Chief Executive Officer

18
Agenda
First Half Sales Review
Strategy Update- Space
-
Multi Channel
-
Driving the Store Portfolio
Outlook

19
•
Relative good performance from non-clothing divisions
•
Menswear
•
Womenswear
•
Stock cover tight in last quarter due to Roches acquisition
•
Marketing –
competitors spend increasing
•
Un-modernised store performance
First Half Sales Review –
Key Points

20
SPACEGROWTH
OTHER ROUTES
TO MARKET
Strategy Update –
Multiple Growth Drivers
DepartmentStores
DesireStores
Roches
Internet
International
DRIVING THE
CORE
STORE
PORTFOLIO
Marketing
Stor
e S
ervi
ce
Refurbishment
Product

Improving Customer Service
Competitor advertising spend increasing
Autumnand
SpringRanges
Competitiveenvironment
Strategy to improve core
store performance
ProductImprovement
Marketing &
Promotion
AcceleratedStore
Refurbishment
StoreService &Enablers
Department Store Performance

22
Store Refurbishment Programme
•
Refurbishment drives higher sales
•
Higher returns on capital employed
•
Improves linear conversion and visual merchandising
•
Focus on outfit building/ ATV
•
Designer merchandise displayed in a premium manner
•
Improving the customer experience
•
Clear brand delineation
Refurbishment Programme
Refurbished stores continue to out-perform core estate
Refurbishment Trial Store Analysis
6.5%
5.0% 5.0%
-
1.0%
2.0%
3.0%
4.0%
5.0%
6.0%
7.0%
2004Average
2005Average
2006Average
Post
- Pr
e U
plift
ver
sus
Cor
e St
ores
Marketing
Stor
e S
ervi
ce
Refurbishment
Product

23
Accelerating the Refurbishment Programme with Elements of the Desire Shop Fit
•
Introducing the Desire fixtures and branding
•
Creating a more premium feel particularly around Designer ranges
•
Focused on own-bought brands
•
Significant investment in window upgrade and mannequins
•
New graphics and point of sale
•
62 stores identified for refurbishment
•
Programme accelerating
Store Refurbishment Programme
Marketing
Stor
e S
ervi
ce
Refurbishment
Product

24Department
StoresDesireStores
Roches
New type shop fit

25Department
StoresDesireStores
Roches
New type shop fit

26Department
StoresDesireStores
Roches
New type shop fit

27
New type shop fit
Marketing
Stor
e S
ervi
ce
Refurbishment
Product

28
New type shop fit
Marketing
Stor
e S
ervi
ce
Refurbishment
Product

29
Products
•
Menswear
•
Entry price points sharpened. C. 8% of range first half, c. 13%
of range 2nd
half
•
Resourced and renegotiated commodity lines
•
New Head of Buying appointed and team strengthened
•
Range improving but still work to complete
•
New brand launched –
Mantaray
•
Womenswear
•
Division strengthened and more focused by splitting into Casual and Formal
•
Outerwear mix changing into more smarter casual/formal
•
Faster lead times from Turkey
•
Gorgeous brand launched
•
Margins/markdown improving
First Half Sales Review –
Actions Taken
Marketing
Stor
e S
ervi
ce
Refurbishment
Product

30
Driving the Store Portfolio –
New Product Developments
48 stores
Launch of two new own-brands – Mantaray & Gorgeous
GorgeousMantaray
•
Roll-out phase to more stores
•
Improving own-bought mix
All stores
Marketing
Stor
e S
ervi
ce
Refurbishment
Product

31
Designers at Debenhams – aspirational products at affordable prices
•
Medium term target c. £450 million
•
On target
•
Betty Jackson –
introduced into Home
•
Julian Macdonald –
Menswear and Home
•
Jeff Banks –
Home
•
New Designer Brands Launching
Melissa Odabash
–
Swimwear/Accessories
Belle & Bunty
–
Childrenswear
•
Limited Edition –
raising the awareness and testing new price boundaries.
Driving the Store Portfolio –
Product Innovation & Development
Marketing
Stor
e S
ervi
ce
Refurbishment
Product

32
Sourcing Hub Development
Driving the Store Portfolio –
Supply Chain
Far East
58%
Europe
22%
Turkey 8%India 6%
Other 6%
Far East
54%
Europe
15%
Turkey
14%
India 10%
Other 7%
Far East
51%
Europe 9%
Turkey
22%
India 13%
Other 5%
NOW YR 1 Medium Term
Marketing
Stor
e S
ervi
ce
Refurbishment
Product

33
£5.7m investment in RF technology – live in all stores October 2007
•
Radio frequency backed price change management
•
Millions of items of stock with price changes
•
Reduction in man hours dedicated to price changes
•
Trials completed @ 6 stores
•
Reduction in man hours dedicated to price changes
•
Pricing Accuracy
•
Clearer Pricing
•
Consumer Friendly
•
Faster sell through at first markdown
•
Faster stock turn
•
Roll out to all stores completed by the end of October
Driving the Store Portfolio –
Improving the Service Model
Marketing
Stor
e S
ervi
ce
Refurbishment
Product
34
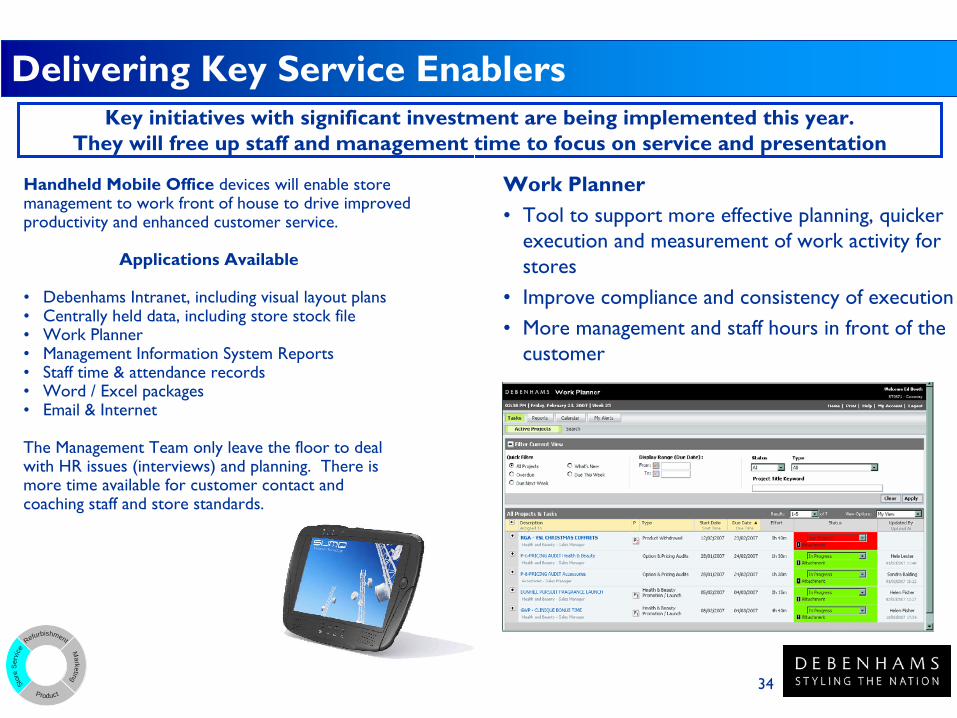
Key initiatives with significant investment are being implemented this year.
They will free up staff and management time to focus on service and presentation
Handheld Mobile Office
devices will enable store management to work front of house to drive improved productivity and enhanced customer service.
Applications Available
•
Debenhams Intranet, including visual layout plans•
Centrally held data, including store stock file•
Work Planner•
Management Information System Reports•
Staff time & attendance records•
Word / Excel packages•
Email & Internet
The Management Team only leave the floor to dealwith HR issues (interviews) and planning. There ismore time available for customer contact and coaching staff and store standards.
Work Planner
•
Tool to support more effective planning, quicker execution and measurement of work activity for stores
•
Improve compliance and consistency of execution
•
More management and staff hours in front of the customer
Delivering Key Service Enablers
Marketing
Stor
e S
ervi
ce
Refurbishment
Product

35
•
Substantial investment into new mannequins and window upgrade to showcase our products
•
Increase premium advertising and broadening our consumer reach•
Fashion Magazines
•
Home Magazines
•
Broadsheets and supplements
•
Home Catalogue
•
More emphasis on Style and Design
•
Store card relaunch
and upgrade on benefits•
Gold Card Upgrades
•
Higher Spend
•
Extra Benefits
•
Credit Card
•
Nectar Redemption•
Electronic Redemption
Driving the Store Portfolio -
Marketing
Marketing
Stor
e S
ervi
ce
Refurbishment
Product

36
New Space Growth –
New Department Stores
•
Potential for up to 240 stores
•
Flex size across deciles
•
Potential for new stores in big cities/towns such as:
•
Liverpool
•
Bath
•
Peterborough
•
Solihull
•
Poole
•
Stevenage
•
Strong contracted pipeline of new stores
•
New Development opportunities
•
High ROIC achieved on new stores
Debenhams is not represented in many key towns across the UK
DepartmentStores
DesireStores
Roches

37
Physically immature business with a strong pipeline of new stores
Presence in Top 500 UK Catchment Areas 29 Contracted New Store Pipeline
Source: Company Information Note(1) Re-sites(2) Excludes Roches acquisition(3) EBITDA on net capital invested
2006
/07
Bury St Edmunds Harlow
2008
/09
Newport
2009
/10
Crewe
Derby*
2007
/08
Carmarthen Ashford BlackpoolGlasgowPollokExeter* WrexhamBangor
(Wales)* Liverpool Dunfermline
Newbridge** DoncasterAyr**
2005
/06
WorkingtonHemel**
Wolverhampton
2010
/11
Newport
2009
/10
CreweNewport
2009
/10
Crewe
Derby*
2007
/08
Carmarthen Ashford BlackpoolGlasgowPollokExeter* WrexhamBangor
(Wales)* Liverpool DunfermlineDerby(1)
2007
/08
Carmarthen Ashford BlackpoolGlasgowPollokExeter(1) LlanelliBangor
(Wales)(1) Liverpool
Newbridge DoncasterAyr
2005
/06
WorkingtonHemel
12
10
6
8
132 Department Stores
3
Dunfermline
Bradford
Livingstone Bury
Wakefield Litchfield
BarnsleyLancaster
Llandudno Wigan(1)Warrington
40
32
19
9 84
16
7
8
7
10
5
1
1
5
5
19
17
14
13
6
1 0
4
12 00
10
20
30
40
50
1 2 3 4 5 6 7 8 9 10 NI / EIREDeciles of top 500 catchment areas
Stor
es
Potential SitesContracted or under NegotiationExisting Debenhams Stores
9 Roches Stores (Dublin, Cork, Waterford, Tallaght, Blanchardstown,
Galway, Limerick, Tralee, Blackrock )
NewcastleUpon Tyne Wood Green
Wrexham
New Space Growth –
New Department Stores
WhiteCity
Bath
Pre tax ROCE (2)
(3)
•
2004/05
36%•
2005/06
49%
DepartmentStores
DesireStores
Roches

38
Llandudno Photos
DepartmentStores
DesireStores
Roches

39
Llandudno Photos
DepartmentStores
DesireStores
Roche

40
Llandudno Photos
DepartmentStores
DesireStores
Roches

41
A unique concept with capacity for c.100 stores in high street and retail park locations
Clear Positioning flexed by market Desire Roll Out
Desire vs Department Stores
•
Target 15-20k sq ft
•
Town centre locations will be priority
•
Childrenswear will be part of core mix
•
Douwe
Egberts
Café
only if tertiary space is available
•
Range of accessories will be expanded
•
Refining the product offer
2004/05 Truro
2005/06 South Shields Orpington Falkirk
2006/07 The Fort, BirminghamMerthyr TydfilKirkcaldy AltrinchamWalton on Thames
•
Higher sales densities
•
Higher gross margin
•
Own-bought mix c. 93%
•
EBITDA margin in line with department stores.
New Space Growth –
New Desire Stores
2007/08 BallymenaFarehamWitneyWelwyn Garden CityNewton AbbeyGreat Yarmouth
DepartmentStores
DesireStores
Roches
0
2
4
6
8
10
12
04/05 05/06 06/07 07/08 08/09 09/10
Trading Year
Num
ber o
f Des
ire S
tore
sOpen Signed In Negotiation Planned

42
Desire
DepartmentStores
DesireStores
Roches

43
Desire
DepartmentStores
DesireStores
Roches

44
Desire
DepartmentStores
DesireStores
Roches

45
Desire
DepartmentStores
DesireStores
Roches

46
Desire
DepartmentStores
DesireStores
Roches

47
The R.O.I. is a growth opportunity –
Roches acquisition gives us scale
•
Acquired 9 stores as an asset purchase, 595 sq. ft. of new retail space.
•
Paid €29 million for assets
•
Integration process on schedule
•
All Stores now trading as Debenhams•
7 out of 9 stores completed first phase of refit to Debenhams•
All stores completed by year end•
Systems operational
•
Further work to complete on concessions
•
Earnings enhancing next year
Space Growth –
Roches Acquisition
DepartmentStores
DesireStores
Roches

48
Roches
DepartmentStores
DesireStores
Roches
Before After
Cork
Waterford

49
•
35 stores in 16 countries with a further 17 contracted locations
•
New stores opened in Russia, Germany and Romania
•
Strong opening programme and cash generation from International franchise stores at low risk
•
Significant opportunity to roll out Desire Stores internationally
•
Review order taking process and supply chain as scale grows
•
New countries –
Abu Dhabi, India, Jordan, Singapore, Malta
Strategy
4 7 9 14 1829
4047
57
0
10
20
30
40
50
60
70
80
00/01 2001/02 2002/03 2003/04 2004/05 2005/06 2006/7 2007/8 2008/9
Number of Contracted stores
70
International stores represent a considerable opportunity and there is a large opening programme for the forthcoming years
International Store Growth:
New Channel Growth –
International Franchises
Internet
International

50
5.9%
19.3%
13.4%
6.2%
26.8%29.4%
14.3%
(8.1%)
(2.6%)
-10.0%
0.0%
10.0%
20.0%
30.0%
Pre Period Post Period Uplift
% v
ersu
s La
st Y
ear
Orders Average Order Value Demand
Web Upgrade
•
Reliable site with the stability to manage our higher demand levels
•
Improved site navigation and cross selling
•
Improved availability of ranges to a wider audience
•
Developed Cosmetics micro sites
•
Uplift in order numbers and ATV. EBITDA up 12.9%
Demand Growth Uplift
Our new website has significant growth potential
Internet
International

51
Total sales six weeks to 15/4/07 + 2.9%
Like for like sales six weeks to 15/4/07
-
6.9%
Actions taken to improve sales performance•
Store refurbishment programme accelerating
•
New initiatives around customer service
•
New own-bought brands launching aimed at younger market
•
Product teams strengthened
New Space Growth
Internet
Outlook