interim report of the working group on the biology and ... reports/expert group report... ·...
TRANSCRIPT

ICES WGCRAB REPORT 2015 SCICOM STEERING GROUP ON ECOSYSTEM PROCESSES AND DYNAMICS
ICES CM 2015/SSGEPD:11
REF. SCICOM
Interim Report of the Working Group on the Biology and
Life History of Crabs (WGCRAB)
3-5 November 2015
Brest, France

International Council for the Exploration of the Sea Conseil International pour l’Exploration de la Mer
H. C. Andersens Boulevard 44–46 DK-1553 Copenhagen V Denmark Telephone (+45) 33 38 67 00 Telefax (+45) 33 93 42 15 www.ices.dk [email protected]
Recommended format for purposes of citation:
ICES. 2015. Interim Report of the Working Group on the Biology and Life History of Crabs (WGCRAB), 3–5 November 2015, Brest, France. ICES CM 2015/SSGEPD:11. 43 pp.
For permission to reproduce material from this publication, please apply to the Gen-eral Secretary.
The document is a report of an Expert Group under the auspices of the International Council for the Exploration of the Sea and does not necessarily represent the views of the Council.
© 2015 International Council for the Exploration of the Sea

ICES WGCRAB REPORT 2015 | i
Contents
Executive summary ................................................................................................................ 3
1 Administrative details .................................................................................................. 5
2 Terms of reference ......................................................................................................... 5
3 Summary of workplan .................................................................................................. 8
4 List of Outcomes and Achievements of the WG in this delivery period ............ 8
5 Progress in relation to the Terms of Reference ...................................................... 10
5.1 Fishery, survey data and assessment ............................................................... 10 5.2 An overview of H. gammarus, Maja squinado and Cancer Pagurus
research in Jersey, Channel Islands .................................................................. 11 5.2.1 Stock status of lobster in Scotland ....................................................... 11 5.2.2 An update of lobster assessment in France ........................................ 12 5.2.3 Update on the status of Atlantic Canadian snow crab ..................... 12 5.2.4 Update on the status of snow crab in West Greenland
waters ...................................................................................................... 13 5.2.5 Update on the status of snow crab in Barents Sea
(Norwegian EEZ) ................................................................................... 13 5.2.6 Brief overview of the snow crab study in NEAFC
regulatory Convention area in the in Barents Sea (Russian EEZ) ......................................................................................................... 14
5.2.7 Update on the status of King crab in Barents Sea (Russian EEZ) ......................................................................................................... 14
5.2.8 Stock status of brown crab in Scotland ............................................... 14 5.2.9 An update of crab assessment in Norway .......................................... 15 5.2.10 An update of crab assessment in France ............................................. 15 5.2.11 Data on Cancer pagurus from Ireland................................................... 16
5.3 Assessment consideration ................................................................................. 17 5.3.1 Thinking outside the box – a possible approach to reference
points for Newfoundland snow crab .................................................. 17 5.3.2 King crab – assessment methods and available data ........................ 17
5.4 Impact of climate divers and increased ocean acidification on important crab and lobster species ................................................................... 18
5.5 Research and new knowledge on vital crab and lobster population ........... 18 5.5.1 Biology and eco-physiology of Cancer pagurus in
Norwegian waters – contents and some preliminary results .......... 18 5.5.2 Maturity of brown crab in Scottish waters ......................................... 19 5.5.3 Summary of research into improving recruitment estimates
for Edible crab and European lobster in UK ...................................... 19 5.5.4 Preliminary results of discard mortality experiments on
Newfoundland snow crab .................................................................... 21 5.5.5 Snow crab migration activity in the Barents Sea ............................... 21

ii | ICES WGCRAB REPORT 2015
6 Revisions to the work plan and justifications ........................................................ 21
7 Next meeting ................................................................................................................. 21
Annex 1: List of participants............................................................................................... 22
Annex 2: Recommendations ............................................................................................... 23
Annex 3: Updated tables – fishery and survey data ....................................................... 24

ICES WGCRAB REPORT 2015 | 3
Executive summary
The Working Group on the Biology and Life History of Crabs met in Brest, France, 3–5 November 2015 with AnnDorte Burmeister as Chair. The meeting was attended by 12 participants from 7 countries; Russia, Canada, Greenland, France, Norway, UK, includ-ing Scotland and Jersey, and Ireland.
The objectives of the meeting were to update and provide data and knowledge on land-ings, fisheries and biology of the important crab and lobster stocks in the ICES area. In addition, essential objectives were furthermore to discuss important crab and lobster stocks to identify gaps in assessment programs and review application of biological and management reference points for crab fishery. The WG also reviewed alternative indica-tors in assessment of crab stocks without fishery independent data.
Data and results related to the different ToRs were presented orally, and several oral presentations on other relevant issues were given at the meeting. The first 2 days were spent with ToRs a, b, and c. Updates on landings and stock assessments on Brown crab and lobster in UK, Scotland, France and Brown crab in Norway; Snow crab in Canada, Greenland and Russia (Barents Sea); Spider crab in France and Red King crab in Russia and Norway were presented. Furthermore, the group discuss the presentation of a stand-ard methodology/protocol and collaboration on size at maturity study on Cancer pagurus. ToR e was discussed day 3 including a presentation of preliminary result of a PhD on the Cancer crab in Norway.
The WG discussed and agreed to continue review prospects for future assessment, advice including data availability, assessment methods and research on the biology of crab and lobster. The group agreed to make progress in evaluating assessment methods, sharing new knowledge of the species and working toward collaborating projects.
Furthermore, the group still wish to include more researchers working with lobster. The brown crab (Cancer pagurus) and the European lobster (Homarus gammarus) are both high-ly valuable shellfish species in the Northeastern Atlantic, but at present, whilst ICES WGCRAB provides a useful forum for brown crab scientists, there is only few lobster equivalent. Both species are typically caught using baited traps and although targeting does occur, they are often regarded as being exploited as a mixed fishery. Availability of fishing activity data and the similarity of their respective biological attributes has led to fisheries scientists using the same or similar stock assessment methodologies for both species. Furthermore, the same fisheries scientists within each fisheries institute are often responsible for both crab and lobster stock status assessments. The working group will also include lobster on the agenda for the future ICES WGCRAB meeting with additional time allocated to the meeting if required.
The WG agreed also to highlight effects of climate drivers on important crab and lobster species within the ICES, Atlantic Canada and West Greenland, including increased ocean acidification.
The background history for the establishment of the WGCRAB is comprehensively de-scribed in the Report from the Group in 2010, and will not be dealt with here.

4 | ICES WGCRAB REPORT 2015
It is a general agreement among the Group members that the annual meeting is of great value for each member, both to sum up the development in the different regional crab fisheries, and as a forum to discuss challenges in the management of the fisheries. WGCRAB is also a suitable arena for discussing particular issues on crab and lobster biology which is important since specialists working with the assessment on those spe-cies are mostly single scientists in this field at the different national institutions. Despite a limited number of attendants at the recent meetings, all members of the Group are en-thusiastic to continue the work within the Group through annual meetings.

ICES WGCRAB REPORT 2015 | 5
1 Administrative details
Working Group name
The Working Group on the Biology and Life History of Crabs (WGCRAB)
Year of Appointment
2013
Reporting year within current cycle (1, 2 or 3)
2
Chair(s)
AnnDorte Burmeister, Greenland Institute of Natural Resources, Greenland
Meeting venue
Brest, France
Meeting dates
3–5 November 2015
2 Terms of reference
ToR Description
Background
Science Plan topics addressed Duration
Expected Deliverables
a Compile data on landings, discards, effort and catch rates (CPUE) and provide standardised CPUE, size frequency and research survey data for the important crab and lobster (Homarus) fisheries in the ICES area, and Atlantic Canada and Greenland.
The fisheries for crabs and lobster are socio-economically important and trans-national in Europe and Canada with the demise of fin fisheries in some regions.
212.321 3 years Landing, discard, effort and catch data on listed species, from each country. WG report chapter.
b Evaluate assessment of the status of crab and lobster (Homarus) stocks including use of indicators, empirical assessment, analytical assessment in relation to data sources and data quality, development and suitability of reference points for management.
Management of stocks in Europe is primarily by technical measures only and in most countries there are generally no management instruments to control fishing effort. Knowledge of the population dynamics of these species is still weak. These stocks may be at risk from over-fishing due to the lack of control of fishing effort, and hence an evaluation of the
311, 334 3 years Report on evaluation of alternative assessment methods.
6 | ICES WGCRAB REPORT 2015
sustainability of these fisheries is necessary.
c WGCRAB wish to produce assessment and advice of the main crab and lobster species in the ICES area in future. (Year 1 -2014) Review prospects for future assessment, advice including data availability, management units, and possible reference points and assessment methods. Initiate preliminary assessment exercises. (Year 2 - 2015) Review management measures applied in crab fisheries and future options. Continue exploratory assessments (Year 3 – 2016) Preliminary assessments of stock status for relevant crab and lobster species according to MSFD D3 WGCRAB will discuss with ACOM, SCICOM, SSGEF the feasibility of including e assessment and advice within its future ToRs.;
WGCRAB aims to produce assessments and advice on a management unit basis. Evaluate current assessment methods and identify reference points. Develop assessment methods to identify position with respect to MSY proxies and harvest rules. It would be of great interest to make progress on assessment of stock status and further develop ideas on reference points. WGCRAB will discuss advantages and disadvantages of emphasis advice on a management basis. Secondly WGCRAB will include a workshop at the 2015 or 2016 meeting to look at prospects for future assessment and management and will aim to draft management plans for certain stocks. Third step is to consult with ACOM regarding assessment and advice from the WGCRAB.
3 years
(Year 1) Report on data availability, management units, reference points and assessment methods (Year 2) Report on management options for crab fisheries (Year 3) Preliminary report on stock status of selected species
d Review the impact of climate drivers on important crab and lobster species within the ICES, Atlantic Canada and West Greenland, including increased ocean acidification;
WGCRAB will investigate the relative importance of fishing and environment on crab and lobster recruitment. Furthermore there is a growing concern in the WG about the consequences of future climate change for important crab species in our region. Observed increases in sea water temperatures have already entailed expanded distribution areas of some species in the northeast Atlantic. However, a rise in the seawater pH would probably be the most serious consequences of the climate change on crustaceans such as
112, 113 3 years Highlight important issues to be basis for research on effect of climate changes on important crab stocks. WG report chapter (2016)

ICES WGCRAB REPORT 2015 | 7
crabs. These issues will be dealt with by the WGCRAB in future.
e Review research and new knowledge on vital crab and lobster population biology parameters;
Several stock parameters are important for analytical assessments. Biological information is therefore required to provide standardised indices and for use in analytical assessments. Crab stock parameters may change due to size selective and single sex fisheries, through by-catch in other fisheries or through the impact of other seabed uses, such as gravel extraction. Since important crab stocks in Europe are managed without fishery independent data it may be an option to investigate any useful stock parameter indicators for assessment purposes
141 Updated knowledge on crucial stock parameters for important crab stocks.
Summary of the Work Plan
Year 1 Annual standard outputs for a, b. Continue analysis for ToR d, e. Tentative plan for ToR c.
Year 2 Annual standard outputs for a, b. Continue analysis for ToR d, e.. Complete evaluation of useful assessment methods to assess crab and lobster species in ICES areas
Year 3 Annual standard outputs for a, b. Combine analysis, research and report ToR d and e.
Supporting information
Priority High. The fisheries for crabs and lobster are socio-economically important and trans-national in Europe and Canada with the demise of fin fisheries in some regions. Management of stocks in Europe is primarily by technical measures only and in most countries there are generally no management instruments to control fishing effort. Knowledge of the population dynamics of these species is still weak. These stocks may be at risk from over-fishing due to the lack of control on fishing effort, and hence an evaluation of the sustainability of these fisheries is necessary. The activity of the Group is therefore considered to be of high priority in particular if its activity can move towards resource assessment without losing biological inputs.
Resource requirements The research programmes which provide the main input to this group are already underway, and resources are already committed. The additional resource required to undertake additional activities in the framework of this group is negligible.
Participants The Group is normally attended by some 10–15 members and guests.
Secretariat facilities None.

8 | ICES WGCRAB REPORT 2015
Financial No financial implications.
Linkages to ACOM and groups under ACOM
There are no obvious direct linkages today, but if the EG is going to produce stock assessments in the future WGCRAB will have linkages to several EGs under ACOM.
Linkages to other committees or groups
The EG aims to be able to give advise on how to exploit important crab stocks in the ICES area and is therefore related to EGs such as WGCRAN and the ICES/NAFO NIPAG.
Linkages to other organizations
3 Summary of workplan
The new draft resolutions running from 2014 to 2016 were introduced and the agenda structure of the meeting followed these main themes.
ICES SharePoint was made available before and during the meeting, and was proved to speed up the work and make exchange information more efficient.
Practicalities for the meeting and reporting were introduced. Sarah Clarke and Rosslyn McIntyre were appointed to rapporteur during the meeting.
a ) The group adopted the agenda following the ToRs: Compile data on landings, discards, effort and catch rates (CPUE) and provide standardised CPUE, size frequency and research survey data for the important crab fisheries in the ICES area; (Updated tables are available in Annex 3)
b ) Evaluate assessments of the status of crab stocks, identify gaps in assessment programmes, and review the application of biological and management refer-ence points for crab fisheries;
c ) Evaluate current assessment methods and identify reference points. Further-more the group wants to develop assessment methods to identify position with respects to MSY proxies and harvest rules.
d ) Review the impact of climate changes on important crab populations in the ICES area, including increased ocean acidification.
e ) Review research and new knowledge of vital crab population biology parame-ters.
4 List of Outcomes and Achievements of the WG in this delivery period
Publications
UK - England
Scotland
Ireland: Shellfish Stocks and Fisheries Review is published annually and available on the Marine Institute website (http://www.marine.ie)
France

ICES WGCRAB REPORT 2015 | 9
Russia
Norway
Advisory products
UK - England
Scotland
Ireland: The Marine Institute give advice on the stocks of Cancer pagurus and Homarus gammarus in Irish waters through the Shellfish Stocks and Fisheries Review published annually and available on the Marine Institute website (http://www.marine.ie)
France
Russia
Norway: Søvik, G. 2015. Taskekrabbe. P. 198 i: Bakketeig I.E., Gjøsæter H., Hauge M., Sunnset B.H. og Toft K.Ø. (red.) 2015. Havforskningsrapporten 2015. Fisken og havet, særnr. 1–2015. (In Norwegian only)
Greenland:
Burmeister AD (2015) Opdatering af bestandsstatus for krabber ved Vestgrønland og rådgivning for 2015. Pinngortitaleriffik, Grønlands Naturinstitut, 45 pp (In Danish and Greenlandic only)
Burmeister AD (2014) Asessment of snow crab in West Greenland 2015 and 2016. Tech-nical Report no.r. 93, Pinngortitaleriffik, Grønlands Naturinstitut, Greenland Institute of Natural Resources. 48 pp
Datasets
UK - England: The assessments use official fishery landings
Scotland:
Ireland: The Irish landings data for over 10 meter vessels come from logbooks. The land-ings for under 10 meter vessels is collected from first sales notes. The size data is collect-ed via a Sentinel Vessel Programme (coordinated by Bórd Iascaigh Mhara) and an Observer sampling programme (coordinated by the Marine Institute). All size data is maintained by the Marine Institute.
France: All the assessments use the data from the national database. The data come from the logbooks or from the national fishing sheet for vessels under 12 m. In addition, size samples come from the national plan and some self-sampling data complete the dataset. Currently, there is not specific survey for the large crustaceans.
Norway: The assessment use official fishery landings as well as logbook data from a ref-erence fleet of commercial fishing vessels. The data are collated by IMR and held in IMR databases (stored as excel-files).
Russia:
Canada: Newfounland & Labrodor: The assessments use dockside monitored landings data, at-sea observer measurement data, harvester logbooks, post-season trap and trawl

10 | ICES WGCRAB REPORT 2015
surveys, vessel monitoring system data, and physical oceanographic (temperature) data. All data are collected and maintained by the Department of Fisheries and Oceans Cana-da, Newfoundland and Labrador region.
Greenland: The assessments use official fishery landings and logbooks data (from Green-land Fishery License Control) as well as data from annual trap surveys in two manage-ment units conducted by Greenland Institute of Natural Resources (GNIR). Those data is collated by GNIR and held in GNIR Access database.
Modelling outputs
UK - England: Length Cohort Analysis assessments lead to estimates of F trends and population numbers
Scotland:
Ireland: No assessments are currently undertaken on Irish stocks.
France: The GLM approach is mainly used to estimate abundance indices. This situation is due to the good quality data of some time series. Assessment models are not much used for the moment. Nevertheless some works are in development because some size samples start being compiled.
Norway: no modelling outputs is available
Russia:
Canada: Labrador and Newfoundland: none
Greenland: no modelling outputs is available
5 Progress in relation to the Terms of Reference
During the meeting a series of summary tables in which data and information discussed and presented under ToRs a and b are presented as a standard (see Annex 3) is and will be presented as routine information in the annual reports. Only the main commercially exploited crab species such as brown crab (Cancer pagurus), snow crab (Chionoecetes opil-io), red king crab (Paralithodes camtschaticus) spider crab (Maja brachydactyla) and lobster are reported. The WG recognise that some important fisheries are not covered by this report because some countries were not represented at the WG meeting and no data have been provided. Nevertheless, the aim of the WG is that all commercially exploited crab stocks from all countries should be handled and reported by the WG.
5.1 Fishery, survey data and assessment
Data on landings, discards, effort and catch rates (CPUE) was provided for important crab and lobster fisheries in the ICES area, and tables were updated. (See Annex 3 for updated tables).
An increased understanding of stock structure is necessary for a proper management particularly for the brown and spider crab stocks, both nationally and internationally. Information on general biology as well as genetic studies and the physical environment, are critical in identifying the stock structure of crabs to ensure effective stock manage-

ICES WGCRAB REPORT 2015 | 11
ment. The WG also highlights the application of biological reference points in the as-sessment and management of crab stocks.
The question of whether to change from a study group to an assessment group was dis-cussed. The consensus was that an assessment group wouldn’t be appropriate. The change to an assessment group would mean the research component would have to be dropped, which no-body wants to happen. Other concerns included the amount of time that would be required to prepare for an assessment group, restrictions on sharing data in some cases, and the lack of assessments produced by some countries.
For the future it was suggested that fisheries that overlap share data and assessment methods, possibly having an extra day at the beginning or end of the meeting to break up into species groups and share knowledge on assessments.
5.2 An overview of H. gammarus, Maja squinado and Cancer Pagurus research in Jersey, Channel Islands
This presentation gave a brief overview of the Bailiwick of Jersey’s geographical position, unique constitutional arrangement with the UK and corresponding relation-ship with the European Union and other member states. Once detailing the legal and regulatory framework of the island, both locally and internationally, this presentation also discussed international and trans-boundary management of fisheries through the Granville Bay Treaty between the UK and France and the joint Marine Stewardship Council certifica-tion of the Lobster fishery between Jersey and Normandy. An overview of data from the fishery was presented including landings for the main commercial shellfish species, Eu-ropean Lobster (Homarus gammarus). Pot lifts and landings per unit effort were also pre-sented, along with corresponding figures for the commercially important by-catch species of Spider Crab (Maja squinado) and Brown Crab (Cancer pagurus). Data from fish-ery-independent surveys by the Environment Department of the States of Jersey, were also presented. Data presented included carapace length histograms, maturity data and information on the management of the fishery and the structure of the commercial fleet licensed by Jersey.
5.2.1 Stock status of lobster in Scotland
Total Scottish landings of lobster fluctuated between 400 and 1200 tonnes from 2005 to 2014 (Table 4). The main fishing areas for lobster are the South East, East Coast, Orkney, Hebrides, and South Minch; landings from these areas account for around 87% of the total. The majority of lobsters fished in Scottish waters are landed in the third and fourth quarters of the year. Stock assessments based on LCAs for the period 2009–2012 were carried out for eight of the twelve assessment units, providing estimates of fishing mor-tality in relation to the FMSY proxies (Table 5). There were insufficient sampling data from the Mallaig, North Coast, Sule and Ullapool areas to conduct LCAs. Lobsters in all the assessed areas were fished above the FMSY proxy to some extent, particularly males. Fish-ing mortality was estimated to be above FMSY for both males and females in Clyde, South Minch, East Coast and South East. In the Hebrides, Orkney and Papa, fishing mortality for females was at FMSY or below while males were fished above FMSY. In Shetland, males were fished below FMSY and females above FMSY. Overall, assessments for the period 2009–2012 show that most lobster assessment units in Scotland were fished close to or above

12 | ICES WGCRAB REPORT 2015
the FMSY proxy. A higher yield and biomass per recruit in the long term could potentially be obtained in all assessment units by reducing the level of fishing mortality (effort).
5.2.2 An update of lobster assessment in France
The landings of lobster in France are around 450–500 tons. Some regions target and land more lobster than others as Normandy and Brittany. The pot is the main fishing gear to target lobster. Nevertheless, many different sizes of pot are used along fishing areas link to sea condition (current, swell and fishing depth). In all the regions, to target lobster, a vessel need a licence. This first management rule led to limit the number of vessel in fish-eries. After, the number of pot are limited by fisherman between 200 and 250 according to the fishing region. These two rules really permit to control the fishing effort.
Currently, the sampling programs have been changed in order to get size structure to develop size structured models. Today, we don't have enough data to perform a good analyse even if some test have been realised. The quality of the data from the logbook or fishing sheet are used to develop abundance index from CPUE. A GLM model allows to integrate the seasonal effect and fishing power of the vessels to estimate a good index where the trend of the abundance is well observed.
Using this approach, the estimated indices for the two main fishing areas show a steadily increase of the abundance (Figure 1 and 2). The same trend are observed and the increase starts at the same period around 2006. First at all, the respect of the rules have led to this evolution. Among this, the respect of the MLS is really a great change in the practice of the fishermen.
In parallel, the dynamic of the recruitment seems to have changed a lot. A scientific sur-vey in the North of Normandy performed since 1985 give a good information on the dy-namic the population (Figure 3). The general trend really shows an increase which is more important in the last 8 years. At the moment, it is really difficult to analyse the ele-ments which can explain this trend. Our future works will be concentred on this point.
The global situation of the lobster stock for the coast of Brittany and Normandy can be considered as good. Some discussions always exist to improve the management and more precisely for the recreational fishing activity with a maximum of one lobster per day.
5.2.3 Update on the status of Atlantic Canadian snow crab
This presentation details trends in landings, biomass, and recruitment for Atlantic Cana-dian snow crab (Chionoecetes opilio). The snow crab resource in Atlantic Canada is spatial-ly broad-based, covering thirteen of the Northwest Atlantic Fisheries Organization (NAFO) Divisions (2HJ3KLNOP4RSTVWX) and four separate regions of the Department of Fisheries and Oceans (DFO), which utilize different techniques for assessment and management. Thus, data quality is variable and a broad-scale view of stock status is diffi-cult. However, the latest stock status reports from the four DFO regions show that overall landings have been stable at around 95 000 t for over a decade and no major changes to the exploitable biomass are expected in the short-term in most areas. However, the larg-est area of supply on the Grand Bank off eastern Newfoundland (NAFO 3LNO) is ex-pected to experience declining recruitment into the exploitable biomass over the next few years. Overall stock productivity has been relatively low from about 2003/04 to recent

ICES WGCRAB REPORT 2015 | 13
years, but there is an emerging broad-scale indication of improving abundance of small crabs in most areas in the past two years. A general broad-scale cooling of the climate system since the very warm conditions experienced in the early 2010s should be positive from improved long-term prospects, particularly if they continue.
5.2.4 Update on the status of snow crab in West Greenland waters
Total Greenlandic landings increased from approx. 1000 tons in 1995 to a peak of approx. 15 000 tons (Quota 26 800 tons) in 2001. Since landings as well as quota has been marked-ly reduced. From 2001 to 2007 total catch declined by approx. 89% to 2189. In the subse-quent years landings has been stable at approximately 2200 tons and total landings was 2157 tons in 2014. Landings with in each of the management areas have fluctuated over time and in 2014 approx. 52% of total landings were taken in Management area Nuuk-Paamiut, whereas the contribution from Disko Bay and Sisimiut amounted 21% and 23% respectively. Contributions from the management areas Maniitsoq_Kangaamiut and Narsaq Kap Farvel amounted less than 4% of the total landings.
In the management area Disko Bay all available indices from the commercial fishery and survey data indicate that there has been no recent increase in commercial crab biomass despite a considerable reduction of the fishery removal and fishing effort from 2001 to 2014. Since snow crab enter the fishery at age 8 to 10, the current relatively low biomass level might be a result of poor recruitment at the time when spawning biomass were at record low level, as observed from 2003 to 2006.
In the management area Sisimiut inshore, survey indices indicating a downward trend in the stock from 2009 to 2011, it remains remain low in 2013 and 2014, but show some mi-nor increase in 2015. Standardized CPUE from the commercial fishery indicate the same trend. Since 2002 new-shelled crabs have accounted for a most of the males caught in the scientific catches, whereas the proportion of intermediate and old crabs has been decreas-ing. Since 2009, abundance of recruits continuous declined to a record low level in 2014. However, a minor increase recruitment was observed in 2015, suggesting moderately recruitment prospect to the stock in near future.
In the offshore site of Sisimiut all available indices shown a significantly drop in biomass in 2009, in the succeeding years biomass remain on a low level and well below the 16-yr mean . The minor sign of increasing biomass as observed in 2015, is namely attributable to significant reduction of commercial catches from 2004 up to 2014, Recruitment indices for the offshore area are disturbingly poor and indicate low or no recruitment prospects in the short term.
Nuuk-Paamiut; Catches and effort have steadily increased from 2008 to 2013 and CPUE have remained relatively high without a sharp decline, suggesting that the snow crab stock offshore is in a stable condition. There is no is fishery independent data available from this area
5.2.5 Update on the status of snow crab in Barents Sea (Norwegian EEZ)
The snow crab (Chionoecetes opilio) stock has increased rapidly both in distribution and abundance in the Barents Sea since the first five specimens were found in 1996 at the Goosebank in south eastern part of the Barents Sea. The population is expanding its dis-tribution primarily westwards and northwards into the Norwegian zone.

14 | ICES WGCRAB REPORT 2015
The snow crab is therefore now found in large parts of the Barents Sea, but still the larg-est part is in Russian exclusive economic zone (EEZ). The snow crab is defined as a sed-entary species, which entail several challenges regarding management of the species. The Barents Sea continental shelf, including the Loophole, belongs to Russia and Norway. The border Norway and Russia agreed upon in 2010 lined up the dividing of the conti-nental shelf between the two Parties. This implies that most of the Loophole continental shelf belongs to Russia. The development in the distribution is followed closely and new maps showing the distribution area is produced every year. A new map showing the distribution for 2015 is not yet finished.
At present, most of the snow crab fishery in the Barents Sea takes place in the Loophole. There has been a fishery for snow crab in the Barents Sea for four years. It started with only small landings of 2.5 tons in 2012, and so far in 2015 there is landed 8000 tons. At the moment, 21 boats from different nationalities are participating in the fishery for snow crab in the Barents Sea.
Norwegian data on the snow crab stock in the Barents Sea originate mainly from by-catches in the regular routine cruises conducted by the Institute of Marine Research using a multispecies trawl. We have therefore some knowledge about the stock structure and basic biological parameters for the Barents Sea snow crab. Our priority task at the mo-ment is elaborating the use of “collections bags” mounted on the trawl-gears, to be used as a future sampling device for snow crab by the Institute of Marine Research.
5.2.6 Brief overview of the snow crab study in NEAFC regulatory Convention area in the in Barents Sea (Russian EEZ)
The report presents the results of snow crab stock study in NEAFC Regulatory & Con-vention Area in Barents Sea during commercial fishing in July 2014. It contains the model of crab’s distribution, the catch per trap and data from the bioanalisys of 2407 snow crab males including size distribution, percentage of injured crabs in catch, meat content. It was noted that the main part of catch was legal size males with carapace width over 10 cm.
5.2.7 Update on the status of King crab in Barents Sea (Russian EEZ)
The presentation shows the results of two surveys of the king crab in Barents Sea. The first was held in July 2015 in a 12-miles zone from the Varanger Fjord in the East to Kanin Cape in the West. The second survey was carried out on a fishing vessel in September and October 2014 in the area of commercial fishing of red king crab in the Russian eco-nomic zone. The map of stock distribution, data of bioanalysis, size distribution and catch per trap were presented. Also the dynamics of the data from similar surveys carried out over the last five years was shown. It noted an increase in stock of red king crab legal size males in the commercial fishery area and adult females in the coastal zone.
5.2.8 Stock status of brown crab in Scotland
Total Scottish landings of brown crab fluctuated between 8300 and 12 300 tonnes from 2005 to 2014 (Table 6). The main fishing areas for brown crab are the Hebrides, East Coast, Sule, Papa, South Minch and Orkney; landings from these areas account for around 80% of the total. The majority of crabs fished in Scottish waters are landed in the

ICES WGCRAB REPORT 2015 | 15
third and fourth quarters of the year. Stock assessments based on LCAs for the period 2009–2012 were carried out for nine of the twelve assessment units, providing estimates of fishing mortality in relation to the FMSY proxies. There were insufficient sampling data from the Mallaig, Ullapool and Clyde areas to conduct LCAs. Of the nine assessed areas, six were fished above the FMSY proxy to some extent Table 7). Fishing mortality was esti-mated to be above FMSY for both males and females in South Minch, Orkney, East Coast and South East. In Sule and Hebrides, fishing mortality for males was at FMSY or below while females were fished above FMSY. In the North Coast, Papa and Shetland, recent fish-ing mortality was approximately at FMSY or lower. Overall, assessments for the period 2009–2012 showed that most brown crab assessment units in Scotland were fished close to or above the FMSY proxy. In many of the assessment units, a higher yield and biomass per recruit in the long term could potentially be obtained by reducing the level of fishing mortality (effort).
5.2.9 An update of crab assessment in Norway
The resource of edible crab in Norwegian waters is considered and managed as one stock. There has been a northward migration of the species in the last years, and at pre-sent the stock is distributed from Skagerrak to Finnmark. As there are biological differ-ences among crabs along the Norwegian coast, monitoring and data compilation are carried out per statistical areas as defined by the Norwegian Directorate of Fisheries. There are no regulations of the stock except for a minimum landings size (Swedish bor-der to Rogaland (area 8): 11 cm CW; north of Rogaland: 13 cm CW), a maximum number of traps (20) for recreational fishers, and compulsory escape gaps for lobsters in crab pots in areas 8 and 28. The fleet consists of small vessels <15 m, fishing with traps.
The stock is data deficient, with no logbook data and no survey. The fishery started at the beginning of the 20th century. Landings peaked in the late 1940s and again in 2007. Annu-al present landings are around 5000 tons, with Trøndelag (area 7) and the Helgeland coast (area 6) as the main fishing areas (around 70% of total landings in 2014). In south Norway, the fishery takes place year round, while the season is contracted moving northwards. Generally, the main season is from August to November.
To collect data from the stock and the fishery, a Crab Reference Fleet was established in 2001. Recruited fishermen are equipped with four standard reference traps with no es-cape gaps and a calliper, and are asked to record all catch (numbers, CW, sex, berried females, discard) in the reference traps on a weekly basis during ten weeks. In 2014, 12 fishermen participated, measuring a total of 4444 crabs. Most fishers are recruited from areas 6 and 7. Catch rates may vary quite a lot among fishers, thus annual mean catch rates depend on the participating fishers, especially when few fishers are participating. Catch rates (landed catch) vary between years in the south (area 8), but are quite stable in areas 6 and 7. Stocks are concluded to be stable. Discard rates are highest in the south (area 8) and in little exploited areas (area 28), while they are lowest in the north (area 5). Mean CW of landed female crabs seems to have decreased in area 6 compared with area 7. Landings are dominated by females except in area 8.
5.2.10 An update of crab assessment in France
The landings of brown crab stay very stable year after year, around 6000 tons. This situa-tion is really link to the composition of the fleet which targets brown crab. In effect, 45%

16 | ICES WGCRAB REPORT 2015
of the 6000 tons of the landings come from 12 offshore potters. These vessels use the same strategy each year and target only brown crab. For more than 10 years, the fishing effort of the fleet stays at the same level. Using all the data available from this fleet, the abun-dance index developed gives us some information for the stock. The general trend show a steady increase of the abundance if we consider the catchability is equivalent year after year (Figure 3).
Nevertheless, some interannual changes can be observed by area. In 2014, the abundance has increased in Western Channel and slightly decreased in the Bay of Biscay. Other pot-ters target brown crab along the coast of Normandy, Brittany and Loire Atlantic but only a few target it all the year. The majority have a seasonal activity where the brown crab is targeted only from September to November. For these coastal fleet, the trend in the abundance is less clear. Some environmental factors and the movement of the brown crab explain the coastal annual variability of the presence of brown crab.
In parallel, the others fleet, trawlers and netters stay really significant in the total land-ings where they represent 20%. The repartition of the landings (Figure 4) permit to ob-serve the weight of each fleet in the landings. The Fileyeurs Caseyeurs fleet target brown crab with pots, only a little part of the brown crab landing is from nets.
5.2.11 Data on Cancer pagurus from Ireland
Irish vessels fish for crab in ICES Areas IV, VI and VII. In 2010 the WG agreed a series of assessment units covering fisheries exploited by vessels from UK, Ireland, France, Nor-way and Sweden. Four of these assessment units, (Malin, SW Ireland, SE Ireland/Celtic Sea, N Irish Sea) surround the Irish coast and Irish inshore vessels fish in all four units. Landings (tonnes) into Ireland from 2004 to 2014 for these four assessment units and adjacent assessment units by Irish vessels are shown in Table 1. These landings are col-lated from the operational landings database. Table 2 shows the landings (tonnes) for the under 10 metre vessels that fish around the Irish coast within 12 nmiles of the shore.
The quality of the landings data from the official national databases are variable and may at times reflect changes in the efficacy of recording rather than the crab fishery itself. Landings data for 2015 is incomplete at this time and therefore has not been included.
Size distribution data was only collected from the Malin and SW Ireland assessment units during 2014. A total of 3845 brown crab were measured overall. Female brown crab were more prevalent in catches and landings from both assessment units. Female crab from the Malin assessment unit ranged from 65-240 mm carapace width with a mode size of 150 mm, while male crab from the same stock ranged from 60–250 mm carapace width with the majority being 170 mm. In the SW Ireland assessment unit female brown crab ranged in size from 65–210 mm carapace width and males ranged from 75–210 mm cara-pace width. Female brown crab from the SW Ireland had a mode size of 170 mm whereas the mode for males from the same stock was smaller at 110 mm carapace width.
No assessment methods are currently being utilised by Ireland on the four stocks/assessment units around the Irish coast.

ICES WGCRAB REPORT 2015 | 17
5.3 Assessment consideration
5.3.1 Thinking outside the box – a possible approach to reference points for Newfoundland snow crab
Precautionary Approach frameworks for fisheries management are intended to promote caution in the absence or uncertainty of scientific advice and aim to avoid serious harm to fish stocks and their ecosystems. For finfish stocks, it is commonplace to employ biomass- or exploitation-based reference points in relation to historic levels of both metrics toward identifying how a given stock is performing in the present. Such approaches have been adopted in the Southern Gulf of St. Lawrence and the Eastern Scotian Shelf for the as-sessment and management of snow crab (Chionoecetes opilio) in those regions. This presentation examines the biology of snow crab and the management regime used in Newfoundland and Labrador toward determining if such approaches are advisable to implement for assessment and management of the resource in Newfoundland and Lab-rador. Finding that the fishery impacts only a very small portion of the population (larg-est males), which are not normally found in close association with breeding females, no stock-recruitment relationship between largest males and small crab abundance, and that productivity is predominately environmentally-driven, the presentation concludes there is little biological basis for implementing such ‘conventional’ reference points. Alterna-tive approaches are being pursued, focusing on fecundity levels of females. With the fishery having virtually no effect on female fecundity, the underlying intent of harvest control rules being explored to accompany the proposed reference points are aimed at efficient prosecution of the fishery, specifically maximizing yield-per-recruit and mini-mizing recruitment overfishing via discard mortality.
5.3.2 King crab – assessment methods and available data
The harvest of the red king crab (Paralithodes camtschaticus) in northern Norway has a fishery history going back to 1994. Until present the management of this fishery has un-dergone several changes. Being a male-only fishery for the first 14 years and since 2008 an additional small quota on female crabs has been implemented. In addition, there is a dual management regime with two goals. Goal number one is to maintain a long term commercial harvest in a limited geographical area with total allowable catch (TAC) and restricted participation (East Finnmark). The other goal is to limit further spread of the crab and minimize crab abundance outside the commercial area (West Finnmark).
The Institute of Marine Research carry out two annual cruises in the quota regulated area to assess the stock and advising on harvest. In addition, we perform a trap survey in coastal areas west of the quota regulated area to monitor the spread of the crab. After five years of surveillance, it seems that the free fishery is able to limit the rate of spread, and keeping the stock at low levels in areas where the crab is established.
During the last six years the landings and the catch value of the red king crab in East Finnmark has been stable. About 550 fishermen participate in the fishery and the value of the landings has varied between 100 and 150 million Norwegian kroner.
We are presently emphasizing improvement of logbook data from the fishery. This will give us knowledge about fishery pattern such as catches, fishing depths and effort.

18 | ICES WGCRAB REPORT 2015
Data collected on the red king crab surveys are analysed using a compound production model. This model provides alternative harvest options with affiliated risk analysis. The quota has been stable and varied between 1000 and 1300 tones the five last years.
5.4 Impact of climate divers and increased ocean acidification on important crab and lobster species
The main conclusion was that increasing temperatures is not favourable for snow crab and increasing ocean acidification might not be favourable for crustaceans in general.
There is a growing concern in the WG about the consequences of future climate change for important crab species in our region. Observed increases in sea water temperatures has already entailed expanded distribution areas of some species in the northeast Atlantic. However, a rise in the seawater pH would probably be the most serious consequences of the climate change on crustaceans such as crabs. These issues will be dealt with by the WGCRAB in future.
One key crab resource in the North Atlantic showing responses to warming conditions is the Newfoundland and Labrador snow crab (Chionoecetes opilio), with warming associat-ed with declining productivity in the stock. The most recent stock assessment of this re-source has shown consistent strong relationships between a lagged thermal habitat index (areal extent of cold bottom water in shallow nursery areas) versus fishery catch per unit of effort (used as an index of biomass) in the four major assessment units of the stock (see figures in Annex 3). The lags in the relationships (7–9 years) infer warm conditions dur-ing early ontogeny are unfavourable for snow crab survival. In general, although varia-ble, predictions from the relationships indicate that the warm conditions that have occurred during the past decade will result in continued low productivity in the stock.
5.5 Research and new knowledge on vital crab and lobster population
Collaboration with research was also discussed. It was suggested that projects could be presented and shared before work begins and enable early collaboration and encourage joint publishing of papers.
5.5.1 Biology and eco-physiology of Cancer pagurus in Norwegian waters – contents and some preliminary results
In the biological part of the PhD the aim is to identify spatial and temporal differences in size (or age) at maturity, as well as geographical variation in the timing of reproductive events along the coast of Norway. Preliminary results on size at maturity indicate no difference between northern and southern Norway in the size where 50% of the crabs are mature, and no difference when the results are compared with identical studies conduct-ed in the same areas 10 year ago. Future work will focus on determining if there is a geo-graphical difference in the age at (same) size, and hence a difference in age at 50% maturity. In support of this hypothesis, the registrations of soft crabs by the reference fleet of crab fishers indicate a reduced frequency of molting, and hence a slower growth, with increasing latitude. The results are currently being subjected to statistical analysis to confirm these observations.

ICES WGCRAB REPORT 2015 | 19
The data from the reference fleet have also been used to identify spatial differences in reproductive events, where the results suggest that there is a geographical difference in the timing for molting in females, with a delayed onset with increasing latitude. This suggest that there is a geographical difference in the main period for mating. Similarly, industry data on Near-Infra Red scanning of crabs show that there is a delayed develop-ment of gonad with increasing latitude. Data collection and analysis is ongoing, but overall the aim is that data from the reference fleet and industrial data on crab quality will allow a better understanding on the spatial (and temporal) differences in life cycle events.
In the eco-physiological part of the PhD the focus is on the geographical differences in thermal preference and the effect of temperature on Cancer pagurus metabolism. The temperature preference of crabs from northern and southern Norway will be investigated by monitoring their movement in a raceway system with a thermal gradient. Further, the experiments will be conducted on crabs from different geographical locations that have been stored under the same environmental conditions for one year. The results will help to determine if the crabs are adapted or acclimated to different thermal environments. Thermal preference studies will be followed with respiration experiments to determine how metabolic activity is affected by temperature.
The aim is to present further results from the on-going investigation at the next WGCRAB meeting (in 2016).
5.5.2 Maturity of brown crab in Scottish waters
In this study, the size at maturity of brown crab was estimated using a variety of repro-ductive and morphometric criteria from samples obtained in the east and west coast of Scotland; this was estimated as the carapace width (CW) at which 50% of the sample was mature (CW50). Testes and ovaries were staged to estimate the size of gonadal maturity. When stage 2 males were defined as mature, a significant difference between east (100.5 mm) and west (107 mm) coast samples was identified; no significant difference was found between areas when stage 2 males were defined as immature (170 mm east and 171 mm west). There was also no significant difference between the size of gonadal ma-turity between east (145.5 mm) and west (145.6 mm) coast females. Sperm plugs were considered in addition as an indicator of behavioural maturity. Although none were found in east coast females, 84% of west coast females contained them internally; this could be indicative of differences in reproductive cycles. Size of morphometric maturity was estimated using cheliped measurements of males and abdomen/pleopod measure-ments of females. Although a significant breakpoint was identified for cheliped depth of east coast males, no other breakpoints were found to be significant. The change from isometric to allometric growth of these features was instead best represented by a gradu-al change.
5.5.3 Summary of research into improving recruitment estimates for Edible crab and European lobster in UK
Cefas has been working on this four year project funded by DEFRA that began in 2012. The project involves the testing of practical methods of tracking year-class strengths to give estimates of future recruitment for edible crab (Cancer pagurus) and European lobster (Homarus gammarus).

20 | ICES WGCRAB REPORT 2015
The difficulty in ageing crustacea means length-based models are used to produce re-gional stock assessments. Two of the most limiting factors on the quality of these assess-ments are estimates of recruitment and growth, both which are assumptions in the model. The aim of the Piecrust project is to provide recruit estimates which are currently lacking, and more accurate growth estimates that are available at the moment.
The project is based on four different work streams which involve the testing and evalu-ating the suitability of potting surveys, intertidal surveys, growth studies and observer surveys. Fieldwork was carried out off the North Norfolk coast where there is an active crab and lobster fishery, and there is suitable chalky reef habitat for intertidal surveys. Another benefit of this location is the proximity to the Cefas laboratory which is less than two hours away, thus making it easy for regular fieldwork to be carried out by Cefas staff.
Growth experiment: The aim of the growth experiment is to improve length models to produce a more robust stock assessment by carrying out a semi-captive experiment. Crabs and lobsters caught during the potting survey were kept on the seabed in adapted cages. The pots were serviced and the animals were fed regularly. Size and moult fre-quency were recorded, and modelling concentrated on moult increment.
Over 100 moults for crab were seen over the course of the experiment, and some crabs moulted up to three times. Lobsters did not respond well to being kept in cages for long periods of time. Their carapaces tended to get encrusted with growth which impeded moulting.
Intertidal surveys: The aim of the intertidal surveys was to investigate the suitability of this technique to provide recruit estimates for crab and lobster. The first year was spent trialling different survey designs and refining the method. Crabs were found in large numbers, but very few lobsters were found, therefore the survey focussed on searching for crabs only. During the subsequent three years, monthly surveys were carried out between spring and autumn at low water spring tides. Two searchers began searching a transect approximately two hours before low water, following the ebb tide out. Crabs were searched for in shallow pools, under stones and in damp sandy patches. Carapace width was measured, the animals were sexed where possible, and the location of the crab was recorded. Sizes of crabs found ranged between 7–138 mm. Peak abundance was late summer. One concern was that different searchers would have different levels of success and confound the results. However, when looking at effect of searcher on abundance of crabs it showed no significant effect. Large differences were seen between years, alt-hough this could be due to a combination of different factors including weather condi-tions, food availability, habitat changes or year class strength.
Potting survey: A potting survey was carried out between 5–10 miles off the north Nor-folk coast. Strings of parlour pots were adapted to retain small animals and keep large ones out of the pots by using fine mesh and restrictor rings on the openings. A fishing vessel was chartered for the duration of the project and pots were laid out in strings on a pre-designed survey grid. Regular trips (weekly in summer, weather dependant) were made to service the pots. The pots were emptied, re-baited and the animals were meas-ured and sexed.
The gear proved successful at targeting undersized crabs and excluding most animals over the minimum landing size (115 mm carapace width). The timing of peak catches

ICES WGCRAB REPORT 2015 | 21
varied by a month between years and was correlated to seabed temperatures. An appar-ent increase was seen in mean size of crabs with increasing distance from the coast.
5.5.4 Preliminary results of discard mortality experiments on Newfoundland snow crab
This presentation provides updates on an on-going experiment to investigate discard mortality rates in Newfoundland and Labrador snow crab. The experiment, being con-ducted haphazardly as part of stock assessment research cruises in various bays around Newfoundland since 2011, is lowering snow crab (Chionecetes opilio) back down to the seafloor in small-meshed covered pots after initial capture for assessment of mortality upon subsequent re-haul. Overall, trial results have been consistent in showing about 30% of crabs of all shell conditions and maturity stages are rendered critically weak or are killed by the process. Various explanatory variables including location, time out of water, crab size, and re-deployment times, have had little effect on the results. A second-ary experiment conducting reflex impairment tests on six physiological response indica-tors prior to re-deployment toward predicting imminent death has shown consistency in the predictive power of all responses which include leg flaring, retraction, and kicking ability, claw and mouth closure strength, and eye retraction ability. Although soft-shell crabs have been poorly represented in the study to date, for which mortality is expected to be very high, present results are suggesting that discard mortality is a concern for even the hardiest of crabs in the population and with declining recruitment into the exploita-ble biomass in many areas, a focus on minimizing discarding is warranted to maximize fishery yield from this resource.
5.5.5 Snow crab migration activity in the Barents Sea
It shows the first results of snow crab migration study in Barents Sea based on data from tagged crabs. In total over 3000 male crabs were tagged in the Barents Sea in the last two years and about 4% of the tags have been returned at the moment. The report presents the data on the main directions and average speed of crab’s migration. This study sug-gests that main trend of snow crab migration in the NEAFC Regulatory & Convention Area in Barents Sea was in the western direction.
6 Revisions to the work plan and justifications
There were no revisions or justifications to the work plan
7 Next meeting
The group agreed to hold the next meeting on 31 October – 4 November 2016 in Aber-deen, Scotland. Carlos Mesquita from Marine Scotland Science, Aberdeen, Scotland kind-ly offered to host the meeting.
The Chair thanked the local host Martial Laurens at IFREMER in Brest, France for his excellent hospitality and generosity. The excursion in the surrounding country and the delicious dinner at cosy restaurant “Le crabe Marteau” were much appreciated during the 2015 meeting.

22 | ICES WGCRAB REPORT 2015
Annex 1: List of participants
Name Address Phone/Fax Email
AnnDorte Burmeister (Chair)
Greenland Institute of Natural resources, Nuuk, Greenland
+299 361201 [email protected]
Darrell R. Mullowney DFO, ST Johns, Newfoundland, Canada
Ivan Zagorsky VNIRO, Moscow, Russia
Martial Laurans IFREMER, Brest, France
Rosslyn McIntyre Cefas, Lowestoft, UK
Ann Merethe Hjelset Institute of Marine Research, Tromsø, Norway
+ 47 7760 9740 [email protected]
Carlos Mesquita Marine Scotland Science
+ 44 1224295684 [email protected]
Sarah Clake Marine Institute, Ireland
+353 (0)91387200 [email protected]
Guldborg Søvik Institute of Marine Research Bergen Norway
+ 47 55 23 85 39 [email protected]
Snorre Bakke (Guest)
Møreforsking Marin Ålesund Norge
+47 70 11 16 [email protected]
Jonathan Shrives (Guest)
Department of the Environment Trinity, Jersey UK
+44 (0)1534 441600 [email protected]

ICES WGCRAB REPORT 2015 | 23
Annex 2: Recommendations
None

24 | ICES WGCRAB REPORT 2015
Annex 3: Updated tables – fishery and survey data
Table 1a: Stock summary for Cancer pagurus in England, Scotland, Ireland, France and Norway.
Cancer pagurusIreland Scotland England Jersey Channel Islands France Norway
Number of stocks in which national fleet is active 4 12 6 1 1
Stock areas (cross reference to map) Malin Clyde Central North Sea Western Channel Eastern Channel Whole Norwegian coast, Swedish border to Troms
Celtic sea East Coast Southern North Sea Western ChannelIrish sea Hebrides Eastern Channel Celtic Sea
Mallaig Western ChannelNorth Coast Celtic Sea
OrkneyPapa
ShetlandSouth EastSouth Minch
SuleUllapool
Indicator Irish SeaLandings 1990-2014 1974-2014 1983-2013 1996-2014 1985-2014 1914-2014Effort 1990-2014 1983-2013 1996-2015 1985-2014LPUE 1990-2014 1983-2013 1996-2016 1985-2014 2001-2014DPUE 1990-2014 No No 2001-2014
Size frequency data 1990-2014 1974-20141983-2013 (for most assessement units) 2004-2014 2000-2014 2001-2014
OthersAnalytical assessment methods No
LCA No YesYes (length based VPA
excluding Irish Sea) No No No
Production No No No One test NoChange in ratio No Yes Yes NoDepletion methods No No No No
OthersLPUE selected logbook
vesselsIndex LPUE from selected
logbook vessels No
Data sources
Surveys1989 (EC & WA), 1993 (NS)
+ Various non targeted No No
Larval 2002 NoJuvenile index /biomass Index NoAdult index/biomass Biomass NoNon target surveys Scallop dredge Scallop dredgeCommercial
Observer/self reporting/reference fleet Observer/ref fleet ObserverSelected logbook vessels
from 1985Selected logbook vessels
from 1985 reference fleet
Size frequency data Yes Yes Yes No Yes YesLogbooks Yes Yes (EU logbooks) Yes Yes Yes YesTag returns Yes Yes Yes No Yes No
VMS Yes Yes (boats > 12m)Yes (Commercial
inconfidence) NoYes (Commercial
inconfidence) No
Electronic logbooks No No No No From 2013 No
OthersNational logbooks for vessels under 12 m
Biological parameters
M 0.2 0.10.1 and 0.2 assumed
feasible scenarios No 0.2 No
Growth data k = 0.1-0.2 197 ; Linfm=220; Kf=0.172 ; Linfk=0.191 (female), 0.196 (male). Linf 240mm CW No 0.1-0.2 No
Fecunditya=0.0187 and b=0.0268,
f=aebl NoNo
Size at maturity125 - 140
130 - 150
Regional 89-105 (male), 110-126 (female) No
130 for female, less for maleFemales: L50 112
(mature), external roe: 130 mm or larger
Others Terminal F=0.5 Analytical assessment outputsBiomass Yes Yes Yes No No NoSpawning stock No No Yes No No NoRecruitment No No No No No NoFishing mortality Yes Yes Yes No No No
ICES WGCRAB REPORT 2015 | 25
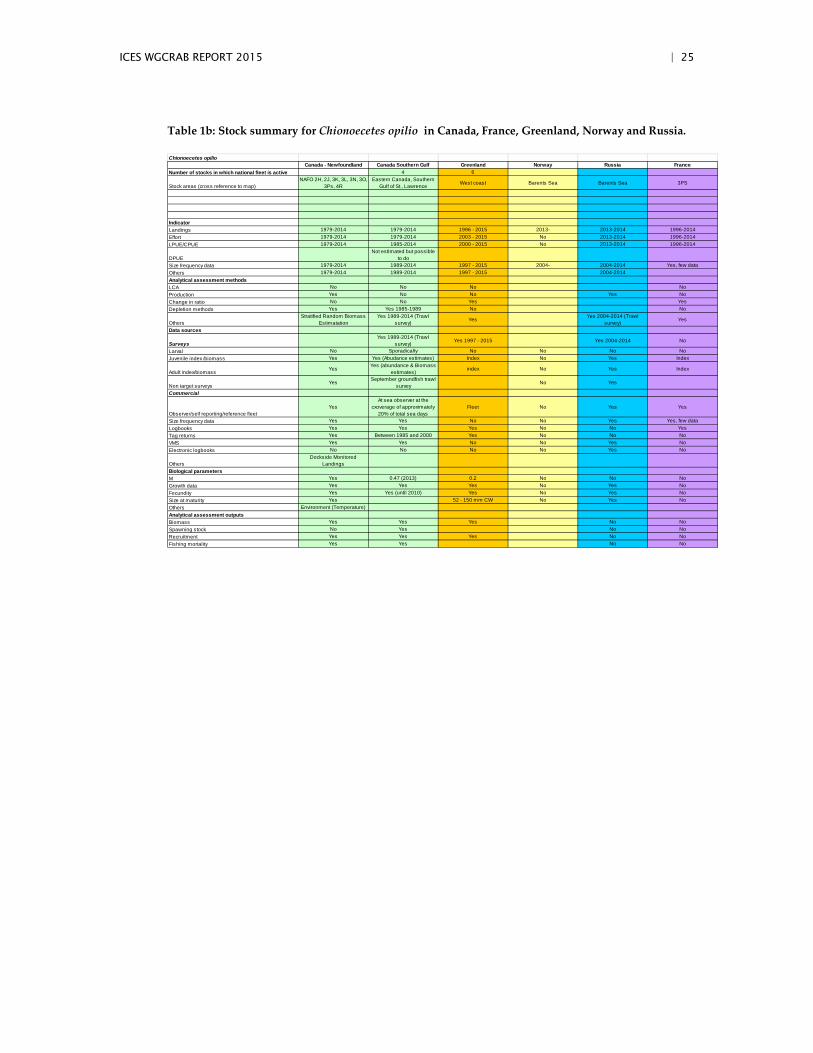
Table 1b: Stock summary for Chionoecetes opilio in Canada, France, Greenland, Norway and Russia.
Chionoecetes opilioCanada - Newfoundland Canada Southern Gulf Greenland Norway Russia France
Number of stocks in which national fleet is active 4 6
Stock areas (cross reference to map)NAFO 2H, 2J, 3K, 3L, 3N, 3O,
3Ps, 4REastern Canada, Southern
Gulf of St., Lawrence West coast Barents Sea Barents Sea 3PS
IndicatorLandings 1979-2014 1979-2014 1996 - 2015 2013- 2013-2014 1996-2014Effort 1979-2014 1979-2014 2003 - 2015 No 2013-2014 1996-2014LPUE/CPUE 1979-2014 1985-2014 2000 - 2015 No 2013-2014 1996-2014
DPUENot estimated but possible
to doSize frequency data 1979-2014 1989-2014 1997 - 2015 2004- 2004-2014 Yes, few dataOthers 1979-2014 1989-2014 1997 - 2015 2004-2014Analytical assessment methodsLCA No No No NoProduction Yes No No Yes NoChange in ratio No No Yes YesDepletion methods Yes Yes 1985-1989 No No
OthersStratified Random Biomass
EstimatationYes 1989-2014 (Trawl
survey) Yes Yes 2004-2014 (Trawl survey) Yes
Data sources
SurveysYes 1989-2014 (Trawl
survey) Yes 1997 - 2015 Yes 2004-2014 No
Larval No Sporadically No No No NoJuvenile index /biomass Yes Yes (Abudance estimates) Index No Yes Index
Adult index/biomass Yes Yes (abundance & Biomass estimates) index No Yes Index
Non target surveys Yes September groundfish trawl survey No Yes
Commercial
Observer/self reporting/reference fleetYes
At sea observer at the cxoverage of approximately
20% of total sea daysFleet No Yes Yes
Size frequency data Yes Yes No No Yes Yes, few dataLogbooks Yes Yes Yes No No YesTag returns Yes Between 1985 and 2000 Yes No No NoVMS Yes Yes No No Yes NoElectronic logbooks No No No No Yes No
OthersDockside Monitored
LandingsBiological parametersM Yes 0.47 (2013) 0.2 No No NoGrowth data Yes Yes Yes No Yes NoFecundity Yes Yes (until 2010) Yes No Yes NoSize at maturity Yes 52 - 150 mm CW No Yes NoOthers Environment (Temperature)Analytical assessment outputsBiomass Yes Yes Yes No NoSpawning stock No Yes No NoRecruitment Yes Yes Yes No NoFishing mortality Yes Yes No No

26 | ICES WGCRAB REPORT 2015
Table 1c: Stock summary for Paralithodes camtcshaticus in Norway and Russia.
Paralithodes camtschaticusNorway Russia
Number of stocks in which national fleet is active
Stock areas (cross reference to map)ICES Aera 03 ICES Area Ib Russian coast
of South-East of Barents Sea
IndicatorLandings 1994-2015 1994-2014Effort 1994-2015 1994-2014LPUE 1994-2014DPUESize frequency data Yes YesOthersAnalytical assessment methodsLCAProduction 2011-2015Change in ratioDepletion methods 2010-2014Others CSA (2006-2013)Data sources SurveysLarvalJuvenile index /biomass YesAdult index/biomass Annual YesNon target surveys YesCommercialObserver/self reporting/reference fleet YesSize frequency data YesLogbooks Yes NoTag returns YesVMS Yes YesElectronic logbooks No YesOthersBiological parametersM 0.2 0.08961
Growth dataIncrement and moulting
frequency Yes
Fecundity Yes YesSize at maturity Yes YesOthersAnalytical assessment outputsBiomass Yes YesSpawning stock Yes NoRecruitment Yes YesFishing mortality Yes Yes

ICES WGCRAB REPORT 2015 | 27
Table 1d: Stock summary for Maja brachdactyla in England, Scotland, France, Ireland and Jersey Channel Islands.
Maja brachdactylaEngland Scotland France Ireland Jersey Channel Islands
Number of stocks in which national fleet is active 2 1Stock areas (cross reference to map) SW Ireland Western Channel
Malin
IndicatorLandings 1983-2013 2006-2013 1973-2014 2004-2014 1996-2014
EffortTargetted potting and netting
effort not available NoTargetted potting and netting
effort not available No 1996-2015
LPUE No No No No 1996-2016DPUE No No No No
Size frequency data
Yes. At least recent i.e. 2004-2013
maybe much longer series NoFew data from some periods
Data from some target studies, 1985, 2000, 2003-
2007 and 20092004-2014
Others No No NoAnalytical assessment methodsLCA No No No No NoProduction No No No No NoChange in ratio No No No No YesDepletion methods No No No No NoOthers No No No No noData sources Surveys Yes (1986-1996) Yes (1985, 2003 & 2009)Larval No No NoJuvenile index /biomass Possibly No No NoAdult index/biomass Yes yes 2004-214Non target surveysCommercial
Observer/self reporting/reference fleet No No No Data for some years; 2003 & 2009 No
Size frequency data Yes No Few data from some periods Data for some years; 2003 & 2009 No
Logbooks No No Yes Yes from reference fleet YesTag returns No No No No NoVMS No No Yes Yes (2005 - 2007) NoElectronic logbooks No No For some vessels No NoOthers No No No NoBiological parametersM No No NoGrowth data No No NoFecundity No No NoSize at maturity No No NoOthers NoAnalytical assessment outputs NoBiomass No No No No NoSpawning stock No No No No NoRecruitment No No No No NoFishing mortality No No No No No

28 | ICES WGCRAB REPORT 2015
Table 1e: Stock summary for Homarus gammarus in Scotland, France, Ireland, Jersey Channel Islands and England.
HomarusScotland France Ireland Jersey Channel Islands England
Number of stocks in which national fleet is active 12 4 1 5
Stock areas (cross reference to map) Clyde Western Channe Malin Western Channel Northumberland Durham
East Coast Bay of Biscay SW Ireland Yorkshire HumberHebrides SE Ireland East Anglia
Mallaig N Irish Sea Southeast and South coast
North Coast SouthwestOrkneyPapa
ShetlandSouth East
South MinchSule
UllapoolIndicatorLandings 1974-2014 Yes 1995-2014 1996-2014 1983-2013Effort Yes 1996-2015 1983-2013LPUE Yes 1995-2004 1996-2016 YesDPUE No NoSize frequency data 1974-2014 Yes 1995-2014 2004-2014OthersAnalytical assessment methodsLCA Yes Yes No No Yes (length based VPA)Production No Yes No No NoChange in ratio Yes No No Yes NoDepletion methods No No No NoOthers Index LPUE from selected logbook vessels LPUE selected logbook vesselsData sources Surveys NoLarval No No No NoJuvenile index /biomass No one test in 2015 No Yes Index and CL (2 per year, very small - 180 pot lifts) NoAdult index/biomass No No No Yes Index and CL (2 per year, very small - 180 pot lifts) NoNon target surveys No No NoCommercial
Observer/self reporting/reference fleet ObserverYes
Yes ref fleetSelected logbook vessels from
1985Size frequency data Yes Yes Yes no
Logbooks Yes (EU logbooks)Yes
Yes (EU & some regional areas for
some years) yesTag returns No Yes Yes noVMS Yes (boats > 12m) Few data Yes (boats > 12m) no YesElectronic logbooks No No No no NoOthers 1 off volunteer survey of CL and berried proportionsBiological parametersM 0.1 0.2 0.1-0.2 No 0.15Growth data Km=0.11 ; Linfm=173.4; Kf=0.13 ; Linff=150; k arround 0,25 k=0.12; Linf=172 NoFecundity Yes NoSize at maturity ~80 mm L50, from 93 to 104 L50 95mm NoOthers Terminal F=0.5 Analytical assessment outputsBiomass Yes Yes from few areas No No YesSpawning stock No Yes from few areas No No YesRecruitment No Yes from few areas No No NoFishing mortality Yes Yes from few areas No No Yes
ICES WGCRAB REPORT 2015 | 29
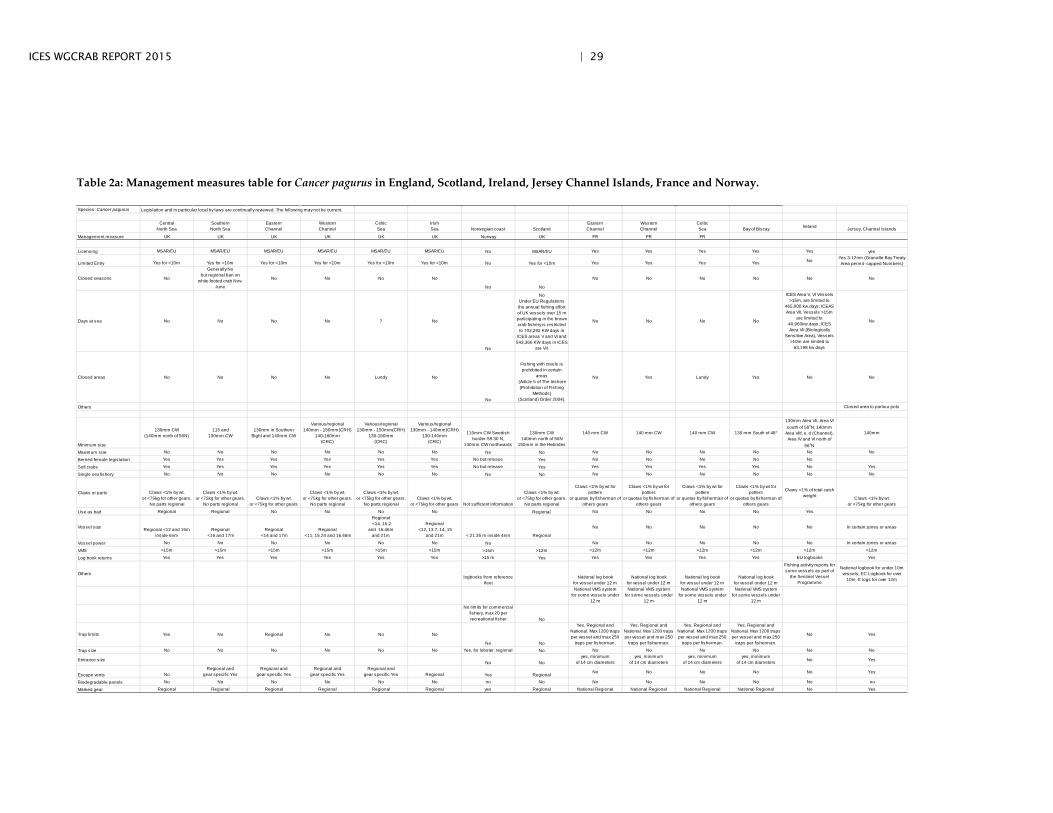
Table 2a: Management measures table for Cancer pagurus in England, Scotland, Ireland, Jersey Channel Islands, France and Norway.
Species: Cancer pagurus Legislation and in particular local by laws are continually reviewed. The following may not be current.
Central North Sea
Southern North Sea
Eastern Channel
Western Channel
Celtic Sea
Irish Sea Norwegian coast Scotland
Eastern Channel
Western Channel
Celtic Sea Bay of Biscay Ireland Jersey, Channel Islands
Management measure UK UK UK UK UK UK Norway UK FR FR FR
Licensing MSAR/EU MSAR/EU MSAR/EU MSAR/EU MSAR/EU MSAR/EU No MSAR/EU Yes Yes Yes Yes Yes yes
Limited Entry Yes for <10m Yes for <10m Yes for <10m Yes for <10m Yes for <10m Yes for <10m No Yes for <10m Yes Yes Yes Yes No Yes 3-12nm (Granville Bay Treaty Area permit -capped Numbers)
Closed seasons No
Generally No but regional ban on
white footed crab Nov-June
No No No No
No No
No No No No No No
Days at sea No No No No ? No
No
NoUnder EU Regulations the annual fishing effort of UK vessels over 15 m participating in the brown crab fishery is restricted to 702,292 KW days in
ICES areas V and VI and 543,366 KW days in ICES
are VII.
No No No No
ICES Area V, VI Vessels >15m, are limited to
465,000 kw.days; ICEAS Area VII, Vessels >15m
are limited to 40,960kw.days; ICES Area VII (Biologically
Sensitive Area), Vessels >10m are limited to
63,198 kw.days
No
Closed areas No No No No Lundy No
No
Fishing with creels is prohibited in certain
areas (Article 5 of The Inshore (Prohibition of Fishing
Methods) (Scotland) Order 2004).
No Yes Lundy Yes No No
Others Closed area to parlour pots
Minimum size
130mm CW (140mm north of 56N)
115 and 130mm CW
130mm in Southern Bight and 140mm CW
Various/regional 140mm - 150mm(CRH)
140-160mm(CRC)
Various/regional 130mm - 150mm(CRH)
130-160mm(CRC)
Various/regional 130mm - 140mm(CRH)
130-140mm(CRC)
110mm CW Swedish border-59 30 N,
130mm CW northwards
130mm CW140mm north of 56N
150mm in the Hebrides
140 mm CW 140 mm CW 140 mm CW 130 mm South of 48°
130mm Area VII, Area VI south of 56oN; 140mm
Area VIIf, e, d (Channel), Area IV and VI north of
56oN
140mm
Maximum size No No No No No No No No No No No No No No
Berried female legislation Yes Yes Yes Yes Yes Yes No but release Yes No No No No No
Soft crabs Yes Yes Yes Yes Yes Yes No but release Yes Yes Yes Yes Yes No Yes
Single sex fishery No No No No No No No No No No No No No No
Claws or parts Claws <1% by wt. or <75kg for other gears.
No parts regional
Claws <1% by wt. or <75kg for other gears.
No parts regionalClaws <1% by wt.
or <75kg for other gears
Claws <1% by wt. or <75kg for other gears.
No parts regional
Claws <1% by wt. or <75kg for other gears.
No parts regionalClaws <1% by wt.
or <75kg for other gears Not sufficient information
Claws <1% by wt. or <75kg for other gears.
No parts regional
Claws <1% by wt for potters
or quotas by fisherman of others gears
Claws <1% by wt for potters
or quotas by fisherman of others gears
Claws <1% by wt for potters
or quotas by fisherman of others gears
Claws <1% by wt for potters
or quotas by fisherman of others gears
Claws <1% of total catch weight Claws <1% by wt.
or <75kg for other gears
Use as bait Regional Regional No No No No Regional No No No No Yes
Vessel size Regional <12 and 16m inside 6nm
Regional <16 and 17m
Regional <14 and 17m
Regional <11, 15.24 and 16.46m
Regional <14, 15.2
and 16.46mand 21m
Regional <12, 13.7, 14, 15
and 21m < 21.35 m inside 4nm Regional
No No No No No In certain zones or areas
Vessel power No No No No No No No No No No No No In certain zones or areas
VMS >15m >15m >15m >15m >15m >15m >15m >12m >12m >12m >12m >12m >12m >12m
Log book returns Yes Yes Yes Yes Yes Yes >15 m Yes Yes Yes Yes Yes EU logbooks Yes
Otherslogbooks from reference
fleetNational log book
for vessel under 12 mNational log book
for vessel under 12 mNational log book
for vessel under 12 mNational log book
for vessel under 12 m
Fishing activity reports for some vessels as part of
the Sentinel Vessel Programme
National logbook for under 10m vessels, EC Logbook for over
10m. E logs for over 12m
National VMS systemfor some vessels under
12 m
National VMS systemfor some vessels under
12 m
National VMS systemfor some vessels under
12 m
National VMS systemfor some vessels under
12 mNo limits for commercial
fishery, max 20 per recreational fisher No
Trap limits Yes No Regional No No No
No No
Yes, Regional and National. Max 1200 traps per vessel and max 250
traps per fisherman.
Yes, Regional and National. Max 1200 traps per vessel and max 250
traps per fisherman.
Yes, Regional and National. Max 1200 traps per vessel and max 250
traps per fisherman.
Yes, Regional and National. Max 1200 traps per vessel and max 250
traps per fisherman.
No Yes
Trap size No No No No No No Yes, for lobster, regional No No No No No No No
Entrance size No Noyes, minimum
of 14 cm diametersyes, minimum
of 14 cm diametersyes, minimum
of 14 cm diametersyes, minimum
of 14 cm diameters No Yes
Escape vents NoRegional and
gear specific YesRegional and
gear specific YesRegional and
gear specific YesRegional and
gear specific Yes Regional Yes Regional No No No No No Yes
Biodegradable panels No No No No No No no No No No No No No no
Marked gear Regional Regional Regional Regional Regional Regional yes Regional National Regional National Regional National Regional National Regional No Yes

30 | ICES WGCRAB REPORT 2015
Table 2b: Management measures table for Chionoecetes opilio in Canada, France, Greenland, Norway and Russia.
Species: Chionoecetes opilio
West coast of Greenland Newfoundland Sourthern Gulf SouthNova Scotia Barent Sea Barents SeaManagement measure Greenland Canada Canada France, Saint Pierre et Miquelon Norway Russia
Licensing Yes Yes Yes No Yes NoLimited Entry Yes for < 75 Brt Yes (no new licences available) Yes Yes No No
Closed seasons No Yes Yes Yes No NoDays at sea No No No Yes No No
Closed areas Yes Yes Yes No No
Others Dockside Monitored Landings, Soft-shell protocols, Trip Limits Soft crab control
95 mm CWMinimum size 100 mm CW 95mm CW 95mm CW No No NoMaximum size No No No Yes - prohibation to land females No No
Berried female legislation Yes - prohibation to land females Yes - prohibation to land females Yes - prohibation to land females Yes No NoSoft crabs Yes Yes Yes - prohibation to land soft crab Yes
Single sex fishery Yes Yes Yes no Yes YesClaws or parts no no No No No No
Use as bait Squid Squid / Herring Mackerel, Herring, Squid Squid No Herring
Vessel size Regional <10m Various fleet sectors (<40', 40-64'11", 65-89'11") 65 fts or less No 49.6-54.8 m
Vessel power No No No No 700-1700 hpsVMS Yes Yes No Yes Yes
Log book returns Yes Yes Yes Yes Yes No
Others Observer Coverage100% dock side landing monitoring &
at-sea observer coverage at approximately 20%
Yes
Trap limits No YesYes (the number varies depending on the area from 50 to 150/ licence), Area
19 has total trap number at 1699No No No
Trap size Yes (meshsize 1400mm) Yes (135mm)Yes (volume should not exceed 2 cubic
meter) and maximum and minimum mesh sizes at 65 and 75 mm
Yes No No
Escape vents No No No but see below No No NoBiodegradable panels No Yes Biodegradable twine No No
Marked gear Regional / overseas trade Yes Yes

ICES WGCRAB REPORT 2015 | 31
Table 2c: Management measures table for Paralithodes camtschaticus in Norway and Russia.
Species: Paralithodes camtschaticus
Barents Sea Barents Sea
Management measure Norway Russia
Licensing Yes Yes
Limited Entry Yes Yes
Closed seasons No Yes
Days at sea No No
Closed areas No Yes
Others
Minimum size 130mm CL 150mm
Maximum size No No
Berried female legislation No Yes - prohibation to land females
Soft crabsSingle sex fishery No Yes, only males
Claws or parts No Sections by different weight
Use as bait Herring Herring
Vessel size 6-22 m 49.6-54.8 m
Vessel power 700-1700 hps
VMS Yes Yes
Log book returns Yes No
Others
Trap limits Yes Yes
Trap size Yes Yes
Escape vents Yes No
Biodegradable panels No Yes
Marked gear Yes No
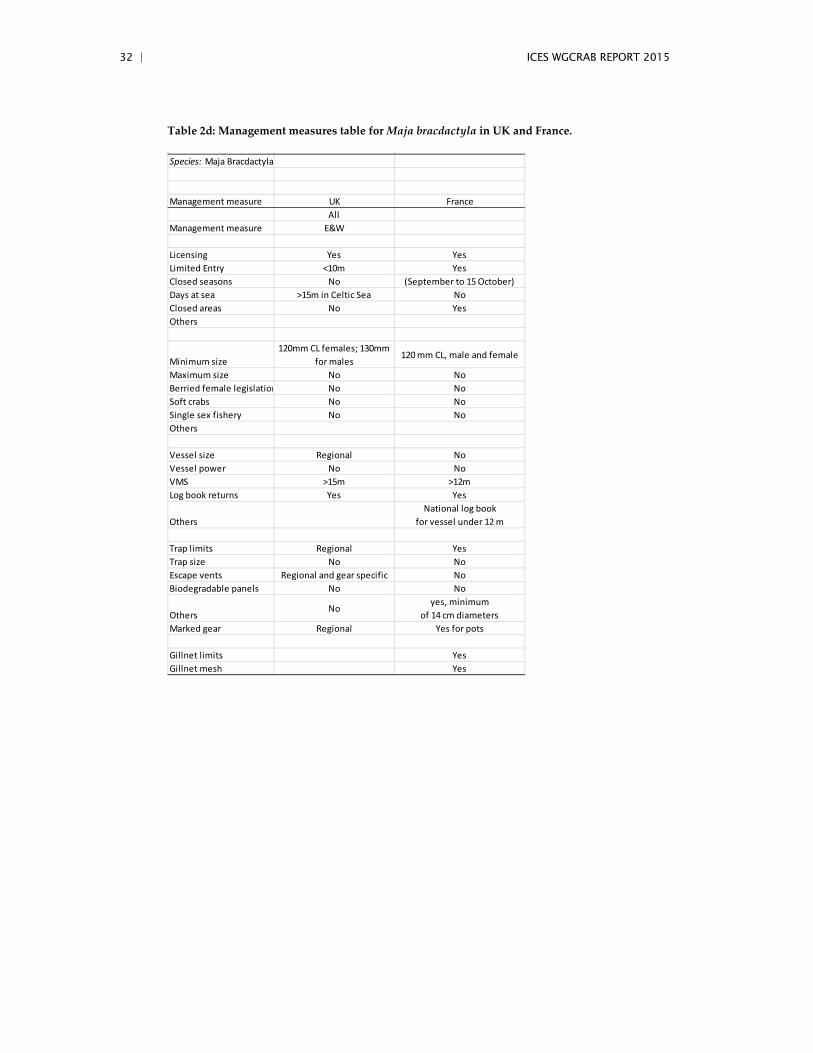
32 | ICES WGCRAB REPORT 2015
Table 2d: Management measures table for Maja bracdactyla in UK and France.
Species: Maja Bracdactyla
Management measure UK FranceAll
Management measure E&W
Licensing Yes YesLimited Entry <10m YesClosed seasons No (September to 15 October)Days at sea >15m in Celtic Sea NoClosed areas No YesOthers
Minimum size120mm CL females; 130mm
for males120 mm CL, male and female
Maximum size No NoBerried female legislation No NoSoft crabs No NoSingle sex fishery No NoOthers
Vessel size Regional NoVessel power No NoVMS >15m >12mLog book returns Yes Yes
OthersNational log book
for vessel under 12 m
Trap limits Regional YesTrap size No NoEscape vents Regional and gear specific NoBiodegradable panels No No
OthersNo
yes, minimum of 14 cm diameters
Marked gear Regional Yes for pots
Gillnet limits YesGillnet mesh Yes

ICES WGCRAB REPORT 2015 | 33
Table 2e: Management measures table for Homarus gammarus in England, Scotland, Ireland, Jersey Channel Islands and France.
Species: Lobster
Management measure Scotland France Norway Ireland Jersey, Channel Islands England
Licensing MSAR/EU Yes Yes? Yes Yes Yes
Limited Entry
Yes for <10m
Yes Yes? No
Yes 3-12nm (Granville Bay Treaty Area permit -capped Numbers) No for 0-3nm limit of territorial
waters
Yes
Closed seasons No No Yes? No No NoDays at sea No No ? No No No
Closed areas
Fishing with creels is prohibited in certain areas (Article 5 of The Inshore (Prohibition of Fishing Methods) (Scotland) Order 2004).
Yes Yes? No No MCZ restrictions (regional)
Others Closed area to parlour pots
Minimum size
87mm CL (all areas except Shetland and Hebrides)90mm CL (Shetland)90mm CL (Hebrides)
87 mm CL, male and female 250mm 87mm CL for both sexes 87mm
87mm CL national, 90mm within 6 miles of coast
(Devon, Cornwall, Isles of Scilly)
Maximum sizeYes - for famales only155mm CL 145mm CL (Hebrides)
No No? 127mm CL (since Jan 2015) No No
Berried female legislationNo
No Yes No Yes but not in effect - has to be brough in by Ministerial Order Yes (regional)
Soft crabs No No ? No Yes YesSingle sex fishery No No Yes No No No
Claws or parts
It is illegal to land ‘V’-notched lobsters, or animals that have been mutilated in any way.Lobsters can only be retained on board or landed whole.
No ?
It is illegal to land 'V-notched' or mutilated
lobster. Lobsters can only be retained on board or
landed whole.
Must be retained whole Limits on percentage/ quanitity caught (regional)
Use as bait No No ? No Not Lobster
Vessel sizeNo
No ? No In certain zones or areas Yes (regional)
Vessel powerNo
No No In certain zones or areas
VMS >12m >12m >12m >12m >12mLog book returns Yes Yes No? No Yes Yes
Others National log book for vessel under 12 m
Sentinel Vessel Programme data
National logbook for under 10m vessels, EC Logbook for over
10m. E logs for over 12m
Trap limits No Yes Yes No Yes Yes (regional)Trap size No No No No No
Escape vents No No No Yes Yes (regional)Biodegradable panels No No No No No
Marked gear Regional Yes for pots No Yes Yes (regional)
Entrance size yes, minimum of 14 cm diameters No Yes- parlours No
Parlour pot Regional Legislation Prohibited in some areas No

34 | ICES WGCRAB REPORT 2015
Table 3a. Landings (tones) of Cancer pagurus in England, Scotland, France, Norway, Ireland and Jersey (UK).
Species: Cancer pagurusTotal catch tonsSite England Scotland France Norway Ireland Jersey, Channel IslandsYear
1990 4,282 6,076 1,3741991 5,485 5,310 1,4621992 4,648 5,583 1,3161993 3,820 5,896 1,6411994 4,759 6,086 1,7811995 6,092 6,823 1,8061996 5,528 6,527 1,889 4951997 7,470 7,000 2,205 5231998 8,021 6,490 2,984 5211999 7,437 6,087 2,836 4732000 12,363 9,650 5,182 2,890 4402001 13,013 8,458 5,513 3,478 4472002 11,973 7,874 5,963 4,344 5242003 13,349 7,525 6,327 4,944 5402004 10,825 6,761 7,813 5,248 11,662 5412005 8,484 8,332 6,259 5,671 7,911 4382006 11,043 10,430 5,423 6,205 8,779 3492007 12,074 11,919 6,178 8,514 6,486 4122008 11,697 9,336 6,416 5,295 6,737 4812009 11,001 9,466 4,353 4,970 10,934 3612010 11,902 10,857 5,487 5,774 11,394 4092011 12,089 11,859 5,690 5,319 6,964 4342012 13,844 10,892 5,990 4,981 6,195 4742013 13,804 10,891 5,570 5,242 5,755 3582014 16,330 12,306 5901 4,629 7,257

ICES WGCRAB REPORT 2015 | 35
Table 3b. Landings (tones) of Chionoecetes opilio in Canada, Greenland, Norway and Russia.
Species: Chionoecetes opilio Chionoecetes opil ioTotal catch tonsSite Canada Greenland Norway Russia FranceYear
1990 26,2331991 35,2951992 37,2321993 47,8191994 60,6621995 65,505 9971996 65,505 563 1891997 71,388 3,214 3681998 75,236 2,094 3541999 95,381 4,982 5892000 93,411 10,521 5502001 95,241 15,139 4852002 106,547 11,174 1392003 96,360 7,179 832004 102,776 6,295 1592005 95,996 4,213 1572006 89,271 3,305 1912007 90,280 2,189 1662008 93,166 2,354 1232009 96,635 3,191 1692010 83,393 2,363 2362011 83,979 2,015 2422012 92,760 1,983 3252013 98,089 2,162 189 62 2512014 95,532 2,157 1,850 3,100* 1002015 2,770
*provisional

36 | ICES WGCRAB REPORT 2015
Table 3c. Landings (tones) of Paralithodes camtschaticus in Norway and Russia.
Species: Paralithodes camtschaticusTotal catch tonsSite Norway RussiaYear
19901991199219931994 11,000 221995 11,000 91996 15,000 241997 15,000 631998 25,000 901999 37,500 1432000 37,500 1132001 100,000 3002002 100,000 9002003 200,000 1,9502004 280,000 1,1052005 280,000 3,0212006 300,000 9,3892007 300,000 9,9532008 596,000 8,8232009 1,185 6,1422010 900 3,7872011 1,200 3,6982012 1,000 5,2092013 1,000 5,5312014 1,100 6,000*2015 1,300
*provisionalNorway: 1994-2008: Number of individuals

ICES WGCRAB REPORT 2015 | 37
Table 3c. Landings (tones) of Maja brachdactyla in France, Ireland, Scotland and Jersey (UK).
Species: Maja BrachdactylaTotal catch tonsSite France Ireland Scotland Jersey, Channel IslandsYear
1990199119921993199419951996 3831997 1621998 1601999 1752000 1722001 2362002 3,618 2702003 3,692 2332004 3,876 180 2232005 3,744 141 1632006 4,287 153 0.7 1292007 4,297 70 0.1 1062008 4,074 153 3.1 1792009 2,547 443 6.0 1772010 3,351 415 3.1 1732011 3,925 290 1.2 1442012 3,451 818 1.7 1082013 3,321 229 0.2 772014 4,552 113

38 | ICES WGCRAB REPORT 2015
Table 3d. Landings (tones) of Homarus gammarus in England, Scotland, Ireland, France and Jersey (UK).
Species: LobsterTotal catch tonsSite England Scotland Ireland France Jersey, Channel IslandsYear
1990 7691991 6871992 5131993 3691994 4571995 5651996 453 1641997 653 1661998 638 1571999 509 1532000 786 411 1282001 776 289 1302002 832 341 294 1572003 1,008 353 348 1672004 921 404 853 339 1672005 910 409 635 324 1392006 1,587 711 625 388 1312007 1,700 890 308 475 1552008 1,695 915 498 444 1632009 1,640 953 431 329 1772010 1,531 1,100 477 863 2252011 1,845 1,219 735 802 2572012 1,888 1,132 249 535 2372013 1,821 1,026 374 465 1982014 2,020 1,208 585 654

ICES WGCRAB REPORT 2015 | 39
Table 4. Annual Lobster landings (tonnes) into Scotland by creel fishery assessment unit from 2005–2014. Data from Fisheries Management database.
Assessment unit Year
2005 2006 2007 2008 2009 2010 2011 2012 2013 2014
Clyde
6.3 18.5 16.8 22.2 17.4 24.8 26.3 24.7 23.5 46.2
East Coast
29.4 86.7 129.8 147.5 163.9 207.3 279.3 265.5 214.9 226.1
Hebrides
96.4 168.3 203.5 161.3 142.5 155.8 141.7 139.0 97.3 148.6
Mallaig
1.5 0.9 1.1 3.5 0.4 0.9 1.2 12.7 0.6 1.0
North Coast
5.6 15.5 14.3 15.0 12.0 14.3 15.4 10.0 10.0 10.7
Orkney
124.1 121.6 132.7 138.6 160.3 170.8 177.8 155.5 117.4 163.6
Papa
8.1 7.4 8.4 7.0 10.4 10.3 6.4 5.7 5.7 7.8
Shetland
2.3 9.3 14.1 19.8 25.7 29.8 29.2 36.8 35.9 39.7
South East
60.3 136.2 180.5 204.3 257.3 277.8 374.6 334.4 387.8 409.2
South Minch
48.4 94.6 101.7 111.4 99.8 112.0 89.9 84.7 75.2 101.3
Sule
4.9 5.3 4.8 4.8 4.0 3.4 3.6 2.1 0.6 0.7
Ullapool
9.6 20.0 24.5 13.9 12.3 18.7 10.8 11.6 15.1 16.7
Outside Assess. Units
12.2 26.9 57.9 65.8 46.8 74.4 62.9 49.7 41.8 36.3
Total
409.2 711.1 890.2 915.0 953.0 1100.3 1219.1 1132.5 1025.9 1207.8

40 | ICES WGCRAB REPORT 2015
Table 5. Lobster stock status, relationship between F and FMSY proxy for 2002–2005, 2006–2008 and 2009–2012.
F (Fishing Mortality)
2002-2005
2006-2008
2009-2012
Clyde Males Above
Females Above
Hebrides Males Above
Females Below
North
Coast
Males Unknown
Females Unknown
Papa Males Above
Females Below FMSY
Shetland Males Below
Females Above
Sule Males Unknown
Females Unknown
F (Fishing Mortality)
2002-2005
2006-2008
2009-2012
East
Coast
Males Above
Females Above
Mallaig Males Unknown
Females Unknown
Orkney Males Above
Females At FMSY
South
East
Males Above
Females Above
South
Minch
Males Above
Females Above
Ullapool Males Unknown
Females Unknown

ICES WGCRAB REPORT 2015 | 41
Table 6. Annual Brown crab landings (tonnes) into Scotland by creel fishery assessment unit from 2005–2014. Data from Fisheries Management database.
Assessment unit Year
2005 2006 2007 2008 2009 2010 2011 2012 2013 2014
Clyde
39.6 198.2 250.3 213.7 99.4 139.3 137 182.8 159.3 189.6
East Coast
405.9 830.4 884.2 866.9 778.6 1029.0 1091.3 1213.9 1271.3 1305.9
Hebrides
1730.0 2279.4 2340.0 1738.4 1822.3 1885.8 2433.3 1996.5 2130.2 2667.2
Mallaig
5.2 7.7 67.0 32.4 8.5 12.9 21.3 69.6 6.7 17.5
North Coast
488.1 435.8 513.8 348.7 568.3 681.9 428.7 514.2 571.2 537.8
Orkney
1582.2 1467.9 1555.4 1187.3 1155.6 1462.1 1746.6 1693.7 1906.2 1958.8
Papa
454.1 838.2 798.0 764.1 1002.0 878.2 884.2 828.2 936.3 1239.4
Shetland
193.8 640.8 522.4 566.9 390.2 334.4 419 478.4 604.9 666.1
South East
166.0 273.8 281.8 325.5 308.0 345.7 356.7 447.1 469.9 396.2
South Minch
1389.1 1316.2 2149.6 1141.0 1000.7 1651.3 1632.4 1094.4 869.8 1191.6
Sule
1357.9 1663.1 2026.1 1836.2 1981.8 1928.9 2275.5 1611.2 1491.6 1703.6
Ullapool
271.7 358.1 376.0 241.9 192.1 245.4 244.9 687.2 439.0 400.9
Outside Assess. Units
249.0 120.5 154.1 73.1 158.7 261.9 188.2 74.7 34.3 31.5
Total
8332.5 10430.3 11918.7 9336.1 9466.1 10856.7 11859.1 10891.9 10890.6 12306.0

42 | ICES WGCRAB REPORT 2015
Table 7. Brown crab stock status, relationship between F and FMSY proxy for 2002–2005, 2006–2008 and 2009–2012.
F (Fishing Mortality)
2002-2005
2006-2008
2009-2012
Clyde Males Unknown
Females Unknown
Hebrides Males Below
Females Above
North
Coast
Males Below FMSY
Females Below FMSY
Papa Males Below FMSY
Females Below FMSY
Shetland Males At FMSY
Females Below
Sule Males At FMSY
Females Above
F (Fishing Mortality)
2002-2005
2006-2008
2009-2012
East
Coast
Males Above
Females Above
Mallaig Males Unknown
Females Unknown
Orkney Males Above
Females Above
South
East
Males Above
Females Above
South
Minch
Males Above
Females Above
Ullapool Males Unknown
Females Unknown

ICES WGCRAB REPORT 2015 | 43
Figure 1. Abundance index in four fishing areas in North Brittany.
0
2
4
6
8
10
12
14
2002 2004 2006 2008 2010 2012 2014 2016
Year
CPU
E(kg
/100
pot
s)
0
0,2
0,4
0,6
0,8
1
1,2
1,4
1,6
1,8
MSC4MSC1MSC2MoyenneIndice
Figure 2. Abundance index in three fishing areas in Normandy.

44 | ICES WGCRAB REPORT 2015
Figure 3. Trend of the CPUE by year, month or area for the existing times series since 1985.
Figure 4. Distribution of the landing (Tons) by fleet.