computational biology group
DESCRIPTION
Computational Biology Group. Class prediction of tumor samples Supervised Clustering Detection of Subgroups in a Class. Training Set. Test Sample. Class prediction : Assign unknown samples to already known classes. - PowerPoint PPT PresentationTRANSCRIPT

Computational Biology GroupComputational Biology Group

Class prediction of tumor Class prediction of tumor samplessamples
Supervised ClusteringSupervised Clustering
Detection of Subgroups in a Detection of Subgroups in a ClassClass

Sample 1
Sample 2
Sample 3
Sample 4
Sample 5 ….
Sample 100
Class Label 0 0 0 0 0 1 1
Gene 1 -214 -139 -76 -135 -106 -138 -72
Gene 2 -153 -73 -49 -114 -125 -85 -144
Gene 3 -58 -1 -307 265 -76 215 238
Gene 4 88 283 309 12 168 71 55
Gene 5 -295 -264 -376 -419 -230 -272 -399
Gene 6 -558 -400 -650 -585 -284 -558 -551
Gene 7 199 -330 33 158 4 67 131
Gene 8 -176 -168 -367 -253 -122 -186 -179
Gene 9 252 101 206 49 70 87 126
Gene 10 206 74 -215 31 252 193 -20
: -41 19 19 363 155 325 -115
Gene 20000 -831 -743 -1135 -934 -471 -631 -1003
Sample X
1 OR 0
-67
-93
84
25
-179
-323
-135
-127
-2
-66
208
-472
Training Set Test Sample
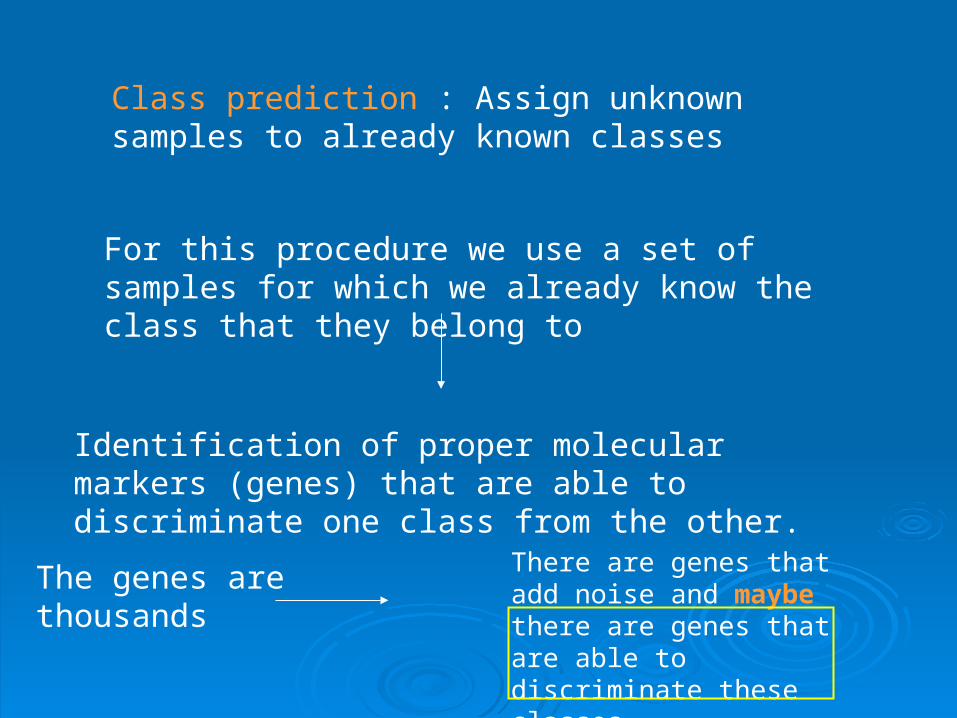
Class prediction : Assign unknown samples to already known classes
For this procedure we use a set of samples for which we already know the class that they belong to
Identification of proper molecular markers (genes) that are able to discriminate one class from the other.
The genes are thousands
There are genes that add noise and maybe there are genes that are able to discriminate these classes

How we discover these How we discover these interesting Genes ?interesting Genes ?

……Some DefinitionsSome Definitions A Training Dataset D, which has M samples and N genesA Training Dataset D, which has M samples and N genes Arbitrarily we assign the label 0, for the genes that belong Arbitrarily we assign the label 0, for the genes that belong
to the first class and the label 1 for the genes that belong to the first class and the label 1 for the genes that belong to the second classto the second class
If the DataSet has more than two classesIf the DataSet has more than two classes One Class vs All or One Class vs Another classOne Class vs All or One Class vs Another class
For each gene g there is a vector : Eg = ( eFor each gene g there is a vector : Eg = ( e11, e, e22, … , e, … , emm ) ) Construction of the labeling vector Vg = (vConstruction of the labeling vector Vg = (v11, v, v22, … , v, … , vmm)) Eg’ is the sorted vector of EgEg’ is the sorted vector of Eg Based on this vector we constructed the labeling vector Based on this vector we constructed the labeling vector
Vg.Vg.


RegionRegion representationrepresentation P P
R1R1 1, 1, 11, 1, 1 3/8 = 0,3783/8 = 0,378
R2R2 0, 0, 0, 0, 0, 0, 0, 0, 00, 0, 0, 0, 0, 0, 0, 0, 0 9/12 = 0,759/12 = 0,75
Eg = (10,25,53,78,96,122,154,198,221,256,318,455,487,503,556,601,621,647,733,785)
Vg = (1 1 1 0 0 1 0 1 1 1 1 0 0 0 0 0 0 0 0 0)
R1 R2
Paccepted = 0.7
Threshold value
Gene g is an informative gene, which belongs to Category I and it is a Class Zero Classifier

Informative GenesInformative Genes
Category I : There is an homogeneous Category I : There is an homogeneous region only in one sideregion only in one side
Category II : There is an homogeneous Category II : There is an homogeneous region in each side, but from opposite region in each side, but from opposite classesclasses
Category III : There is an homogeneous Category III : There is an homogeneous region in each side, from the same classregion in each side, from the same class

Class PredictionClass Prediction
Weighted VotingWeighted Voting
Class Zero ClassifierClass Zero Classifier : assignment of weight : assignment of weight WW00
Class One Classifier : Class One Classifier : WW11
WW00, W, W11 : inversely proportional to the number of vectors : inversely proportional to the number of vectors that there are in each Class Classifierthat there are in each Class Classifier
WW0 0 > 0> 0WW11 < 0 < 0
Class PredictionClass Prediction
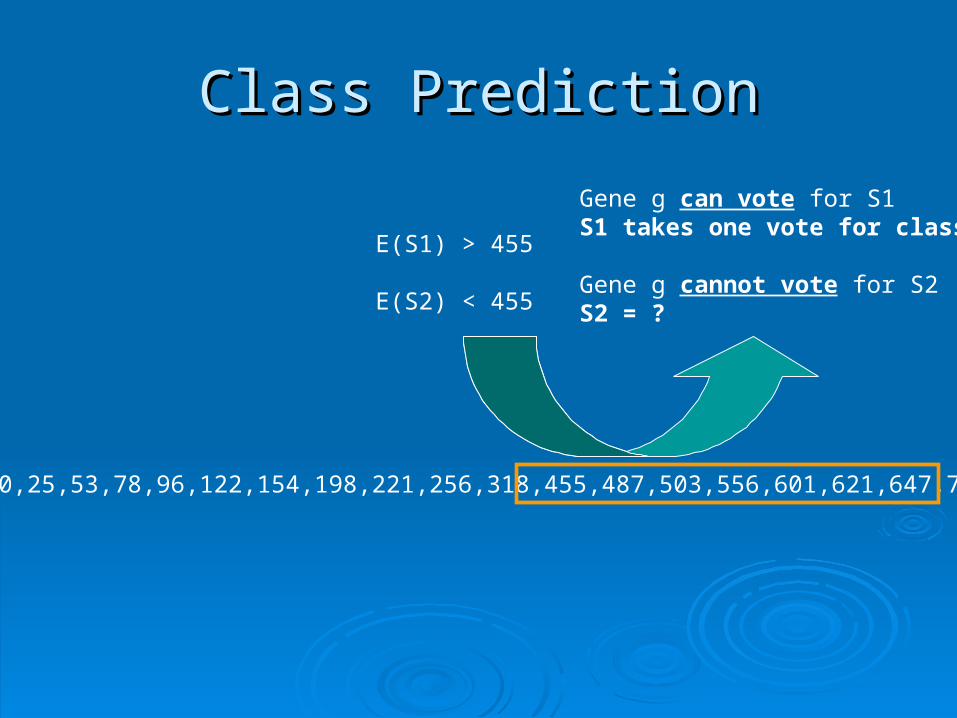
Eg = (10,25,53,78,96,122,154,198,221,256,318,455,487,503,556,601,621,647,733,785)
E(S1) > 455
E(S2) < 455
Gene g can vote for S1S1 takes one vote for class 0
Gene g cannot vote for S2S2 = ?

……for each Test Set Sample there are different for each Test Set Sample there are different informative genes that can predict its Classinformative genes that can predict its Class
If If (n : the number of informative genes for this sample)(n : the number of informative genes for this sample)
This sample belongs to Class ZeroThis sample belongs to Class Zero
If If
This sample belongs to Class OneThis sample belongs to Class One
1
0n
ii
W
…….So after these procedure, for all .So after these procedure, for all samples in the test set…samples in the test set…
1
0n
ii
W


How can we use the information that different samples are characterized from different informative genes ?

Distances between samplesDistances between samples
Two samples will be more relative than Two samples will be more relative than two others if they share a larger number of two others if they share a larger number of informative genes which assign them to informative genes which assign them to the same class.the same class.

Computation of distances between Computation of distances between samplessamples
0
0 0
( , )
( , ) ( , )
C i j
T i j C i j
( , )D i j 0 1
0 0 1 1
( , ) ( , )2 ( )
( , ) ( , ) ( , ) ( , )
C i j C i j
T i j C i j T i j C i j
are the measures of the similarity, between sample i, and sample j. 1
1 1
( , )
( , ) ( , )
C i j
T i j C i j
0 ( , )C i j 1( , )C i j is the number of the common informative genes that classify samples i, j in class 0 and 1, respectively.
0 ( , )T i j1( , )T i j is the number of the total informative genes that classify
samples i, j in class 0 and 1, respectively


Construction of a distance matrix, with Construction of a distance matrix, with pairwise distances between all samplespairwise distances between all samples
For the visualization of the results we used For the visualization of the results we used MEGA2 software, which constructs MEGA2 software, which constructs dendrograms. dendrograms.
UPGMA Tree (UPGMA Tree (Unweighted Pair Group Method using Arithmetic averages ))= Hierarchical Clustering= Hierarchical Clustering
Neighbor – Joining TreeNeighbor – Joining Tree

If we merge Training Set and Test Set, If we merge Training Set and Test Set, and create a new DataSet with all and create a new DataSet with all Samples….Samples….
We expect that the samples from the test set that, belong to a particular class, will be placed near or generally in the same group with the training set samples which belong to the same class


Detection of Subgroups of SamplesDetection of Subgroups of Samples
Using the method of Supervised Using the method of Supervised Clustering we described above, we were Clustering we described above, we were able to detect subgroups of samplesable to detect subgroups of samples
……from the training setfrom the training set ……and the test setand the test set

When we apply this algorithm to the Training Set, the Classification has no meaning, because it is according to the pre-existed labels
(This is a consequence of the selection of informative genes. The Regions are completely homogeneous, so, a priori the classification in the Training Set will be consistent with the labels).
…However we can use this method in order to detect Subgroups of Samples inside a certain Class.

The Neighbor – Joining Tree of LN DataSet (Training Set)

0.2
Neighbor-Joining Unrooted Tree of the Test Set From West et al.
On the right of purple lines is the ER+ class, and on the left the ER- Class
ind2 is misclassified.

Results from various datasets

Some problems of these methodsSome problems of these methods
In some datasets there are a few genes In some datasets there are a few genes with homogeneous regions with P value with homogeneous regions with P value larger than 0.7. The weighted voting larger than 0.7. The weighted voting method doesn’t work very well when the P method doesn’t work very well when the P value is lowvalue is low
There is a need for enough samples from There is a need for enough samples from both classes in the training set.both classes in the training set.

Detection of Groups of Genes that Detection of Groups of Genes that are able to classify a sampleare able to classify a sample
We tried to determine somehow, the We tried to determine somehow, the properties of a group of genes (pairs, properties of a group of genes (pairs, triplets…) that will be able to predict the triplets…) that will be able to predict the class of a sample. class of a sample.
We don’t consider as a “group”, the set of We don’t consider as a “group”, the set of “good” informative genes that are able to “good” informative genes that are able to classify a sample, with a high percentage classify a sample, with a high percentage of success... of success...

Instead of that we look for group of genes Instead of that we look for group of genes that individually aren’t so good class that individually aren’t so good class predictors. predictors.
……However they can predict the class However they can predict the class precisely when they form a group.precisely when they form a group.
So the prediction strength is a property of So the prediction strength is a property of the group, and not a property of the genes the group, and not a property of the genes that constitute this groupthat constitute this group

Detection of pairs of genes
Eg1 = (78,96,122,154,198,221,256,318,455,487,503,556,601,621,647,733,785)
Eg2 = (285,305,227,512,756,820,839,872,896,907,921,965,971,985,992,995)
Vg1 = (0 0 1 0 1 1 1 1 0 0 1 1 0 0 0 0 0)
Vg2 = (0 1 1 0 1 1 0 1 0 1 0 0 0 0 0 0)
Ig1 = ( 12, 16, 18, 13, 1, 20, 19, 6, 4, 15, 3, 8, 11, 10, 9, 14, 17)
Ig2 = (17, 16, 18, 14, 1, 20, 9, 6, 10, 15, 3, 8, 12, 13, 19, 4)
Paccepted > 0.5 (If P<0.5 then it is impossible to find a pair of genes)

This means that no one sample from class This means that no one sample from class Zero, can have simultaneously an Zero, can have simultaneously an expression value below (or above) expression value below (or above) threshold A for g1, and below (or above) threshold A for g1, and below (or above) threshold B for g2. threshold B for g2.
This is possible only for samples from This is possible only for samples from class One. class One.

The procedure of Class Prediction is The procedure of Class Prediction is similar to the procedure which was similar to the procedure which was described above for single genes. described above for single genes.
We do exactly the same for the detection We do exactly the same for the detection of triplets of genes. of triplets of genes. (P value > 0.333)(P value > 0.333)

Some advantages of this approach
We can utilize the samples from one Class for the construction of classifiers for the other Class. This is important when the number of samples in one class is small (example)
P value is lower in this case. So we detect more genes that potential can create pairs of genes.
It considers that the biological mechanisms are more complex. This might be closer to reality.

Thank you !!!!