group interim results - telkom.co.za
TRANSCRIPT

� SA SOC Ltd
Group InterimResultsfor the six months ended 30 September 2021

1
2
3
4
Overview of our business
Operational data
Financial performance
Reviewed condensed consolidated interim financial statements
Index
4
23
26
36
The United Nations Sustainable Development Goals
The following four Sustainable Development Goals (SDGs) were identified as presenting the most material opportunities for Telkom to enhance its positive impact and minimise its negative impact:
Throughout this report, the relevant SDG icon indicates where related information is discussed.
SDG 4 Quality education
SDG 8 Decent work and economic growth
SDG 9 Industry, innovation and infrastructure
SDG 12 Responsible consumption and production
Telkom SA SOC Ltd(Incorporated in the Republic of South Africa)Registration number 1991/005476/30
JSE share code: TKG JSE bond code: BITELISIN: ZAE000044897(Telkom, the Company, or the Group)
Telkom SA SOC Ltd is listed on the JSE Ltd. Information may be accessed on Reuters under the symbol TKGJ.J and on Bloomberg under the symbol TKG.SJ. Information contained on Reuters and Bloomberg is provided by a third party and is not incorporated by reference herein. Telkom has not approved or verified such information and does not accept any liability for the accuracy of such information.
Special note regarding forward-looking statements
Many statements in this document, and verbal statements that may be made by Telkom or by officers, directors or employees acting on Telkom’s behalf, constitute or are based on forward-looking statements.
All statements, other than statements of historical facts, including, among others, statements regarding our strategy; future financial position and plans; objectives; capital expenditure (capex); projected costs and anticipated cost savings and financing plans; and projected levels of growth in the communications market, are forward-looking statements. Forward-looking statements can generally be identified by terminology such as “may”, “will”, “should”, “expect”, “envisage”, “intend”, “plan”, “project”, “estimate”, “anticipate”, “believe”, “hope”, “can”, “is designed to” or similar phrases. However, the absence of such words does
not necessarily mean a statement is not forward looking. Forward-looking statements involve several known and unknown risks, uncertainties and other factors that could cause our actual results and outcomes to be materially different from historical results or from any future results expressed or implied by such forward-looking statements. Factors that could cause our actual results or outcomes to differ materially from our expectations include, but are not limited to, those risks identified in Telkom’s most recent integrated report, which is available at www.telkom.co.za/ir.
Telkom cautions readers not to place undue reliance on these forward-looking statements. All written and verbal forward-looking statements attributable to Telkom, or persons acting on Telkom’s behalf, are qualified in their entirety by these cautionary statements. Moreover, unless we are required by law to update these statements, we will not necessarily update any of these statements after the date of this document, so that they conform either to the actual results or to changes in our expectations.
Any forward-looking financial information disclosed in these Group interim results for the period ended 30 September 2021 (“results announcement”) has not been reviewed or audited or otherwise reported on by our external joint auditors.
www.telkom.co.za
1Telkom Group Interim Results 2021

Key indicators
Telkom's operating structure
¡ SA SOC Ltd represents ¡ Group (¡ or the Group), which comprises ¡ Company and its subsidiaries. ¡ Company comprises divisions, namely Openserve and ¡ Consumer. ¡ Group's subsidiaries are BCX and Gyro.
In the context of our operating model, business units comprise our divisions and subsidiaries.
Openserve is South Africa’s leading wholesale infrastructure connectivity provider with the largest open-access network across South Africa.
Gyro manages Telkom’s properties and masts and towers portfolio to optimise and unlock asset value.
BCX is a state-of-the-art technology company that provides information and communications technology (ICT) solutions and an integrated portfolio of technology solutions in South Africa.
Telkom Consumer is South Africa’s largest fixed broadband provider measured by network deployed, internet service provider and, together with its mobile network, a converged communications provider. Telkom Small and Medium Business (SMB) is included in this segment.
Operating revenueR million
MobileservicerevenueR million
FixedservicerevenueR million
InformationtechnologyrevenueR million
EBITDAR million
CapexR million
Free cash flowR million
BEPSCents per share
HEPSCents per share
Cash balance at the endof the periodR million
Net debtto EBITDAX times
21
29
2H
1 F
Y2
02
2
H1
FY
20
21
21
39
6
0.5%
8 8
47
H1
FY
20
22
H1
FY
20
21
8 2
82
6.8%
6 9
56
H1
FY
20
22
H1
FY
20
21
7 6
72
9.3%
2 6
80
H1
FY
20
22
H1
FY
20
21
2 9
09
7.9%
5 9
78
H1
FY
20
22
H1
FY
20
21
5 9
08
1.2%
3 6
10
H1
FY
20
22
H1
FY
20
21
2 9
42
22.7%
(83
9)
H1
FY
20
22
H1
FY
20
21
21
1
497.6%
27
6.8
H1
FY
20
22
H1
FY
20
21
21
7.5
27.3%
28
5.5
H1
FY
20
22
H1
FY
20
21
21
9.0
30.4%
3 3
88
H1
FY
20
22
H1
FY
20
21
5 0
02
32.3%
1.1
H1
FY
20
22
H1
FY
20
21
0.9
0.2x
Segment reporting
Segment reporting is provided on page 49 as part of the notes to the financial statements.
Results from operations
Group profitability continued to grow ahead of revenue, underpinned by our sustainable cost management, which seeks to ensure that cost to serve is optimised and operating expenditure (opex) growth is contained below inflation. Group profit after tax increased by 25.9% to R1 361 million (H1 FY2021: R1 081 million). This is mainly attributable to lower fair value movements, lower finance charges due to the ongoing settlement of maturing debt and currency volatility in the prior period. Headline earnings per share (HEPS) increased by 30.4% to 285.5 cents per share and basic earnings per share (BEPS) increased by 27.3% to 276.8 cents per share.
Division
Division
100% owned subsidiary
100% owned subsidiary
Including
PropertiesData Centres
32 � Group Interim Results 2021

Message from Group Chief Executive Officer
Sipho Maseko
� delivered strong earnings growth despite a challenging trading and economic environment. The first half of the year saw the economy struggle to recover from the consequences of COVID-19, which were compounded by the recent unrest in certain parts of South Africa. Group profitability continued to grow ahead of revenue, underpinned by our sustainable cost management, which seeks to ensure that cost to serve is optimised and operating expenditure (opex) growth is contained below inflation. � remains resolute in executing its strategic goals, with the Value Unlock programme on track. The masts and towers business listing on the JSE is on target for the fourth quarter of the financial year. The effective management transition is in place, with the appointment of the Group Chief Executive Officer (CEO) Designate and the new CEO of � Consumer. As the mobile business continues to grow, Telkom onboarded a second national roaming partner.
Operating environment
The pandemic continues to have an impact on lives, families and communities. Telkom has continued to prioritise the wellbeing of its employees. As the attention of the world moved to vaccines, we developed a proactive COVID-19 vaccination framework that supports an increased focus on mental and physical wellness and a need for greater resilience. Telkom supported the Business for South Africa initiatives to ensure access to vaccines for all South Africans. In July, we entered into an agreement with Dis-Chem that enabled us to prioritise vaccination for all employees who are eligible to get the COVID-19 vaccine, including up to five extended family members. We unveiled our hybrid work policy, which allows most employees to work remotely. We support government’s national COVID-19 vaccination programme aimed at achieving population immunity in South Africa and in the workplace.
The pandemic and subsequent lockdowns continue to impact the South African economy. Customers remain under severe financial pressure due to loss of jobs and reduced income. Small and medium enterprises (SMEs) are also under strain, with some SMEs being liquidated as they were the hardest hit by the pandemic. The competitive environment has intensified with increased competitive activities in the first half of the year.
Telkom announced its Group interim results for the six months ended 30 September 2021 on 9 November 2021 in Centurion, South Africa.
active customer base. This performance was delivered against a strong first half of the prior year, which saw a surge in data demand due to the pandemic.
Driving the growth of adjacent revenue streams and opportunities remains a strategic imperative which we are actively investing in. Included in Telkom Consumer revenue is content and financial services revenue of R388 million, which grew 23% year on year. This revenue is expected to continue to grow and will be a solid base from which to grow as we look to diversify revenue.
BCX was the hardest hit by the challenging environment, as it serves all the sectors of the economy. Revenue declined by 6.1% to R7 461 million. We continue to see sluggish investments by corporates as the country battles with the impact of the pandemic and the effects of restrictions on parts of the economy. The Information technology (IT) business remains under pressure due to the lingering impact of the lockdown and the global supply chain constraints and shortages of semiconductor chips.
Openserve continued to stabilise with its topline revenue slightly down by 1.8% to R6 720 million, supported by the fibre ecosystem, including fibre to the base stations and fibre to the business. From a fibre to the home (FTTH) perspective, the number of homes passed increased by 54.2% to 707 399, and the number of homes connected with fibre increased by 34.3% to 331 735. The 331 735 number of homes connected with fibre surpassed the number of homes connected with copper of 230 817.
Overview of our business 1
Performance overview
Notwithstanding the challenging operating and economic environment that persisted in the first half of the year, Telkom delivered strong earnings with HEPS and BEPS increasing by 30.4% and 27.3% respectively. This performance was boosted by our lower finance charges and fair value movements compared to the prior period as well as an increase in Group EBITDA. Group earnings before interest, taxation, depreciation and amortisation (EBITDA) grew by 1.2% despite flat revenue and an average Group-wide salary increase of 6% in April.
Telkom Consumer continued to be the driver of growth in the Group with revenue increasing by 2.1% to R12 960 million driven by the mobile business. This was partially offset by the decline in fixed-line business due to continued migration to next-generation technologies such as long-term evolution (LTE) and fibre, and ongoing pressure in the SME segment. Mobile service revenue grew by 6.8% to R8 847 million, supported by 18.8% year on year growth in active customers to 16.3 million. Mobile data revenuegrew by 6.1% to R6 374 million, supported by 10.3% growth in mobile broadband customers to 10.6 million, which represents 65.5% of our
54 � Group Interim Results 2021 Overview of our business

Message from Group Chief Executive Officer continued
Gyro masts and towers (Swiftnet) continued to commercialise its masts and towers business, with revenue increasing by 7.3% to R674 million, supported by an increase in the productive portfolio tenancy ratio from 1.52x in the prior period to 1.55x. The business is being prepared for listing on the JSE.
Telkom remains resolute in executing its strategic goals
The Value Unlock programme is on track, an effective management transition is in place and a roaming agreement with a second national roaming partner providing Telkom customers access to three networks was concluded.
A separate listing of the masts and towers business (Swiftnet)
Telkom is pursuing a separate listing of its masts and towers business (Swiftnet) on the JSE before the end of the financial year. Significant progress has been made, including, but not limited to, formal engagements with the JSE. Telkom believes that a separate listing of Swiftnet will affirm the valuation of the masts and towers business and its contribution to the overall valuation of the Telkom business, thereby unlocking further value for Telkom.
Effective management transition is in place
The appointment of the Group CEO Designate and CEO of Telkom Consumer effective 1 October 2021 will ensure continued execution of Group strategy. Serame Taukobong was appointed Group CEO Designate and will take over the role of Group CEO on 1 July 2022. His successor in Telkom Consumer, Lunga Siyo, was appointed CEO: Telkom Consumer.
Telkom adds MTN South Africa as a second national roaming partner
Telkom has entered into a roaming agreement with MTN South Africa. MTN South Africa is Telkom’s second roaming partner, effective 1 November 2021. The roaming agreement covers 2G, 3G and 4G, which will include seamless handover between Telkom and MTN networks. Telkom currently has a roaming agreement with Vodacom South Africa and has opted for two national roaming partners. Telkom's innovation in mobile network deployment has enabled flexibility to offer customers a better experience and optimise its existing roaming spend.
Sipho MasekoGroup CEO
The Group sustained its revenue performance
Group revenue was flat at R21 292 million, driven by the mobile business and the masts and towers business. Mobile revenue increased by 9.7% despite experiencing the COVID-19 bump in the prior period as a result of the stringent lockdown alert level that was implemented. The masts and towers business continued on its growth trajectory, with external revenue increasing by 4.6% as it commercialises its portfolio. The performance was offset by the IT business, which remains under pressure due to the challenging trading environment, and a decline in the fixed-line business as customers migrate to new technologies such as fibre and LTE. Although the fixed-line business declined by 9.5% in the period, we saw a significant slowdown in the rate of decline compared to the 18.2% reported in the prior period. The stability in the fixed-line business is attributable to a slowdown in fixed voice churn and an increase in usage, due to improved economic activity in the period compared to the prior period when South Africa was in lockdown level 5.
Solid EBITDA growth underpinned by sustainable cost management
Group EBITDA grew faster than revenue with an increase of 1.2% to R5 978 million and the EBITDA margin expanding by 0.5 ppts to 28.1%. This was underpinned by our effective sustainable cost management programme, which aims to contain opex growth below inflation and optimise cost to serve. Opex declined by 3.1% year on year despite an average Group-wide salary increase of 6%, which was effective from 1 April 2021. Mobile cost to serve was optimised despite the increase in certain costs associated with the post-paid market such as distribution channel costs following a year of lower distribution costs due to the impact of the strict lockdown. The cost to serve improvement was enabled by optimised roaming costs as we maintain stringent roaming traffic thresholds and migrate traffic to our network, supported by the ongoing network investment.
Financial capital
Financial information summary September
2021Rm
September 2020
RmVariance
%
Gross operating revenue 21 292 21 396 (0.5)EBITDA 5 978 5 908 1.2EBITDA margin (%) 28.1 27.6 0.5Capex 3 610 2 942 22.7Free cash flow (839) 211 (497.6)BEPS (cents) 276.8 217.5 27.3HEPS (cents) 285.5 219.0 30.4Net debt to EBITDA (times) 1.1 0.9 0.2Interim dividends (cents) – – –
76 � Group Interim Results 2021 Overview of our business
Capex
September 2021
Rm
September 2020
RmVariance
%
Fibre 1 010 254 297.6Mobile 1 453 1 397 4.0IT solutions 50 98 (49.0)Network rehabilitation/sustainment 58 213 (72.8)Service on demand 199 252 (21.0)Core network 411 443 (7.2)Digital platforms and innovation 26 8 225.0Properties (Gyro for Telkom) 26 (7) (471.4)Shared services 14 6 133.3
Telkom 3 247 2 664 21.9BCX 180 189 (4.8)Gyro 174 62 180.6Yep! 9 27 (66.7)
Total 3 610 2 942 22.7
Capex to revenue ratio (%) 17.0 13.8
Financial capital continued
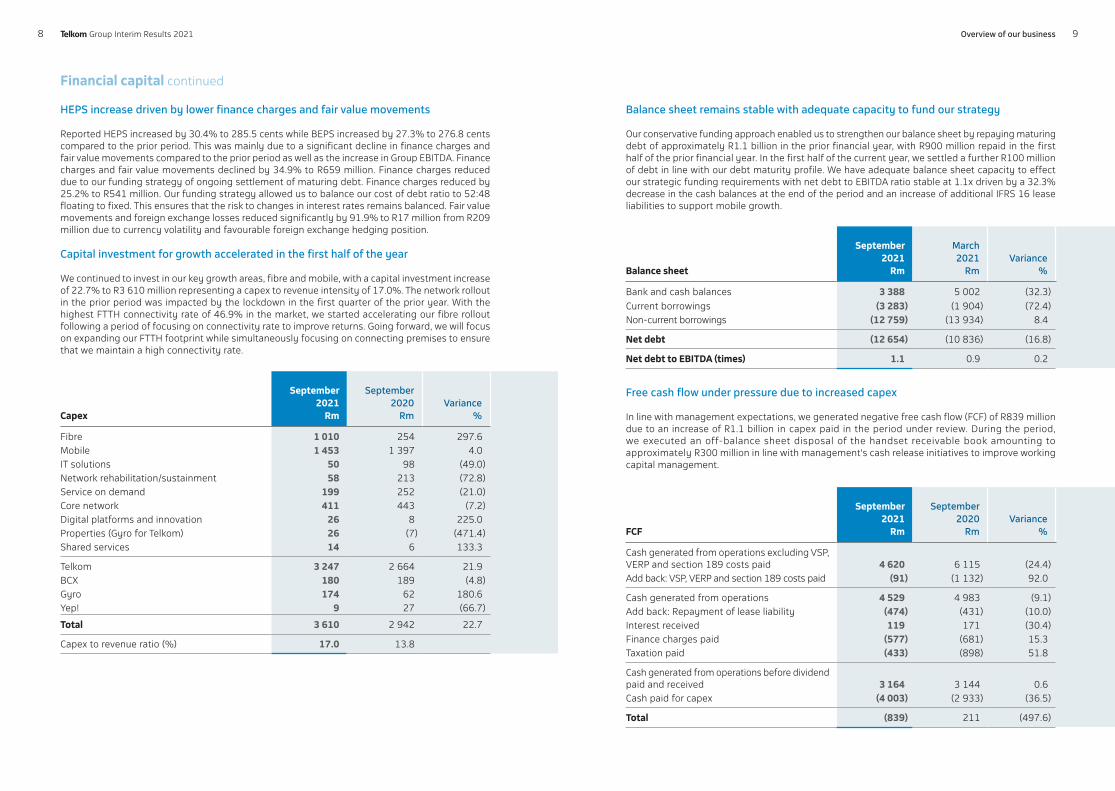
Balance sheet remains stable with adequate capacity to fund our strategy
Our conservative funding approach enabled us to strengthen our balance sheet by repaying maturing debt of approximately R1.1 billion in the prior financial year, with R900 million repaid in the first half of the prior financial year. In the first half of the current year, we settled a further R100 million of debt in line with our debt maturity profile. We have adequate balance sheet capacity to effect our strategic funding requirements with net debt to EBITDA ratio stable at 1.1x driven by a 32.3% decrease in the cash balances at the end of the period and an increase of additional IFRS 16 lease liabilities to support mobile growth.
Balance sheet
September 2021
Rm
March2021
RmVariance
%
Bank and cash balances 3 388 5 002 (32.3)Current borrowings (3 283) (1 904) (72.4)Non-current borrowings (12 759) (13 934) 8.4
Net debt (12 654) (10 836) (16.8)
Net debt to EBITDA (times) 1.1 0.9 0.2
Free cash flow under pressure due to increased capex
In line with management expectations, we generated negative free cash flow (FCF) of R839 million due to an increase of R1.1 billion in capex paid in the period under review. During the period, we executed an off-balance sheet disposal of the handset receivable book amounting to approximately R300 million in line with management's cash release initiatives to improve working capital management.
FCF
September 2021
Rm
September2020
RmVariance
%
Cash generated from operations excluding VSP, VERP and section 189 costs paid 4 620 6 115 (24.4)Add back: VSP, VERP and section 189 costs paid (91) (1 132) 92.0
Cash generated from operations 4 529 4 983 (9.1)Add back: Repayment of lease liability (474) (431) (10.0)Interest received 119 171 (30.4)Finance charges paid (577) (681) 15.3Taxation paid (433) (898) 51.8
Cash generated from operations before dividend paid and received 3 164 3 144 0.6Cash paid for capex (4 003) (2 933) (36.5)
Total (839) 211 (497.6)
HEPS increase driven by lower finance charges and fair value movements
Reported HEPS increased by 30.4% to 285.5 cents while BEPS increased by 27.3% to 276.8 cents compared to the prior period. This was mainly due to a significant decline in finance charges and fair value movements compared to the prior period as well as the increase in Group EBITDA. Finance charges and fair value movements declined by 34.9% to R659 million. Finance charges reduced due to our funding strategy of ongoing settlement of maturing debt. Finance charges reduced by 25.2% to R541 million. Our funding strategy allowed us to balance our cost of debt ratio to 52:48 floating to fixed. This ensures that the risk to changes in interest rates remains balanced. Fair value movements and foreign exchange losses reduced significantly by 91.9% to R17 million from R209 million due to currency volatility and favourable foreign exchange hedging position.
Capital investment for growth accelerated in the first half of the year
We continued to invest in our key growth areas, fibre and mobile, with a capital investment increase of 22.7% to R3 610 million representing a capex to revenue intensity of 17.0%. The network rollout in the prior period was impacted by the lockdown in the first quarter of the prior year. With the highest FTTH connectivity rate of 46.9% in the market, we started accelerating our fibre rollout following a period of focusing on connectivity rate to improve returns. Going forward, we will focus on expanding our FTTH footprint while simultaneously focusing on connecting premises to ensure that we maintain a high connectivity rate.
98 � Group Interim Results 2021 Overview of our business

Productive capital
Openserve continued to invest in the modernisation of its network in line with its strategic objectives. Despite the uncertain operating environment caused by the pandemic, our financial performance was largely resilient, underpinned by our network investment which led to growth in fibre and carrier services. Nevertheless, the impact of the pandemic is still evident in the challenging performance in the enterprise and small and medium businesses, with declining voice and data consumption. To improve our service delivery, we enhanced our customer engagements and accelerated digitisation in the period.
Performance overview
Revenue declined marginally by 1.8% to R6 720 million. This was supported by an increase of 10.8% in the provisioning of carrier services to the mobile operators, as there is demand from customers migrating to wireless technologies such as LTE. There was a decrease in legacy broadband revenue, mainly due to the decline in services with speeds below 10 Mbps.
Despite revenue being under pressure, EBITDA increased by 11.1% to R2 146 million and EBITDA margin expanded by a 3.7 ppts to 31.9%, underpinned by our cost management programme.
Scalable network
Openserve invested capex of R1 716 millionin modernising and expanding its network during the period. This enabled a flexible, modular and scalable network architecture that has ensured Openserve delivers high-speed and increased-capacity networks across South Africa. This is reflected through the increased fixed-data consumption of 11.9% across our network.
As we continue to invest in our robust infrastructure network, we aggressively improved our footprint in the first half of the year by increasing the number of homes passed with fibre by 54.2% to 707 399. Furthermore, we upgraded existing fibre nodes, allowing us to use our strategic network investments to provide the ability to connect additional premises to our fibre footprint.
During the July unrest mostly experienced in KwaZulu-Natal and Gauteng, our access network suffered multiple breaks; however, we did not lose any traffic on our core network due to our capability to use auto reroute restoration in case of fibre breaks in the network.
Commercialise the network
Demand for fibre connectivity in the home and high-capacity backhaul from the carrier continued to increase while enterprise market connectivity demand remains subdued.
During the period, we increased the number of homes connected with fibre by 34.3% to more than 331 700 homes connected to our network, with a connectivity rate of 46.9%, as the demand for fibre connectivity continues to increase. The greater adoption of next-generation high-speed broadband resulted in the continued migration of the low-speed digital subscriber line (DSL) customer base to wireless solutions for their minimal data consumption requirements. While this negatively impacted the DSL base, this decline was offset by the increased carrier backhaul provisioning growth of 12.8%, aligning to our drive to commercialise high-speed fixed broadband on our network while providing sufficient capacity to grow all other market segments.
In driving innovative solutions aimed at enabling multiple market segments on the same infrastructure, we launched UniConnect, a cost-efficient connectivity product focused on serving the connectivity requirements of enterprise customers. We further enhanced our broadband product portfolio with the introduction of the 500 Mbps product. The attractiveness of such value propositions enabled the activation of more than 428 300 services, which include broadband and other value-add services like voice over internet protocol, intercom and security.
Transform service delivery
Our digital and innovation team continues to improve the digitising of our applications, processes and customer experience interactions with the Openserve Connect App, putting self-service capability in the hands of the customer. Such platforms enable customers to manage their broadband network and track order and diagnostic requirements, thus driving our customer-centric model.
Our aggressive approach to deploy fibre across areas suffering from repetitive copper theft enabled us to improve our installation time of new-generation broadband by 14.4% with a concomitant improvement of 8.4% on our average time to repair. As the lockdown levels eased, in comparison to the prior period, our activities also increased with a focus on service delivery, resulting in an increase of 6.0% in our assurance visits compared to the same period as we endeavour to provide our customers with a connected service resulting in a marginal increase of 4.3% in kilometres travelled.
The effectiveness of the restoration capabilities contributed to the improvement of the core and aggregation availability index at 99.99% and 99.78% for the respective network layers.
Our fibre base broadband access shows an improvement to 99.96% availability during these exceptional times. These standards were recognised and subsequently resulted in an improved customer experience.
Productive capital
1110 � Group Interim Results 2021 Overview of our business

The performance in the first half of the year contends against a surge in data demand in the first half of the prior period due to the pandemic. Despite not witnessing the COVID-19 bump and increased competition, we continued to grow mobile service revenue, including mobile data revenue. However, retail channels are still in the process of rebuilding following the period of unrest in July and consumers remain under pressure. We continue to witness an ongoing change in consumer behaviour in the post-paid consumer market as customers seek to manage their spend. The pre-paid market continues to drive growth, and our digital and fintech revenue streams are gaining momentum.
Performance overview
The Consumer segment delivered a 2.1% increase in revenue to R12 960 million. This was stimulated by the mobile business. This was partially offset by the consumer fixed-line
business and SMB. The consumer business remains under pressure due to migration from traditional fixed voice to newer technologies such as LTE and fibre. The SMB business continues to be impacted by the liquidation of SMEs and pressure from ongoing lockdown restrictions.
From a mobile perspective, performance in the first half of the year was delivered against a strong first half of the prior year, which saw a surge in data demand due to the pandemic. Despite not witnessing the COVID-19 bump relating to the surge in data demand in the prior period, mobile service revenue from external customers grew by 6.8% to R8 847 million from a strong base.
The National Treasury contract was awarded in April 2021 and is gaining momentum. Over the past few months, we secured mobile deals with government, and we continue to pursue additional contracts in line with the prospect of an all-inclusive connectivity provisioning solution for hardware, software and accessories. We are continuously securing mobile contracts under this award, with most of the onboarding taking place in the second half of the financial year.
Accelerated Mobile growth
Telkom Mobile (Mobile) has entrenched its position as the third largest operator in an increasingly competitive market. The customer base grew by 18.8% to 16.3 million at a blended average revenue per user (ARPU) of R92. This growth was spurred on by the pre-paid customer base, which grew by 23.6% to 13.7 million at an ARPU of R67. Some of our post-paid customers continue to be impacted by financial pressure and elect for a pre-paid or hybrid model as a payment method to manage their spend. We remain prudent with our credit management approach and focus on our customer value management to preserve and grow the average revenue per post-paid customer. Despite the challenging environment, our post-paid customer base was relatively flat compared to the prior period at 2.6 million with post-paid ARPU of R217 increasing by 2.7%.
Mobile EBITDA margin was maintained at 28.8% in line with management guidance of 27% to 30%, benefiting from revenue growth and cost containment. Despite the increase in post-paid associated costs, we continued to demonstrate efficient Mobile growth, with the Mobile cost to serve ratio improving from 30.5% in the prior period to 28.4%. This was enabled by optimised roaming costs as we maintain stringent roaming traffic thresholds and migrate traffic to our network, supported by ongoing investment.
Drive high-speed broadband
We aim to entrench this product by extending our Mobile broadband offering to all market segments. This was further enhanced with the addition of an entry level product in the SmartBroadband pre-paid portfolio. The SmartBroadband Unlimited offerings boast a combination of value enhancements, pricing reductions and unique SmartHome bundles. In line with our data-led strategy, a new pre-paid plan was designed to encourage voice-oriented and cost-conscious customers to consume more data with Telkom. Consequently, we witnessed a 6.1% growth in mobile data revenue to R 6 374 million despite 0.6% growth in mobile data traffic demonstrating good monetisation of traffic. Mobile broadband subscriber base increased by 10.3% to 10.6 million representing 65.5% of our base that is using broadband.
In the fixed segment, we extended the DSL Pure Connect R199 and the fibre R399 promotions. To complement the fixed promotions, we also improved our fixed wireless access prices through revised LTE Unlimited and Business Hours packages.
Expand the mobile network
The comparative period was marked by an atypical surge in data demand mirrored in the current period, with our data traffic at 482 petabytes. Our mobile expansion programme was characterised by a R1 453 million investment, where our footprint was extended by 12.2% to 6 910 sites.
Capacity upgrades, underpinned by the deployment of additional carriers and temporary spectrum, and ongoing spectrum refarming resulted in the upgrade of more than 2 500 sites with temporary spectrum. We deployed the temporary spectrum released under the COVID-19 regulations, with data usage still holding at elevated levels established last year.
The ongoing high levels of theft and vandalism of equipment, with battery theft being the most prevalent, continue. The impact of this is amplified by the increasing instability of the national power grid. During the period, Telkom suffered over 1 300 incidents.
Drive digital and financial services revenue
We are investing in adjacent revenue streams to diversify away from connectivity revenue. To date, our performance includes non-connectivity revenue of R388 million, which increased by 23%. This revenue includes airtime lending, content, value-added services, gaming and financial services. We advanced R1 304 million in airtime lending (22% of total recharges) via ou r Airtime Advance platform to 3.8 million customers.
We continued to enhance the capabilities of the Telkom Digital Wallet. Users can now make a payment or transfer funds to any bank account in South Africa. Our popular Mo’Nice product can be purchased via the Digital Wallet. We expanded cash out points to include Cash Express ATMs. We took the strategic decision to broaden the channels available to users of the Digital Wallet and will deploy a Wallet App to add to the two existing channels, namely WhatsApp and Unstructured Supplementary Service Data. This suite of investment products will be launched in the second half of the year through the Wallet App, with the WhatsApp channel supporting some of the trading features.
Productive capital
1312 � Group Interim Results 2021 Overview of our business

Our performance remains under pressure. The period was marked by sluggish economic growth, financial uncertainties, global chip shortage, supply chain constraints and pressure resulting from the pandemic and resultant national lockdowns. In addition, the riots recently experienced in KwaZulu-Natal and parts of Gauteng added to the already constrained economy and negatively impacted enterprise customer spend.
Performance review
Revenue for the period declined by 6.1% to R7 461 million, mainly impacted by the IT segment, which continues to be under pressure while the converged communication business is starting to stabilise.
IT business revenue declined by 7.9% to R3 868 million, mainly attributable to delayed projects due to a slower than expected economic recovery, backlogs resulting from global supply chain constraints and shortages of chips, together with uncertainties resulting from the effects of the recent riots.
Converged communication revenue declined by 4.2% to R3 593 million, primarily owing to declines in data consumption, as employees continue to work from home, and hardware delivery backlogs as a result of the global chip shortage. However, performance was slightly cushioned by the tempering decline in fixed voice.
Despite cost management, which resulted in direct costs and opex declining by 13.1% and 3.5% respectively, EBITDA declined by 9.0% to R1 037 million, as the savings were not sufficient to offset the decline in revenue.
Drive organisational sustainability
BCX embarked on a transformation process over the past three years. The key objectives of this initiative were to integrate various entities to build one BCX, dispose of non-core assets, reduce the cost to serve and pivot to a customer-focused, industry-led organisation. We are at the tail-end of this initiative. In addition, BCX is also investing in systems and processes to strengthen the control environment.
The operating environment is changing. Traditional ICT products and services are commoditising rapidly. Our transformation initiatives have assisted us in addressing resultant challenges. These initiatives helped industrialise our operations and assisted in reducing our cost to serve, keeping our margins in line with our medium to long-term plans.
Enterprise customers are shifting their investments to digital transformation initiatives. We are responding to this by investing in new skills and capabilities. We increased our investment in next-generation ICT skills and leadership capability. We also focused our capex investments in modernising our industry-specific applications to meet new customer needs, and in new technologies like cloud, software-defined networks, data analytics, artificial intelligence and cybersecurity. This has enabled us to launch new products in line with customer requirements.
BCX continues to focus on providing end-to-end cloud and digital solutions, including infrastructure and security solutions. This is underpinned by our strong partnerships, secure scalable solutions and seamless integration with connectivity solutions over an extensive geographical footprint. The cloud platform solutions business has seen an increase in the consumption of digital workspace, cloud infrastructure and cybersecurity. This is attributable to the shift in businesses adopting a hybrid workplace model and the escalation of cyberattacks on enterprise businesses.
We also assisted in the rebuilding of technical infrastructure and the provisioning of hardware to our customers impacted by the July riots experienced mostly in KwaZulu-Natal and parts of Gauteng.
Productive capital
1514 � Group Interim Results 2021 Overview of our business

Productive capital
Gyro delivered solid performance in line with our strategic initiatives underpinned by Swiftnet’s improved tenancy and Tower Build programme. Swiftnet continues to secure strategic sites that are deemed attractive for network rollout for all mobile network operators and that drive the Inbuilding Coverage Solutions (IBS) programme. Gyro properties continue to explore development partnership opportunities with experienced property investors while ensuring that we support the transformation of the property sector through investment and development activity opportunities. There is continued monitoring of the impact of COVID-19 on our operations, ensuring minimal impact on service delivery.
Performance overview
Gyro revenue increased by 14.4% to R843 million, mainly driven by improved performance from the masts and towers business (Swiftnet). Total EBITDA for Gyro increased by 25.1% to R688 million.
Gyro properties
Commercialise the property portfolio
The property portfolio segmentation process advanced further, resulting in the refinement and allocation of core and non-core properties and advanced development planning to commercialise the portfolio. We also identified additional potential sites to increase our development pipeline.
The selected property development opportunities are in various stages of development planning, and many are nearing the investment decision and construction phase. We have made progress in engaging prospective investment partners and developers to consider investment partnerships in the various identified opportunities and we have also engaged with various financial institutions.
Our development projects are based on the best use of land approach as informed by the demand and supply dynamics of the particular market. We continue to review the planned development schemes and to adapt per site and with regard to relevant market conditions.
Enhance building costs and operational efficiencies
As part of our property cost optimisation programme, we continue to decommission assets to dispose those that are not suitable for re-purposing or no longer required for operational purposes and development. As at the end of the first half of the year, 13 properties valued at R5.8 million were transferred to new buyers while an additional 14 properties amounting to R10.1 million remain in the transfer process. We plan to dispose of an additional 45 properties during the remainder of the financial year.
Although lockdown restrictions eased during the first half of the financial year, we continued to work remotely, further contributing to the reduction in property operating costs. Progress has been made on the spatial analysis of the Telkom Group workforce and overlaying that with the real estate portfolio suited for office use. This process includes a COVID-19 compliance audit of the selected buildings and modifying access control and facilities management protocols. The process is expected to be finalised by the end of the financial year.
Swiftnet
Optimise and grow masts and towers portfolio
Masts and towers revenue increased by 7.3% to R674 million while EBITDA grew by 9.9% to R532 million, with the EBITDA margin expanding by 1.8 ppts to 78.9%. Our growth is underpinned by increasing tenancy in our current portfolio, build of new towers, rollout of new products and continuous preparation for 5G.
We remain resolute in the execution of our growth strategy on the masts and towers portfolio. Through our open-access model, we are a critical partner to all of our customers as they deliver connectivity services to their consumers. We have increased the productive portfolio tenancy ratio from 1.52x in the prior period to 1.55x. This was largely driven by additional take up and network modernisation.
We constructed new towers and in-building solutions at the end of the first half of the year. Our proactive permitting activity continues as we identify and secure strategic sites that we deem attractive for network rollout for all mobile network operators in support of their market expansion strategies. Our IBS programme is
well under way, with eight sites completed in the second quarter of the period, resulting in nine IBS sites in total in our portfolio. We have a pipeline of over 40 prominent sites nationally for the development of IBS. The construction thereof continues in earnest; however, we are engaging property owners and our mobile network operator clients to grow the pipeline to ensure continuous, steady state construction of new sites.
Our preparation for 5G is also picking up momentum, and we are in the final stages of negotiating with prominent property owners to provide access to thousands of sites for 5G rollout on an open-access basis to our mobile network operator clients.
Productive capital
1 Adjustment to tenancy ratio reported in HY1 FY2021 due to refinement of portfolio data. Adjustment from 1.32x to 1.52x
1716 � Group Interim Results 2021 Overview of our business

Telkom recognises that employee wellbeing is intrinsically connected to the Group’s wider sustainability strategy and purpose. Our future focus will be on ensuring our employee wellbeing strategy is aligned not only with good people governance but also with future sustainability and value creation.
Our focus remains on supporting Telkom employees during the pandemic. To this end, we developed a proactive COVID-19 vaccination framework that supports an increased focus on mental and physical wellness. We continue to provide counselling support and educate employees on how to take care of themselves physically and mentally while under lockdown and working from home.
Our governance of technology and information is based on the King IV Report on Corporate Governance™ for South Africa, 20161, Control Objectives for Information and Related Technology 2019 and ISO/IEC2 38 500. In complying with these, the Board assumes ultimate responsibility for policy and direction over matters pertaining to technology and information.
The IT governance structures are integrated with corporate governance to align IT governance objectives with corporate governance ambitions. The IT policies, standards and risks are revised regularly to align with the changing business and threat landscape. We continue to improve the maturity in line with regulatory requirements, leading practice guidelines and industry benchmarks.
Telkom, in partnership with Dis-Chem, embarked on a vaccination drive, which saw 1 299 Gauteng-based employees and their family members receive vaccines. Three sessions were held during July and August. The Group rolled out extensive internal communication campaigns to educate employees about the vaccines and their benefits to try and mitigate vaccine hesitancy and misinformation.
During the period, Telkom unveiled its hybrid work policy. The definition of workplace has evolved to include both company premises and employees’ residences, and thus enabled the creation of new ways of work that are flexible, encourage digital collaboration and productivity, and provide a safe working environment. A key element of this approach was the categorisation of each employee’s role to identify telecommuting employees so they could be equipped to successfully operate from home. Telecommuters are defined as employees whose work allows them to work primarily from home but may be required to present themselves for face-to-face engagements from time to time. Office-bound employees are those whose jobs are fully customer facing and/or cannot be done remotely.
A Telkom grant was made available for telecommuters to purchase, from an online mall, the home office equipment required for productive work. Employees can choose from desks, ergonomic chairs and a range of alternative power supply products.
The digitalisation of enterprises, necessitated by a remote workforce, presents an increase in cyberthreats. These threats are becoming more organised and are employing sophisticated methods designed to evade detection. In response to the ever-changing threat landscape, Telkom pursues a proactive and risk-based approach to cybersecurity. This is evidenced by the awarding of the ISO/IEC 27001:2013 certification for information security management, for the effectiveness and adequacy of our information security management programme. At the centre of our information security approach, is the ongoing training and awareness of our users.
Telkom continues to enable remote work during the pandemic through digital channels for customers and employees such as mobile apps and collaboration platforms. Analytics and business intelligence capabilities are being continuously enhanced to drive actionable insights.
1 Copyright and trademarks are owned by the Institute of Directors in South Africa NPC and all of its rights are reserved.
2 International Organization for Standardization and International Electrotechnical Commission.
Human capital Intellectual capital
¡ continued to prioritise the wellbeing of its employees. As the attention of the world moved to vaccines, we developed a proactive COVID-19 vaccination framework that supports an increased focus on mental and physical wellness and a need for greater resilience. ¡ also officially unveiled its hybrid work policy, which allows most employees to work remotely, reducing the need for office interaction. We remain committed to maintaining a safe working environment for our employees.
In a rapidly evolving telecommunications industry, technological transformation is required to alter how we provide value to customers. ¡ is focused on enabling multiple digital channels, leading to new value propositions and revenue streams as we continue to enable a digitalised workplace and streamlined processes.
1918 � Group Interim Results 2021 Overview of our business

The investment in science, mathematics and literacy will enable learners to access post schooling and future
economic opportunities. Telkom Foundation offers supplementary tuition in these subjects, coupled with psychosocial support, which includes counselling services to learners and their families and digital skills such as coding and robotics. During the pandemic, the Foundation introduced a blended learning approach, allowing learners to learn remotely and where possible face to face while adhering to COVID-19 protocols.
About 9 148 learners across the country are using the Telkom Lightbulb online education platform. The programme supports a total of 3 200 learners with its blended approach. The Telkom Foundation also enabled 3 687 learners with devices and connectivity covering grades 11 and 12. The high school digital skills programme is on year three supporting 300 learners towards a three-year certificated training programme, with an additional 105 learners in a one-year pilot training programme on design thinking and applied technologies. The Telkom Foundation has an allocation of R54.4 million for the current year and invested R28.7 million across education, digital skills and psychosocial support programmes.
FutureMakers directly supported 256 enterprises, which collectively had 731 direct and 26 543 indirect jobs. It
spent R7 million on incubation, connectivity and business support to small, medium and micro-enterprises (SMMEs).
In the f irst half of the year, Telkom procured R80 million from 33 Independent Field Technicians. This is an increase of R10 million from the prior period due to demand in homes for fibre connection. Currently, the BCX SMME Subcontractor programme has 164 ful ly registered SMME partners with an understanding of their core services and certifications. Since April 2021 to date, we have linked 10 enterpr ises with subcontract ing opportunities of R472 million on several ICT solutions required by end-users.
Our partnerships with WeThinkCode and EDSA have unlocked considerable value. At EDSA, 30 fully online students in provinces outside of the major metros coped remarkably well learning from home, with an average test score performance of 90.5% compared to 87% in the hybrid model. Students add value to the Telkom Group through annual business projects, 80% of which enable improved Telkom insights and customer experience, and 20% add value for corporate customers.
WeThinkCode achieved gender parity for the first time (50% female) for the current recruitment round, and 94% of the 2019 cohort that has just graduated (this is a two-year programme) are now employed full time. Gender parity is a major achievement, as attracting young women to a coding career has been challenging. The 2020 cohort has been hosted for internships in 38 businesses, 47% of which are SMMEs. This is testimony to the growth of tech start-ups, which are crucial engines of economic growth.
Social and relationship capital
¡ continues to future proof South Africa and our business through investing in the supply and demand of digital skills, enabling income-earning opportunities in the digital economy. Our partnerships with WeThinkCode and the Explore Data Science Academy (EDSA) have unlocked considerable value. ¡ Foundation continues to support learners to improve their performance in science, mathematics and literacy.
Natural capital
Telkom considers national and international regulatory and technical developments continuously and responds to these appropriately.
We have seen a 23% increase in our carbon emissions from Scope 1: 18 594.1 CO2e in the prior period to
22 587 CO2e in the period attributable to increased diesel usage during load shedding in the first half of the financial year and increased refrigerant gas usage to repair cooling plant equipment nearing end of life. Scope 2 emissions saw a 39% increase from 305 817 CO2e in the prior period to 500 914 CO2e in the period attributable to electricity rebilling from the municipalities for the previous financial year and improved accuracy in electricity consumption calculation methodology.
Telkom continues to monitor and track water consumption on high-consumption sites by installing smart water metres for optimal monitoring. The rolling out of low-flow regulators on taps across high-water-consuming sites is in progress. With 80% of our employees still working from home, our water consumption reduced by 6% from 519 929 kl to 484 141 kl.
Telkom appointed an external energy advisor to provide advice on energy and water saving initiatives with a view to developing a holistic water and energy management strategy and road map. A 10-year energy and water management strategy was developed (journey to net zero carbon and water use). The key strategic driver of the strategy is to improve water and energy efficiency. In addition, the strategy also intends to enhance the benefits of going green as part of Telkom’s adopted environmental SDGs. This will be achieved through investing in renewable energy that will reduce dependency on the grid and improve our carbon emissions. The solar photovoltaic expansion project within Telkom will further assist in utilising renewable energy, thus reducing our Scope 2 emissions and reducing environmental damage attributable to Telkom operations.
Other initiatives aimed at optimising property operating costs are progressing well with various interventions implemented to minimise costs. These include electricity accounts being updated with new tariffs for high-consuming sites and the implementation of technical initiatives that impact the capex programme under way by the end of the financial year. These initiatives include light-emitting diode lighting, power factor correction and solar photovoltaic technology for various high-consuming sites. Audits are also under way at radio access network sites for identification of initiatives to further reduce costs.
Environmental risks are identified, quantified and captured in the environmental aspect and impact register. Environmental controls are in place to mitigate environmental impacts, and environmental management procedures are in place to monitor and manage environmental aspects. The most significant environmental impacts of our operations are e-waste, energy use and the related carbon emissions in our network.
2120 � Group Interim Results 2021 Overview of our business
Outlook statement
Given the challenges in the first half of the year, management will focus on growing the topline revenue and profitability in the second half of the year. Discipline in capital expenditure will continue to be exercised and we will focus on initiatives to improve cash generated from operations. Management expects FCF to normalise in the second half of the year and return to positive territory similar to the past two years. As the growth in the mobile business normalises and the fixed-line business is starting to stabilise following periods of decline subsequent to execution of a migration strategy, management will now focus on its IT business which has been under pressure due to various reasons. To this end, the Board is investigating a strategic intervention in the business which could include but not limited to introducing a strategic partnership in the business. This is aimed at addressing capacity and capabilities in BCX and ensure sustainable growth going forward.
The Board remains committed to the value unlock strategy, which is premised on Telkom’s market capitalisation not representing its intrinsic value. Telkom has different classes of infrastructure assets such as data centres, a wholesale network business and masts and tower
business, which are globally valued at higher multiples for separate individual businesses than telecommunications. Telkom has made progress in consolidating the data centres into Gyro, with the intention of building a carrier neutral data centre infrastructure business, while the legal separation of Openserve is on track. Significant progress has been made in respect of a separate listing of its masts and towers business (Swiftnet), including, but not limited to, formal engagements with the JSE. The listing is expected to be concluded before the end of the financial year subject to market and other conditions. The Board believes that a separate listing of Swiftnet will affirm the valuation of the masts and towers business and its contribution to the overall valuation of Telkom. The proceeds of the value unlock are expected to rebase the balance sheet and/or reinvest in the business and/or shareholder rewards.
Returning cash to shareholders remains a key element of our capital allocation framework. The Board remains committed to reinstate the dividend policy by the end of the current financial year. Given the advanced stage of the separate listing of Swiftnet which is expected to be concluded by end of the financial year and the management transition, the Board will be better placed to take a holistic view of the capital allocation and make an announcement on the dividend policy at the end of the financial year. The Board will deliberate on the dividend declaration at that stage.
Operationaldata 2
23Operational data22 � Group Interim Results 2021

Operational data
Subscribers
September 2021
Rm
September 2020
RmVariance
%
Broadband subscribersFixed broadband subscribers1 562 552 637 884 (11.8)Mobile broadband subscribers 10 642 005 9 643 969 10.3
Fixed subscribersCloser subscribers 239 313 343 738 (30.4)Internet all-access subscribers2 317 337 362 700 (12.5)Fixed access lines (’000)3 1 118 1 432 (21.9)Revenue per fixed access line (rand) 2 400 2 199 9.1Fixed voice ARPU 315.31 342.08 (7.8)Fixed broadband ARPU 272.21 242.38 12.3Managed data network sites 37 067 36 412 1.8
Mobile subscribersActive mobile subscribers4 16 258 857 13 686 689 18.8
Pre-paid 13 696 236 11 077 104 23.6Post-paid 2 562 621 2 609 585 (1.8)
ARPU (rand) 92.40 112.55 (17.9)Pre-paid 67.21 83.55 (19.6)Post-paid 216.84 211.19 2.7
¹ Includes x DSL and FTTH lines of which 2 619 (H1 FY2021: 3 761) are internal lines.
² Includes � internet asymmetrical DSL, integrated services digital network (ISDN) and WiMAX subscribers.
³ Includes copper voice and broadband, ISDN and fixed look-a-like. Excludes � internal lines.
4 Based on a subscriber who participated in a revenue-generating activity within the last 90 days.
Subscribers
September 2021
Rm
September 2020
RmVariance
%
VolumesFixed broadband (petabytes) 809 723 11.9Mobile broadband (petabytes) 482 479 0.6Total fixed-line traffic (millions of minutes) 3 158 3 352 (5.8)
Network
Ports activated via MSAN access 1 443 846 1 477 259 (2.3)Fibre to the home 707 399 458 791 54.2Fibre to the cabinet 2 084 932 2 411 661 (13.5)Fibre homes passed and connected 331 735 247 019 34.3Enterprise business services 39 758 40 113 (0.9)Carrier services 18 794 16 657 12.8Fibre to base station connections 8 560 8 175 4.7Mobile sites integrated 6 910 6 159 12.2Active fibre connectivity rate (%) 46.9 53.8 (6.9)
Group employees 11 853 12 677 (6.5)
Telkom Company employees 7 074 7 234 (2.2)Consumer 936 907 3.2Openserve 5 619 5 878 (4.4)Corporate Centre 322 335 (3.9)SMB (known as Yep!) 197 114 72.8
BCX group employees 4 585 5 232 (12.4)Yellow Pages employees 95 112 (15.2)Gyro employees 99 99 –
24 25Operational data� Group Interim Results 2021
27Financial performance26 � Group Interim Results 2021
Financialperformance 3

Masts and towers statement of profit and loss
September 2021
Rm
September 2020
Rm
September 2019
Rm
Operating revenue 674 628 583Operating expenses 142 144 202Other operating expenses 107 101 162Impairment of receivables and contract assets – 15 12Service fees 34 23 15Operating leases 1 5 13
EBITDA 532 484 381
This has been extracted from the financial information underpinning the reviewed financial information.
Financial performance
Operating revenueSeptember
2021Rm
September2020
RmVariance
%
Fixed 7 701 8 513 (9.5)
Voice and subscriptions 2 684 3 149 (14.8)
Usage 1 069 1 088 (1.8)Subscriptions 1 615 2 061 (21.6)
Interconnection 166 199 (16.6)
Fixed-line domestic 91 106 (14.2)Fixed-line international 75 93 (19.4)
Data 4 106 4 324 (5.0)
Data connectivity 2 996 3 032 (1.2)Internet access and related services 754 800 (5.8)Managed data network services 360 475 (24.2)Multimedia services (4) 17 (123.5)
Customer premises equipment sales and rentals 635 709 (10.4)
Sales 281 276 1.8Rentals 354 433 (18.2)
Other revenue 110 132 (16.7)
Mobile 10 366 9 453 9.7
Mobile voice and subscriptions 2 236 2 021 10.6Mobile interconnection 237 251 (5.6)Mobile data 6 374 6 010 6.1Mobile handset and equipment sales 1 396 1 043 33.8Significant financing component revenue 123 128 (3.9)
Information technology 2 680 2 909 (7.9)
IT service solutions 1 594 1 556 2.4Application solutions 485 621 (21.9)IT hardware and software 539 654 (17.6)Industrial technologies 50 64 (21.9)Significant financing component revenue 12 15 (20.0)
Other 545 521 4.6
Trudon 171 165 3.6Gyro 374 356 5.1
Total 21 292 21 396 (0.5)
Mobile statement of profit and loss
September 2021
Rm
September 2020
Rm
September 2019
Rm
Operating revenue 10 659 9 708 7 169Payments to other operators 1 393 1 507 1 220Cost of handsets, equipment and directories 1 456 1 091 1 685Sales commission, incentive and logistical costs 1 117 1 016 816Other income 112 81 69Operating expenses 3 739 3 275 2 319Employee expenses 215 204 120Selling, general and administrative 3 328 2 788 1 972Service fees 244 221 158Operating leases (48) 62 69
EBITDA 3 066 2 900 1 198
This has been extracted from the financial information underpinning the reviewed financial information.
28 29Financial performance� Group Interim Results 2021
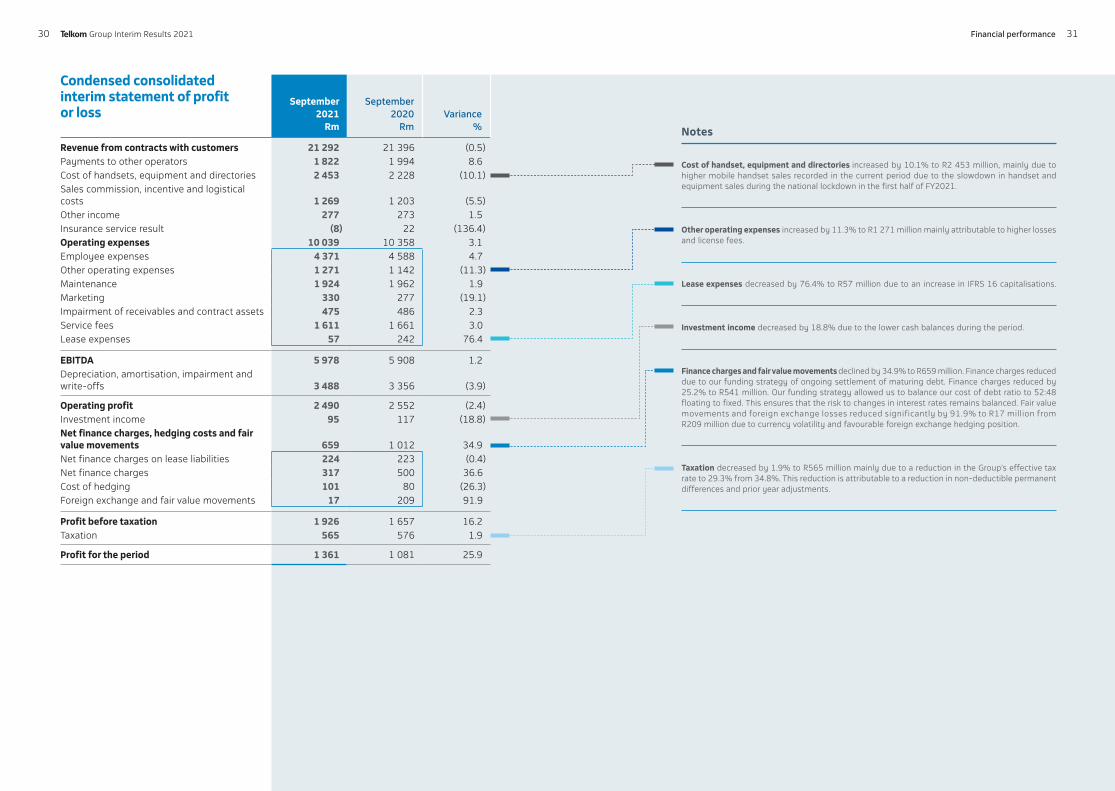
Condensed consolidated interim statement of profit or loss
September 2021
Rm
September 2020
RmVariance
%
Revenue from contracts with customers 21 292 21 396 (0.5)Payments to other operators 1 822 1 994 8.6Cost of handsets, equipment and directories 2 453 2 228 (10.1)Sales commission, incentive and logistical costs 1 269 1 203 (5.5)Other income 277 273 1.5Insurance service result (8) 22 (136.4)Operating expenses 10 039 10 358 3.1Employee expenses 4 371 4 588 4.7Other operating expenses 1 271 1 142 (11.3)Maintenance 1 924 1 962 1.9Marketing 330 277 (19.1)Impairment of receivables and contract assets 475 486 2.3Service fees 1 611 1 661 3.0Lease expenses 57 242 76.4
EBITDA 5 978 5 908 1.2Depreciation, amortisation, impairment and write-offs 3 488 3 356 (3.9)
Operating profit 2 490 2 552 (2.4)Investment income 95 117 (18.8)Net finance charges, hedging costs and fair value movements 659 1 012 34.9Net finance charges on lease liabilities 224 223 (0.4)Net finance charges 317 500 36.6Cost of hedging 101 80 (26.3)Foreign exchange and fair value movements 17 209 91.9
Profit before taxation 1 926 1 657 16.2Taxation 565 576 1.9
Profit for the period 1 361 1 081 25.9
Notes
Cost of handset, equipment and directories increased by 10.1% to R2 453 million, mainly due to higher mobile handset sales recorded in the current period due to the slowdown in handset and equipment sales during the national lockdown in the first half of FY2021.
Other operating expenses increased by 11.3% to R1 271 million mainly attributable to higher losses and license fees.
Lease expenses decreased by 76.4% to R57 million due to an increase in IFRS 16 capitalisations.
Investment income decreased by 18.8% due to the lower cash balances during the period.
Finance charges and fair value movements declined by 34.9% to R659 million. Finance charges reduceddue to our funding strategy of ongoing settlement of maturing debt. Finance charges reduced by 25.2% to R541 million. Our funding strategy allowed us to balance our cost of debt ratio to 52:48 floating to fixed. This ensures that the risk to changes in interest rates remains balanced. Fair value movements and foreign exchange losses reduced significantly by 91.9% to R17 million from R209 million due to currency volatility and favourable foreign exchange hedging position.
Taxation decreased by 1.9% to R565 million mainly due to a reduction in the Group’s effective tax rate to 29.3% from 34.8%. This reduction is attributable to a reduction in non-deductible permanent differences and prior year adjustments.
30 31Financial performance� Group Interim Results 2021

Condensed consolidated interim statement of financial position
September 2021
Rm
March 2021
RmVariance
%
AssetsNon-current assets 48 951 47 901 2.2Property, plant and equipment 37 119 36 271 2.3Right-of-use assets 4 783 4 519 5.8Intangible assets 4 463 4 605 (3.1)Other investments 139 115 20.9Employee benefits 1 404 1 317 6.6Other financial assets 81 81 –Finance lease receivables 219 270 (18.9)Deferred taxation 743 723 2.8Current assets 14 442 15 930 (9.3)Inventories 1 193 1 026 16.3Income tax receivable 111 91 22.0Finance lease receivables 215 228 (5.7)Trade and other receivables 7 007 7 227 (3.0)Contract asset 1 834 1 747 5.0Other current assets 469 459 2.2Current portion of other financial assets 173 88 96.6Investment in insurance cell captive 50 61 (18.0)Cash and cash equivalents 3 390 5 003 (32.2)Asset of disposal group classified as held for sale – –
Total assets 63 393 63 831 (0.7)
Equity and liabilitiesEquity attributable to owners of the parent 32 634 31 366 4.0Share capital 5 050 5 050 –Share-based compensation reserve 1 142 1 036 10.2Non-distributable reserves 975 1 361 (28.4)Retained earnings 25 467 23 919 6.5Non-controlling interest (27) (25) 8.0
Total equity 32 607 31 341 4.0
Non-current liabilities 13 875 15 121 (8.2)Interest-bearing debt 8 464 10 173 (16.8)Lease liability 4 295 3 761 14.2Provisions 381 619 (38.4)Other financial liabilities 86 107 (19.6)Deferred revenue 195 235 (17.0)Deferred taxation 454 226 100.9Current liabilities 16 911 17 369 (2.6)Trade and other payables 10 464 11 493 (8.9)Shareholders for dividend 31 31 –Interest-bearing debt 2 411 693 247.9Lease liabilities 872 1 211 (28.0)Provisions 952 1 613 (41.0)Deferred revenue 1 621 1 696 (4.4)Income tax payable 24 9 166.7Other financial liabilities 534 622 (14.1)Credit facilities utilised 2 1 100.0
Total liabilities 30 786 32 490 (5.2)
Total equity and liabilities 63 393 63 831 (0.7)
Notes
Financial assets and liabilities increased by 50.3% to R254 million and decreased by 15.0% to R620 million, respectively, attributable to the South African rand appreciation against foreign currencies. This resulted in losses in the fair value of forward exchange contracts and corresponding gains in the firm commitments. The losses in the interest rate swaps are due to the deterioration of the South African economy and the impact of the lower interest rate environment. The Group pays the fixed interest leg of the swap and receives the floating interest leg. The current fixed rates are higher than the floating rate. The interest rate swaps are used to hedge the debt, which is predominately floating rate debt.
Provisions decreased by 40.2% to R1 334 million due to the settlement of the FY2021 employee performance recognition provision in the current financial year.
The decrease in the deferred tax asset is attributable to the deferred tax movement in other comprehensive income and the deferred tax movement due to the reversal of timing differences, set off by the increase in tax losses recognised in profit or loss.
32 33Financial performance� Group Interim Results 2021

Condensed consolidated interim statement of cash flows September
2021Rm
RestatedSeptember
2020Rm
Variance%
Cash flows from operating activities 3 598 3 412 5.5Cash receipts from customers 21 229 21 249 (0.1)Cash paid to suppliers and employees (16 700) (16 266) 2.7
Cash generated from operations 4 529 4 983 (9.1)Interest received 119 171 (30.4)Dividend received 22 – 100.0Finance charges paid (577) (681) 15.3Taxation paid (433) (898) 51.8Repayment of derivatives (67) (7) (857.1)Proceeds from derivatives 7 101 93.1
Cash generated from operations before dividend paid 3 600 3 669 (1.9)Dividend paid (2) (257) (99.2)Cash flows from investing activities (4 193) (2 612) (60.5)Proceeds on disposal of property, plant and equipment and intangible assets 10 19 (47.4)Additions to assets for capital expansion (4 003) (2 933) (36.5)Repayment of derivatives (200) (22) (809.1)Proceeds from derivatives 22 335 93.4Investments made by FutureMakers (22) (11) (100.0)Cash flows from financing activities (1 019) (1 621) (37.1)Loans repaid (100) (900) 88.9Purchase of shares for the Telkom share plan and subsidiaries' long-term incentive share scheme (393) (285) (37.9)Repayment of lease liability (474) (431) (10.0)Repayment of derivatives (69) (43) (60.5)Proceeds from settlements of derivatives 17 38 (55.3)
Net decrease in cash and cash equivalents (1 614) (821) (96.6)Net cash and cash equivalents at the beginning of the period 5 002 4 726 5.8
Net cash and cash equivalents at the end of the period 3 388 3 905 (13.2)
Notes
Cash generated from operations decreased by 9.1%, mainly due to an increase in the repayment of trade payables and inventory increases.
Interest received decreased by 30.4% driven by lower cash balances.
Finance charges paid decreased by 15.3% in line with the 25.2% decrease in finance charges expense due to lower debt levels and interest rates.
Taxation paid decreased by 51.8% primarily due to the payment of settlements in respect of prior period tax disputes to the South African Revenue Service.
Additions to assets for capital expansion increased by 36.5% driven by accelerated build programmes since Q4 FY2021 to support our strategic growth programmes as well as the slowdown in capex in the prior period as a result of the impact of the national lockdown.
34 35Financial performance� Group Interim Results 2021

Board approval
These condensed consolidated interim financial statements were authorised for issue on 5 November 2021 by the Telkom SA SOC Ltd Board of Directors and published on 9 November 2021.
Directors’ responsibility and audit report
The Directors of the Company take full responsibility for the preparation of the condensed consolidated interim financial statements. The condensed consolidated interim financial statements have been reviewed by our independent joint auditors PricewaterhouseCoopers Inc. and SizweNtsalubaGobodo Grant Thornton Inc.
Preparer and supervisor of the condensed consolidated interim financial statements
These condensed consolidated interim financial statements were prepared by the Telkom finance staff under the supervision of the Group Chief Financial Officer, Dirk Reyneke CA(SA).
Group interim resultsReviewed six months ended 30 September 2021
4Independent auditors’ review report on the condensed consolidated interim financial statements
38
Condensed consolidated interim statement of profit or loss and other comprehensive income
40
Condensed consolidated interim statement of financial position 42
Condensed consolidated interim statement of changes in equity 44
Condensed consolidated interim statement of cash flows 45
Notes to the condensed consolidated interim financial statements 46
1. Independent review 46
2. Corporate information 46
3. Basis of preparation, significant accounting judgements, estimates, assumptions and significant accounting policies
46
4. Significant changes in the current reporting period 48
5. Segment information 49
6. Expenses 55
7. Earnings and dividend per share 56
8. Capital additions and disposals 58
9. Other financial assets and liabilities 58
10. Employee benefits 60
11. Inventories 62
12. Net cash and cash equivalents 63
13. Taxation and deferred taxation 64
14. Fair value measurement 66
15. Interest-bearing debt 69
16. Provisions 70
17. Commitments 71
18. Trade and other receivables and contract assets 71
19. Other current assets 73
20. Contingencies 74
21. Related parties 75
22. Reconciliation of profit before tax to cash generated from operations 77
23. Significant events and transactions 78
24. Events after the reporting date 78
Abbreviations 79
3736 � Group Interim Results 2021 Reviewed condensed consolidated interim financial statements

To the Shareholders of � SA SOC Limited
We have reviewed the condensed consolidated interim financial statements of Telkom SA SOC Limited, contained in the accompanying interim report, which comprise the condensed consolidated interim statement of financial position as at 30 September 2021 and the related condensed consolidated interim statement of profit or loss and other comprehensive income, changes in equity and cash flows for the six-months then ended, and the notes, comprising a summary of significant accounting policies and other explanatory information.
Auditor’s Responsibility
Our responsibility is to express a conclusion on these interim financial statements. We conducted our review in accordance with International Standard on Review Engagements 2410, Review of Interim Financial Information Performed by the Independent Auditor of the Entity. ISRE 2410 requires us to conclude whether anything has come to our attention that causes us to believe that the interim financial statements are not prepared in all material respects in accordance with the applicable financial reporting framework. This standard also requires us to comply with relevant ethical requirements.
A review of interim financial statements in accordance with ISRE 2410 is a limited assurance engagement. We perform procedures, primarily consisting of making inquiries of management and others within the entity, as appropriate, and applying analytical procedures, and evaluate the evidence obtained.
Independent auditors’ review report on the condensed consolidated interim financial statements for the six months ended 30 September 2021
The procedures performed in a review are substantially less than and differ in nature from those performed in an audit conducted in accordance with International Standards on Auditing. Accordingly, we do not express an audit opinion on these interim financial statements.
Conclusion
Based on our review, nothing has come to our attention that causes us to believe that the accompanying condensed consolidated interim financial statements of Telkom SA SOC Limited for the six months ended 30 September 2021 are not prepared, in all material respects, in accordance with the International Financial Reporting Standard, (IAS) 34 Interim Financial Reporting, the SAICA Financial Reporting Guides as issued by the Accounting Practices Committee and Financial Pronouncements as issued by the Financial Reporting Standards Council and the requirements of the Companies Act of South Africa.
PricewaterhouseCoopers Inc., 4 Lisbon Lane, Waterfall City, Jukskei View, 2090Private Bag X36, Sunninghill, 2157, South Africa
T: +27 (0) 11 797 4000, F: +27 (0) 11 209 5800, www.pwc.co.za
Chief Executive Officer: L S Machaba
The Company's principal place of business is at 4 Lisbon Lane, Waterfall City, Jukskei View, where a list of directors' names is available for inspection.
Reg. no. 1998/012055/21, VAT reg.no. 4950174682.
SizweNtsalubaGobodo Grant Thornton Inc., 20 Morris Street East, Woodmead, 2191, PO Box 2939, Saxonwold, 2132
T: +27 (11) 231 0600, F: +27 (11) 234 0933,[email protected]
Victor Sekese (Chief Executive).
A comprehensive list of all Directors is available at the Company offices or registered office. SizweNtsalubaGobodo Incorporated.
Registration Number: M2005/034639/21
Directors’ Responsibility for the Interim Financial Statements
The directors are responsible for the preparation and fair presentation of these interim financial statements in accordance with International Financial Reporting Standard, (IAS) 34 Interim Financial Reporting, the SAICA Financial Reporting Guides as issued by the Accounting Practices Committee and Financial Pronouncements as issued by the Financial Reporting Standards Council and the requirements of the Companies Act of South Africa, and for such internal control as the directors determine is necessary to enable the preparation of interim financial statements that are free from material misstatement, whether due to fraud or error.
SizweNtsalubaGobodo Grant Thornton Inc.Director: GM HafizRegistered AuditorJohannesburg
05 November 2021
PricewaterhouseCoopers Inc.Director: KJ DikanaRegistered AuditorJohannesburg
05 November 2021
3938 � Group Interim Results 2021 Reviewed condensed consolidated interim financial statements

Condensed consolidated interim statement of profit or loss and other comprehensive incomefor the period ended 30 September 2021
Notes
Reviewedsix months
ended30 September
2021 Rm
Reviewed six months
ended 30 September
2020 Rm
Revenue 5 21 292 21 396 Operating revenue 21 157 21 254 Interest revenue 135 142
Other income 277 273 Insurance service result (8) 22 Payments to other operators 6.1 (1 822) (1 994)Cost of handsets, equipment, software and directories 6.2 (2 453) (2 228)Sales commission, incentives and logistical costs 6.3 (1 269) (1 203)Employee expenses 6.4 (4 371) (4 588)Other expenses 6.5 (1 271) (1 142)Maintenance (1 924) (1 962)Marketing (330) (277)Impairment of receivables and contract assets (475) (486)Service fees (1 611) (1 661)Lease-related expenses 6.6 (57) (242)
EBITDA 5 978 5 908 Depreciation of property, plant and equipment (2 406) (2 500)Depreciation of right-of-use assets (584) (466)Amortisation of intangible assets (423) (371)Write-offs, impairments and losses of property, plant and equipment and intangible assets (75) (19)
Operating profit 2 490 2 552 Investment income 95 117 Net finance charges, hedging costs and fair value movements1 (659) (1 012)
Finance charges on lease liabilities (224) (223)Net finance charges – other (317) (500)Cost of hedging (101) (80)Foreign exchange and fair value movement (17) (209)
Profit before taxation 1 926 1 657 Taxation 13.1 (565) (576)
Profit for the period 1 361 1 081
Notes
Reviewedsix months
ended30 September
2021Rm
Reviewed six months
ended 30 September
2020 Rm
Other comprehensive incomeItems that will be reclassified subsequently to profit or lossExchange gains/(losses) on translating foreign operations2 11 (13)Items that will not be reclassified to profit or lossDefined benefit plan actuarial gains/(losses) 10 258 (1 040)Income tax relating to other comprehensive income (72) 292
Other comprehensive income for the period, net of taxation 197 (761)
Total comprehensive income for the period 1 558 320
Profit attributable to:Owners of Telkom 1 360 1 079 Non-controlling interests 1 2
Profit for the period 1 361 1 081
Total comprehensive income attributable to:Owners of Telkom 1 557 318 Non-controlling interests 1 2
Total comprehensive income for the period 1 558 320
Basic earnings per share (cents) 7 276.8 217.5 Diluted earnings per share (cents) 7 269.6 216.8
1 Foreign exchange and fair value movements decreased due to the currency volatility that resulted in weaker spot currency levels compared to hedging exposures. Net finance charges decreased as a result of debt repayments and lower interest rates.
2 This component of other comprehensive income does not attract any tax.
4140 � Group Interim Results 2021 Reviewed condensed consolidated interim financial statements

Condensed consolidated interim statementof financial positionat 30 September 2021
Notes
Reviewedsix months
ended30 September
2021Rm
Audited 31 March
2021 Rm
AssetsNon-current assets 48 951 47 901 Property, plant and equipment 8 37 119 36 271 Right-of-use assets 4 783 4 519 Intangible assets 8 4 463 4 605 Other investments 139 115 Employee benefits 10 1 404 1 317 Other financial assets 9.1 81 81 Finance lease receivables 219 270 Deferred taxation 13.3 743 723 Current assets 14 442 15 930 Inventories 11 1 193 1 026 Income tax receivable 13.4 111 91 Finance lease receivables 215 228 Trade and other receivables 18.1 7 007 7 227 Contract assets 18.2 1 834 1 747 Other current assets 19 469 459 Other financial assets 9.1 173 88 Investment in insurance cell captive 50 61 Cash and cash equivalents 12 3 390 5 003
Total assets 63 393 63 831
Notes
Reviewedsix months
ended30 September
2021Rm
Audited 31 March
2021 Rm
Equity and liabilitiesEquity attributable to owners of the parent 32 634 31 366 Share capital 5 050 5 050 Share-based compensation reserve 1 142 1 036 Non-distributable reserves 975 1 361 Retained earnings 25 467 23 919 Non-controlling interests (27) (25)
Total equity 32 607 31 341
Non-current liabilities 13 875 15 121 Interest-bearing debt 15 8 464 10 173 Lease liabilities 4 295 3 761 Provisions 16 381 619 Other financial liabilities 9.2 86 107 Deferred revenue 195 235 Deferred taxation 13.3 454 226 Current liabilities 16 911 17 369 Trade and other payables1 10 464 11 493 Shareholders for dividend 31 31 Interest-bearing debt 15 2 411 693 Lease liabilities 872 1 211 Provisions 16 952 1 613 Deferred revenue 1 621 1 696 Income tax payable 13.4 24 9 Other financial liabilities 9.2 534 622 Credit facilities utilised 12 2 1
Total liabilities 30 786 32 490
Total equity and liabilities 63 393 63 831
1 Trade and other payables decreased mainly driven by higher capex spend in quarter four of FY2021, which was paid in quarter one of the current financial period.
4342 � Group Interim Results 2021 Reviewed condensed consolidated interim financial statements

Condensed consolidated interim statement of changes in equityfor the period ended 30 September 2021
Condensed consolidated interim statement of cash flowsfor the period ended 30 September 2021
Reviewedsix months
ended30 September
2021Rm
Reviewed six months
ended 30 September
2020Rm
Balance at 1 April (as previously reported) 31 341 29 475 Attributable to owners of Telkom 31 366 29 504 Non-controlling interests (25) (29)
Restatement of third party service costs – (114)
Restated balance at 1 April 31 341 29 361 Correction of prior period error during 2020 – (44)Total comprehensive income for the period 1 558 320 Profit for the period 1 361 1 081 Other comprehensive income 197 (761)Exchange gains/(losses) on translating foreign operations 11 (13)Net defined benefit plan remeasurements 186 (748)Dividend declared* (2) (257)Increase in share-based compensation reserve 105 123 Escrow shares realised for settlement to employees – 14 Increase in treasury shares (203) (285)Increase in treasury shares from BCX** (184) –Increase in treasury shares from Gyro** (8) –
Balance at 30 September 32 607 29 232 Attributable to owners of Telkom 32 634 29 260 Non-controlling interests (27) (28)
* Dividend declared includes dividends to the non-controlling interests of the BCX Group.
** � repurchased shares on behalf of BCX and Gyro for their respective shareplans during the current financial period.
Notes
Reviewedsix months
ended30 September
2021Rm
Restated six months
ended 30 September
2020*Rm
Cash flows from operating activities 3 598 3 412Cash receipts from customers 21 229 21 249Cash paid to suppliers and employees (16 700) (16 266)Cash generated from operations 22 4 529 4 983Interest received 119 171 Dividend received 22 – Finance charges paid (577) (681)Taxation paid 13.2 (433) (898)Repayment of derivatives (67) (7)Proceeds from derivatives 7 101Cash generated from operations before dividend paid 3 600 3 669Dividend paid (2) (257)Cash flows utilised for investing activities (4 193) (2 612)Proceeds on disposal of property, plant and equipment and intangible assets 10 19 Additions to assets for capital expansion (4 003) (2 933)Investments made by FutureMakers (22) (11)Repayment of derivatives (200) (22)Proceeds from derivatives 22 335Cash flows from financing activities (1 019) (1 621)Loans repaid 15 (100) (900)Purchase of shares for the Telkom and subsidiaries long-term incentive share scheme (393) (285)Repayment of lease liability (474) (431)Repayment of derivatives (69) (43)Proceeds from derivatives 17 38
Net decrease in cash and cash equivalents (1 614) (821)Net cash and cash equivalents at 1 April 5 002 4 726
Net cash and cash equivalents at the end of the period 12 3 388 3 905
* The Group restated the statement of cash flows to correctly classify proceedsof R101 million and repayments of R7 million in respect of FECs relating to inventorypurchases and R335 million of proceeds and R22 million of repayments in respectof the FECs relating to capital expenditure from financing activities to operatingactivities and investing activities, respectively. The change in classification of thecash flows did not impact the net cash and cash equivalents balance at the endof the reporting period.
4544 � Group Interim Results 2021 Reviewed condensed consolidated interim financial statements

Notes to the condensed consolidated interim financial statementsfor the period ended 30 September 2021
1. Independent review
The Directors of the Company take full responsibility for the preparation of the condensed consolidated interim financial statements. The condensed consolidated interim financial statements for the period ended 30 September 2021 have been reviewed by our joint independent auditors PricewaterhouseCoopers Inc. and SizweNtsalubaGobodo Grant Thornton Inc., who have expressed an unmodified conclusion thereon. The joint external auditors have performed their review in accordance with International Standards on Review Engagements (ISRE) 2410. The review conclusion is available for inspection on the Telkom website.
2. Corporate information
Telkom SA SOC Ltd (Telkom), the ultimate parent of the Group, is a Company incorporated and domiciled in the Republic of South Africa (South Africa) whose shares are publicly traded on the Johannesburg Stock Exchange (JSE). The main objective of the Group is to supply telecommunication, multimedia, technology, information, mobile communication services and other related information technology services to the Group's customers in Africa. Turnkey property and tower management solutions are also provided through the Gyro Group, which is a wholly owned subsidiary of the Group.
3. Basis of preparation, significant accounting judgements, estimates, assumptions and significant accounting policies
3.1 Basis of preparation
The condensed consolidated interim financial statements have been prepared in accordance with International Financial Reporting Standard, IAS 34 (Interim Financial Reporting) and in compliance with the JSE Listings Requirements, the South African Companies Act, 2008, the SAICA Financial Reporting Guides as issued by the Accounting Practices Committee and the Financial Pronouncements as issued by the Financial Reporting Standards Council. The condensed consolidated interim financial statements have been prepared on the going concern basis.
The condensed consolidated interim financial statements are disclosed in South African rand, which is also the parent Company’s presentation and functional currency. Unless stated otherwise, all financial information presented in rand has been rounded off to the nearest million.
The condensed consolidated interim financial statements are prepared on the historical cost basis, with the exception of certain financial instruments subsequently measured at fair value. Details of the Group's significant accounting policies are consistent with those applied in the previous financial year.
The results of the period are not necessarily indicative of the results of the entire year and these reviewed condensed consolidated interim financial statements should be read in conjunction with the audited consolidated financial statements for the year ended 31 March 2021, which have been prepared in accordance with IFRS.
3.2 Significant accounting judgements, estimates and assumptions
In preparing these condensed consolidated interim financial statements, the significant judgements made by management in applying the Group's accounting policies and the key sources of estimation uncertainty were consistent with those applied to the annual financial statements for the year ended 31 March 2021. Refer to note 3.2.1 for the change in estimate with regards to the useful lives assessment.
3.2.1 Significant judgements and estimates – change in useful lives of property, plant and equipment
The useful lives of assets are based on management's estimation. Management considers the impact of changes in technology, customer service requirements and availability of capital funding to determine the optimum useful life expected for each of the individual categories of property, plant and equipment. Due to the rapid technological advancement in the telecommunications industry, the estimation of useful lives could differ significantly on an annual basis due to unexpected changes in the rollout strategy. The measurement of residual values of assets is also based on management's judgement whether the assets will be sold or used at the end of their economic lives and the estimation of what their condition will be like at that time. Changes in the useful lives and/or residual values are accounted for as a change in accounting estimate. During the period, the Group reassessed the useful lives on property, plant and equipment. The reassessment relates to the extension of the useful lives of the copper assets still in use, which decreased the depreciation expense by R172 million.
3.3 New accounting pronouncements
3.3.1 Other standards, amendments to standards and interpretations
The standards and amendments listed in the 31 March 2021 annual financial statements will be effective in future reporting periods. It is expected that the Group will adopt the pronouncements on their respective effective dates. There have been no changes to the expected impact of adopting the standards and amendments since 31 March 2021.
4746 � Group Interim Results 2021 Reviewed condensed consolidated interim financial statements

4. Significant changes in the current reporting period
4.1 Civil unrest
During the month of July 2021, civil unrest and widespread protest action occurred in KwaZulu-Natal and Gauteng resulting in damages to Telkom stores, warehouses, vehicles and vandalism of the Telkom exchanges. Blocked routes resulted in the suspension of the dispatch of technicians to attend to faults in affected areas, resulting in service disruption and loss of revenue. 40 outlets (TDS, Express stores, kiosks and containers) in the Gauteng and KwaZulu-Natal provinces were looted, resulting in the loss of inventory, damage to computers, printer and network infrastructure and electronics. Some of the Telkom stores had to be closed during the period of unrest, resulting in a loss of revenue. The losses incurred did not have a material impact on the Telkom Group.
4.2 Assessment of COVID-19
The first half of the year saw the emergence of the third wave of the COVID-19 infections, resulting in a continuation of the restrictive lockdowns that the country experienced in the first and second waves.
The Group continues to experience varied impacts as a consequence of COVID-19, largely due to the diverse nature of its operations, the impact of which is included in the actual results over the past six months.
The Group experienced a significant increase in growth across its carrier and broadband market segments since the advent of the COVID-19 pandemic, pushed by significant demand for internet connectivity.
The decline in the traditional fixed-line business continues and is heightened by the impact of businesses downsizing or introducing remote working policies for employees. This decline has been countered by an increase in the demand across the Group's next-generation services, which are powered by fibre.
As more companies and people adopt hybrid forms of work, the home has become the new hub of communication, fueling tremendous growth across fixed fibre and backhaul requirements for mobile operators.
5. Segment information
The Executive Committee (Exco) is the Group's chief operating decision maker (CODM). Management has determined the operating segments based on the reports reviewed by Exco that are used to make strategic decisions, allocate resources and assess performance of each reportable segment.
The operating segments classification is based on the business units through which Telkom provides communications products and services via its customer-facing units: Consumer, Openserve and Telkom Small and Medium Business (SMB), as well as its subsidiaries, Gyro and BCX. The customer-facing units are supported by the Corporate Centre.
The reportable segments have been determined as Openserve, Consumer, BCX, Gyro and "Other". The SMB segment is aggregated into the Consumer segment. The aggregation is based on the similarity in the nature of products and services. SMB customers include primarily sole proprietors and such customers who typically consume simplex products, which are similar in nature to those consumed within the Consumer segment and the profile of the customers are similar by nature. A large portion of the SMB customer base makes use of the Telkom Direct Stores channels which is the same channel as that of the Consumer customers.
EBITDA is defined as earnings before investment income and finance cost (which includes gains and losses on foreign exchange transactions), tax, depreciation, amortisation and write-offs, impairments and losses of property, plant and equipment and intangible assets, and is also presented inclusive of the following items:
- Interest revenue; and
- Interest on overdue accounts
The interest revenue is included in operating revenue as a separate component of revenue.
Notes to the condensed consolidated interim financial statements continued
for the period ended 30 September 2021
4948 � Group Interim Results 2021 Reviewed condensed consolidated interim financial statements

Notes to the condensed consolidated interim financial statements continued
for the period ended 30 September 2021
September 2021
Open-serve
RmConsumer
RmBCXRm
GyroRm
OtherRm
Elimina-tions
Rm
IFRS 16 reversal
Rm
Consoli-dated
Rm
Revenue from external customers1 1 851 12 799 6 268 374 – – – 21 292Revenue from contracts with customers recognised over time 1 804 11 191 5 489 – – – – 18 484
Voice – 3 374 1 551 – – – – 4 925Interconnection 166 237 – – – – – 403 Data 1 577 7 405 1 492 – – – – 10 474Information technology services – – 2 129 – – – – 2 129 Customer premises equipment related services – 52 302 – – – – 354 Interest revenue – 123 12 – – – – 135 Sundry revenue 61 – 3 – – – – 64
Revenue from contracts with customers recognised at a point in time – 1 608 779 – – – – 2 387 Customer premises equipment – 1 437 240 – – – – 1 677 Information technology hardware – – 539 – – – – 539 Sundry revenue – 171 – – – – – 171
Lease revenue 47 – – 374 – – – 421 Intersegmental operating revenue 4 869 161 1 193 469 509 (6 831) (370) – Other income 190 234 27 – 100 (274) – 277 Insurance service result – (8) – – – – – (8)Total expenses (4 764) (10 756) (6 451) (155) (562) 7 105 – (15 583)
Cost of handsets, equipment, software and directories – (1 568) (964) – – 79 – (2 453)Sales commission, incentives and logistical costs – (1 174) (95) – – – – (1 269)Payments to other operators (400) (1 396) (214) – – 188 – (1 822)Employee expenses (1 477) (505) (1 975) (64) (350) – – (4 371)Selling, general and administrative expenses (1 771) (5 810) (2 949) (22) (185) 6 737 – (4 000)Service fees (1 017) (339) (224) (67) (53) 89 – (1 611)Lease-related expenses (99) 36 (30) (2) 26 12 – (57)
Earnings before interest, tax, depreciation and amortisation (EBITDA) for reportable segments including intersegmental transactions 2 146 2 430 1 037 688 47 – (370) 5 978Depreciation, amortisation, impairments and write-offs (3 488)
Operating profit 2 490Investment income 95Net finance charges, hedging costs and fair value movements (659)
Profit before taxation 1 926
Other segment informationCapital expenditure of property, plant and equipment and intangible assets 1 716 1 498 180 174 42 – – 3 610
1 Revenue includes transactions generated by subsidiaries of BCX in countries outside of South Africa. These are however not considered material to the Group and are thus not disclosed separately.
5. Segment information continued
5150 � Group Interim Results 2021 Reviewed condensed consolidated interim financial statements

Notes to the condensed consolidated interim financial statements continued
for the period ended 30 September 2021
September 2020
Open-serve
RmConsumer
RmBCXRm
GyroRm
OtherRm
Elimina-tions
Rm
IFRS 16 reversal
Rm
Consoli-dated
Rm
Revenue from external customers1 1 841 12 545 6 654 356 – – – 21 396 Revenue from contracts with customers recognised over time 1 771 11 293 5 750 – – – – 18 814
Voice – 3 586 1 584 – – – – 5 170 Interconnection 199 251 – – – – – 450 Data 1 535 7 253 1 546 – – – – 10 334 Information technology services2 – – 2 240 – – – – 2 240 Customer premises equipment related services2 – 71 344 – – – – 415 Interest revenue – 128 15 – – – – 143 Sundry revenue 37 4 21 – – – – 62
Revenue from contracts with customers recognised at a point in time – 1 252 904 – – – – 2 156 Customer premises equipment – 1 087 250 – – – – 1 337 Information technology hardware – – 654 – – – – 654 Sundry revenue – 165 – – – – – 165
Lease revenue3 70 – – 356 – – – 426 Intersegmental operating revenue 5 005 145 1 294 381 432 (6 882) (375) – Other income 105 254 25 – 155 (266) – 273 Insurance service result – – – – 22 – – 22 Total expenses (5 020) (10 351) (6 833) (187) (540) 7 148 – (15 783)
Cost of handsets, equipment, software and directories – (1 224) (1 094) – – 90 – (2 228)Sales commission, incentives and logistical costs – (1 086) (117) – – – – (1 203)Payments to other operators (407) (1 558) (254) – – 225 – (1 994)Employee expenses (1 615) (500) (2 047) (55) (371) – – (4 588)Selling, general and administrative expenses (1 814) (5 591) (3 102) (89) (80) 6 809 – (3 867)Service fees (1 020) (329) (200) (39) (117) 44 – (1 661)Lease-related expenses (164) (63) (19) (4) 28 (20) – (242)
Earnings before interest, tax, depreciation and amortisation (EBITDA) for reportable segments including intersegmental transactions 1 931 2 593 1 140 550 69 – (375) 5 908 Depreciation, amortisation, impairments/(reversals) and write-offs (3 356)
Operating profit 2 552 Investment income 117 Net finance charges, hedging costs and fair value movements (1 012)
Profit before taxation 1 657
Other segment informationCapital expenditure of property, plant and equipment and intangible assets 1 212 1 444 189 55 42 – – 2 942
1 Revenue includes transactions generated by subsidiaries of BCX in countries outside of South Africa. These are however not considered material to the Group and are thus not disclosed separately.
2 Certain information technology hardware and software items and customer premises equipment related services were incorrectly reflected as revenue from contracts with customers at a point in time and has now been moved to revenue over time. The comparatives have been re-presented.
3 In March 2021, it was identified that lease revenue was incorrectly included in sundry revenue and has now been moved to a separate line item, "lease revenue". The comparatives have been re-presented.
5. Segment information continued
5352 Telkom Group Interim Results 2021 Reviewed condensed consolidated interim financial statements

Notes to the condensed consolidated interim financial statements continued
for the period ended 30 September 2021
5. Segment information continued
Entity-wide disclosures
All material non-current assets other than financial instruments, deferred tax assets, post-employment benefit assets, and rights arising under insurance contracts related to the segments above are located in South Africa. Assets belonging to the subsidiaries of BCX outside of South Africa are not considered material to the Group.
No single customer contributes more than 10% of the revenue from external customers and thus no specific information relating to major customers is included in the segment information above.
For the purpose of assessing revenue contribution per customer, management does not treat government as a single customer.
Reviewed sixmonths ended30 September
2021Rm
Reviewed six months ended 30 September
2020Rm
6.1 Payments to other operators (1 822) (1 994) Payments to other operators decreased mainly due to lower mobile roaming and interconnect traffic.
6.2 Cost of handsets, equipment, software and directories (2 453) (2 228)
Cost of handsets, equipment, software and directories increased as a result of higher post-paid and LTE sales. This is more normalised in comparison to the prior period, as the prior period was lower due to the impact of COVID-19.
6.3 Sales commission, incentives and logistical costs (1 269) (1 203) Sales commission, incentives and logistical costs increased slightly as a result of higher commissions due to the growth in the commissionable base.
6.4 Employee expenses (4 371) (4 588) Employee expenses decreased mainly due to restructuring that occurred in the prior period.
6.5 Other expenses (1 271) (1 142) Other expenses increased mainly due to higher losses as a result of theft, licence fees and third party access costs.
6.6 Lease-related expenses (57) (242) In the second half of FY2021, lease renewals were fast tracked resulting in leases, that were previously expensed as month-to-month, being renewed for a fixed period. These leases have been capitalised to right-of-use assets and lease liabilities and are no longer accounted for as month-to-month, resulting in the decrease in lease-related expenses. This resulted in an increase in the right-of-use asset and lease liability.
6. Expenses
5554 � Group Interim Results 2021 Reviewed condensed consolidated interim financial statements
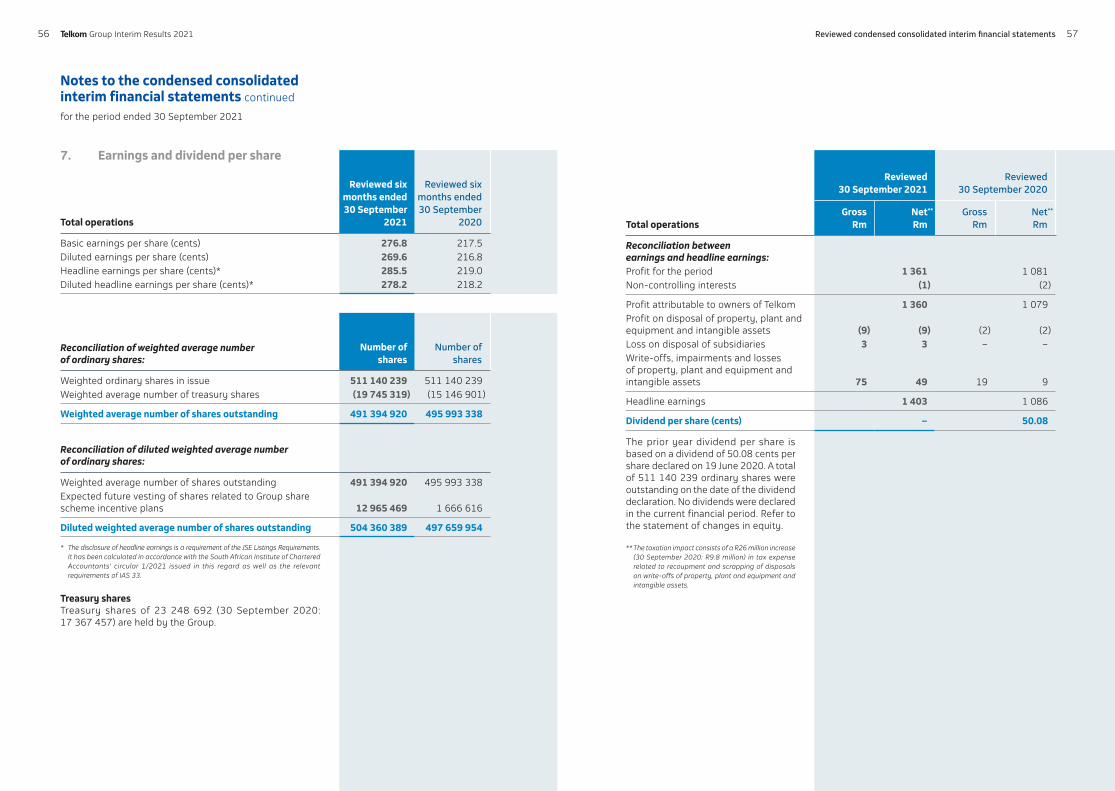
Notes to the condensed consolidated interim financial statements continued
for the period ended 30 September 2021
Total operations
Reviewed sixmonths ended30 September
2021
Reviewed six months ended 30 September
2020
Basic earnings per share (cents) 276.8 217.5 Diluted earnings per share (cents) 269.6 216.8 Headline earnings per share (cents)* 285.5 219.0 Diluted headline earnings per share (cents)* 278.2 218.2
Reconciliation of weighted average number of ordinary shares:
Number of shares
Number of shares
Weighted ordinary shares in issue 511 140 239 511 140 239 Weighted average number of treasury shares (19 745 319) (15 146 901)
Weighted average number of shares outstanding 491 394 920 495 993 338
Reconciliation of diluted weighted average number of ordinary shares:
Weighted average number of shares outstanding 491 394 920 495 993 338 Expected future vesting of shares related to Group share scheme incentive plans 12 965 469 1 666 616
Diluted weighted average number of shares outstanding 504 360 389 497 659 954
* The disclosure of headline earnings is a requirement of the JSE Listings Requirements. It has been calculated in accordance with the South African Institute of Chartered Accountants' circular 1/2021 issued in this regard as well as the relevant requirements of IAS 33.
Treasury sharesTreasury shares of 23 248 692 (30 September 2020: 17 367 457) are held by the Group.
Reviewed30 September 2021
Reviewed30 September 2020
Total operationsGross
RmNet**
Rm Gross
RmNet**
Rm
Reconciliation between earnings and headline earnings:Profit for the period 1 361 1 081Non-controlling interests (1) (2)
Profit attributable to owners of Telkom 1 360 1 079Profit on disposal of property, plant and equipment and intangible assets (9) (9) (2) (2)Loss on disposal of subsidiaries 3 3 – –Write-offs, impairments and losses of property, plant and equipment and intangible assets 75 49 19 9
Headline earnings 1 403 1 086
Dividend per share (cents) – 50.08
The prior year dividend per share is based on a dividend of 50.08 cents per share declared on 19 June 2020. A total of 511 140 239 ordinary shares were outstanding on the date of the dividend declaration. No dividends were declared in the current financial period. Refer to the statement of changes in equity.
** The taxation impact consists of a R26 million increase (30 September 2020: R9.8 million) in tax expense related to recoupment and scrapping of disposals on write-offs of property, plant and equipment and intangible assets.
7. Earnings and dividend per share
5756 � Group Interim Results 2021 Reviewed condensed consolidated interim financial statements

Notes to the condensed consolidated interim financial statements continued
for the period ended 30 September 2021
Reviewed six months ended30 September
2021Rm
Audited 31 March
2021Rm
Property, plant and equipmentAdditions 3 352 7 692 Disposals (2) (7)
3 350 7 685
Intangible assets Additions 258 756
258 756
Finance charges of R48 million (31 March 2021: R31 million) were capitalised to property, plant and equipment and intangible assets in the current financial period.
The increase in the PPE balance from March 2021 to September 2021 can be attributed to the increase in additions on network equipment in the Mobile business.
8. Capital additions and disposals 9.2 Other financial liabilities
Reviewed six months ended30 September
2021Rm
Audited 31 March
2021Rm
Non-current other financial liabilities (86) (107)Other financial liabilities at amortised cost
Asset finance payables (86) (107)
Current other financial liabilities (534) (622)Other financial liabilities at amortised cost (197) (200)
Asset finance payables (91) (86)Vendor financing (106) (114)
Other financial liabilities at fair value through profit or loss (337) (422)Derivative instruments used for hedging (315) (400)
Forward exchange contracts (21) (179)Firm commitments (149) (19)Interest rate swaps (145) (202)
Financial guarantees (22) (22)
The South African rand appreciated year-on-year against the USD. This resulted in gains in the fair value of forward exchange contracts and corresponding losses in the firm commitments.
The losses in the interest rate swaps is due to the deterioration of the South African economy and the impact of the lower interest rate environment. The Group pays the fixed interest leg of the swap and receives the floating interest leg in return. The current fixed rates are higher than the floating rate. The interest rate swaps are used to hedge the debt, which is predominately floating rate debt.
9. Other financial assets and liabilities
9.1 Other financial assets Reviewed six months ended 30 September
2021Rm
Audited 31 March
2021Rm
Non-current other financial assets 81 81Other financial assets at amortised cost
Asset finance receivables 81 81Current other financial assets 173 88Other financial assets at fair value through profit or lossDerivative instruments used for hedging 173 88
Forward exchange contracts 159 –Firm commitments 14 88
5958 � Group Interim Results 2021 Reviewed condensed consolidated interim financial statements

No. of shares
granted 2021
Telkom
LTIP 2 291 673 ESOP 3 799 573 BCX LTIP 979 884 ESOP 3 378 199 Yellow Pages ESOP 59 051Gyro LTIP 167 846 ESOP 111 855
The vesting dates for the shares granted to Telkom Company, BCX and Gyro are as follows, if the performance conditions have been met and if the employee is still in the employment of the Telkom Group:
ESOP grant: 30 June 2024: 100%
LTIP grant:30 June 2024: 50%30 June 2025: 30%30 June 2026: 20%
The vesting dates for the shares granted to Yellow Pages are as follows, if the performance conditions have been met and if the employee is still in the employment of the Telkom Group:
ESOP grant: 30 June 2024: 100%
Reviewed six months ended 30 September
2021Rm
Audited 31 March
2021Rm
Non-current assets 1 404 1 317 Telkom Pension Fund asset 16 17 Post-retirement medical aid recognition of net plan asset 1 388 1 300
Reviewed six months ended 30 September
2021Rm
Reviewed six months ended 30 September
2020Rm
Defined benefit plan actuarial gains/(losses) 258 (1 040)Telkom Pension Fund net actuarial (loss)/gain (2) 1 Telkom Retirement Fund net actuarial gain/(loss) 255 (1 084)Medical aid net actuarial gain 14 74Telephone rebate net actuarial loss (8) (29)Long service award net actuarial loss (1) (2)
The increase in employee benefits is largely due to the actuarial gain. The actuarial gain is due to the change in the discount rate and inflation rate. The discount rate is driven purely by market movements in yields. The rate is the bond yield at appropriate duration. The inflation rate is the difference in the real and nominal yields allowing for a 0.5% inflation risk premium.
Share schemeOn 1 June 2021, Telkom Group granted shares to a certain group of employees in terms of a Long Term Incentive Plan (LTIP) and the Employee Share Ownership Plan (ESOP). The shares are equity-settled and the number of shares to vest will depend on the extent to which the performance conditions are met at the end of the applicable performance period. The shares granted are as follows:
Notes to the condensed consolidated interim financial statements continued
for the period ended 30 September 2021
10. Employee benefits
6160 � Group Interim Results 2021 Reviewed condensed consolidated interim financial statements

] 12. Net cash and cash equivalents
Reviewed six months ended30 September
2021Rm
Audited 31 March
2021Rm
Cash disclosed as current assets 3 390 5 003 Cash and bank balances 2 970 3 637 Short-term deposits 420 1 366
Credit facilities utilised (2) (1)
Net cash and cash equivalents 3 388 5 002
Undrawn borrowing facilities 6 553 6 578
Net cash and cash equivalents decreased mainly due to the higher capex spend in quarter four of FY2021.
The undrawn borrowing facilities are unsecured and bear interest at a rate that will be mutually agreed between the borrower and lender at the time of drawdown. These facilities are subject to annual review and are in place to ensure liquidity. At 30 September 2021, R6.2 billion (31 March 2021: R5.5 billion) of these undrawn facilities were committed.
Notes to the condensed consolidated interim financial statements continued
for the period ended 30 September 2021
10. Employee benefits continued
The financial assumptions used for the valuation of these grants are as follows:
� Group 2021 ESOP
� Group 2021
LTIP
Market share price (R) 48.11 48.11 Share price volatility (%) 40 40Future risk-free interest rate (%)- 30 June 2024 4.98 4.98- 30 June 2025 N/A 5.51- 30 June 2026 N/A 6.01
11. Inventories
Reviewed six months ended30 September
2021Rm
Audited 31 March
2021Rm
Inventories 1 193 1 026 Gross inventories 1 359 1 180 Write-down of inventories to net realisable value (166) (154)
The Group's inventory increased in the current financial period due to the accelerated fibre strategy.
6362 � Group Interim Results 2021 Reviewed condensed consolidated interim financial statements

13. Taxation and deferred taxation
13.1 Taxation Reviewed six months ended30 September
2021Rm
Reviewed six months ended 30 September
2020Rm
Taxation (565) (576)
The taxation expense decreased mainly due to a reduction in the Group’s effective tax rate (ETR) to 29.3% from 34.8%. This reduction is attributable to a reduction in non-deductible permanent differences and prior year adjustments.
13.4 Net income tax receivable
Reviewed six months ended30 September
2021Rm
Audited 31 March
2021Rm
The income tax receivable is made up as follows: 87 82 Income tax receivable 111 91 Income tax payable (24) (9)
The net income tax receivable is due to the overpayments of provisional tax.
Notes to the condensed consolidated interim financial statements continued
for the period ended 30 September 2021
13.2 Taxation paid
Reviewed six months ended30 September
2021Rm
Reviewed six months ended 30 September
2020Rm
Taxation paid (433) (898)
Taxation paid in the current financial period is lower than in the comparative period, as the September 2020 tax paid amount included payments in respect of prior period tax disputes that were settled.
13.3 Deferred taxation
Reviewed six months ended30 September
2021Rm
Audited 31 March
2021Rm
Deferred taxation balance is made up as follows: 289 497Deferred taxation assets 743 723 Deferred taxation liabilities (454) (226)
The decrease in the deferred tax asset (DTA) is attributable to the movement in other comprehensive income (OCI) and the reversal of timing differences, set off by the increase in tax losses recognised in profit or loss. The movement in OCI includes actuarial gains recognised on the post-employment benefit plans.
6564 � Group Interim Results 2021 Reviewed condensed consolidated interim financial statements

Notes to the condensed consolidated interim financial statements continued
for the period ended 30 September 2021
A decrease in fair value of the forward exchange contracts, designated as fair value hedges, of R177 million (31 March 2021: R460 million) has been recognised in finance charges and fair value movements and offset with a similar gain on the hedged items (property, plant and equipment and inventory).
Valuation techniques and assumptions applied for the purposes of measuring fair valueThe estimated net fair values as at the reporting date have been determined using available market information and appropriate valuation methodologies as outlined on the previous page. The fair values of the financial assets and financial liabilities are sensitive to exchange rate and interest rate movements.
Derivatives are recognised at fair value. The fair values of derivatives are determined using quoted prices or, where such prices are not available, a discounted cash flow analysis is used. These amounts reflect the approximate values of the net derivative position at the reporting date.
The fair values of the borrowings disclosed above are based on quoted prices or, where such prices are not available, the expected future payments are discounted at market interest rates. As a result, they differ from their carrying values.
The fair value of financial instruments is included at the price that would be received to sell an asset or paid to transfer a liability in an orderly transaction between market participants at the measurement date or, in its absence, the most advantageous market to which the Group has access at that date. The fair value of a liability reflects its non-performance risk. The fair value of cash and short-term deposits, trade and other receivables, contract assets, finance leases, shareholders for dividend and trade and other payables approximate their carrying amounts largely due to the short-term maturities of these instruments and market related interest rates included in finance lease receivables. Long-term receivables and borrowings are evaluated by the Group based on parameters such as interest rates, specific country factors and the individual creditworthiness of the customer. Based on this evaluation, allowances are taken into account for the expected losses of these receivables. As at the reporting date, the carrying amount of such receivables, net of allowances, are not materially different from their calculated fair values. Fair values of quoted bonds are based on price quotations at the reporting date.
14. Fair value measurement
Exposure to continuously changing market conditions has made management of financial risk critical for the Group. Treasury policies, risk limits and control procedures are continuously monitored by the Board of Directors through its Audit and Risk Committees.
14.1 Fair value of financial instruments
Valuation techniques and assumptions applied for the purposes of measuring fair value:
Type of financial instrument
Fair value at 30 September
2021 Rm
Valuation technique
Significant inputs
Derivative assets 173 Discounted cash flows Yield curvesMarket interest rates
Derivative liabilities (315)
Financial guarantees (22) Discounted cash flows Market exchange rate and probability of default
Investment in FutureMakers entities
129 Discounted cash flows Cash flow forecasts and market related discount rates
Interest-bearing debt (10 964) Discounted cash flows and quoted bond prices
Market interest rates
Derivatives Derivatives held for risk management purposes include hedges that either meet the hedge accounting requirements or economic hedges that do not meet the hedge accounting requirements.
Derivatives that do not meet the hedge accounting requirements: The Group uses forward exchange contracts and interest rate swaps to economically hedge its foreign exchange and interest rate exposures. These derivative instruments are measured at fair value through profit or loss.
Derivatives that meet the hedge accounting requirements:The Group uses forward exchange contracts to hedge its exposure to changes attributable to movements in the spot exchange rate of its firm commitments. These derivatives are designated as fair value hedges.
Fair value hedgesThe foreign forward exchange contracts, designated as fair value hedges, are being used to hedge the exposure to changes attributable to movements in the spot exchange rate of its firm commitments.
6766 � Group Interim Results 2021 Reviewed condensed consolidated interim financial statements

15. Interest-bearing debt
Reviewed six months ended 30 September
2021Rm
Audited 31 March
2021Rm
Non-current interest-bearing debt 8 464 10 173 Local debt 7 482 9 135 Foreign debt 982 1 038
Current portion of interest-bearing debt 2 411 693 Local debt 2 411 693
The current portion of interest-bearing debt of R2 411 million (31 March 2021: R693 million) at 30 September 2021 is expected to be repaid from available cash, operational cash flow or the issue of new debt instruments.
During the period under review, R100 million (30 September 2020: R900 million) debt was repaid. Rnil debt was raised.
Notes to the condensed consolidated interim financial statements continued
for the period ended 30 September 2021
14. Fair value measurement continued
14.2 Fair value hierarchy
The table below analyses financial instruments carried at fair value and amortised cost, by valuation method.
The different levels have been defined as follows:
a) Quoted prices in active markets for identical assets or liabilities (level 1).b) Inputs other than quoted prices that are observable for the asset or liability (level 2).c) Inputs for the asset or liability that are not based on observable market data (level 3).
Hierarchy levels*
30 September2021
Rm
31 March 2021
Rm
Assets measured at fair valueDerivative assets
Forward exchange contracts Level 2 159 –Firm commitments Level 2 14 88
Investment made by FutureMakers Level 3 129 107 Liabilities measured at fair valueDerivative liabilities
Forward exchange contracts Level 2 (21) (179)Interest rate swaps Level 2 (145) (202)Firm commitments Level 2 (149) (19)
Financial guarantees Level 3 (22) (22)Liabilities measured at amortised costInterest-bearing debt consisting of:
Listed debt Level 2 (10 964) (11 078)
* There have been no transfers between the fair value levels in the period under review.
6968 � Group Interim Results 2021 Reviewed condensed consolidated interim financial statements

Notes to the condensed consolidated interim financial statements continued
for the period ended 30 September 2021
17. Commitments
Reviewed six months ended 30 September
2021Rm
Audited 31 March
2021Rm
Capital commitments authorised 6 238 12 303 Commitments against authorised capital expenditure 3 612 2 007 Authorised capital expenditure not yet contracted 2 626 10 296
Capital commitments comprise commitments for property, plant and equipment and intangible assets.
Management expects these commitments to be financed from internally generated cash and borrowings.
18. Trade and other receivables and contract assets
18.1 Trade and other receivablesReviewed six
months ended 30 September
2021Rm
Audited 31 March
2021Rm
Trade and other receivables 7 007 7 227 Trade receivables 4 739 5 077
Gross trade receivables 7 121 7 395 Impairment of receivables (2 382) (2 318)
Prepayments and other receivables 2 268 2 150
Allowance account for credit losses – trade receivables 2 382 2 318 Opening balance 2 318 1 877 Charged to statement of profit or loss and other comprehensive income 327 1 008 Receivables written off (263) (567)
Trade receivables are amounts due from customers for goods sold or services performed in the ordinary course of business. The repayment terms of trade receivables vary between 21 days and 90 days from date of invoice. Interest charged on overdue accounts varies between the prime rate and a rate of 18%, depending on the contract terms.
16. Provisions
Reviewed six months ended 30 September
2021Rm
Audited 31 March
2021Rm
Non-current provisions 381 619 Non-current employee related provisions 366 606 Subsidiary defined benefit plans 27 27 Telephone rebates 340 325 Telkom Retirement Fund (1) 254 Non-current non-employee related provisionsOther 15 13
Current provisions 952 1 613 Current portion of employee related provisions 806 1 480 Annual leave 509 473 Telephone rebates 39 39 Bonus, termination packages and other benefits 258 968 Current portion of non-employee related provisionsOther 146 133
Annual leave In terms of the Group's policy, employees are entitled to accumulate vested leave benefits not taken within a leave cycle, to a cap of 15 – 30 days (31 March 2021: 15 – 30 days), which must be taken within a 6 – 19 month (31 March 2021: 6 – 19 month) leave cycle. The leave cycle is reviewed annually and is in accordance with legislation.
BonusThe bonus scheme consists of performance bonuses, which are dependent on the achievement of certain financial and non-financial targets. The bonus is payable annually to all qualifying employees after the Group's results have been made public. A 14th cheque is payable to a certain group of employees. Refer to note 6.4.
Telkom Retirement FundThe decrease in the Telkom Retirement Fund obligation is primarily driven by experience adjustments. Refer to note 10.
7170 � Group Interim Results 2021 Reviewed condensed consolidated interim financial statements

19. Other current assets
Reviewed six months ended 30 September
2021Rm
Audited 31 March
2021Rm
Other current assets 469 459Contract costs capitalised 263 261Ongoing commission capitalised assets 206 198
Contract costs capitalised 263 261 Opening balance 261 299 Contract costs capitalised during the period 148 265 Contracts cancelled during the period (13) (26)Amortisation recognised as cost of providing services during the period (133) (277)
Contract costs capitalised relate to commission and incentive costs paid to dealers and sales staff, which are considered incremental to the acquisition and fulfilment of the contract. The contract costs capitalised are amortised as an expense over the term of the contract to which the commission relates. Management expects that the full cost will be recovered through the revenue recognised on these contracts and has consequently not recognised any impairment on the contract costs capitalised.
Notes to the condensed consolidated interim financial statements continued
for the period ended 30 September 2021
18. Trade and other receivables and contract assets continued
18.2 Contract assetsReviewed six
months ended 30 September
2021Rm
Audited 31 March
2021Rm
Contract assets 1 834 1 747 Gross contract assets 2 307 2 157 Impairment of contract assets (473) (410)
Allowance account for credit losses – contract assets 473 410 Opening balance 410 432 Charged to statement of profit or loss and other comprehensive income 148 31 Contract assets written off (85) (53)
Disposal of contract assets Telkom entered into a factoring arrangement in relation to the handset receivable book, amounting to a nominal amount of R305 million in August 2021. Telkom recognised a derecognition gain of R43 million within other income in the statement of profit or loss and other comprehensive income. Telkom will continue to explore similar initiatives to ensure further cash flow.
7372 � Group Interim Results 2021 Reviewed condensed consolidated interim financial statements

Reviewed six months ended 30 September
2021Rm
Restated 31 March
2021*Rm
Restated six months ended 30 September
2020*Rm
Details of material transactions and balances with related parties not disclosed separately in the condensed consolidated interim financial statements were as follows:With shareholders:Government of South AfricaRelated party balancesFinance lease receivables 176 240 255 Trade receivables 926 991 748 Impairment of trade receivables (251) (216) (172)Related party transactionsRevenue (2 116) (4 385) (2 043)
At 30 September 2021, the Government of South Africa held 40.5% (30 September 2020: 40.5%) of Telkom's shares, and had the ability to exercise significant influence, and the Public Investment Corporation held 13.39% (30 September 2020: 14.97%) of Telkom's shares.
With entities under common control:Major public entitiesRelated party balancesFinance lease receivables 70 88 94 Trade receivables 218 240 106 Impairment of trade receivables (56) (49) (9)Trade payables – (1) –Related party transactionsRevenue (excluding lease income) (354) (668) (353)Operating expenses (excluding lease expense) 153 277 130 Lease income (16) (32) (13)Lease expense 24 42 16
* The comparatives related to major public entities have been restated due to changes in the major public entities listing in the current financial period.
21. Related parties
Notes to the condensed consolidated interim financial statements continued
for the period ended 30 September 2021
20. Contingencies
Contingent liabilitiesOther than the disclosures below, there have been no significant movement or new matters noted on the contingent positions as reported in the 31 March 2021 financial statements.
High courtRadio Surveillance Security Services (RSSS) On 27 August 2020, RSSS served a new summons on Telkom. In terms of the summons, RSSS claims that certain information came to light during the initial trial against Telkom in 2017. RSSS is now claiming the return of 444 alarm systems, alternatively payment of R210 million and a payment of R319 million for alleged outstanding rentals for the alarms. The Plaintiff made certain amendments to its summons, and Telkom has filed its plea to the amended summons. Pleadings have closed and the parties are currently in the discovery phase. Discovery is a process during which each party discloses all relevant documents, reports and other evidence relevant to the matter, in preparation for the trial. Telkom is, however, applying for a liquidation of RSSS due to non-payment of legal costs owing to Telkom to date. The liquidation hearing has been set down to be heard in August 2022.
Class action against Telkom and Mutual and Federal Risk Financing LimitedDuring June 2021, Telkom received a High Court application to certify a class action against it. The application arises from minor billing discrepancies on device insurance premiums. Mutual and Federal Risk Financing Limited acts as underwriter for the device insurance and has also been cited in the court proceedings. Telkom is currently taking steps to oppose the application for certification of the class action. Telkom is not in a position to quantify the potential impact.
Phutuma Networks (Pty) Ltd (Phutuma)In August 2009, Phutuma served a summons on Telkom, claiming for damages in the amount of R5.5 billion, arising from a tender published by Telkom in November 2007. The High Court granted absolution from the instance, in Telkom's favour. The Supreme Court of Appeal (SCA) had initially dismissed Phutuma's application for leave to appeal in October 2014. On 4 November 2014, the SCA rescinded its order granted in October 2014. In early 2015, the SCA referred the application for leave to appeal back to the full bench of the North Gauteng High Court. The leave to appeal was heard in September 2016 and was upheld. The matter now needs to be re-enrolled for trial.
7574 � Group Interim Results 2021 Reviewed condensed consolidated interim financial statements

Notes to the condensed consolidated interim financial statements continued
for the period ended 30 September 2021
22. Reconciliation of profit before tax to cash generated from operations
Reviewed six months ended 30 September
2021Rm
Reviewed six months ended 30 September
2020 Rm
Cash generated from operations 4 529 4 983Profit before tax 1 926 1 657 Finance charges and fair value movements 659 1 012Investment income and income from associates (95) (117) Interest received from trade receivables (56) (70) Non-cash items 3 259 3 089Depreciation, amortisation, impairment and write-offs 3 488 3 356 Increase in expected credit loss provision 128 221 Bad debts written off 347 265 Decrease in provisions (726) (715) Insurance service result* 8 (22)Profit from disposal of property, plant and equipment (9) (2) Foreign exchange movements 33 (49)Share-based payment expenses 106 122 Movement in deferred revenue (116) (87) Movement in working capital (1 164) (588)Movement in inventories (163) (138)Increase in trade receivables, contract assets, finance lease receivables and other receivables (159) (283)Decrease in trade and other payables and prepayments (842) (167)
* The insurance service result line item is included in the reconciliation in the current financial period. This was previously included in the foreign exchange movements line item. The September 2020 reconciliation has been updated for comparability purposes.
Reviewed six months ended 30 September
2021Rm
Audited31 March
2021Rm
Reviewed six months ended 30 September
2020Rm
Key management personnel compensation: (including Directors and prescribed officers’ remuneration)Related party transactionsShort-term employee benefits 87 272 91 Post-employment benefits 8 15 7 Termination benefits – 6 1 Equity compensation benefits 34 77 37
Terms and conditions of transactions with related partiesExcept as indicated above, outstanding balances at 30 September 2021 are unsecured, include interest and settlement occurs in cash. There have been no guarantees provided or received for any related party receivables or payables. Except as indicated above, for the period ended 30 September 2021, the Group has not impaired any of the amounts owed by the related parties. This assessment is undertaken each financial period through examining the financial position of the related party and the market in which the related party operates.
21. Related parties continued
7776 � Group Interim Results 2021 Reviewed condensed consolidated interim financial statements

Abbreviations
BCX Business Connexion (Pty) Ltd
Capex Capital expenditure
CODM Chief operating decision maker
DTA Deferred tax asset
EBITDAEarnings before investment income and finance cost, tax, depreciation, amortisation and write-offs, impairments and losses
ESOP Employee share ownership plan
ETR Effective tax rate
Exco Executive Committee
FEC Forward exchange contract
GCEO Group Chief Executive Officer
IA Intangible assets
IAS International Accounting Standard
IASB International Accounting Standards Board
IFRS International Financial Reporting Standards
ISRE International Standard on Review Engagements
IT Information Technology
JSE Johannesburg Stock Exchange
LTIP Long-term incentive plan
OCI Other comprehensive income
PPE Property, plant and equipment
ROU Right-of-use
SMB Small and Medium Business
TDS Telkom Direct Stores
TKG The Telkom Group’s JSE share code
TRF Telkom Retirement Fund
USD United States Dollar
Notes to the condensed consolidated interim financial statements continued
for the period ended 30 September 2021
23. Significant events and transactions
Results of the Telkom annual general meeting regarding Directors reappointmentsOn 25 August 2021, the following Board Members were elected or re-elected as per the annual general meeting ordinary resolutions:
- N Kapila
- O Ighodaro
- EG Matenge-Sebesho
- H Singh
- KW Mzondeki
- F Petersen-Cook
- SP Sibisi
- RG Tomlinson
Vesting of sharesIn terms of the Telkom Share Plan, 198 279 shares vested to Mr Sipho Maseko and 21 674 shares vested to Mr Dirk Reyneke in June 2021.
Resignation and appointment of Group Chief Executive Officer (GCEO)Telkom announced on 23 July 2021 that Mr Sipho Maseko will step down as GCEO and Executive Director of the Telkom Group on 30 June 2022. Telkom announced that the Board has appointed Serame Taukobong as GCEO designate with effect from 1 October 2021. He will assume the role of the GCEO from 1 July 2022.
Resignation of Non-executive DirectorsTelkom announced on 1 July 2021 that Mr Alphonzo Samuels, a Non-executive Director, resigned from the Telkom Board with effect from 1 July 2021.
Appointment of Non-executive DirectorsTelkom announced on 1 July 2021 that Mses Olufunke Ighodaro and Ethel Matenge-Sebesho had been appointed to the Board of Directors as independent Non-executive Directors with effect from 1 July 2021.
24. Events after the reporting date
Other mattersThe Directors are not aware of any other matter or circumstance since the financial period ended 30 September 2021 and the date of this report, or otherwise dealt with in the interim financial statements, which significantly affects the financial position of the Group and the results of its operations.
gre
en g
rass
des
ign
11
37
4
7978 � Group Interim Results 2021 Reviewed condensed consolidated interim financial statements
