interdisciplinary research: methodologies for
TRANSCRIPT
Interdisciplinary research: methodologies for identification and assessment November 2016
The Glasshouse Building, 68 Wharfdale Road
LONDON N1 9SR, UK
http://www.digital-science.com
Assessment of interdisciplinary research, November 2016 2
Report on interdisciplinary research: methodologies for identification and assessment
This project was commissioned by the Medical Research Council (MRC) and informed by a steering
group that included Research Councils UK (RCUK), the Higher Education Funding Council for
England (HEFCE) and expert advisors Professor Michael Hopkins (SPRU, University of Sussex) and
Professor Ismael Rafols (INGENIO, Universitat Politecnica de Valencia).
The objective of the study behind this report was to compare the consistency of indicators of
‘interdisciplinarity’ and to identify a preferred methodology. The outcomes reveal that choice of
data, methodology and indicators can produce seriously inconsistent results despite a common set
of disciplines and countries. This raises questions about how interdisciplinarity is identified and
assessed. It reveals a disconnect between the research metadata that analysts typically use and the
research activity they assume they have analysed. The results highlight issues around the responsible
use of ‘metrics’ and the importance of analysts clarifying the link between any quantitative proxy
indicator and the assumed policy target.
This document has two parts. The Report describes key features of the project, presents an
overview of the results and summarises the outcomes. The Annexes provide more extensive
background, specifics on data and methods, and detailed results including figures and tables.
Summary
Research projects that cross disciplinary boundaries (interdisciplinary research, ID research) have
been reported (from Subramanyam (1983) onwards) to be increasingly common and are widely
considered to be important to the delivery of economic and social impact (studies from ABRC
(1987) to King’s College (2015)). However, this report demonstrates objections to the simplistic
indexing of interdisciplinarity:
• Diverse concepts and definitions around interdisciplinarity challenge its objective identification
and some observers are not precise about the aspect (or component) to which they refer.
• Any one piece of research has many components (e.g. people, objectives, activity, outputs,
impacts). Metadata associated with these components have been used to create proxy indicators
that are inferred to describe the nature of the research itself.
• Each proxy analysis delivers different insights on the nature of the research project under
analysis. The same project may be indexed as interdisciplinary for one parameter (say,
departmental affiliations) but not for another (say, diversity of references).
• Analytical indices deliver inconsistent, and sometimes contradictory, results. Some of this
variance may depend on the choice of dataset and the application of specific methodology.
• It is essential to consider a framework for analysis, drawing on multiple indicators, rather than
expecting any simplistic index on its own to produce an informative outcome.
Assessment of interdisciplinary research, November 2016 3
Many other studies have questioned how ID should be measured (Porter and Chubin, 1985),
whether ID proposals tend to suffer in peer review (e.g. Porter and Rossini, 1985; Rinia et al.,
2001b), and whether ID research does in practice suffer in evaluation (e.g. van Raan, 2003; Rinia et
al., 2011a; Rafols et al., 2012). Running through this is the lack of an objective consensus as to which
pieces of work should be deemed ‘interdisciplinary’.
One reason for wanting objective, analytical identification of the degree to which a research project
may or may not be interdisciplinary is that this would be valuable to research funding bodies, which
need transparent and consistent management methodologies to satisfy stakeholder expectations.
There would thus be policy and practical significance in demonstrating satisfactory and consistent
agreement between different indicators of the distribution, frequency and trajectory of ID research.
(For more detail on Background see ANNEX A)
The “nature” of large volumes of research activity (as good or poor, useful or trivial) is rarely
indexed directly, because that needs expert judgment, so there has historically been widespread use
of proxies based on metadata linked to research project inputs and outputs. Without expert, peer
agreement, applying indices of the degree of interdisciplinarity may seem abstract, but proxy
measures of research activity have been used informatively. For example, it is agreed that relative
citation counts reflect research impact. This has created an untested assumption that such proxies
can be applied legitimately to other research attributes (see, for example: Elsevier, 2015). The
present report challenges the assumption that this can really be informative in an ID research policy
context without validation, comparison and careful interpretation.
This report creates such comparisons by drawing on multiple data sources and methodologies. The
outcomes reveal not only inconsistencies but also evidence of conflicts between indicators. We
conclude that, for the future, it will be essential to be conscious that proxy indicators do not provide
direct information about the interdisciplinary nature of the research itself. This compromises their
value for management purposes. They provide measures specific to the interdisciplinarity of the
metadata, which may or may not be a measure of the activity of interest, and any management group
using such analyses should be made fully aware of this distinction. However, although a single
definitive indicator will not usually exist, a more sophisticated ‘framework’ approach to indexing the
multiple sources of interdisciplinarity in a project could be very informative.
Methodology
The analytical approach in this study compares a series of indices of metadata associated with inputs
(project grants) and outputs (journal articles) and derived from the multidisciplinary nature of
research teams (via address lists) and the interdisciplinary nature of research descriptions (via
summary text and reference lists). Parts of the analysis were performed independently by Digital
Science (London) and by Science-Metrix (Montreal).
Assessment of interdisciplinary research, November 2016 4
A satisfactory index of interdisciplinarity needs information on the variety of disciplines, their balance
(or relative frequency) and their disparity (the ‘distance’ between them), all of which may vary for
each dataset to be indexed. For consistency in comparisons:
• Analyses focussed on the UK and a subset of similar research economies: (1) Anglophone group:
Australia and Canada; and (2) European group: Germany, the Netherlands and Sweden.
• A common time period (2004-2013) was used insofar as possible.
• Data were aggregated at disciplinary level to a common categorical structure (ANZSRC Divisions
- Annex C Table C1).
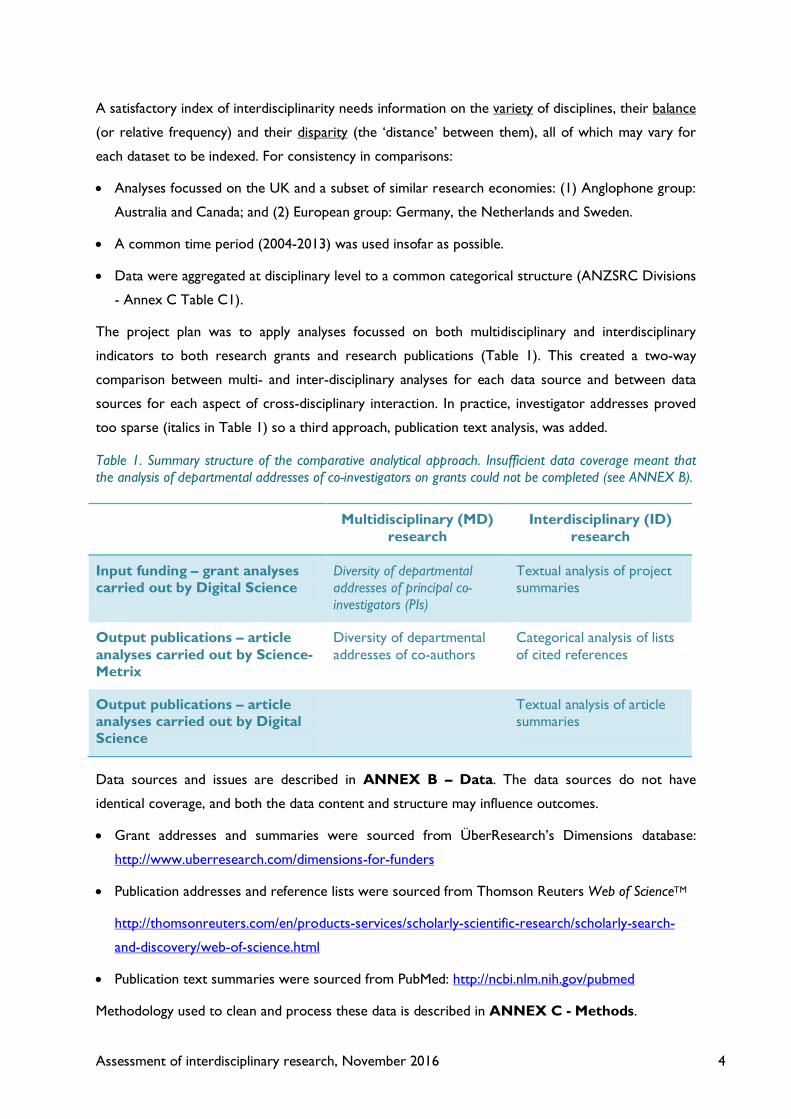
The project plan was to apply analyses focussed on both multidisciplinary and interdisciplinary
indicators to both research grants and research publications (Table 1). This created a two-way
comparison between multi- and inter-disciplinary analyses for each data source and between data
sources for each aspect of cross-disciplinary interaction. In practice, investigator addresses proved
too sparse (italics in Table 1) so a third approach, publication text analysis, was added.
Table 1. Summary structure of the comparative analytical approach. Insufficient data coverage meant that the analysis of departmental addresses of co-investigators on grants could not be completed (see ANNEX B).
Multidisciplinary (MD) research
Interdisciplinary (ID) research
Input funding – grant analyses carried out by Digital Science
Diversity of departmental addresses of principal co-investigators (PIs)
Textual analysis of project summaries
Output publications – article analyses carried out by Science-Metrix
Diversity of departmental addresses of co-authors
Categorical analysis of lists of cited references
Output publications – article analyses carried out by Digital Science
Textual analysis of article summaries
Data sources and issues are described in ANNEX B – Data. The data sources do not have
identical coverage, and both the data content and structure may influence outcomes.
• Grant addresses and summaries were sourced from ÜberResearch’s Dimensions database:
http://www.uberresearch.com/dimensions-for-funders
• Publication addresses and reference lists were sourced from Thomson Reuters Web of ScienceTM
http://thomsonreuters.com/en/products-services/scholarly-scientific-research/scholarly-search-
and-discovery/web-of-science.html
• Publication text summaries were sourced from PubMed: http://ncbi.nlm.nih.gov/pubmed
Methodology used to clean and process these data is described in ANNEX C - Methods.
Assessment of interdisciplinary research, November 2016 5
Results – overall field level
The outcomes described by the proxy indicators listed in Table 1 are inconsistent. Readers
unfamiliar with these data and methodologies may wish to refer to ANNEX B and C at this point.
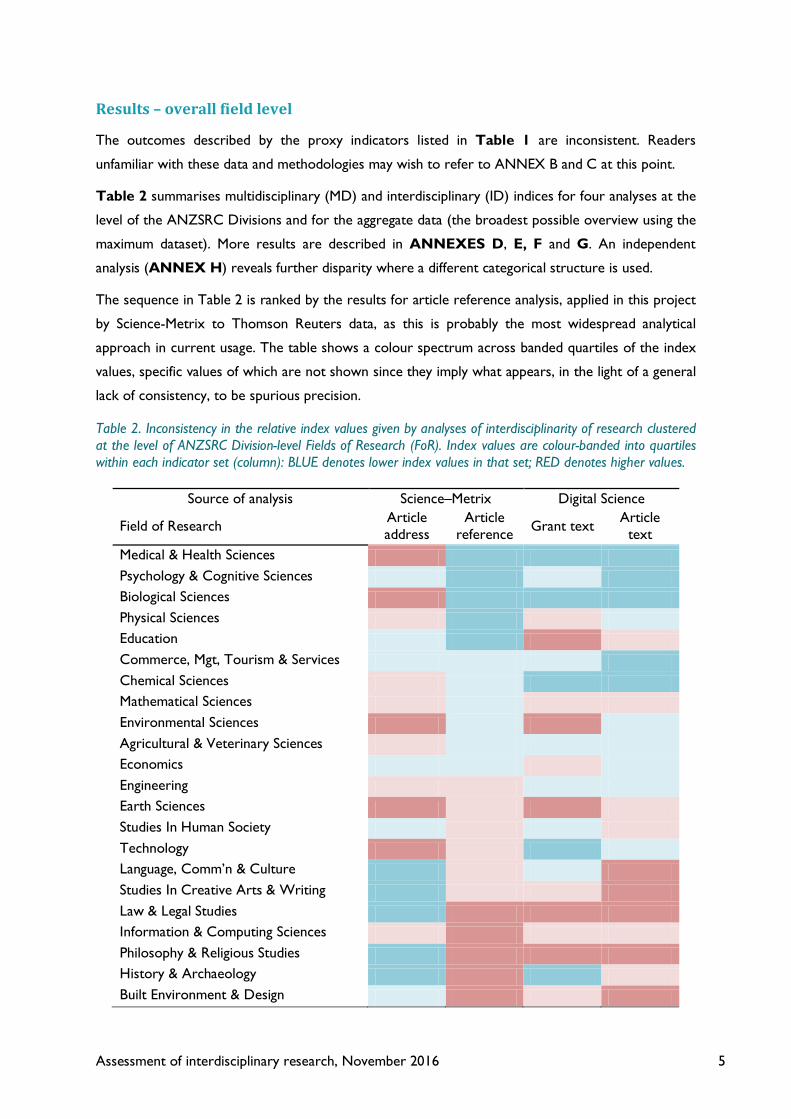
Table 2 summarises multidisciplinary (MD) and interdisciplinary (ID) indices for four analyses at the
level of the ANZSRC Divisions and for the aggregate data (the broadest possible overview using the
maximum dataset). More results are described in ANNEXES D, E, F and G. An independent
analysis (ANNEX H) reveals further disparity where a different categorical structure is used.
The sequence in Table 2 is ranked by the results for article reference analysis, applied in this project
by Science-Metrix to Thomson Reuters data, as this is probably the most widespread analytical
approach in current usage. The table shows a colour spectrum across banded quartiles of the index
values, specific values of which are not shown since they imply what appears, in the light of a general
lack of consistency, to be spurious precision.
Table 2. Inconsistency in the relative index values given by analyses of interdisciplinarity of research clustered at the level of ANZSRC Division-level Fields of Research (FoR). Index values are colour-banded into quartiles within each indicator set (column): BLUE denotes lower index values in that set; RED denotes higher values.
Source of analysis Science–Metrix Digital Science
Field of Research Article address
Article reference Grant text Article
text Medical & Health Sciences Psychology & Cognitive Sciences Biological Sciences Physical Sciences Education Commerce, Mgt, Tourism & Services Chemical Sciences Mathematical Sciences Environmental Sciences Agricultural & Veterinary Sciences Economics Engineering Earth Sciences Studies In Human Society Technology Language, Comm’n & Culture Studies In Creative Arts & Writing Law & Legal Studies Information & Computing Sciences Philosophy & Religious Studies History & Archaeology Built Environment & Design
Assessment of interdisciplinary research, November 2016 6
Note that data source and disciplinary variety interact and this is more problematic with selective
data-sources: Thomson Reuters Web of ScienceTM data are richer and more fine-grained in science
than social science and humanities; PubMed data are richer in bio-medical fields.
The summary results are:
• Negative association between index values for the article address analysis and the three other
analyses.
• Inequity in analytical coverage and information due to sparse data for article-based indicators
outside STEM subjects.
• Disparities in the correlations between the other analyses. For example:
o Both Technology and Language & culture have extremely varied outcomes.
o Environmental Sciences is interdisciplinary on article addresses and project grant
text, but mono-disciplinary on article references and abstract text.
Contradiction between indicators does not mean they are invalid. The central issue when reviewing
these results is the emerging logical uncertainty about the connection between the metadata for the
disciplinary diversity of the associated components and the disciplinary diversity of the underpinning
research activity.
• Address diversity for project/publication teams may reflect knowledge brought to bear but
refers only indirectly to objectives (e.g. solo researchers can be interdisciplinary; institutional
structures vary).
• Text abstracts describing a project grant are close to describing the research activity but provide
a limited data-volume for analysis, and full text is not always publicly available. (It is available to
the funding body, however, and thus may be a route to better indexing.)
• Outputs (such as articles) contain content, notably reference lists, tuned by authors for specific
journals (the same could be true for some monograph series).
• Article abstracts may be more specifically descriptive of research content than a reference list
that has been editorially tuned, but the concordance between article abstracts and article
content has never been examined.
Results – overall country level
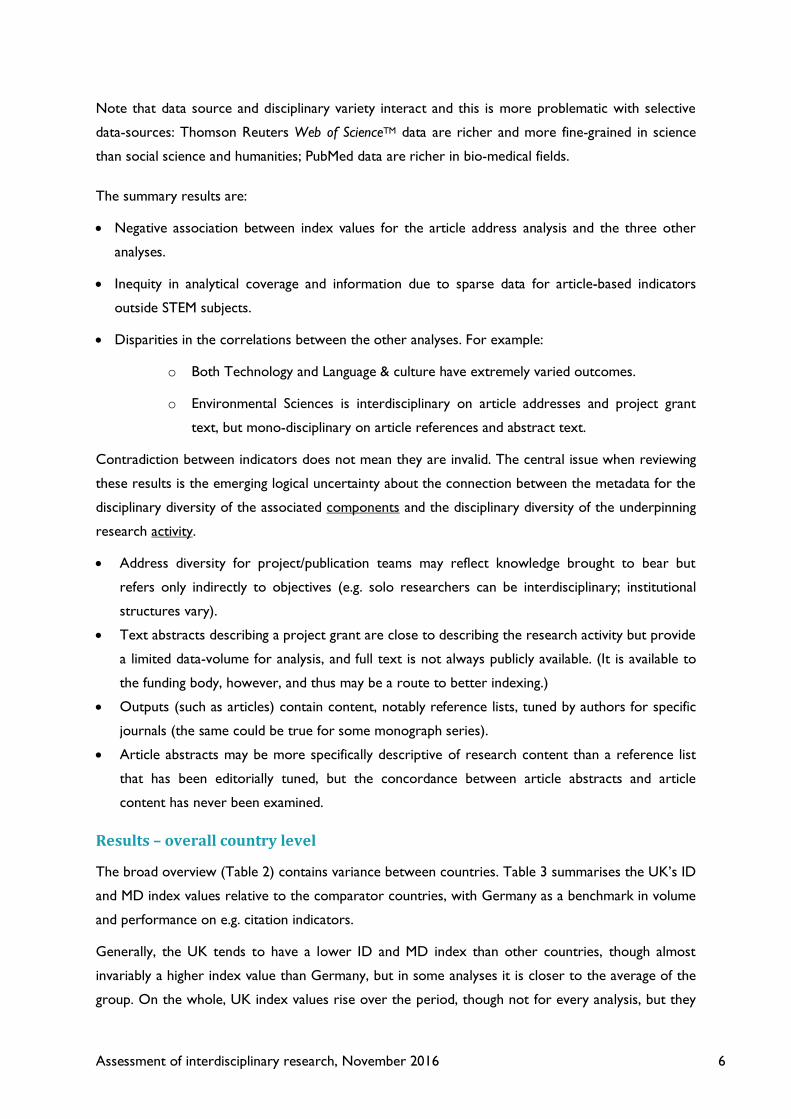
The broad overview (Table 2) contains variance between countries. Table 3 summarises the UK’s ID
and MD index values relative to the comparator countries, with Germany as a benchmark in volume
and performance on e.g. citation indicators.
Generally, the UK tends to have a lower ID and MD index than other countries, though almost
invariably a higher index value than Germany, but in some analyses it is closer to the average of the
group. On the whole, UK index values rise over the period, though not for every analysis, but they
Assessment of interdisciplinary research, November 2016 7
also do so for most countries and this rise may in fact be due to confounded data factors (potentially
associated with increased interdisciplinarity, but as yet unproven).
Table 3. Comparison of the MD and ID index values from different methodologies and datasets, for the UK compared to other countries, noting Germany as a comparator of similar volume and focus.
Other countries Trend
Research grants text ANNEX D
UK ID index similar to other EU countries and slightly better than Germany (Figure D1) UK ID index lower than Australia and slightly better than Canada (Figure D2)
No trend in EU data Slight rise over period in Anglophone data
Article addresses ANNEX E
UK MD index below other countries, except Germany, but all above world average (Figure E1)
Steadily rising values for all countries over period
Article reference lists ANNEX F
UK ID index was above other countries but recently average in group though always above Germany (Figure F2)
Steadily rising values for all countries over period
PubMed article abstracts ANNEX G
N/A
Nature citing and cited analysis ANNEX H
UK ID index higher than Germany but lower than other countries
N/A
Results – UK field level
Inconsistency between fields in relative indicator values also arises when the data are analysed within
countries. For example, UK Environmental Sciences index values are low but rising in Anglophone
grant data (Figure D3) but high and erratic in the sparser EU grant data (Figure D4). The specific
data sample used for analysis evidently influences the detailed outcome, so clearly it is essential to
specify the precise analytical context since no result can be assumed to be general.
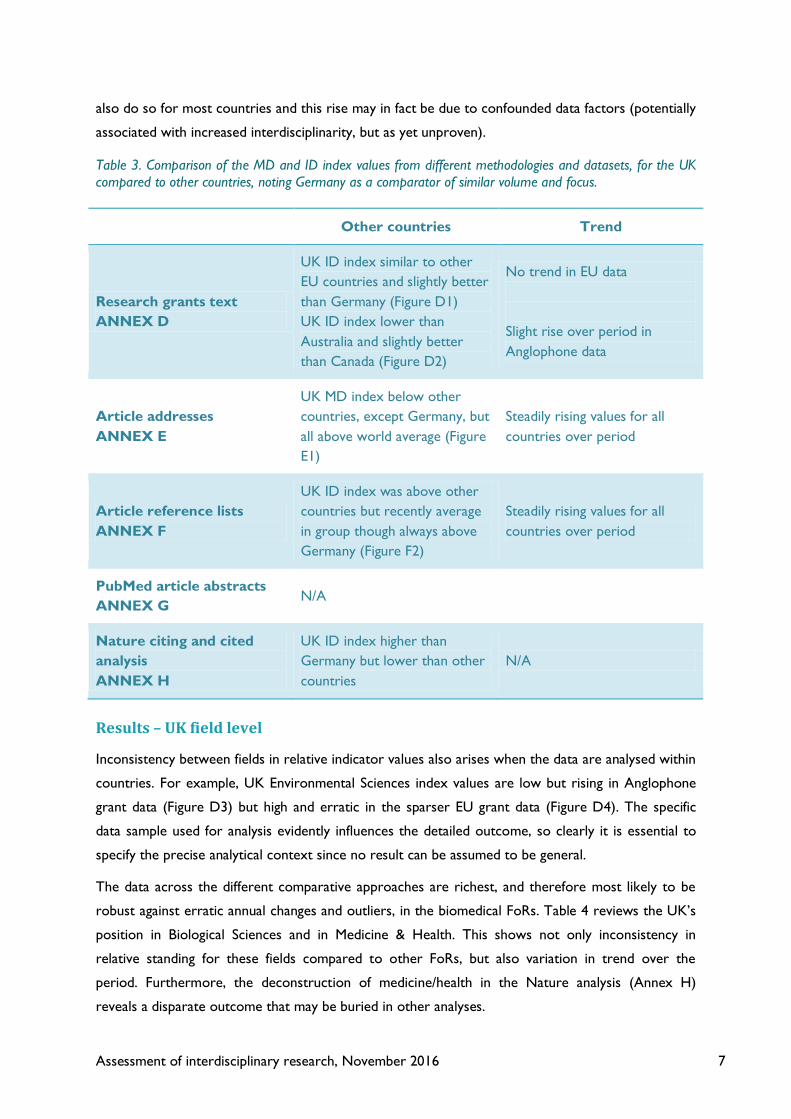
The data across the different comparative approaches are richest, and therefore most likely to be
robust against erratic annual changes and outliers, in the biomedical FoRs. Table 4 reviews the UK’s
position in Biological Sciences and in Medicine & Health. This shows not only inconsistency in
relative standing for these fields compared to other FoRs, but also variation in trend over the
period. Furthermore, the deconstruction of medicine/health in the Nature analysis (Annex H)
reveals a disparate outcome that may be buried in other analyses.
Assessment of interdisciplinary research, November 2016 8
Table 4. Comparison of the MD and ID index values from different methodologies and datasets, for the fields of Biological Sciences and for Medicine & Health within the UK compared to other countries, noting Germany as a comparator of similar volume and focus
Field ID results Trend 2004-2013
Research grants text ANNEX D
Biology and Medicine/Health much lower ID than other fields (Figure D3 and D4)
No trend for EU (Figure D7); rise in Anglophone data (Figure D8) but overall trend (Figure D2) may be due to ICTS and Environmental (Figure D3)
Article addresses ANNEX E
Biology and Medicine/Health higher MD than other fields (Figure E3); very similar ranking for Germany (Figure E4)
Steadily rising values for all fields through period
Article reference lists ANNEX F
Biology and Medicine/Health low within main group around world average (Figure F3)
No trend
PubMed article abstracts ANNEX G
Biology and Medicine/Health well below others at start but less so at end (Figure G1)
Most Divisions steady; Biology rises steadily and Medicine/-Health slightly; strongest Group rise in Biochemistry, but also good in Genetics and Plant sciences (Figure G3)
Nature citing and cited analysis ANNEX H
Health high ID relative to other fields but Clinical Medicine relatively lower
N/A
The influence of data source and structure
Inconsistency in outcomes for different proxy indicators arise overall (Table 2), between comparator
countries (Table 3), and for relative values across fields (Table 4). Specific variances can be related to
individual datasets (ANNEX D) and to the choice of categorical structures (ANNEX H). Each
specific dataset has limitations, but there is generic disjunction between metadata and analytical
purpose and a review of the data reveals confounding factors.
• Associations between ID index values, category volume and address count. Global article
volume is growing, as are author counts and the number and geographical spread of addresses.
These variables affect frequency and disparity and interact with the network structure for
analysis. We must infer that the results are compromised until a more complete statistical
analysis can demonstrate otherwise.
• Publication data analysis: the MD index increases with higher paper counts at category level
(ANNEX E, Figure E2). Countries with higher MD indices also have more addresses per paper
(ANNEX C, Table C3). The rise of address count with time could account for the observed rise
in MD values.
Assessment of interdisciplinary research, November 2016 9
• Article address analysis: the MD index increases uniformly for all countries (ANNEX E, Figure
E1) and for all categories within the UK (Figure E3), Germany and Sweden. Such evenness may
be associated with metadata changes, and requires further investigation to account for the
variance such changes may cause.
• Article reference list analysis: the ID index increases over time for all countries (ANNEX F,
Figure F1). There are no temporal change in relative index values, e.g. for the UK and Germany,
confirming that the overall ID change is a global phenomenon. The volume of data on which the
index draws grows over time, so a further investigation is essential to explore the variance such
changes may cause. The observed increase in index values may be purely volume driven.
• Article reference list analysis also uses a relatively narrow slice of data, which might capture
relative outlier records (albeit at a similar rate for each country), although tests show that
varying the threshold for this slice has no exceptional influence. However, any narrow slice may
tend covertly to capture or to exclude particular parts of the activity portfolio.
• Data choices made about source (e.g. Anglophone or EU grant data) and structure (e.g. FoR or
NSF biomedical categories) affect outcomes. Methodological constraints may interact with data
use and influence outcomes: reference lists are matched to an analytical database; match rates
vary by discipline and affect matched data volume; outcomes vary by country due to journal use;
and long reference lists are associated with higher ID index values (Campbell et al., 2015).
Consequently, no single indicator can unequivocally identify and monitor interdisciplinary research
activity and no present proxy is a demonstrably satisfactory management tool on its own. A more
sophisticated framework approach to research interdisciplinarity is needed that produces
information that draws on multiple types of well-curated data.
Conclusions and recommendations
Indicators of interdisciplinarity analysed in this study show diverse inconsistency in terms of change
over time, difference between disciplines and trajectory for countries. That raises doubts as to their
specific relevance and some cover only some disciplines adequately. Collectively they may be more
informative, however, used as a framework to support expert review.
Generally, a single indicator based on proxy metadata will always be too remote to identify or scale
the degree of ID research activity: no single indicator has yet been clearly associated with a peer
assessment of the interdisciplinarity of the underlying research; such indicators fail a basic ‘valid and
equitable’ requirement since they fail the test of mutual consistency across data sources and
methods; and without analytical consistency it is unclear how to achieve peer consensus on what
research is interdisciplinary.
Article reference lists are a conventional analytical tool, but possibly the least satisfactory source of
indicator data. First, only STEM disciplines are supported by sufficient well-curated data to be
properly addressed. Second, our analysis reveals a problematic association between index values and
Assessment of interdisciplinary research, November 2016 10
list length (i.e. data volume). Third, match rates, journal usage, and cultural factors may also affect
analyses. Fourth, reference lists may not be objective representations of the underlying activity.
It is also unclear whether ID indices based on metadata are equitable for all research modes and all
countries. For example:
• Blue-skies research and research near to application and impact do not necessarily exhibit the
same structures, outputs and outcomes and cannot be assessed in the same way.
• Smaller EU countries have consistently different index values (in this study) that may be
associated with the social culture of research in a smaller domestic community (and this
observation could well extend to smaller and larger discipline categories).
Overall, our recommendations are that:
(1) Quantitative proxy indicators of interdisciplinarity based on research activity metadata
should only be used in concert, for consistency checking, and should preferably be used in a
framework that defines expectations and relationships.
(2) Any analyst of the inter/disciplinarity of research activity should set out clearly their
interpretation of interdisciplinarity, the relevance of their particular metadata to that
interpretation, and in that context the appropriateness (detail and scope) of their data
source and analytical methodology.
(3) Text analysis for research proposals and journal articles, either as abstracts if necessary or
preferably as full document text, should be explored as a potential indicator of the research
activity.
a. Text is equally and equitably applicable to all subjects, which author counts and
reference lists are not. An obvious source would be article texts, but these are most
accessible for STEM subjects. Other publications (books, monographs and grey
literature) are appropriate in other disciplines.
b. Comparison should be made between abstracts and full text, to see whether
abstracts adequately reflect the content of the grant proposals and journal articles
they represent.
(4) Research funders should include, in their published award information, the departmental
affiliations of all principal investigator affiliations, to enable disciplinary diversity of research
teams to be evaluated externally as well as internally.
Wagner et al (2011) suggested that ‘combinations of quantitative measures and qualitative
assessments being applied within evaluation studies appear to reveal [ID] processes but carry
burdens of expense, intrusion, and lack of reproducibility year-upon-year … development is needed
before metrics can adequately reflect the actual phenomenon of [ID]’. This study wholly supports
those conclusions, but we suggest that the more comprehensive internal access that funding bodies
such as Research Councils have to their (often confidential) metadata may offer them an amenable
route to a set of Wagner’s ‘combinations of measures’ that would satisfy expert committees.
Assessment of interdisciplinary research, November 2016 11
ANNEXES TO THE REPORT
ANNEXES TO THE REPORT .......................................................................................................................... 11
ANNEX A: Background ...................................................................................................................................... 12
ANNEX B: Data ................................................................................................................................................... 15
ANNEX C: Methodology ................................................................................................................................... 20
ANNEX D: Input interdisciplinarity – grant summaries ............................................................................. 31
ANNEX E: Output multidisciplinarity - article addresses .......................................................................... 37
ANNEX F: Output interdisciplinarity – article reference lists .................................................................. 41
ANNEX F: SUPPLEMENT - Comparison between multidisciplinarity of author addresses and
interdisciplinarity of reference lists .................................................................................................................. 45
ANNEX G: Output interdisciplinarity – article abstracts .......................................................................... 47
ANNEX H: Output interdisciplinarity – analysis in Nature ........................................................................ 51
References ............................................................................................................................................................. 52
Assessment of interdisciplinary research, November 2016 12
ANNEX A: Background
Research projects that cross disciplinary boundaries (interdisciplinary research, ID research) are
considered to make an important contribution to the delivery of economic and social impact (ABRC,
1987; Scottish Universities Research Consortium, 1997; Lyall et al., 2011; Aldrich, 2014; King’s
College London, 2015). It is also argued that they have long been increasing in frequency (as early as
Subramanyam, 1983, followed by arguments about HE Research Assessment Exercises in the 1990s).
Studies are equivocal, however, as to how ID should be measured (Porter and Chubin, 1985),
whether ID proposals tend to suffer in peer review (e.g. Porter and Rossini, 1985; Rinia et al.,
2001b), whether ID research suffers in evaluation (e.g. van Raan, 2003; Rinia et al., 2011a; Rafols et
al., 2012), and hence whether ID research can in fact be demonstrated objectively to have lesser or
greater impact than other research.
The assessment of the distribution, frequency and trajectory of ID research is therefore of policy
and practical significance. For example, for research funders, the relevance of ID research to their
objectives is of practical importance. To demonstrate that ID proposals are treated equitably, a
reasonable and workable basis for identifying and tracking the progress of those that are more or
less MD/ID is required.
The problem of defining interdisciplinarity
Wagner et al (2011) started with a search for quantitative measures of ID research before
concluding that ID analysis has been subject to many ‘differing definitions, assessment tools,
evaluation processes, and measures.’
The primary focus of the present study is on methodology and the consistency of results, not on the
specific results themselves (although these throw some light on relative ID levels between countries
and fields). The question is whether similar outcomes are produced when the focus of analysis
moves between data sources and metadata components. Throughout, the analysis and interpretation
returns to a series of basic developmental challenges because this study, like Wagner’s, ultimately
fails to find a consistent and robust methodology of general applicability.
• There is no universal definition, delineation or simple indexing of ID research.
• An ‘ideal’ and consistent structure of disciplinary categories does not exist.
o There is no unique way of categorising ‘disciplines’ within which ‘inter’-actions occur,
but such a structure is required to describe ‘ID’ research.
o The variety of disciplinary categories, balance between varieties, and disparity (degree of
difference) between varieties are core concepts for diversity assessment (Stirling, 2007)
and they form the backbone of any index of interdisciplinarity (Rafols and Meyer, 2010).
o Variety of categories may be few or many depending on granularity. For example,
research linking chemistry with physics may seem unequivocally ID but they are both
Assessment of interdisciplinary research, November 2016 13
‘physical sciences’; or, within biology, the interaction between ecology and genetics
would be hidden at a coarse level, but indexed as ID at a finer level.
o Evenness/weight of category divisions is subjective. For example, can humanities and
science categories be equitably distributed? If chemistry and physics are distinct
categories, does engineering form one or many categories? How does it compare to
economics?1
• The distance (disparity) between categories is problematic.
o ‘Disparity’ between discipline categories (conceptual difference or cognitive distance)
must be measured to compare specific samples to a global set. To a lay-person,
pharmacology and physiology appear similar compared to ceramics, but satisfactory
analysis requires consistent quantification.
• The connection between MD teams, ID processes, outputs and outcomes is uncertain.
o Multidisciplinary (MD) research is distinguished from ID research by some observers.
Because of a lack of methodological (and conceptual) consistency it is not clear whether
ID and MD research lead to similar outcomes. Besselaar and Heimeriks (2001) argue
that both are transitional, dynamic stages in the evolution of new disciplines.
o In this report: MD implies collaborative working between distinct disciplines (see Qiu,
1992); and ID research implies integrated cross-disciplinary activity.2 This could also be
described as a difference between group structure and functional outcome, or as
epistemological and social interdisciplinarity.
• The correlation between proxy indicators and the target activity is contested and optimal
indicators have not been agreed.
o Confidence in the generic utility of citation data is misplaced. Such data are widely used
in research quality assessment and, at least in STEM, generally accepted for that
purpose.3 They are also used to index ID research in journal articles via either content
(reference lists, looking at research cited) or usage (citations, looking at research users).
These are clearly proxies and the degree to which they are satisfactory is long argued
(Chubin et al., 1983; Porter and Chubin, 1985).
1 Marie McVeigh (formerly Director - Journal Indexing, Thomson Reuters) commented on the problem of comparative ‘intellectual scale’ of the ‘Web of Science’ global categorical system where ‘Economics’ and ‘Marine Engineering’ hold the same hierarchical status for assigning journals. 2 Other observers (e.g. Wagner et al, 2011) would describe MD and differentiate it from ID research in other ways. In the absence of a consistent convention we stand, for the purposes of this report, on the description made here. 3 Referencing behaviour and citation rates are strongly discipline-dependent. Citation analysis may correlate with e.g. peer review in (some) STEM areas, but not all. Because of limited coverage in commercial databases, it has very weak analytical power in the humanities.
Assessment of interdisciplinary research, November 2016 14
The problem of indexing interdisciplinarity
A critical problem for any indicator of research activity is to identify the data that are relevant to the
activity to be tracked and accessible to the analyst. As for any other research analysis, we look for a
data source in the sequence of: (Inputs) (Activity/Process) (Outputs) (Outcomes/Impact).
For the analysis of ID research, Activity/Process is the key stage that is or is not interdisciplinary
(ID). If research can unequivocally be identified as ID, e.g. by multiple independent expert review,
then the surrounding environment (relevant input and output data) could be sieved for statistical
relationships (proxy indicators) that could be used for monitoring.
The problem is that Activity exists in a research ‘black box’ where there is little sight of the stages
between input and output, and expert review has not been applied to a sufficiently large sample.
There is consequently no proven test dataset to which proxy indicators could be referred.
Conventional research performance assessment also uses proxies (such as relative financial input and
publication output) because of the ‘black box’ problem. Grant awards and paper acceptances both
depend on expert peer review, so high achievement on these variables can be seen as legitimate
proxies for ‘performance’. However, when proxies are used to ‘index’ ID research, it is only an
implicit assertion, without explicit validation, that data from another research stage (e.g. for an
output: the disciplinary diversity of references) accurately reflect the degree to which the activity is
also disciplinarily diverse. As noted, this is unproven and contested ground from Chubin onwards.
Furthermore, the results of any one analysis, however comprehensive, are compromised because
analytical results depend on methodological choices. These depend in turn on the data used, the
categories used to bin the data, data filtering or other treatment, or the statistical approach. All can
affect results and influence interpretation.
This report therefore uses diverse analyses of different research metadata to create a pool of
outcomes from distinct but related perspectives as a basis for comparison (Report: Table 1).
The analysis is structured to compare MD-structure/ID-function. The greater the consistency
between these analyses, the greater the confidence that they refer to something fundamental. The
greater the variance, the more likely that these are measuring something about the proxy data
rather than genuinely indexing the underlying activity (Report: Table 2).
Ideally, for each item analysed (such as a grant or journal article), we would try and compare the
scores by each method but this will remain an object for possible future study.
Assessment of interdisciplinary research, November 2016 15
ANNEX B: Data
General data issues, specific source issues and data characteristics
In choosing an appropriate dataset around which an MD/ID Project assessment methodology may be
developed, we need data that:
• Are accessible, preferably electronically.
• Extend across a significant time period (for analysis of longitudinal trends).
• Span a broad range of disciplines (which is key to building a complete map of research subject
areas from which disciplinary disparity can be estimated).
• Have complete address metadata (for assignment of all investigators to discipline).
• Are indexed with text intact (those without even abstracts are not useful, but abstracts may not
be sufficient).
Selection of countries, time periods, and specific data sets is based around these requirements. Data
sources and coverage are diverse, to support multiple analytical applications. A series of general
issues arise in seeking to acquire data that meet these needs. Although the data sources described
here are the most useful for this analysis, a number of challenges are faced in their exploitation
including data categorisation, standardising its variety, quantifying its disparity and then measuring the
balance across categories.
Both Science-Metrix and Digital Science sought to account for variety, disparity and balance but
solutions are not the same and may not feasibly be complete for all data sources. Furthermore, it
became evident that disciplinary and structural differences in data coverage could affect the results.
For example: Thomson Reuters Web of ScienceTM publications may cover science fields more
comprehensively and with greater granularity than humanities; PubMed publications are evidently
focussed around medical and biological sciences. In any partial database, more marginal subjects are
inherently more likely to be interdisciplinary. Publication abstracts in PubMed records with text that
can be tagged as ‘Law’ universally appear as interdisciplinary because monodisciplinary ‘Law’
publications are extremely unlikely to be indexed in PubMed. This influence applies to some extent
to any non-global data source.
Researcher (and disciplinary) custom and practice affects how information is presented and the
degree to which a proposal, description or publication reflects the structure of the underlying
project or activity. For example, because journals perceived as relatively high status often exist in
disciplinary cores, this can push authors to package papers to that focus rather than capturing the
full ID/MD nature in any one piece. Furthermore, an abstract is ‘marketing’ directed at a potential
reader: text analysis of abstracts may produce an ID/MD index that differs from the complete
project description or publication text. Finally, national cultural practice in scientific writing may
influence style and hence the degree to which text reflects ID activity.
Assessment of interdisciplinary research, November 2016 16
Categorisation is a pervasive issue affecting many research activity and performance analyses. Here
we refer to discipline-based categories, but category problems also arise with job roles, institutional
types and funding modes. Data are collected and indexed for a variety of reasons under diverse
circumstances by disparate agencies. This can make it difficult to bring different parts of an analysis
together, using a common structure. At national level this is addressed in part by the OECD Frascati
definitions.4 In practice, for this study, this problem is not insuperable since relative ID levels are
analysed at a fairly aggregate level. However, it is an issue to bear in mind for any generally useful
methodology.
Distance (disparity) between categories can be properly calculated only by reference to a ‘global’
dataset that reveals the average co-occurrence of any pair of categories (to which co-occurrences in
the sample data are then compared). If the source data are not structured in a way that allows a
global reference to be calculated then a proxy measure of disparity is required, which obviously
makes the possibly unwarranted assumption that disparity of disciplines is common across systems
and data types.
Address analysis is affected by categorisation and by data accessibility. Subject categorisation of
addresses is problematic because the addresses relate to local institutional structures including
specific centres and generic schools that follow no standard form. Furthermore, feedback suggests
that address may be a weak badge of discipline: biology schools recruit chemists and mathematicians,
institutional structures change and individuals move (Rafols, 2009).
Addresses on grants may be made more problematic because metadata on co-investigators has not
been information generally or uniformly indexed by funding bodies. Analyses of collaborative funding
exist, but usually at institutional level and not for subject-based units within institutions.
No ‘grant typology’ exists or has been widely debated, whereas publications have an established
typology of articles, reviews, conference proceedings, books, grey literature and so on. Grants vary
in size and scope, in the degree to which they include different aspects of research cost (core staff,
project staff, support staff, consumables, equipment, infrastructure costs, etc.) and whether they are
directed (part of a defined programme) or responsive (curiosity driven). All these factors could
interact with whether the project is structured as ID/MD.
Grant data are variably accessible. Not all jurisdictions yet have policies that make data on publicly
supported activity, such as research funding, openly available. In some cases the readiness to expose
such data may be partial, covering only some agencies or some programmes, or on a basis unhelpful
to analytics.
4 The 2015 OECD Frascati Manual is available at http://www.oecd.org/publications/frascati-manual-2015-9789264239012-en.htm
Assessment of interdisciplinary research, November 2016 17
Grant metadata are variable. The issue of co-PIs (noted above) is one problem since in the absence
of disciplinary affiliations for all investigators the MD analysis is constrained. Furthermore, the extent
to which descriptive text is accessible is driven not only by grant size (with less information for small
grants) but also by variable local policies. The volume of descriptive text influences the ID/MD
analysis.
Length of reference lists is a significant problem in which data and analysis are multiply confounded.
A longer reference list provides more data points for analysis; not all references are actually indexed
in the source database (because they are not all journal articles and because not all journals are
covered); thus, a longer reference list also provides more usable data. Longer lists enhance analysis
and short lists may provide little useful data. However, there is an apparent positive correlation
between the degree of interdisciplinarity and the length of reference lists (Campbell et al, 2015). To
overcome the influence of this interaction, it is possible to apply a cut-off, restrict data to papers
with a reference list of some minimum size, and then apply this uniformly. Even so, a caveat is that
there may be journal factors (editors can restrict reference lists) and cultural factors (both the
disciplinary tendency to reference and the predominant length of research reports) that would affect
the balance of data samples.
Access to full text for journal articles would provide a third route to ID analysis, independent of
author addresses and reference lists, and providing comparability with full text analysis of project
grant descriptions. However, at this time, such full text analysis is not generally available for a wide
sample of journals by region and subject.
Countries covered in this report
Countries were selected to increase the comparability of methodological outcomes and to compare
UK research with two groups of similar, globally competitive research economies. A broader global
comparison would tend to add sources of difference. Data were sought on:
• Australia and Canada are Anglophone countries with university-focussed research bases similar
to the UK. This group has significant comparability via historical links, inter-mobility of staff,
similar research base structures and extensive shared literature. Because of the common
structures, grant awarding also bears reasonable similarities. The major problem is relatively
recent changes in research and funding policy, especially in Canada; this points to a possible
more general challenge to finance data utility and comparability.
• Germany, the Netherlands and Sweden are European countries sharing the UK regional policy
environment. This group operate in the same region, have extended historical development and
political structure, but are more varied in institutional structure. While the UK, Netherlands and
Sweden have a strong university research base, Germany has a strong suite of mission-led
research institutions (such as the Max Planck and Helmholtz networks) that creates structural
differences in diversity.
Assessment of interdisciplinary research, November 2016 18
• UK data for comparison with both these.
Factors appear to come into play for small countries and perhaps for smaller discipline categories
(but note that categories may or may not map well onto real community networks) that then affect
indicator analyses. When a researcher looks for collaborators in a small network/economy they may
spread their net more widely than in a country/field where there are larger networks. That may also
influence the national policy environment and hence funding and other behavioural drivers.
The input (funding) data in this report
Input data were sourced from the ÜberResearch Dimensions database of research grants and
analysed by Digital Science. These records contain information on principal investigators (PIs), their
affiliations, the project title and description, the start and end dates, the size of the grant and the
awarding body.
• Data available varied considerably between countries due to differences in national research
policy, the ways in which funding is distributed and – consequently – the ways in which data are
presently accessible.
• Affiliation data is often only publicly available only for the lead PI, not the other principals, usually
because this affiliation identifies the contracting organisation to the funder (holding the original
database). Consequently, the analysis of MD teams via the categorisation of investigator
addresses cannot be generally applied. (A more comprehensive analysis could be done within
funding body databases but it would lack global reference for disciplinary disparity.)
• The funding data available for Australia and Canada were relatively comprehensive. However,
the funding of university research in Canada has changed relatively recently; that academics have
to source more of their own salary to support research activity; there are also many small
project grants. Ad personam and small grants are innately less likely to engage MD teams because
of their focus. Many smaller grants lacked sufficient text and metadata for analysis, however, and
were therefore omitted from consideration.
• For the European comparators, research grant data available through the various
national/regional funding agencies are not yet comprehensive, which reduces comparability
significantly. It was therefore necessary to reduce the scope of the UK-Europe comparisons to
focus only on grants sourced on a common basis through the European Commission Framework
and European Research Council programmes.
The output (publication) data in this report
Output data were journal articles:
• Sourced from Thomson Reuters Web of ScienceTM (WoS) and analysed by Science-Metrix.
• Sourced from PubMed and analysed by Digital Science.
Assessment of interdisciplinary research, November 2016 19
Note that journals are not the primary medium of research communication for the arts, humanities
and most social sciences. Databases such as WoS and Elsevier’s Scopus have only a fraction of the
journal article publications published in the arts and humanities and only some of the social sciences
(i.e. primarily excluding economics).
WoS data were reduced to citable documents (i.e. excluding proceedings and journal ephemera).
Records contain information on: authors, their affiliations, journal information; and reference lists.
• Author affiliations are reliable but the discipline of the author and the discipline of the affiliation
are not universally synonymous: Rafols (2009) provides examples of this.
• WoS journal categories are clusters of serials with a high level of co-citation. This supports
‘search and discovery’ and usually mirrors disciplines recognised by researchers but the
granularity is finer in STEM than elsewhere and does not generally mirror institutional structures
in affiliation/address data, which therefore require separate categorisation.
• WoS cannot cover all the sources in reference lists of articles that it indexes. A variable fraction
of any article’s references are indexed (this is worse for data sources that have less historical
depth) and this fraction is not uniformly distributed across years and research categories.
Article data were sourced from PubMed so that abstract text could be analysed by Digital Science
• PubMed records are focussed on clinical, biomedical and health research and therefore provide
both a disciplinarily limited data source and therefore a limited and unbalanced global network in
relation to general research disciplinary diversity.
Assessment of interdisciplinary research, November 2016 20
ANNEX C: Methodology
As noted in Annex A, for the assessment of interdisciplinarity, Stirling (2008) has drawn attention to
the need to describe disciplinary variety, to account for the balance (or relative frequency) of these
varieties and to have a reference background to measure disparity (or the distance between the
varieties). A significant part of methodological development is about accounting for these measures.
Variety – categorising disciplines
To standardise the diversity assessments in this report, insofar as possible, a common structure was
agreed for the ‘variety’ of disciplines. This used the discipline category structure set by the Fields of
Research (FoR) within the Australia and New Zealand Standard Research Classification (ANZSRC,
2008). The ANZSRC system is independent of any commercial data structure and has been widely
adopted by analysts. It is a hierarchical classification of subject-based categories for which the
Australian Research Council secretariat worked with academic experts to map journals by field and
subfield of research.
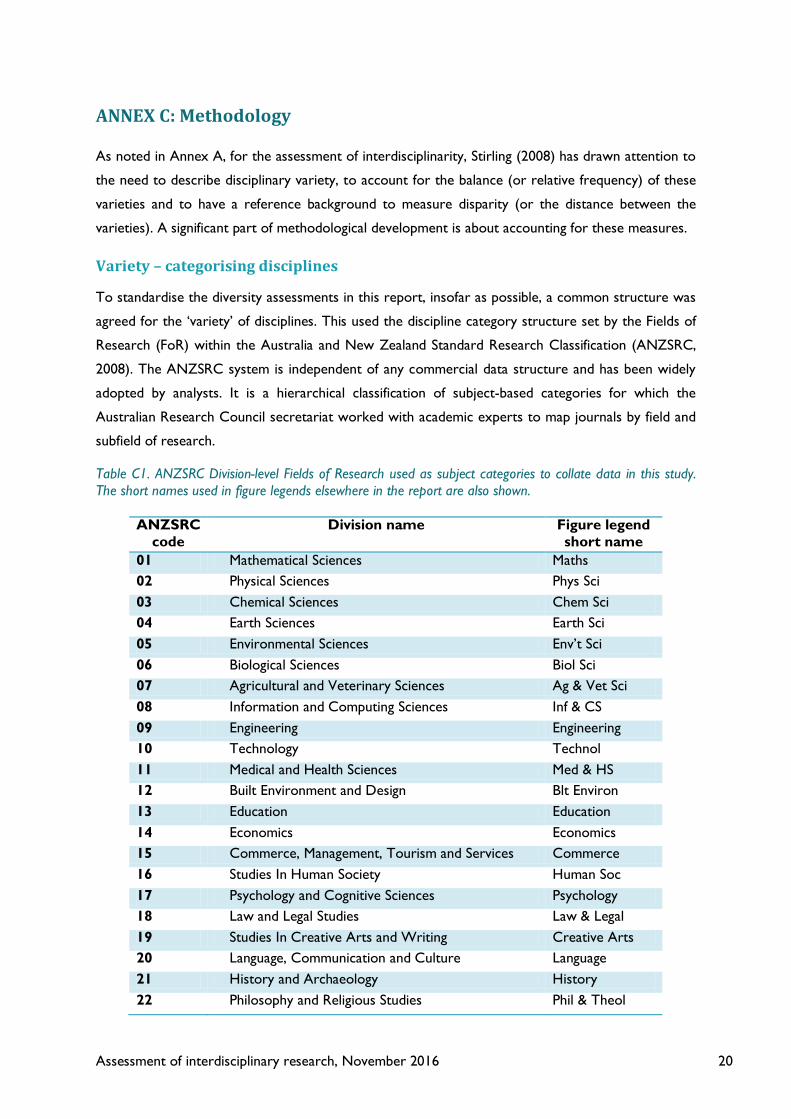
Table C1. ANZSRC Division-level Fields of Research used as subject categories to collate data in this study. The short names used in figure legends elsewhere in the report are also shown.
ANZSRC code
Division name Figure legend short name
01 Mathematical Sciences Maths 02 Physical Sciences Phys Sci 03 Chemical Sciences Chem Sci 04 Earth Sciences Earth Sci 05 Environmental Sciences Env’t Sci 06 Biological Sciences Biol Sci 07 Agricultural and Veterinary Sciences Ag & Vet Sci 08 Information and Computing Sciences Inf & CS 09 Engineering Engineering 10 Technology Technol 11 Medical and Health Sciences Med & HS 12 Built Environment and Design Blt Environ 13 Education Education 14 Economics Economics 15 Commerce, Management, Tourism and Services Commerce 16 Studies In Human Society Human Soc 17 Psychology and Cognitive Sciences Psychology 18 Law and Legal Studies Law & Legal 19 Studies In Creative Arts and Writing Creative Arts 20 Language, Communication and Culture Language 21 History and Archaeology History 22 Philosophy and Religious Studies Phil & Theol
Assessment of interdisciplinary research, November 2016 21
The ANZSRC system has a hierarchy of categories: Divisions (2 digit level) are 22 broad areas, e.g.
“01 Mathematical Sciences”, while Groups (4 digit level) are 157 detailed sub-areas, e.g. “Pure
Mathematics” lies within “Mathematical Sciences”; and there is a further more specific layer of 1,238
Fields (6 digit level).
Issues of balance and disparity are complex and are dealt with differently according to data source
and metadata associated with the records for grants and articles.
Assigning variety to funding and PubMed article data
A number of variables need to be identified for all the analytical data, including dates and locations.
Of these, a standardised assignment of variety is the most challenging because data compilers use
different categorical structures.
In analyzing text (for a grant or an article summary), Digital Science can algorithmically assign fields
but does not apply a balance count to these assignments. In other words, phrases in a summary text
may associate it with ‘physical sciences’ while other phrases associate it with ‘biological sciences’.
However, numbers cannot then be assigned to describe the balance between the two: there is no
robust notion of balance in varietal assignments from a single text section.
ÜberResearch’s Dimensions platform indexes funding data from a variety of sources. Each research
grant (or award) is associated with a country through the institutions that receive the grant. Each has
a start date (used in this analysis) and has or will later have an end date. The co-investigator address
metadata proved to be too sparse to provide enough information for any comparative MD team
analysis: most funding bodies provide detailed investigator address data (disciplinary structure within
the host organisation) only for the contractual lead PI and not for co-investigators. The analysis
would be entirely feasible if all co-investigator address were published, but a large number of funding
bodies would need to do this to make the dataset sufficiently global.
For the research grant text analysis, the data were extracted from the Dimensions system in July
2015. The annual count for comparable Anglophone countries with good temporal and subject area
coverage suggests that data for 2006-2013 were sufficiently well populated for informative analyses.
The aggregated USD value of these reflects the much larger relative size of the UK research base.
There was also a declining trajectory for Canadian research grants, due to changes in research policy
and funding. The figures suggest that Canada has an increasing frequency of relatively low-value
funding awards, which we believe is associated with ad personam research support rather than
specific activity and grant awards. However, funding modes are not readily separated.
Abstracts from the PubMed publication database were extracted at the end of 2015. This database
has good coverage back into the 1990s and is focused in the biomedical sciences. It presently
contains records for around 10 million articles.
Assessment of interdisciplinary research, November 2016 22
The text for the grant and article abstracts was classified and tagged with between zero and five
ANZSRC FoR Group 4-digit level categories. All analysis in this report relies on the classification at
this level but for overviews, or where data are sparse, some results are aggregated to the higher
level Divisions. The classifier relies on supervised machine learning: the algorithm has ‘learnt’ to
recognize text associated with FoR Groups through exposure to manually classified text. The
technology was applied and manually validated for the analysis of REF impact case study text (King’s
College London, 2015) and subsequently updated.
After assigning FoRs to each abstract in a dataset, the spread was aggregated across FoR Divisions as
a percentage count (and percentage value for grants). For PubMed articles, national differences were
not evaluated as the purpose was to test the feasibility and generic outcome of text analysis of
interdisciplinarity when applied to a specific article set.
For grants, differences between countries in the relative spread of resource across subject areas are
expected, because of historical and policy differences and the degree of specialism in national
portfolios. However, the broad impression is of a similar balance of activity for the three
Anglophone research economies. Australia appears to give a particular emphasis to medical and
health sciences but this is also the Division with the greatest level of activity for Canada and the UK
so this is a matter of degree rather than substantive difference.
The global grants’ set cannot be pooled because European research funding data were not as broadly
based as those for the Anglophone countries and the balance of block grants and project grants also
differs. There is a usable volume of grants in core natural sciences, engineering and ICT (which
collectively account for two-thirds of the data by count of awards) but other Divisions are sparser.
Comparable analyses for the UK and other countries can be performed, however, because the
coverage is derived from the same set of funding programmes for each country.
Calculating disparity for funding and PubMed article data
A reference structure is required to introduce a measure of disparity (the conceptual distance
between disciplinary varieties) to the calculation of an ID index because there is no common
structure. The same methodology was used for calculating disparity in the Dimensions grants data
and the PubMed article data.
The Anglophone and European funding data are only partial sets, albeit for historically well-
established research economies, so it might reasonably be argued that even collectively they would
not reflect a ‘global’ pattern of funding disparity since the priorities of e.g. BRIC economies might
differ markedly and the emergent pattern of global interdisciplinarity would then diverge. However,
this is the most informative data source available and by aggregating the total Anglophone and
European data we arrive at the best available ‘global’ reference.
The PubMed article data are evidently a partial set since the data base is specifically established to
support medical and related sciences. However, it is global in coverage.
Assessment of interdisciplinary research, November 2016 23
Given a set of objects with known FoR classifications, we can use the objects themselves to look for
similar FoR Groups: if two FoRs often appear on the same objects, then we define these as being
more similar to each other than two FoRs that rarely appear together. The search is extended to
overlapping classifications across the full set of 157 Group-level FoRs. Mathematically, we use
vectors to represent FoRs in terms of their overlap with other FoRs. To go from these vectors to a
numerical measure of distance we choose to use the cosine distance. This gives a numerical distance
ranging from 0 to 1 between all 24,492 FoR pairings. Two FoRs with a distance of 1 are maximally
separated (they never appear together), and two FoRs with a distance of 0 are as close as possible
(they always appear together). The sense of this is shown by examples of the closest pairs, with the
smallest distance measure, and the most distant pairs, that never appear together. The ‘distances’ in
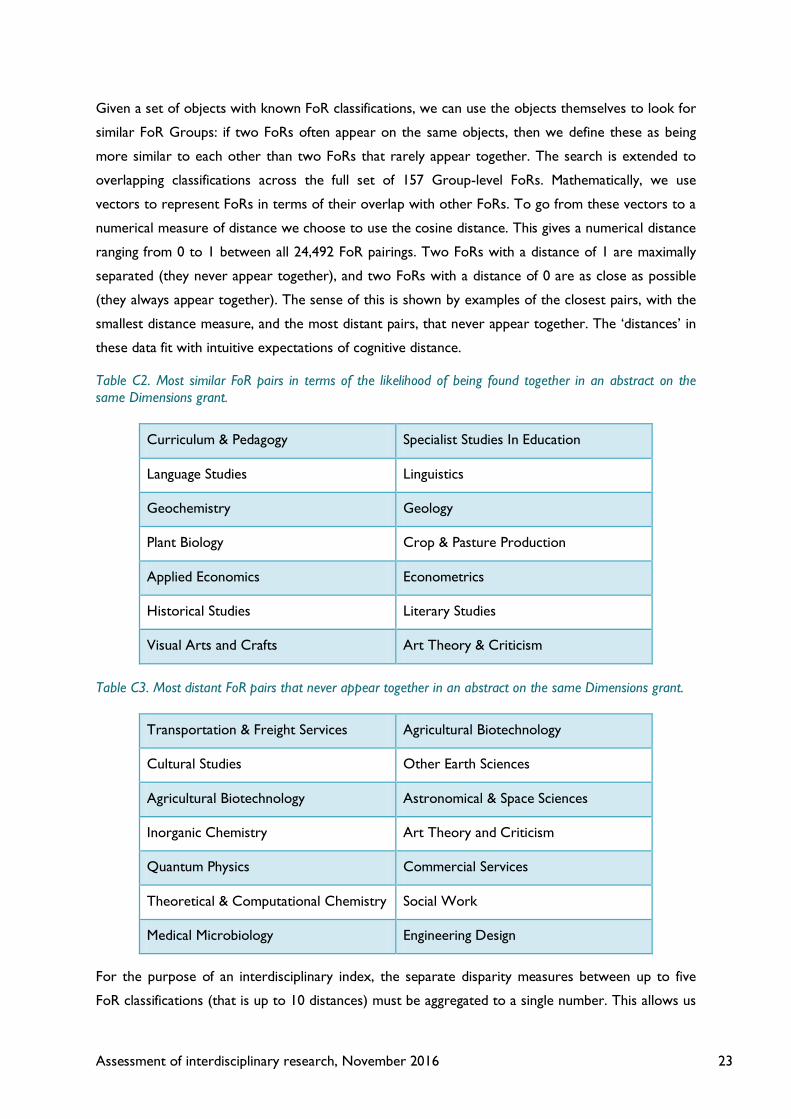
these data fit with intuitive expectations of cognitive distance.
Table C2. Most similar FoR pairs in terms of the likelihood of being found together in an abstract on the same Dimensions grant.
Curriculum & Pedagogy Specialist Studies In Education
Language Studies Linguistics
Geochemistry Geology
Plant Biology Crop & Pasture Production
Applied Economics Econometrics
Historical Studies Literary Studies
Visual Arts and Crafts Art Theory & Criticism
Table C3. Most distant FoR pairs that never appear together in an abstract on the same Dimensions grant.
Transportation & Freight Services Agricultural Biotechnology
Cultural Studies Other Earth Sciences
Agricultural Biotechnology Astronomical & Space Sciences
Inorganic Chemistry Art Theory and Criticism
Quantum Physics Commercial Services
Theoretical & Computational Chemistry Social Work
Medical Microbiology Engineering Design
For the purpose of an interdisciplinary index, the separate disparity measures between up to five
FoR classifications (that is up to 10 distances) must be aggregated to a single number. This allows us
Assessment of interdisciplinary research, November 2016 24
to comment on, say, the interdisciplinarity of the grants’ text associated with Biological Sciences, and
compare this year on year.
To create a single distance (cf. disparity) measure for an object (a grant or article summary text) we
choose the maximal distance of the (up to) 10 possibilities, for the relevant grants or articles
dataset5. This gives a sense of the closeness of the most uncommon combination of FoRs that are
seen together. Taking the maximum distance, representing the most disparate disciplinary
combination, as our measure of interdisciplinarity at the object level, we are able to order all objects
according to their interdisciplinarity score. We then use the ratio of objects with disparate FoRs to
those with only “close” FoRs, to index the interdisciplinarity of a group.
Assigning variety and calculating balance in Web of ScienceTM publication data
For the purposes of denoting varieties in this analysis, each journal in Thomson Reuters Web of
ScienceTM, normally assigned to standard commercial categories, are reassigned to the ANZSRC
system.
Both the MD and ID index are based on the integration metric of Porter & Rafols (2009; see also
Rafols and Meyer, 2010) to quantify the diversity (i.e. variety, balance and distance) of disciplines in,
respectively, the departmental affiliations of a papers’ authors and its reference list. It consists of
measuring the diversity of disciplines relative to a reference set of papers.
Article addresses
The MD index computed by Science-Metrix uses the author address fields associated with each
articles and review in the entire Web of Science. Author addresses are allocated to disciplines based
on their departmental affiliations. Careful judgement was required to assign address to discipline. In a
first step, addresses were manually attributed to a discipline using department names. Building on
this seed, the manual attribution of disciplines was validated using an algorithm which re-classified
each departmental address to the core groups of disciplines established in the first round. This
algorithm computed an affinity score (Archambault et al., 2011) for each pair of departmental
addresses and disciplinary groups to identify the most relevant. Where the most relevant group
differed from that assigned via manual attribution, verifications was required and a final decision was
made as to classification. Subsequently, this approach was used in a second round to attribute the
departmental addresses that were not initially treated in the manual attribution.
Some 129 distinct disciplines (or department types) emerged (these are not based on the FoR
classification, but rather reflect the most common departmental structure found in HE institutions).
5 Measures of the average (mean or median, specifically) across the set of distances associated with any one object are correlated with the number of distance measures between FoRs for that object. This means that for an object with five FoRs we are more likely to find that the average distance is greater than for an object with just two FoRs. The maximum distance gives a better sense of the interesting FoR combinations.

Assessment of interdisciplinary research, November 2016 25
The number of occurrences of each of the 129 disciplines within the departmental addresses of a
publication was then used to create a publication vector.
This vector was used to compute the MD index of each publication using the integration metric of
Porter and Rafols (2009). The multidisciplinarity of each publication within the database is thus
measured by comparing the frequency distribution of disciplines within its departmental addresses to
a proximity matrix between disciplines (pairwise similarity of the 129 disciplines based the
distribution across FOR subfields (journal categories) of each of the 129 disciplines based on the
publications falling in each disciplines based on their departmental addresses (note the attribution of
publications across disciplines based on departmental addresses is not mutually exclusive).
This approach gives more weight to unusual co-occurring disciplines relative to those that are
common. In other words, a publication authored by researchers from Microbiology and Religious
Studies will have a more multidisciplinary index than one authored from Microbiology and
Immunology. Using this computation method, each publication was given a MD value ranging from 0
(monodisciplinary) to 1 (highly multidisciplinary). Subsequently, the MD of an entity (e.g., country) is
obtained by averaging the scores of its publications.
The average percentage of a publication's departmental addresses that have been successfully
classified was analysed across research field (FoR), year and country to identify potentially
problematic biases. Science-Metrix observed no important biases that made it necessary to
normalise the papers' MD scores (see below).
Table C4. Average number and average percentage of classified addresses per paper for select countries (2004 – 2013). Source: Computed by Science-Metrix using Thomson Reuters Web of ScienceTM data
Selected countries Average number
of classified addresses
Average number of addresses
Average % classified
addresses/paper
Australia 3.08 4.66 74%
Canada 3.25 4.79 77%
Germany 3.09 4.88 74%
Netherlands 3.69 5.80 74%
Sweden 3.79 5.73 77%
United Kingdom 3.06 4.74 75%

Assessment of interdisciplinary research, November 2016 26
Table C5. Average number and average percentage of classified addresses per paper in Thomson Reuters Web of ScienceTM across Fields of Research (FoR) for select countries (see Table C4) (2004 – 2013)
FoR Group Average number
of classified addresses
Average number of addresses
Average % classified
addresses/paper
Physical Sciences 3.29 6.34 69%
Medical & Health Sciences 3.15 4.28 78%
Unclassified 2.69 4.21 74%
Multidisciplinary 2.92 4.19 74%
Biological Sciences 2.85 3.83 78%
Earth Sciences 2.42 3.70 70%
Technology 2.57 3.62 74%
Environmental Sciences 2.43 3.62 72%
History & Archaeology 2.24 3.45 69%
Agricultural & Veterinary Sciences 2.29 3.32 73%
Psychology & Cognitive Sciences 2.44 3.27 78%
Education 2.15 3.12 73%
Mathematical Sciences 2.31 3.08 81%
Chemical Sciences 2.34 3.07 79%
Engineering 2.11 3.00 74%
Studies In Human Society 2.01 2.98 71%
Economics 1.98 2.88 73%
Information & Computing Sciences 2.11 2.87 77%
Commerce, Management, Tourism 2.00 2.78 76%
Studies In Creative Arts & Writing 1.77 2.76 68%
Law And Legal Studies 1.86 2.74 73%
Built Environment & Design 1.85 2.70 73%
Philosophy & Religious Studies 1.88 2.69 73%
Language, Communication & Culture 1.56 2.46 67%
For Thomson Reuters Web of ScienceTM database as a whole and for the countries selected for
analysis in this study, an identification/classification rate between 70% and 80% was achieved for each
Assessment of interdisciplinary research, November 2016 27
data year. The average number of address increased from 3.1 in 2004 to 3.7 in 2013, with the
number of classified addresses increasing from 2.4 to 2.7. The numbers of addresses was slightly
higher for the select countries, rising to 4.6 in 2013 but with only 74% being classified compared to
78% overall. There are on average more addresses on publications with Netherlands and Swedish
co-authorship than on other papers. There is very little difference for the average address count for
the other four countries. The number of addresses per publication was higher on average in natural
sciences but the percentage classifiable showed no clear pattern.
Article reference lists
For the analysis of article reference lists, the ID index computed by Science-Metrix uses the FoR
disciplines (4-digit). The ID score of each publication within the database is measured by comparing
the frequency distribution of subfields within its references to a proximity matrix between disciplines
(pairwise similarity of disciplines based on their co-occurrence patterns within the references of
individual publication in the database as a whole).
This approach gives more weight to unusual co-citation patterns relative to those that are very
common. As such, a publication co-citing publications from the subfields of plant biology and law
would have a higher ID score than one co-citing papers from the subfields of plant biology and
pharmacology & pharmaceutical sciences.
Applying this computation method, each publication receives an ID score ranging from 0 (mono-
disciplinary) to 1 (highly interdisciplinary). Subsequently, the ID of an entity (e.g., country) can be
obtained by averaging the scores of its publications (the general behaviour of the entity) or by
computing the proportion of its publications falling within the 10% most interdisciplinary in the
database (the degree to which the entity produces highly interdisciplinary work).
A correlation has been observed between the number of references indexed in the commercial
source and the average ID score of publications with a given number of such references. Reviews
behave differently in terms of the number of references they typically include and this could be a
reason for rejecting reviews and analysing only articles. This was not found to impact the metrics,
however, and in this instance reviews were retained in the analysis.
It is known that Thomson Reuters Web of ScienceTM data include a relatively greater number of
science/technology journals than of social science/humanities journals. Consequently, the likelihood
of matched and unmatched references must vary across disciplinary boundaries. Science-Metrix has
shown that “interdisciplinarity” scores increase rapidly from publications having zero classified and
matched references to publications having 30 or more references matched to journals in the
database (the ID scores are understood to present a slight and linear increase beyond that point,
although the variation by field is unspecified). Important biases could therefore prevail when using
the average of the “interdisciplinarity” scores across an entity’s publications.
Assessment of interdisciplinary research, November 2016 28
Note that more than one effect is in play. It may be that the ID score rises with match rate (because
a greater number of references will reveal links to more categories) and it may be that ID papers are
innately more likely to have longer reference lists (because ID research necessarily draws on a
greater number of categories, requiring more referencing). Whatever the driving factor, the solution
is to enable greater comparability between samples. In prior studies (e.g. Campbell et al., 2015),
Science-Metrix has dealt with the issue by:
• Normalising the ID score of papers by their number of classified references (which here led to
an over-normalisation of the scores).
• Analysing in each category the 1% of papers with the largest number of references to ensure
that:
o Few papers in any category have fewer than 30 classified references.
o All categories are represented proportionately to their overall occurrence.
• Computing an aggregated ID metric for the proportion of retained papers falling in the 10% of
papers with the highest ID score (typically scores of at least 0.70) subject to threshold volume of
100 papers.
A similar approach was applied to Thomson Reuters Web of ScienceTM data in this study. A downside
of omitting papers with only a small number of references is that ‘variety’ (the number of distinct
disciplines identified by article references) might be given less weight than the ‘balance’ and
‘distance’.
A further analytical constraint on computing the ID metric becomes apparent at a disaggregated
level. The volume filter (i.e. the 1% of papers with the largest number of classified references in each
category) markedly reduces the possibility of providing reliable data by year and by FoR. Relatively
small samples of the initial article population are retained for analysis and many index values appear
as not applicable because the final sample size is less than 100 articles.
To reduce the number of not applicable cases, less stringent filters were applied:
• Limit at the 10% of papers with the greatest number of classified references in each category
• Limit at the 10% of papers with the highest percentage of classified references in each category
(this also retains the emphasis on ‘variety’)
• Limit at the 20% of papers with the highest percentage of classified references in each category
(again retaining emphasis on ‘variety’).
The 1% threshold may cause some concern as it focusses the analysis on what might be seen as an
outlier group of papers. While these would be comparable outliers for each sample, and for
categories within each sample, there would nonetheless be reasonable doubt that they were truly
representative. Reducing the threshold to 20% makes the data more representative while retaining
reasonable albeit less clear-cut comparability.

Assessment of interdisciplinary research, November 2016 29
Science-Metrix tested data in this report aggregated at the ANZSRC Division level and considered
the share of 10% most interdisciplinary articles for 2004–2013 by category (i) among the 1% of
papers with the largest number of classified references by field of research and (ii) among the 20% of
papers with the largest percentage of classified references at world level. Some fields (e.g. Earth
Science, Agriculture) appear less ID, whereas (Philosophy & Theology, Economics) appear more ID
at the 1% than 20% level. Both by category rank and by percentile within category, however, the
overall correlation between results with the 1% and 20% filters is highly significant (P<0.001). (Figure
C1; see also ANNEX E, Figure E1)
Figure C1. Relationship at FoR Division level between the ID index for articles with reference lists limited at a threshold with the 1% longest reference lists and 20% longest reference lists. This trend is statistically significant (rank correlation: r2=0.77, P<0.001).
These approaches were used to study trends in the absolute ID scores of papers by FoR and year
for all countries (i.e. world trends) as well as by country and year for all FoR combined. However,
when moving to the country level by FoR and year, the filters applied substantially reduce the
population size available to compute the ID scores and this could affect the accuracy of the metric.
In this case, a normalisation procedure was used to study trends relative to a world reference. This
allows all papers to be retained (no filter) but does not inform the absolute ID scores. For instance,
if the relative score of a country is rising relative to the world in a given FoR, the absolute ID of the
country might actually be declining if the corresponding ID at world level is decreasing even faster.
To present data for all categories of disaggregated data (i.e. by country, year and FoR) as well as to
eliminate the biases in the database, Science-Metrix implemented an approach similar to the one it
has used to compute the scientific impact of research entities (i.e. the Average of Relative Citations
[ARC] indicator). The interdisciplinary scores of papers were normalised by the average
interdisciplinary scores of all papers in their corresponding subfield and year. Although this approach
0
0.1
0.2
0.3
0.4
0 0.1 0.2 0.3 0.4 0.5
ID in
dex
with
20%
filte
r
ID index with top 1% filter
Assessment of interdisciplinary research, November 2016 30
effectively removes some bias attributable to coverage issues (discussed above), it does not allow
differences to be observed in absolute ID scores, only differences relative to the world reference
level (i.e. score of 1). However, it does enable trends to be monitored regarding the extent to which
countries deviate (positively: score > 1; or negatively: score < 1) from the world level by field of
research or year.
Assessment of interdisciplinary research, November 2016 31
ANNEX D: Input interdisciplinarity – grant summaries
SUMMARY. The calculated values of an interdisciplinary (ID) index based on text analysis of research
grant summaries show no strong overall change during the decade 2005-2014. In both the European group
and the Anglophone group, the natural science and technology disciplines have higher ID index values than
the social science and humanities. The UK has a higher average ID metric than other large research
economies but lower ID than smaller economies. This holds true for a detailed examination of the ID metric
in Biological sciences, where again the index fluctuates and may increase somewhat but does not significantly
change in either dataset.
There is no multidisciplinarity (MD) index for the awards data because, as noted elsewhere, the
address data for co-investigators were insufficient to support the analysis of departmental locations.
The ID index is based on text analysis that identifies FoRs (variety) at the 4-digit Group level within
the ANZSRC system and measures the distance (disparity) between these. The balance between
FoRs cannot be measured with these data. Some national agencies publish (or require) more
extensive grant summaries than others so there is some diversity in the relative volume of
information available from different sources. The UK is compared separately with Anglophone and
with European research economies. In the EU data, it has around 500 grants per year to 2010 and
about 1,000 per year thereafter. In the Anglophone data, it has about 8,000 grants per year.
There is considerable year-to-year variation for smaller economies (Netherlands, Sweden and
Australia) but more consistency for the UK and larger economies (France, Germany and Canada).
There is no strong temporal trend in the ‘grand’ averages for any country but – even setting aside
the initial steep increase – the UK has a slight progressive increase in ID in the Anglophone dataset
which is not seen in the European data.
The substantial annual variation in the ID index across fields for the UK (and the other three larger
economies from both subsets of grants) makes it difficult to discern common patterns but the most
general pattern seems to be one of fluctuation rather than clearly rising or falling trends. At field
level, Inf & CS and Maths have a high ID value while Medicine and Biology have low values.
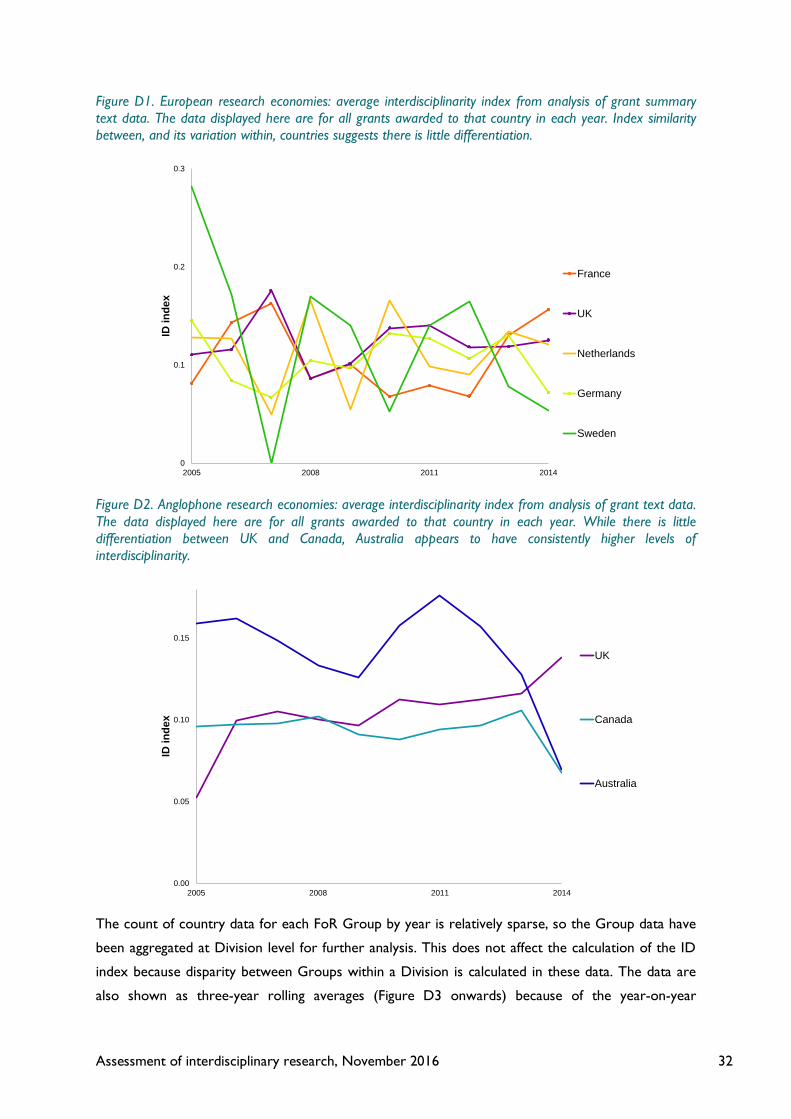
Assessment of interdisciplinary research, November 2016 32
Figure D1. European research economies: average interdisciplinarity index from analysis of grant summary text data. The data displayed here are for all grants awarded to that country in each year. Index similarity between, and its variation within, countries suggests there is little differentiation.
Figure D2. Anglophone research economies: average interdisciplinarity index from analysis of grant text data. The data displayed here are for all grants awarded to that country in each year. While there is little differentiation between UK and Canada, Australia appears to have consistently higher levels of interdisciplinarity.
The count of country data for each FoR Group by year is relatively sparse, so the Group data have
been aggregated at Division level for further analysis. This does not affect the calculation of the ID
index because disparity between Groups within a Division is calculated in these data. The data are
also shown as three-year rolling averages (Figure D3 onwards) because of the year-on-year
0
0.1
0.2
0.3
2005 2008 2011 2014
ID in
dex
France
UK
Netherlands
Germany
Sweden
0.00
0.05
0.10
0.15
2005 2008 2011 2014
ID in
dex
UK
Canada
Australia
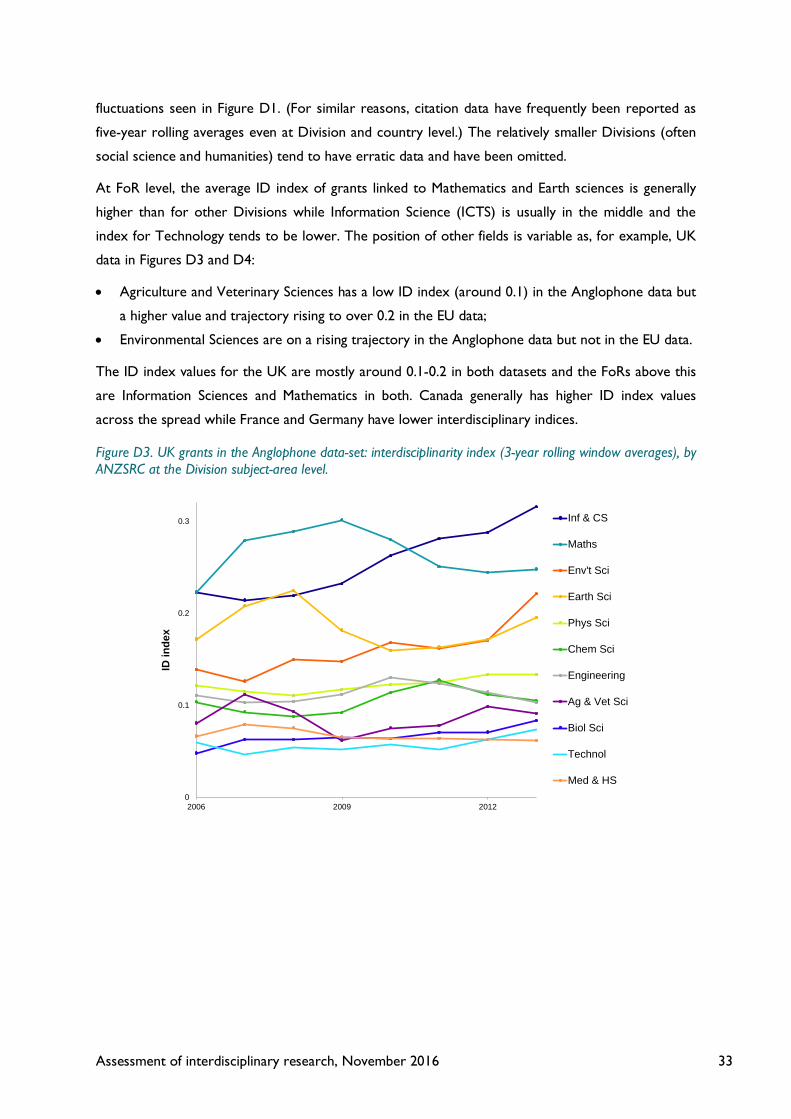
Assessment of interdisciplinary research, November 2016 33
fluctuations seen in Figure D1. (For similar reasons, citation data have frequently been reported as
five-year rolling averages even at Division and country level.) The relatively smaller Divisions (often
social science and humanities) tend to have erratic data and have been omitted.
At FoR level, the average ID index of grants linked to Mathematics and Earth sciences is generally
higher than for other Divisions while Information Science (ICTS) is usually in the middle and the
index for Technology tends to be lower. The position of other fields is variable as, for example, UK
data in Figures D3 and D4:
• Agriculture and Veterinary Sciences has a low ID index (around 0.1) in the Anglophone data but
a higher value and trajectory rising to over 0.2 in the EU data;
• Environmental Sciences are on a rising trajectory in the Anglophone data but not in the EU data.
The ID index values for the UK are mostly around 0.1-0.2 in both datasets and the FoRs above this
are Information Sciences and Mathematics in both. Canada generally has higher ID index values
across the spread while France and Germany have lower interdisciplinary indices.
Figure D3. UK grants in the Anglophone data-set: interdisciplinarity index (3-year rolling window averages), by ANZSRC at the Division subject-area level.
0
0.1
0.2
0.3
2006 2009 2012
ID in
dex
Inf & CS
Maths
Env't Sci
Earth Sci
Phys Sci
Chem Sci
Engineering
Ag & Vet Sci
Biol Sci
Technol
Med & HS
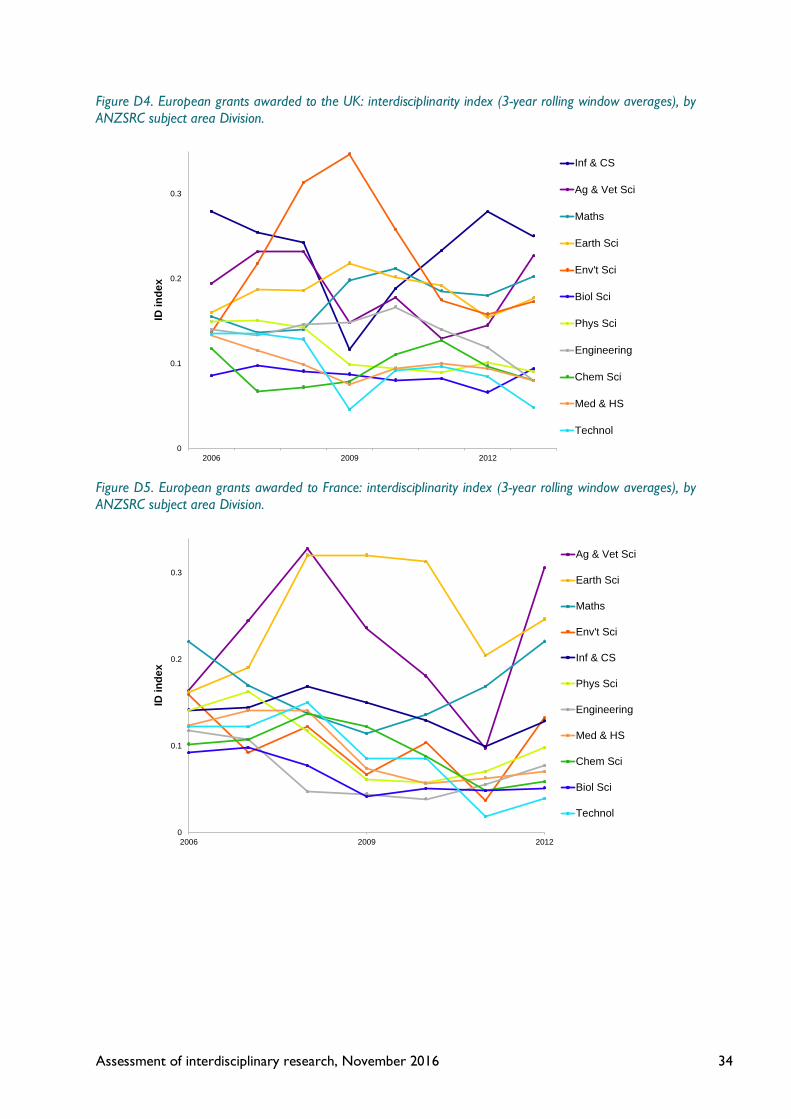
Assessment of interdisciplinary research, November 2016 34
Figure D4. European grants awarded to the UK: interdisciplinarity index (3-year rolling window averages), by ANZSRC subject area Division.
Figure D5. European grants awarded to France: interdisciplinarity index (3-year rolling window averages), by ANZSRC subject area Division.
0
0.1
0.2
0.3
2006 2009 2012
ID in
dex
Inf & CS
Ag & Vet Sci
Maths
Earth Sci
Env't Sci
Biol Sci
Phys Sci
Engineering
Chem Sci
Med & HS
Technol
0
0.1
0.2
0.3
2006 2009 2012
ID in
dex
Ag & Vet Sci
Earth Sci
Maths
Env't Sci
Inf & CS
Phys Sci
Engineering
Med & HS
Chem Sci
Biol Sci
Technol
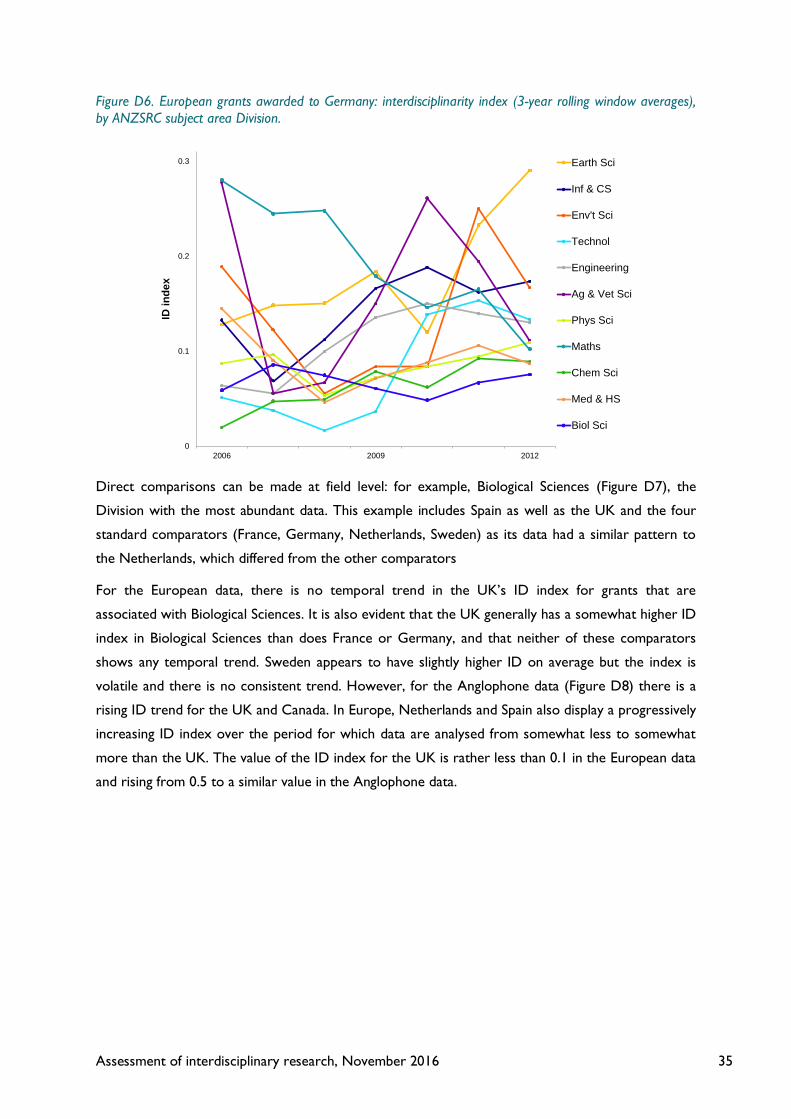
Assessment of interdisciplinary research, November 2016 35
Figure D6. European grants awarded to Germany: interdisciplinarity index (3-year rolling window averages), by ANZSRC subject area Division.
Direct comparisons can be made at field level: for example, Biological Sciences (Figure D7), the
Division with the most abundant data. This example includes Spain as well as the UK and the four
standard comparators (France, Germany, Netherlands, Sweden) as its data had a similar pattern to
the Netherlands, which differed from the other comparators
For the European data, there is no temporal trend in the UK’s ID index for grants that are
associated with Biological Sciences. It is also evident that the UK generally has a somewhat higher ID
index in Biological Sciences than does France or Germany, and that neither of these comparators
shows any temporal trend. Sweden appears to have slightly higher ID on average but the index is
volatile and there is no consistent trend. However, for the Anglophone data (Figure D8) there is a
rising ID trend for the UK and Canada. In Europe, Netherlands and Spain also display a progressively
increasing ID index over the period for which data are analysed from somewhat less to somewhat
more than the UK. The value of the ID index for the UK is rather less than 0.1 in the European data
and rising from 0.5 to a similar value in the Anglophone data.
0
0.1
0.2
0.3
2006 2009 2012
ID in
dex
Earth Sci
Inf & CS
Env't Sci
Technol
Engineering
Ag & Vet Sci
Phys Sci
Maths
Chem Sci
Med & HS
Biol Sci
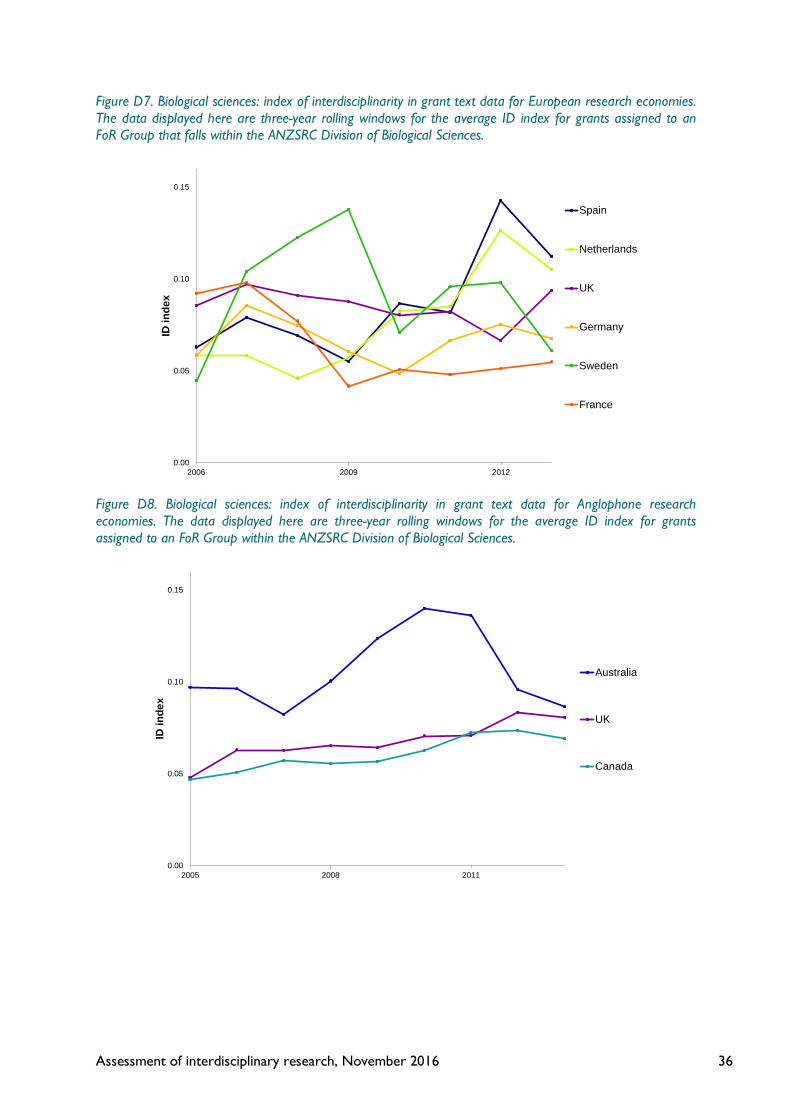
Assessment of interdisciplinary research, November 2016 36
Figure D7. Biological sciences: index of interdisciplinarity in grant text data for European research economies. The data displayed here are three-year rolling windows for the average ID index for grants assigned to an FoR Group that falls within the ANZSRC Division of Biological Sciences.
Figure D8. Biological sciences: index of interdisciplinarity in grant text data for Anglophone research economies. The data displayed here are three-year rolling windows for the average ID index for grants assigned to an FoR Group within the ANZSRC Division of Biological Sciences.
0.00
0.05
0.10
0.15
2006 2009 2012
ID in
dex
Spain
Netherlands
UK
Germany
Sweden
France
0.00
0.05
0.10
0.15
2005 2008 2011
ID in
dex
Australia
UK
Canada
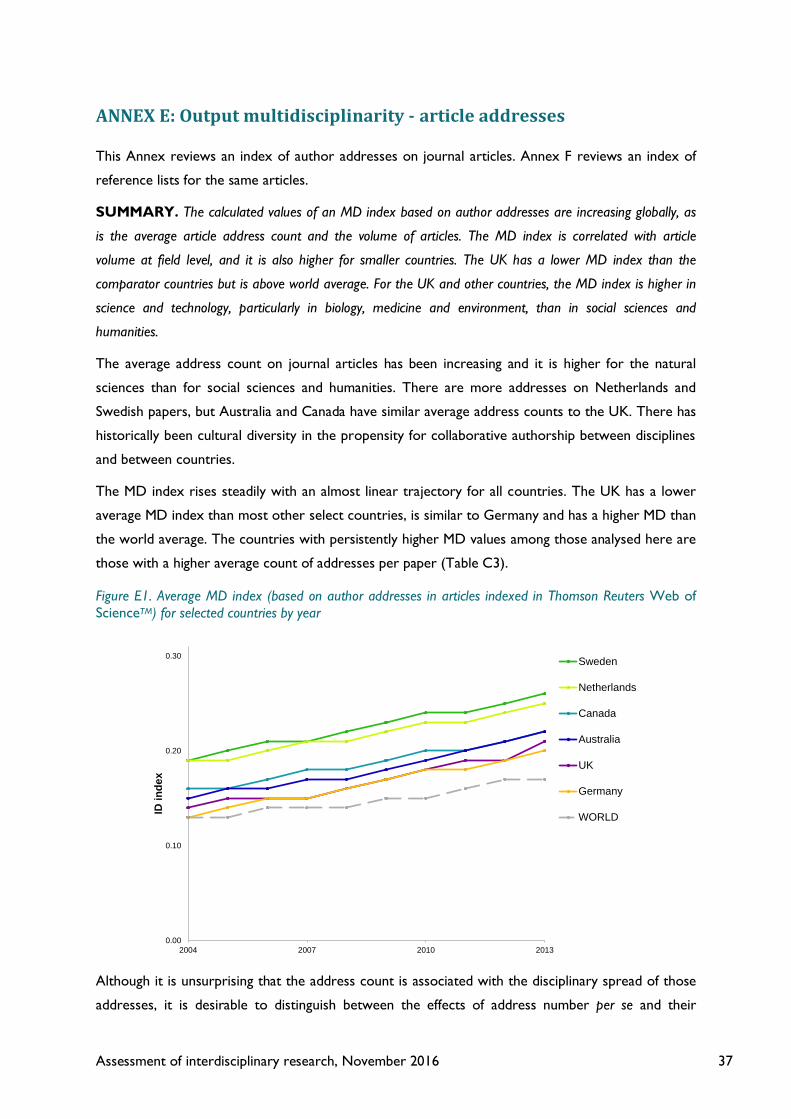
Assessment of interdisciplinary research, November 2016 37
ANNEX E: Output multidisciplinarity - article addresses
This Annex reviews an index of author addresses on journal articles. Annex F reviews an index of
reference lists for the same articles.
SUMMARY. The calculated values of an MD index based on author addresses are increasing globally, as
is the average article address count and the volume of articles. The MD index is correlated with article
volume at field level, and it is also higher for smaller countries. The UK has a lower MD index than the
comparator countries but is above world average. For the UK and other countries, the MD index is higher in
science and technology, particularly in biology, medicine and environment, than in social sciences and
humanities.
The average address count on journal articles has been increasing and it is higher for the natural
sciences than for social sciences and humanities. There are more addresses on Netherlands and
Swedish papers, but Australia and Canada have similar average address counts to the UK. There has
historically been cultural diversity in the propensity for collaborative authorship between disciplines
and between countries.
The MD index rises steadily with an almost linear trajectory for all countries. The UK has a lower
average MD index than most other select countries, is similar to Germany and has a higher MD than
the world average. The countries with persistently higher MD values among those analysed here are
those with a higher average count of addresses per paper (Table C3).
Figure E1. Average MD index (based on author addresses in articles indexed in Thomson Reuters Web of ScienceTM) for selected countries by year
Although it is unsurprising that the address count is associated with the disciplinary spread of those
addresses, it is desirable to distinguish between the effects of address number per se and their
0.00
0.10
0.20
0.30
2004 2007 2010 2013
ID in
dex
Sweden
Netherlands
Canada
Australia
UK
Germany
WORLD
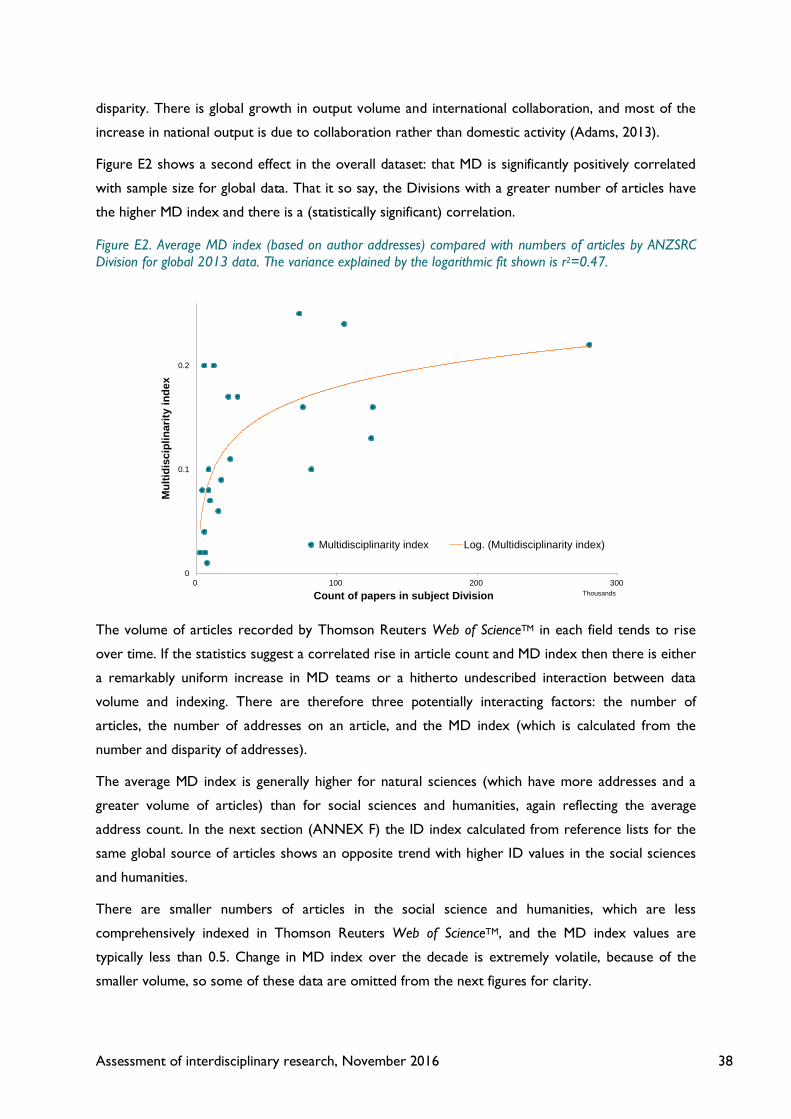
Assessment of interdisciplinary research, November 2016 38
disparity. There is global growth in output volume and international collaboration, and most of the
increase in national output is due to collaboration rather than domestic activity (Adams, 2013).
Figure E2 shows a second effect in the overall dataset: that MD is significantly positively correlated
with sample size for global data. That it so say, the Divisions with a greater number of articles have
the higher MD index and there is a (statistically significant) correlation.
Figure E2. Average MD index (based on author addresses) compared with numbers of articles by ANZSRC Division for global 2013 data. The variance explained by the logarithmic fit shown is r2=0.47.
The volume of articles recorded by Thomson Reuters Web of ScienceTM in each field tends to rise
over time. If the statistics suggest a correlated rise in article count and MD index then there is either
a remarkably uniform increase in MD teams or a hitherto undescribed interaction between data
volume and indexing. There are therefore three potentially interacting factors: the number of
articles, the number of addresses on an article, and the MD index (which is calculated from the
number and disparity of addresses).
The average MD index is generally higher for natural sciences (which have more addresses and a
greater volume of articles) than for social sciences and humanities, again reflecting the average
address count. In the next section (ANNEX F) the ID index calculated from reference lists for the
same global source of articles shows an opposite trend with higher ID values in the social sciences
and humanities.
There are smaller numbers of articles in the social science and humanities, which are less
comprehensively indexed in Thomson Reuters Web of ScienceTM, and the MD index values are
typically less than 0.5. Change in MD index over the decade is extremely volatile, because of the
smaller volume, so some of these data are omitted from the next figures for clarity.
0
0.1
0.2
0 100 200 300
Mul
tidis
cipl
inar
ity in
dex
Count of papers in subject Division Thousands
Multidisciplinarity index Log. (Multidisciplinarity index)
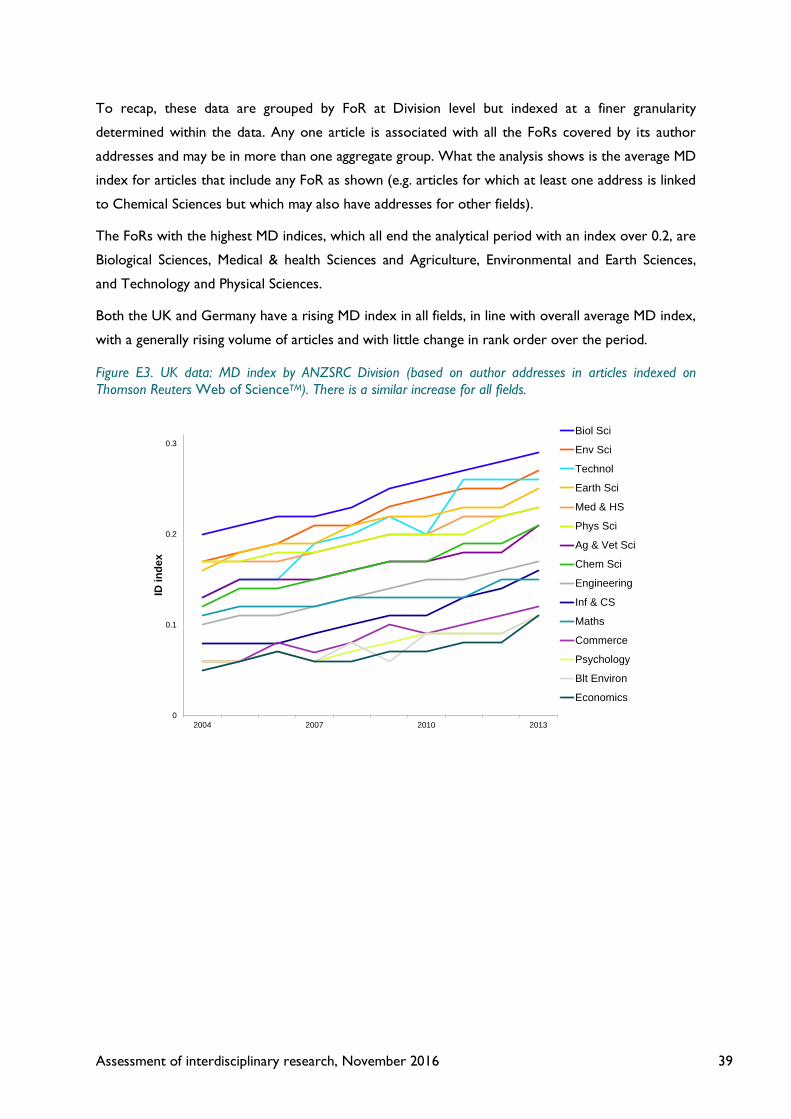
Assessment of interdisciplinary research, November 2016 39
To recap, these data are grouped by FoR at Division level but indexed at a finer granularity
determined within the data. Any one article is associated with all the FoRs covered by its author
addresses and may be in more than one aggregate group. What the analysis shows is the average MD
index for articles that include any FoR as shown (e.g. articles for which at least one address is linked
to Chemical Sciences but which may also have addresses for other fields).
The FoRs with the highest MD indices, which all end the analytical period with an index over 0.2, are
Biological Sciences, Medical & health Sciences and Agriculture, Environmental and Earth Sciences,
and Technology and Physical Sciences.
Both the UK and Germany have a rising MD index in all fields, in line with overall average MD index,
with a generally rising volume of articles and with little change in rank order over the period.
Figure E3. UK data: MD index by ANZSRC Division (based on author addresses in articles indexed on Thomson Reuters Web of ScienceTM). There is a similar increase for all fields.
0
0.1
0.2
0.3
2004 2007 2010 2013
ID in
dex
Biol Sci
Env Sci
Technol
Earth Sci
Med & HS
Phys Sci
Ag & Vet Sci
Chem Sci
Engineering
Inf & CS
Maths
Commerce
Psychology
Blt Environ
Economics
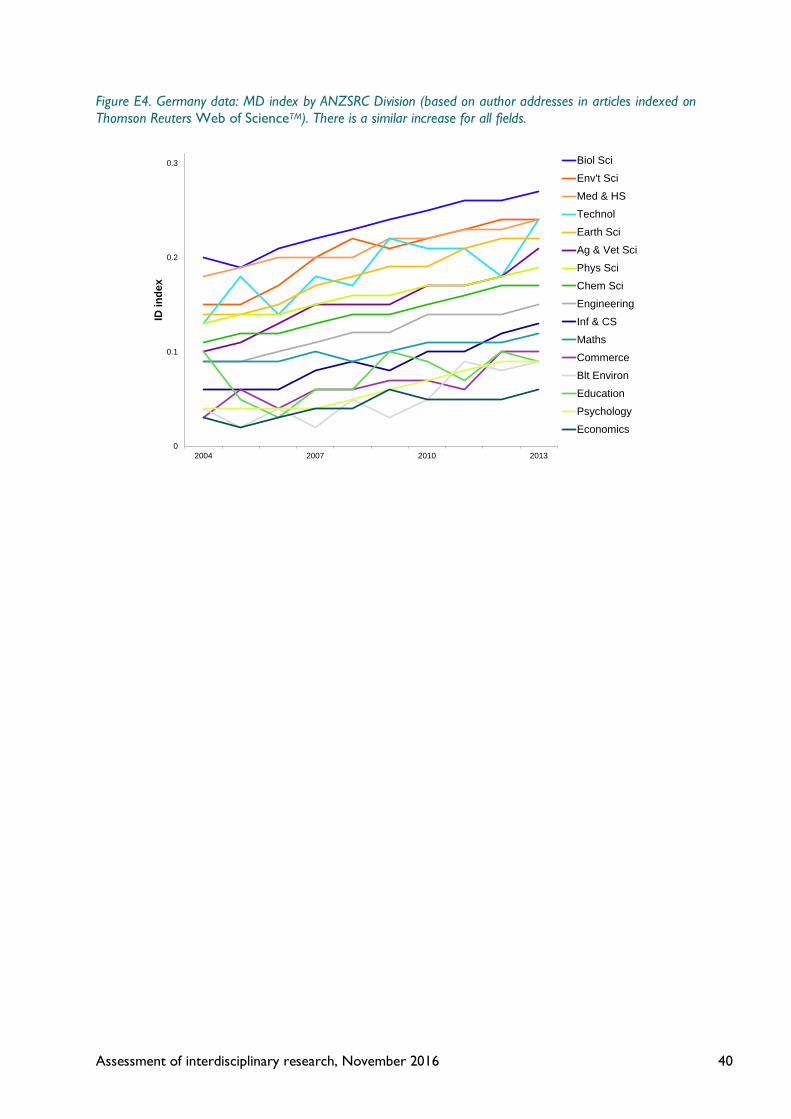
Assessment of interdisciplinary research, November 2016 40
Figure E4. Germany data: MD index by ANZSRC Division (based on author addresses in articles indexed on Thomson Reuters Web of ScienceTM). There is a similar increase for all fields.
0
0.1
0.2
0.3
2004 2007 2010 2013
ID in
dex
Biol Sci
Env't Sci
Med & HS
Technol
Earth Sci
Ag & Vet Sci
Phys Sci
Chem Sci
Engineering
Inf & CS
Maths
Commerce
Blt Environ
Education
Psychology
Economics
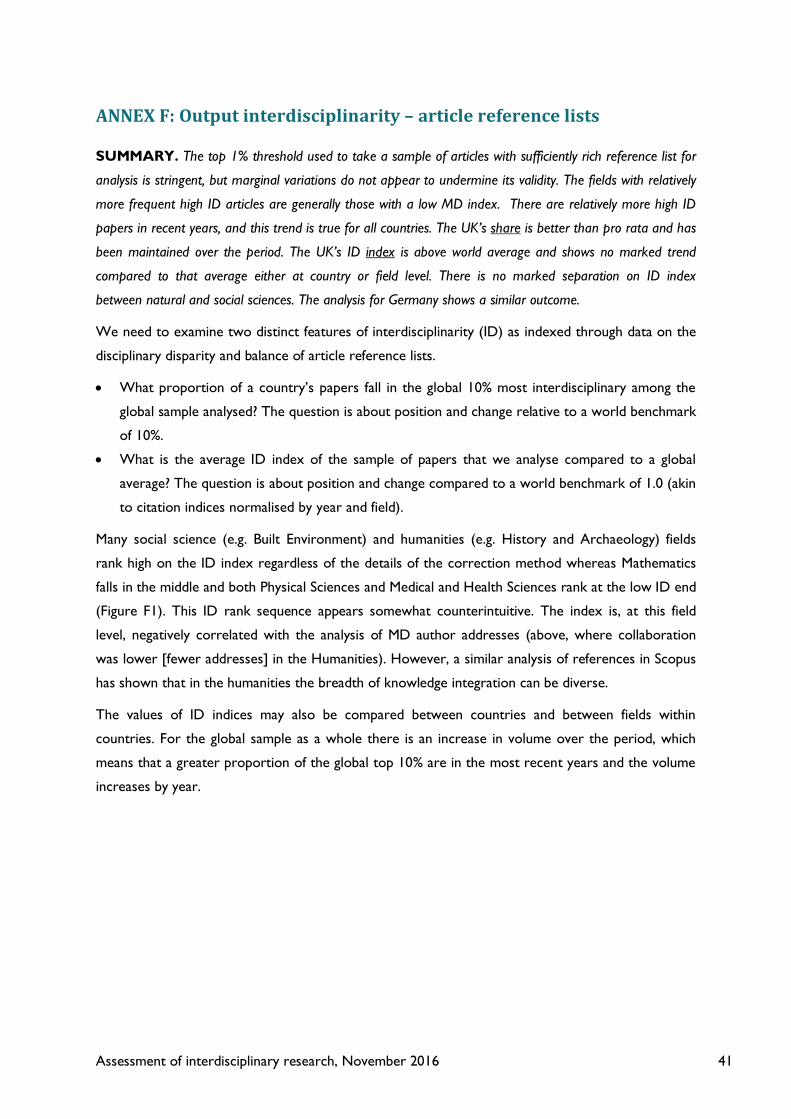
Assessment of interdisciplinary research, November 2016 41
ANNEX F: Output interdisciplinarity – article reference lists
SUMMARY. The top 1% threshold used to take a sample of articles with sufficiently rich reference list for
analysis is stringent, but marginal variations do not appear to undermine its validity. The fields with relatively
more frequent high ID articles are generally those with a low MD index. There are relatively more high ID
papers in recent years, and this trend is true for all countries. The UK’s share is better than pro rata and has
been maintained over the period. The UK’s ID index is above world average and shows no marked trend
compared to that average either at country or field level. There is no marked separation on ID index
between natural and social sciences. The analysis for Germany shows a similar outcome.
We need to examine two distinct features of interdisciplinarity (ID) as indexed through data on the
disciplinary disparity and balance of article reference lists.
• What proportion of a country’s papers fall in the global 10% most interdisciplinary among the
global sample analysed? The question is about position and change relative to a world benchmark
of 10%.
• What is the average ID index of the sample of papers that we analyse compared to a global
average? The question is about position and change compared to a world benchmark of 1.0 (akin
to citation indices normalised by year and field).
Many social science (e.g. Built Environment) and humanities (e.g. History and Archaeology) fields
rank high on the ID index regardless of the details of the correction method whereas Mathematics
falls in the middle and both Physical Sciences and Medical and Health Sciences rank at the low ID end
(Figure F1). This ID rank sequence appears somewhat counterintuitive. The index is, at this field
level, negatively correlated with the analysis of MD author addresses (above, where collaboration
was lower [fewer addresses] in the Humanities). However, a similar analysis of references in Scopus
has shown that in the humanities the breadth of knowledge integration can be diverse.
The values of ID indices may also be compared between countries and between fields within
countries. For the global sample as a whole there is an increase in volume over the period, which
means that a greater proportion of the global top 10% are in the most recent years and the volume
increases by year.
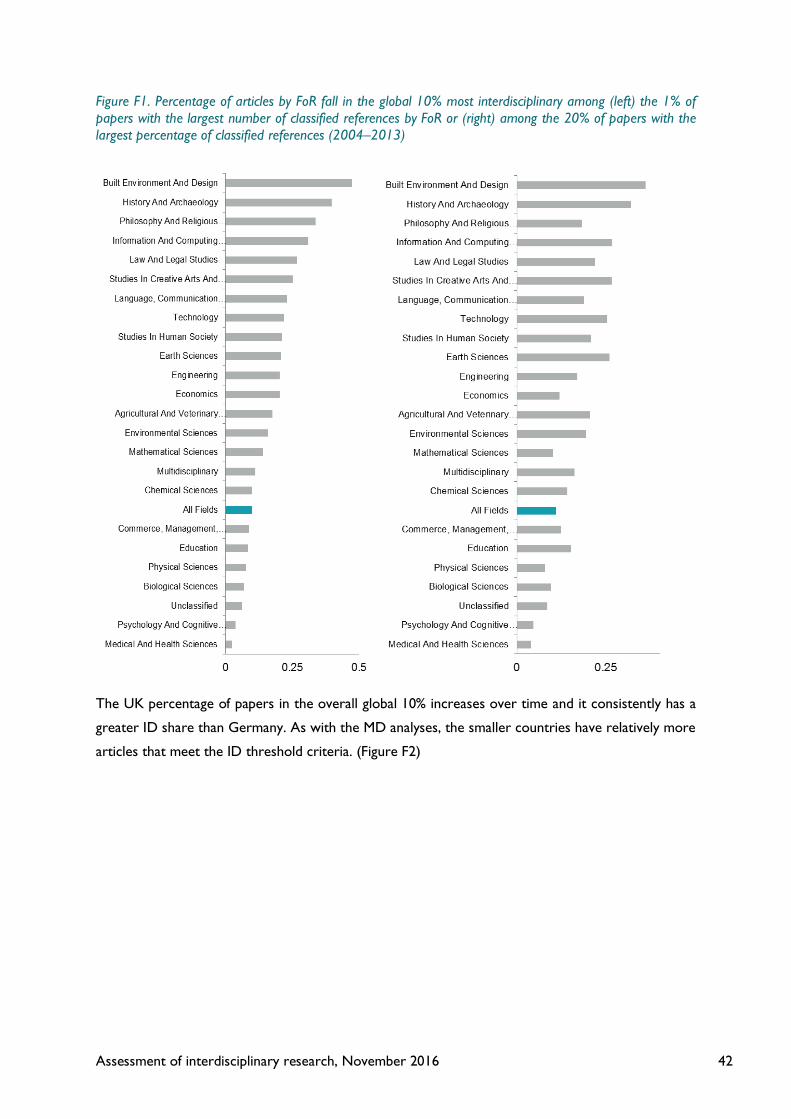
Assessment of interdisciplinary research, November 2016 42
Figure F1. Percentage of articles by FoR fall in the global 10% most interdisciplinary among (left) the 1% of papers with the largest number of classified references by FoR or (right) among the 20% of papers with the largest percentage of classified references (2004–2013)
The UK percentage of papers in the overall global 10% increases over time and it consistently has a
greater ID share than Germany. As with the MD analyses, the smaller countries have relatively more
articles that meet the ID threshold criteria. (Figure F2)
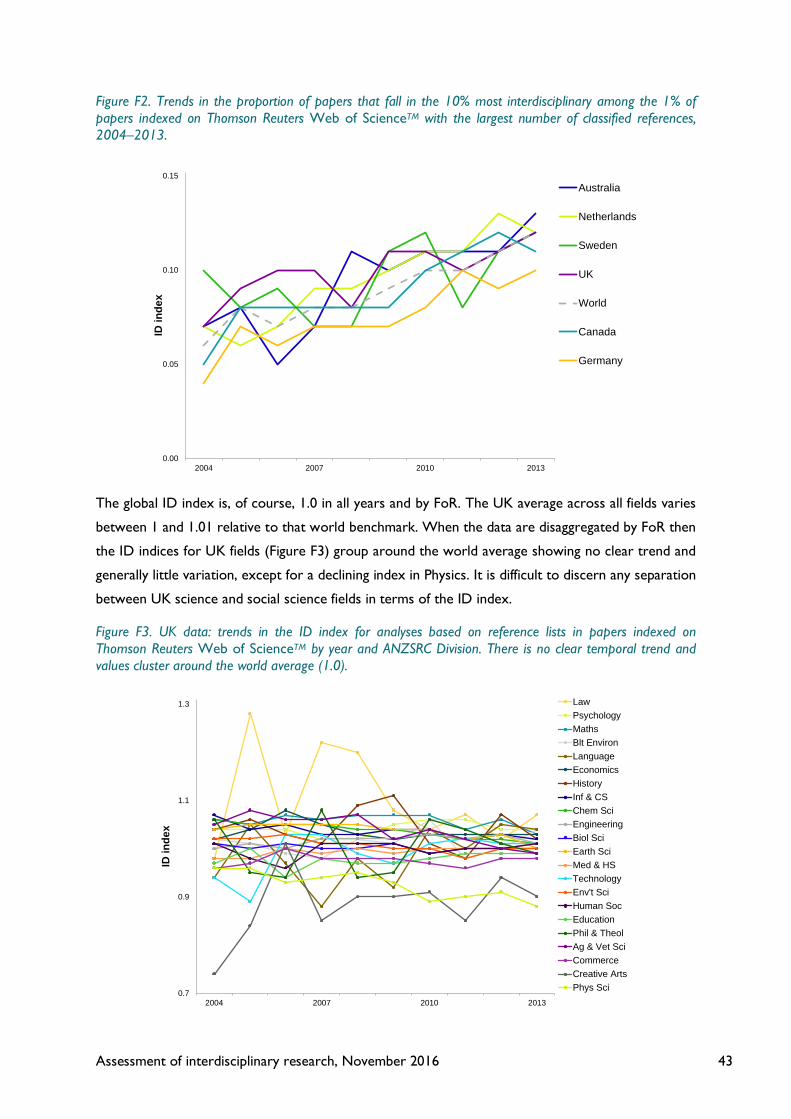
Assessment of interdisciplinary research, November 2016 43
Figure F2. Trends in the proportion of papers that fall in the 10% most interdisciplinary among the 1% of papers indexed on Thomson Reuters Web of ScienceTM with the largest number of classified references, 2004–2013.
The global ID index is, of course, 1.0 in all years and by FoR. The UK average across all fields varies
between 1 and 1.01 relative to that world benchmark. When the data are disaggregated by FoR then
the ID indices for UK fields (Figure F3) group around the world average showing no clear trend and
generally little variation, except for a declining index in Physics. It is difficult to discern any separation
between UK science and social science fields in terms of the ID index.
Figure F3. UK data: trends in the ID index for analyses based on reference lists in papers indexed on Thomson Reuters Web of ScienceTM by year and ANZSRC Division. There is no clear temporal trend and values cluster around the world average (1.0).
0.00
0.05
0.10
0.15
2004 2007 2010 2013
ID in
dex
Australia
Netherlands
Sweden
UK
World
Canada
Germany
0.7
0.9
1.1
1.3
2004 2007 2010 2013
ID in
dex
LawPsychologyMathsBlt EnvironLanguageEconomicsHistoryInf & CSChem SciEngineeringBiol SciEarth SciMed & HSTechnologyEnv't SciHuman SocEducationPhil & TheolAg & Vet SciCommerceCreative ArtsPhys Sci
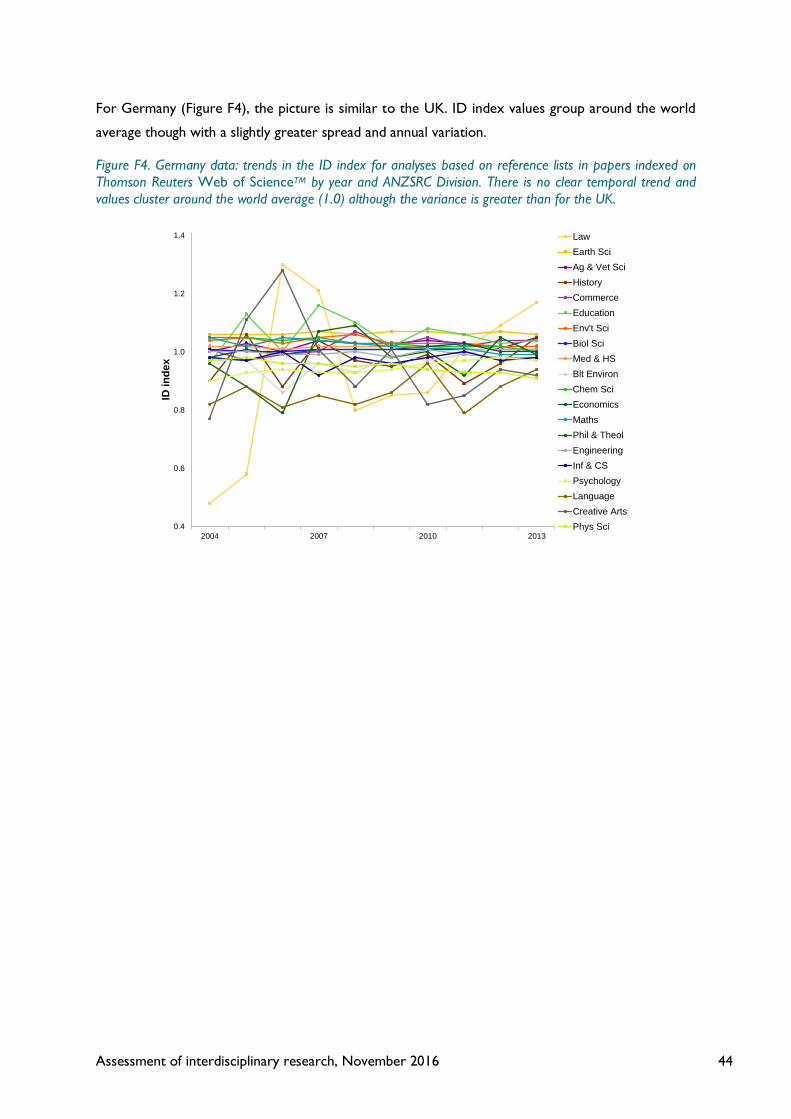
Assessment of interdisciplinary research, November 2016 44
For Germany (Figure F4), the picture is similar to the UK. ID index values group around the world
average though with a slightly greater spread and annual variation.
Figure F4. Germany data: trends in the ID index for analyses based on reference lists in papers indexed on Thomson Reuters Web of ScienceTM by year and ANZSRC Division. There is no clear temporal trend and values cluster around the world average (1.0) although the variance is greater than for the UK.
0.4
0.6
0.8
1.0
1.2
1.4
2004 2007 2010 2013
ID in
dex
LawEarth SciAg & Vet SciHistoryCommerceEducationEnv't SciBiol SciMed & HSBlt EnvironChem SciEconomicsMathsPhil & TheolEngineeringInf & CSPsychologyLanguageCreative ArtsPhys Sci
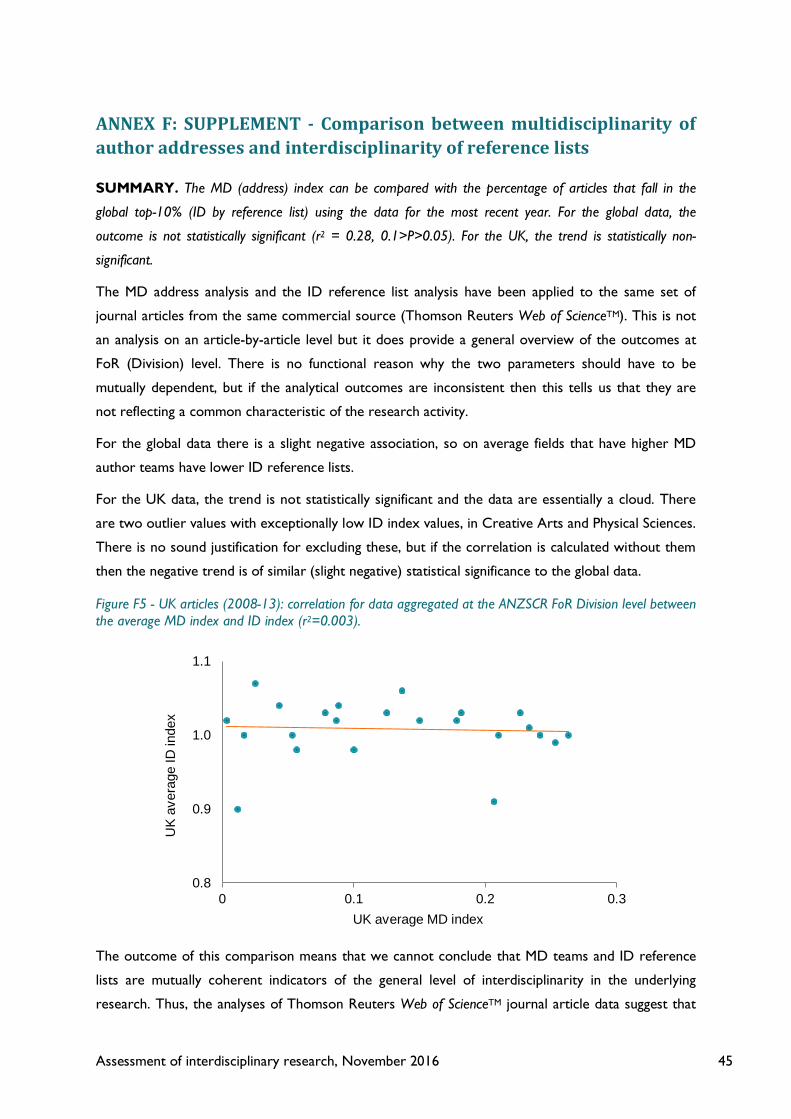
Assessment of interdisciplinary research, November 2016 45
ANNEX F: SUPPLEMENT - Comparison between multidisciplinarity of author addresses and interdisciplinarity of reference lists
SUMMARY. The MD (address) index can be compared with the percentage of articles that fall in the
global top-10% (ID by reference list) using the data for the most recent year. For the global data, the
outcome is not statistically significant (r2 = 0.28, 0.1>P>0.05). For the UK, the trend is statistically non-
significant.
The MD address analysis and the ID reference list analysis have been applied to the same set of
journal articles from the same commercial source (Thomson Reuters Web of ScienceTM). This is not
an analysis on an article-by-article level but it does provide a general overview of the outcomes at
FoR (Division) level. There is no functional reason why the two parameters should have to be
mutually dependent, but if the analytical outcomes are inconsistent then this tells us that they are
not reflecting a common characteristic of the research activity.
For the global data there is a slight negative association, so on average fields that have higher MD
author teams have lower ID reference lists.
For the UK data, the trend is not statistically significant and the data are essentially a cloud. There
are two outlier values with exceptionally low ID index values, in Creative Arts and Physical Sciences.
There is no sound justification for excluding these, but if the correlation is calculated without them
then the negative trend is of similar (slight negative) statistical significance to the global data.
Figure F5 - UK articles (2008-13): correlation for data aggregated at the ANZSCR FoR Division level between the average MD index and ID index (r2=0.003).
The outcome of this comparison means that we cannot conclude that MD teams and ID reference
lists are mutually coherent indicators of the general level of interdisciplinarity in the underlying
research. Thus, the analyses of Thomson Reuters Web of ScienceTM journal article data suggest that
0.8
0.9
1.0
1.1
0 0.1 0.2 0.3
UK
ave
rage
ID in
dex
UK average MD index
Assessment of interdisciplinary research, November 2016 46
the disciplinary make-up of teams and reference lists is at best unrelated and may point in opposite
directions for research management.
This outcome also raises an important general caveat about the interpretation of journal article data
if used as proxy indicators of research activity as opposed to indicators of research achievement.
Assessment of interdisciplinary research, November 2016 47
ANNEX G: Output interdisciplinarity – article abstracts
The MD-address and ID-reference analyses for Thomson Reuters Web of ScienceTM journal articles
produced contradictory results (ANNEX E and F, especially Figure F5). Although these may be valid
indicators of the extent to which teams are multidisciplinary or referenced literature is
interdisciplinary, they evidently do not provide a consistent indicator for the research articles, and
thus also not for the research from which the article arose.
Text analysis of article abstracts would provide an indicator to compare with both these article
analyses and with the text analysis of grant abstracts (ANNEX D). The potential benefit of text
analysis is that it draws on descriptive information given by the researchers for the identification of
disciplinary varieties rather than drawing on potentially mis-assigned metadata. Addresses may not
accurately identify the researcher’s discipline (e.g. mathematicians working in other science or social
science units) and reference lists may be conditioned by editorial and journal expectations.
Because the full text of article summaries was required, the analysis was limited to the article set
accessible through PubMed. Consequently, it is not feasible to carry out a complete disciplinary
spectrum and a focus on publications from medical, health and supporting bioscience areas is to be
expected. As noted in ANNEX B, this means that when non-medical disciplines such as Law are
discovered they are very likely to be in an interdisciplinary context. However, the PubMed data
provided a 25 year series which gave a longer perspective on the trajectory of ID than in other data.
Calculated ID values at the article level are highly skewed, so the average is not informative. To
address this skew, the critical values displayed in the analyses are the 95th percentile for each variety
(FoR Division or Group).
Interdisciplinarity at Division level
The text-based ID index is relatively high for many disciplines at the broader ANZSRC Division
level, which is probably due to the partial coverage of the PubMed data. The lowest average ID
values are in Biological Sciences and in Medical and Health Sciences, and Psychology and Technology
have slightly lower ID than the other Divisions. (Figure G1)
The ID of the core bio-medical divisions rises over the period from 1990 to 2015. They may have
started at a lower ID level for two reasons: first, because they are core to this dataset and therefore
most likely to produce less ID material in this context; second, because these are very broad
research categories in any database and in the early 1990s research in these areas may have been
contained within this group of fields. The rise over the period is informative because these fields are
not part of a uniform response across all data.
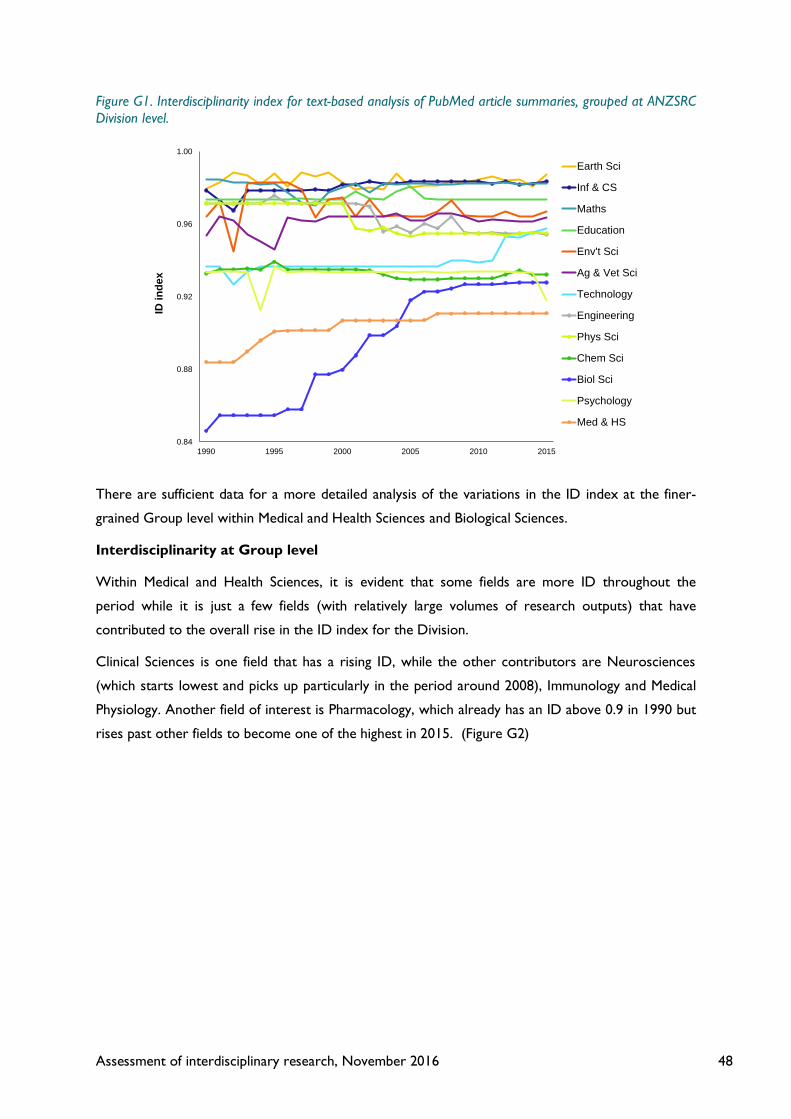
Assessment of interdisciplinary research, November 2016 48
Figure G1. Interdisciplinarity index for text-based analysis of PubMed article summaries, grouped at ANZSRC Division level.
There are sufficient data for a more detailed analysis of the variations in the ID index at the finer-
grained Group level within Medical and Health Sciences and Biological Sciences.
Interdisciplinarity at Group level
Within Medical and Health Sciences, it is evident that some fields are more ID throughout the
period while it is just a few fields (with relatively large volumes of research outputs) that have
contributed to the overall rise in the ID index for the Division.
Clinical Sciences is one field that has a rising ID, while the other contributors are Neurosciences
(which starts lowest and picks up particularly in the period around 2008), Immunology and Medical
Physiology. Another field of interest is Pharmacology, which already has an ID above 0.9 in 1990 but
rises past other fields to become one of the highest in 2015. (Figure G2)
0.84
0.88
0.92
0.96
1.00
1990 1995 2000 2005 2010 2015
ID in
dex
Earth Sci
Inf & CS
Maths
Education
Env't Sci
Ag & Vet Sci
Technology
Engineering
Phys Sci
Chem Sci
Biol Sci
Psychology
Med & HS
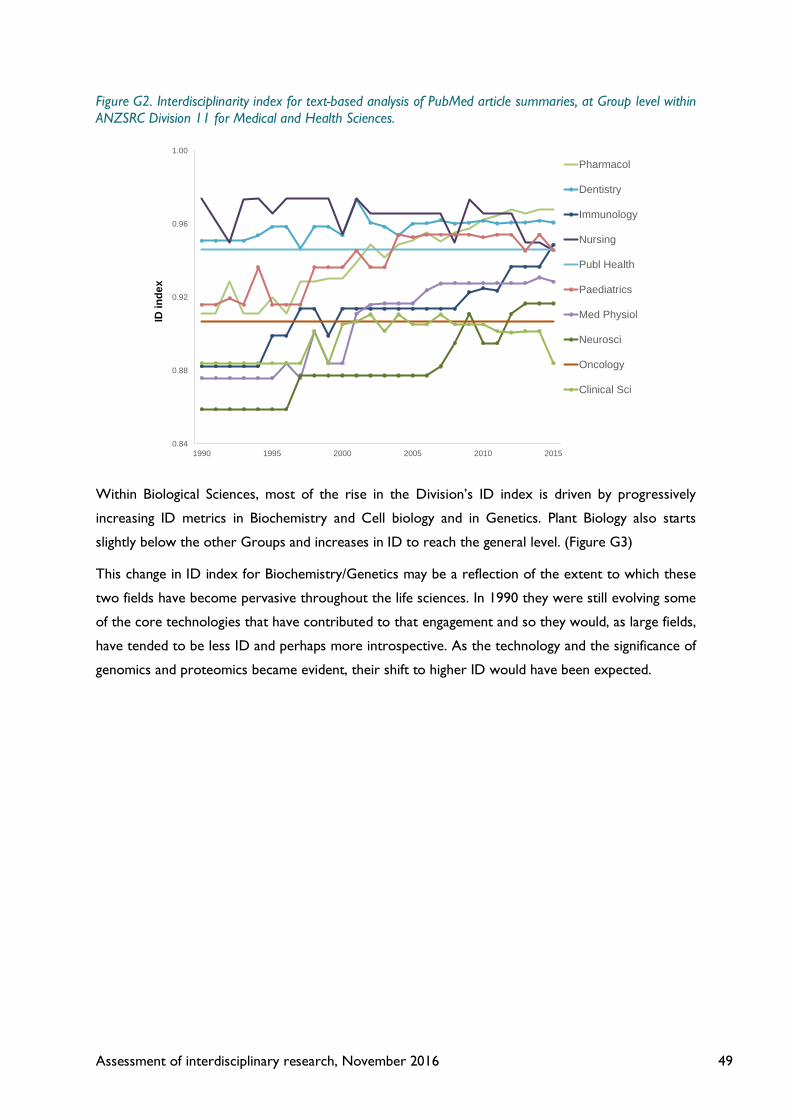
Assessment of interdisciplinary research, November 2016 49
Figure G2. Interdisciplinarity index for text-based analysis of PubMed article summaries, at Group level within ANZSRC Division 11 for Medical and Health Sciences.
Within Biological Sciences, most of the rise in the Division’s ID index is driven by progressively
increasing ID metrics in Biochemistry and Cell biology and in Genetics. Plant Biology also starts
slightly below the other Groups and increases in ID to reach the general level. (Figure G3)
This change in ID index for Biochemistry/Genetics may be a reflection of the extent to which these
two fields have become pervasive throughout the life sciences. In 1990 they were still evolving some
of the core technologies that have contributed to that engagement and so they would, as large fields,
have tended to be less ID and perhaps more introspective. As the technology and the significance of
genomics and proteomics became evident, their shift to higher ID would have been expected.
0.84
0.88
0.92
0.96
1.00
1990 1995 2000 2005 2010 2015
ID in
dex
Pharmacol
Dentistry
Immunology
Nursing
Publ Health
Paediatrics
Med Physiol
Neurosci
Oncology
Clinical Sci
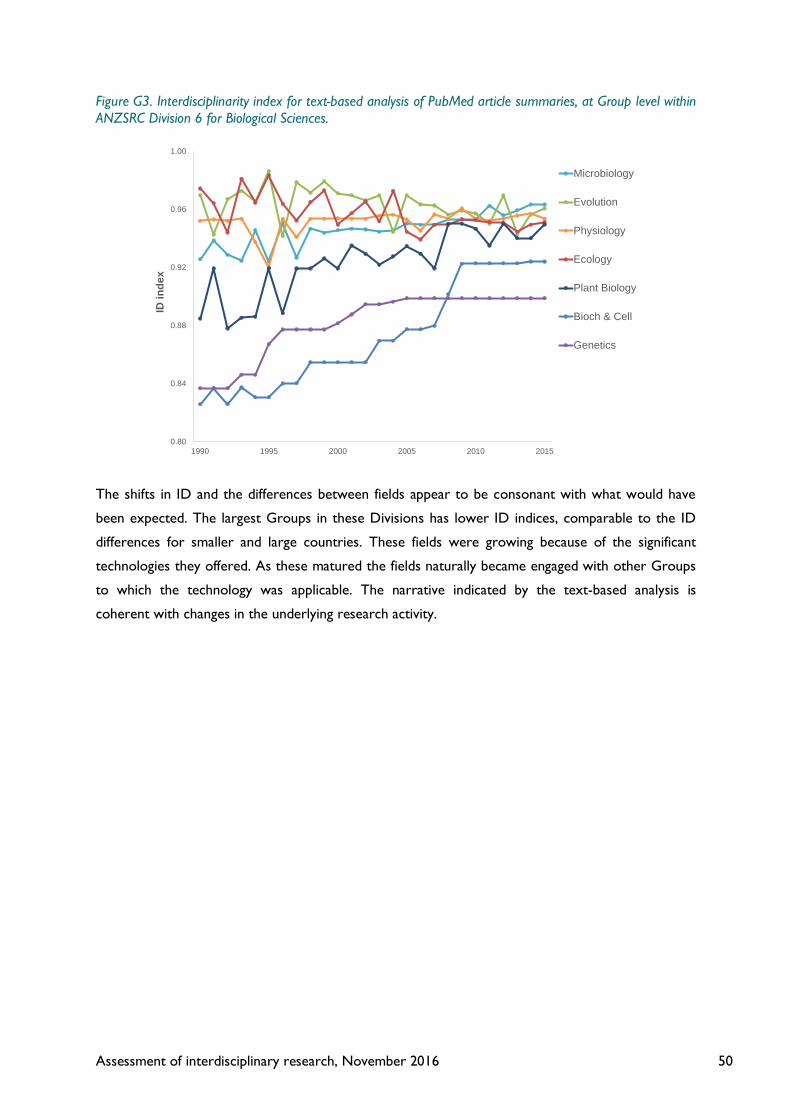
Assessment of interdisciplinary research, November 2016 50
Figure G3. Interdisciplinarity index for text-based analysis of PubMed article summaries, at Group level within ANZSRC Division 6 for Biological Sciences.
The shifts in ID and the differences between fields appear to be consonant with what would have
been expected. The largest Groups in these Divisions has lower ID indices, comparable to the ID
differences for smaller and large countries. These fields were growing because of the significant
technologies they offered. As these matured the fields naturally became engaged with other Groups
to which the technology was applicable. The narrative indicated by the text-based analysis is
coherent with changes in the underlying research activity.
0.80
0.84
0.88
0.92
0.96
1.00
1990 1995 2000 2005 2010 2015
ID in
dex
Microbiology
Evolution
Physiology
Ecology
Plant Biology
Bioch & Cell
Genetics

Assessment of interdisciplinary research, November 2016 51
ANNEX H: Output interdisciplinarity – analysis in Nature
Nature recently ran a supplementary feature on interdisciplinary research (Nature, 17 Sept 2015).
This included a graphic illustrating the correlation between the disciplinary spread of cited and citing
references using bibliometric data collated by Vincent Lariviere (Univ Montreal) and Cassidy
Sugimoto (Indiana Univ).
Figure H1. A measure of interdisciplinarity based on the citation flow of references to/from a journal article.
This follows an NSF categorical system and is not quite comparable to that used by ANZSRC FoRs,
but it suggests a potentially important variance hidden in other grouped data. In this analysis, Clinical
Medicine (low ID) and Health (high ID) have been split by NSF into separate categories and appear
in quite different parts of the graph. For the ANZSRC, Medicine and Health is a single category.
Other fields broadly appear to match expectations. It would be surprising if there is major
divergence since the basket of journals must be fairly similar and the cited references ought
therefore to match for the articles. However, the citing references offer a further (and apparently
significantly positively correlated) dimension.
The Nature feature also looked at country averages and found the UK (9.1%) to be more
interdisciplinary than Germany (8.5%) but both to be less so than other comparator nations, which
included USA and Japan (both 9.7%) and the BRICK6 and other emergent economies (10-13%).
The meaning of the country and field differences is unclear: the value of the analysis here is in
comparison to other methods and outcomes studied in the report.
6 BRICK: Brazil, Russia, India, China, (South) Korea
0
0.2
0.4
0.6
0.8
1
0 0.2 0.4 0.6 0.8 1
Cita
tions
from
out
side
dis
cipl
ines
References to outside disciplines
Arts
Biology
Biomedical Research
Chemistry
Clinical Medicine
Earth and Space
Engineering andTechnologyHealth
Humanities
Mathematics
Physics
Assessment of interdisciplinary research, November 2016 52
References
ABRC. (1987). A strategy for the science base, 50 pp. A discussion document for the Secretary of
State for Education and Science. HMSO, London. ISBN 0 11 270627 4
Adams J. (2013). The fourth age of research. Nature, 497, 557-560.
Aldrich J H. (2014). Interdisciplinarity: its role in a discipline-based academy. A report by the task
force of the American political science association. Oxford University Press, Oxford. ISBN 978 19
933134 5
ANZSRC. (2008). See documentation at:
http://www.abs.gov.au/ausstats/[email protected]/0/4AE1B46AE2048A28CA25741800044242?opendocument
Archambault É, Caruso J, and Beauchesne O. (2011). Towards a Multilingual, Comprehensive and
Open Scientific Journal Ontology. In B. Noyons, P. Ngulube & J. Leta (Eds.), Proceedings of the 13th
International Conference of the International Society for Scientometrics and Informetrics (ISSI),
Durban, South Africa, pp 66-77.
Campbell D, Deschamps, P Côté G, Roberge G, Lefebvre C and Archambault É. (2015).
Development of an “interdisciplinarity” metrics at the paper level and its application in a comparative
analysis of the most publishing ERA and non-ERA universities. Proceedings of the 20th International
Conference on Science and Technology Indicators
Chubin D E, Porter A L, Rossini F A and Connolly T. (1983). Indicators of interdisciplinary research.
Report to the NSF Division of Science Resources Studies, grant no SRS-810566. National Science
Foundation, Washington DC.
Choi J M. (1988). Citation analysis of intra- and interdisciplinary communication patterns of
anthropology in the USA. Behavioral and Social Sciences Librarian, 6, 65-84.
Elsevier. (2015). A review of the UK’s interdisciplinary research using a citation-based approach.
Report to the UK HE funding bodies and MRC. At:
http://www.hefce.ac.uk/pubs/rereports/Year/2015/interdisc/Title,104883,en.html
Katz J S and Hicks D. (1995). The classification of interdisciplinary journals: a new approach. Pp 245-
254, in, Koenig M and Bookstein A (eds). Proceedings of the 5th International conference on
Scientometrics and Informetrics.
King’s College London and Digital Science. (2015). The nature, scale and beneficiaries of research
impact: an initial analysis of Research Excellence Framework (REF) 2014 impact case studies. At
:http://www.hefce.ac.uk/pubs/rereports/Year/2015/analysisREFimpact/
Lyall C, Bruce A, Tait J and Meagher L. (2011). Interdisciplinary research journeys: practical
strategies for capturing creativity. Bloomsbury, London ISBN 978 1 8496 6013 6
Assessment of interdisciplinary research, November 2016 53
May R M. (1975). Patterns of species abundance and diversity. Pp 81-120, in, Cody M L and Diamond
J (eds), Ecology and the evolution of communities. Harvard University Press, Cambridge MA.
Porter A L, Cohen A S, Roessner D and Perreault M. (2007). Measuring researcher
interdisciplinarity. Scientometrics, 72, 117-147.
Porter A L and Chubin D E. (1985). An indicator of cross-disciplinary research. Scientometrics, 8,
161-176.
Porter A L and Rafols I. (2009). Is science becoming more interdisciplinary? Measuring and mapping
six research fields over time. Scientometrics, 81, 719-745.
Porter A L, Roessner J D, Cohen A S and Perreault M. (2006). Interdisciplinary research: meaning,
metrics and nurture. Research Evaluation, 15, 187-195.
Porter A L and Rossini F A. (1985). Peer-review of interdisciplinary research proposals. Science,
Technology and Human Values, 10, 33-38.
Qui L. (1992). A study of interdisciplinary research collaboration. Research Evaluation, 2, 169-175.
Rafols I, Leydesdorff L, O’Hare A, Nightingale P and Stirling A. (2012). How journal rankings can
suppress interdisciplinary research: a comparison between innovation studies and business &
management. Research Policy, 41, 1262-1282.
Rafols I and Meyer M. (2010). Diversity and network coherence as indicators of interdisciplinarity:
case studies in bionanoscience. Scientometrics, 82, 263-287.
Rinia E J, van Leeuwen T N, Bruins E E W, van Vuren H G and van Raan A F J. (2001). Citation delay
in interdisciplinary knowledge exchange. Scientometrics, 51, 293-309.
Rinia E J, van Leeuwen T N and van Raan A F J. (2002). Impact measures of interdisciplinary research
in physics. Scientometrics, 53, 241-248.
Rinia E J, van Leeuwen T N, van Vuren H G and van Raan A F J. (2001b). Influence of
interdisciplinarity on peer-review and bibliometric evaluations in physics research. Research Policy,
30, 357-361.
Rhoten D. (2004). Interdisciplinary research: trend or transition? Items and Issues, 5, 6-11
Schummer J. (2004). Multidisciplinarity, interdisciplinarity, and patterns of research collaboration in
nanoscience and nanotechnology. Scientometrics, 59, 425-465.
Scottish Universities Policy Research Consortium. (1997). Interdisciplinary research: process,
structures and evaluation. SHEFC-funded regional strategic initiative.
Stirling A. (2007). A general framework for analysing diversity in science, technology and society.
Journal of the Royal Society, Interface, 4, 707-719.
Assessment of interdisciplinary research, November 2016 54
Subramanyam K. (1983). Bibliometric studies of research collaboration. Journal of Information
Science, 6, 33-38.
Tijssen R J W. (1992). A quantitative assessment of interdisciplinary structures in science and
technology: co-classification of energy research. Research Policy, 21, 27-44.
Van den Besselaar P and Heimeriks G. (2001). Disciplinary, multidisciplinary, interdisciplinary:
concepts and indicators. Pp 705-716, in, David M and Wilson C S (eds), Proceedings of the 8th
International conference on Scientometrics and Informetrics. University of New South Wales,
Australia.
Van Raan A F J. (2003). The use of bibliometric analysis in research performance assessment and
monitoring of interdisciplinary scientific developments. Technikfolgenabschätzung – Theorie und
Praxis, 12, 20-29.
Wagner C S, Roessner J D, Bobb K, Klein J T, Boyack K W, Keyton J, Rafols I and Börner K. (2011),
Approaches to understanding and measuring interdisciplinary scientific research (IDR): A review of
the literature. Journal of Informetrics, 165, 14–26.