inter-laboratory study of human in vitro toxicogenomics
TRANSCRIPT
1 3
Arch Toxicol (2016) 90:2215–2229DOI 10.1007/s00204-015-1617-3
TOXICOGENOMICS
Inter‑laboratory study of human in vitro toxicogenomics‑based tests as alternative methods for evaluating chemical carcinogenicity: a bioinformatics perspective
R. Herwig1 · H. Gmuender2 · R. Corvi3 · K. M. Bloch4 · A. Brandenburg2 · J. Castell5 · L. Ceelen6 · C. Chesne7 · T. Y. Doktorova6 · D. Jennen8 · P. Jennings9 · A. Limonciel9 · E. A. Lock4 · T. McMorrow10 · P. Phrakonkham3 · R. Radford10 · C. Slattery10 · R. Stierum11 · M. Vilardell1 · T. Wittenberger2 · R. Yildirimman1 · M. Ryan10 · V. Rogiers6 · J. Kleinjans8
Received: 16 June 2015 / Accepted: 19 October 2015 / Published online: 2 November 2015 © Springer-Verlag Berlin Heidelberg 2015
analysis protocols. We have conducted an inter-laboratory study for testing chemical carcinogenicity evaluating two human in vitro assays: hepatoma-derived cells and hTERT-immortalized renal proximal tubule epithelial cells, repre-senting liver and kidney as major target organs. Cellular systems were initially challenged with thirty compounds, genome-wide gene expression was measured with microar-rays, and hazard classifiers were built from this training set. Subsequently, each system was independently established in three different laboratories, and gene expression meas-urements were conducted using anonymized compounds. Data analysis was performed independently by two sepa-rate groups applying different protocols for the assessment of inter-laboratory reproducibility and for the prediction of carcinogenic hazard. As a result, both workflows came to very similar conclusions with respect to (1) identification
Abstract The assessment of the carcinogenic potential of chemicals with alternative, human-based in vitro sys-tems has become a major goal of toxicogenomics. The central read-out of these assays is the transcriptome, and while many studies exist that explored the gene expres-sion responses of such systems, reports on robustness and reproducibility, when testing them independently in differ-ent laboratories, are still uncommon. Furthermore, there is limited knowledge about variability induced by the data
R. Herwig, H. Gmuender, R. Corvi, M. Ryan, V. Rogiers and J. Kleinjans have contributed equally to this work. Except equally contributed authors, other authors are in alphabetical order.
Electronic supplementary material The online version of this article (doi:10.1007/s00204-015-1617-3) contains supplementary material, which is available to authorized users.
* R. Herwig [email protected] http://www.molgen.mpg.de/156820/Bioinformatics-Group
1 Department Computational Molecular Biology, Max-Planck-Institute for Molecular Genetics, Ihnestr. 73, 14195 Berlin, Germany
2 Genedata AG, Margarethenstrasse 38, 4053 Basel, Switzerland
3 European Union Reference Laboratory for Alternatives to Animal Testing (EURL ECVAM), Institute for Health and Consumer Protection (IHCP), European Commission Joint Research Centre, TP 126, Via E. Fermi 2749, 21027 Ispra, Italy
4 School of Pharmacy and Biomolecular Sciences, Liverpool John Moores University, Byrom Street, Liverpool L3 3AF, UK
5 Department of Biochemistry and Molecular Biology, Faculty of Medicine, University of Valencia, Av. Blasco Ibanez 15, 46010 Valencia, Spain
6 Department of In Vitro Toxicology and Dermato-Cosmetology, Vrije Universiteit Brussel, Laarbeeklaan 103, 1090 Brussels, Belgium
7 Biopredic International, Parc d’affaires de la Bretèche, Bldg. A4, 35760 St Gregoire, France
8 Department of Toxicogenomics, Maastricht University, Maastricht, The Netherlands
9 Division of Physiology, Department of Physiology and Medical Physics, Medical University of Innsbruck, Innsbruck, Austria
10 Conway Institute, School of Biomolecular and Biomedical Science, University College Dublin, Belfield, Dublin 4, Ireland
11 Department of Risk Analysis for Products in Development, Netherlands Organisation for Applied Scientific Research (TNO), Utrechtseweg 48, 3704 HE Zeist, The Netherlands
2216 Arch Toxicol (2016) 90:2215–2229
1 3
of experimental outliers, (2) overall assessment of robust-ness and inter-laboratory reproducibility and (3) re-classi-fication of the unknown compounds to the respective tox-icity classes. In summary, the developed bioinformatics workflows deliver accurate measures for inter-laboratory comparison studies, and the study can be used as guidance for validation of future carcinogenicity assays in order to implement testing of human in vitro alternatives to animal testing.
Keywords Carcinogenicity · In vitro assays · Pre-validation · Inter-laboratory assessment · Bioinformatics · Toxicogenomics
Introduction
The development of in vitro assays as alternatives to ani-mal testing has become a fundamental task of toxicologi-cal research. In particular, in vitro systems derived from relevant human tissues are necessary to complement the 2-year rodent carcinogenicity bioassay, which has been associated with uncertainty in extrapolating from rodents to humans (Silva Lima and van der Laan 2000; Paules et al. 2011). In particular, false-positive reporting by the rodent bioassay complicates the necessity to comply with legisla-tive requirements across sectors, for example the regulation concerning the Registration, Evaluation, Authorisation and Restriction of Chemicals (REACH) (Annys et al. 2014). Various human-based in vitro assays representing different target organs of chemical carcinogenicity have been pro-posed in recent years, including the liver (Gómez-Lechón et al. 2010; Yildirimman et al. 2011; Doktorova et al. 2013) and the kidney (Jennings et al. 2012; Limonciel et al. 2012; Radford et al. 2013), and their potential in predicting the hazard of chemical-induced cancer progression has been demonstrated by evaluating selected chemicals. For the liver, it has been shown that the human hepatoma-derived HepaRG cell line is a very sensitive system highly respon-sive to carcinogenic compounds primarily activating path-ways such as DNA damage, proliferation and apoptosis (Jennen et al. 2010; Doktorova et al. 2013). For the kid-ney, it has been shown that human renal proximal tubular epithelial cells can be efficiently immortalized by TERT retaining cell functions similar to those of the original cells (Wieser et al. 2008). These cells also have specific proper-ties that make them suitable as a testing assay for human carcinogenicity such as the induced loss of the primary cil-ium upon carcinogen exposure (Radford et al. 2013), con-tact-inhibited cell cycle arrest and a functioning p53 system (Aschauer et al. 2013).
The central experimental read-out in toxicogenomics is the transcriptome of the cells under study which can be
measured with microarrays. With the advent of different microarray platforms, the issue emerged how reproduc-ible measurements of the transcriptome actually are (Yauk et al. 2004; Irizarry et al. 2005; Fan et al. 2011). The larg-est effort so far in testing reproducibility of gene expres-sion measurement is the MAQC study. In the first phase of the study (MAQC-I), the major goal was to compare technical performance of the different microarray systems, with respect to the identification of differentially expressed genes as potential biomarkers, with the result that microar-ray platforms were deemed highly reproducible, in particu-lar those based on oligoprobes (MAQC consortium 2006). The second phase of the study (MAQC-II) evaluated the performance of different bioinformatics approaches. As a result, it was found that prediction methods varied to a higher degree and depended largely on (non-technical) factors, for example team proficiency (MAQC consortium 2010). In addition, it has been emphasized that repeatabil-ity and transferability of technology is still a bottleneck and needs major improvement when transferring omics-based results within the process to regulatory acceptance (Ioan-nidis and Khoury 2011).
In the field of toxicogenomics, there is still limited experience with the validation of human in vitro systems. Nonetheless, the evaluation of transferability and inter-lab-oratory reproducibility represent major steps in the valida-tion of any test method (Hartung et al. 2004). Both transfer-ability, which measures the capability, the ease, as well as the practicability to reproduce experimental data in a labo-ratory that had no experience with the method before, and inter-laboratory reproducibility of experimental data in sev-eral laboratories account for the reliability of a test method. The predictive capacity and the applicability domain of the test system account for the relevance of a test method for a particular purpose.
The findings of the MAQC-II study have shown that data analysis is a highly variable step in inter-laboratory comparisons and imposes the need for clear and robust bio-informatics protocols in the process of evaluating toxicity testing assays. In this work, we describe and conduct such protocols in the analysis of gene expression data derived from two human-derived cell lines (HepaRG and RPTEC/TERT1). The objectives of this study were to (a) imple-ment and test measures for reproducibility and robustness and develop workflows for assessing the reliability of an in vitro assay and (b) implement approaches for predicting the carcinogenic potential of the compounds under study. The workflows were applied within a pre-validation setup where three coded chemicals were tested by three labora-tories for each assay system in order to assess transferabil-ity and reproducibility comprising a total of 204 microar-ray experiments. Additionally, as a training set for setting classification parameters and assessing robustness, each
2217Arch Toxicol (2016) 90:2215–2229
1 3
in vitro assay was challenged, a priori to pre-validation, using 30 chemicals generated in the two lead laboratories (ten genotoxic (GTX) and ten non-genotoxic (NGTX) carcinogens as well as ten non-carcinogens (NC) for each assay system). Two bioinformatics groups evaluated the complete data independently applying different workflows (Suppl. Fig. 1). As the major result of the study, both work-flows delivered similar results with respect to (1) the iden-tification of experimental outliers, (2) the assessment of inter-laboratory reproducibility and (3) the prediction of the toxicity classes.
We conclude that the bioinformatics workflows described here are robust and reliable and that the study could serve as guidance for future development and valida-tion of transcriptomics-based tests.
Materials and methods
Cell lines and chemicals
The cell lines used were: HepaRG (hepatocarcinoma cell line) available at Biopredic and RPTEC/TERT1 [renal proximal tubular epithelial cell immortalized with hTERT (Wieser et al. 2008)] purchased from the developer Ever-cyte GmbH, Vienna, Austria. For the reproducibility analy-sis, one compound per carcinogen class (GTX: genotoxic carcinogens, NGTX: non-genotoxic carcinogens, NC: non-carcinogens) was selected among the compounds tested in the training phase of the project and coded. The genotoxic carcinogens were benzo[a]pyrene (CAS 50-32-8, coded as compound D) for the liver and potassium bromate (CAS 7758-01-2, compound G) for the kidney, the non-genotoxic carcinogens were tetradecanoyl phorbol acetate (CAS 16561-29-8, compound E) for the liver and ochratoxin A (CAS 303-47-9, compound B) for the kidney, and the non-carcinogen was clonidine hydrochloride (CAS 4205-91-8, compounds F and A) for both assays (see Suppl. material 4). The purchase, coding and distribution of the test chemicals to the participating laboratories were under the responsibility of the University of Maastricht.
Training data
A training data set was generated prior to the inter-labora-tory comparison in order to allow identification of discrimi-native response gene expression patterns for the carcino-genicity classes and calculating background distributions for the different correlation and reproducibility meas-ures. Both cell lines, HepaRG and RPTEC/TERT1, were exposed to 30 chemicals, i.e., ten GTX, ten NGTX and ten NC each (Vinken et al. 2008). All data were measured at IC10 concentration and at different time points (6 h (kidney
only), 24 and 72 h) and were compared with DMSO time-matched vehicle control experiments. All treatment/con-trol experiments were performed with three biological replicates. The list of compounds is summarized in Suppl. Table 1. Experimental procedures were as described in Doktorova et al. (2013, 2014), Limonciel et al. (2012) and Radford et al. (2012).
Inter‑laboratory study design
To assess transferability and reproducibility, the three coded chemicals were tested by three laboratories for each test model [for HepaRG: Vrije Universiteit Brussel (VUB), Biopredic (BPI) and University Hospital La Fee Valencia (HUL); for RPTEC/TERT1: University College Dublin (UCD), Medical University Innsbruck (IMU) and Liver-pool John Moores University (LJM)]. VUB acted as lead laboratory for the liver model, and UCD was the lead labo-ratory for the kidney model. As part of the transferability phase, the preparatory work included training of the partici-pating laboratories on the respective test methods, agree-ment on and finalization of the standard operating proce-dures (SOPs). Microarray experiments were centralized and conducted at an independent site (University of Maas-tricht, UM) as was the purchase, coding and distribution of the test chemicals to the participating laboratories. The bioinformatics analyses were done by GeneData AG (GD, workflow 1) and Max Planck Institute for Molecular Genet-ics (MPI, workflow 2). Regulatory advice and study coordi-nation were done by the European Union Reference Labo-ratory for Alternatives to Animal Testing (EURL ECVAM) (Suppl. Fig. 1).
Experimental design
In both models, the IC10 concentration was established independently by each laboratory according to the agreed SOPs. However, before proceeding to the main experi-ments, the cytotoxicity results were compared across the laboratories and discussed to identify potential outliers, based on criteria defined by the lead laboratories. In all sub-sequent transcriptomics experiments, each laboratory used the respective IC10 dose found in the initial experiments. For the kidney model, dose range finding was performed in a stepwise approach. The 3-(4,5-dimethylthiazol-2-yl)-2,5-diphenyltetrazolium bromide test (MTT) was initially carried out in three runs. An initial MTT experiment in 96-well plates using a wide range of concentrations was run to establish a narrow range for the second (in 96-well plates) and third MTT tests (in 6-well plates and 24-well plates for kidney and liver, respectively). The values obtained in the three experiments were then used by each laboratory in the mean IC10 calculations. When necessary,
2218 Arch Toxicol (2016) 90:2215–2229
1 3
for the kidney assay the supernatant LDH and supernatant lactate assay were also performed (Limonciel et al. 2011). As a result, each laboratory treated its cells at its own IC10 concentration. This resulted in a moderate variation of the concentration levels across the different laboratories (coef-ficients of variation between 0.32 and 0.58).
To address inter-laboratory reproducibility for in vitro toxicogenomics assays, the following design of the experi-ments was employed (Suppl. Fig. 1):
• HepaRG cells were exposed to three blinded com-pounds (named D, E and F) at IC10 concentration for 24 and 72 h. Three replicate hybridization experiments were performed in each case. Response data were com-pared with respective DMSO controls. Here, more rep-licates were used per time point, six for HUL and BPI and nine for VUB. All experiments were independently conducted in parallel in three different laboratories (VUB lead lab, BPI and HUL), and in total, 54 treat-ment experiments and 42 DMSO time-matched control experiments were generated.
• RPTEC/TERT1 cells were exposed to three blinded compounds (named A, B and G) at IC10 concentration for 6, 24 and 72 h. Response data were compared with respective DMSO controls. Three replicate hybridi-zation experiments were performed in each case. All experiments were independently conducted in parallel in three different laboratories (UCD lead lab, LJM and IMU), and in total, 81 treatment experiments and 27 DMSO time-matched control experiments were gener-ated.
Microarray quality control, probe annotation and pre‑processing of data
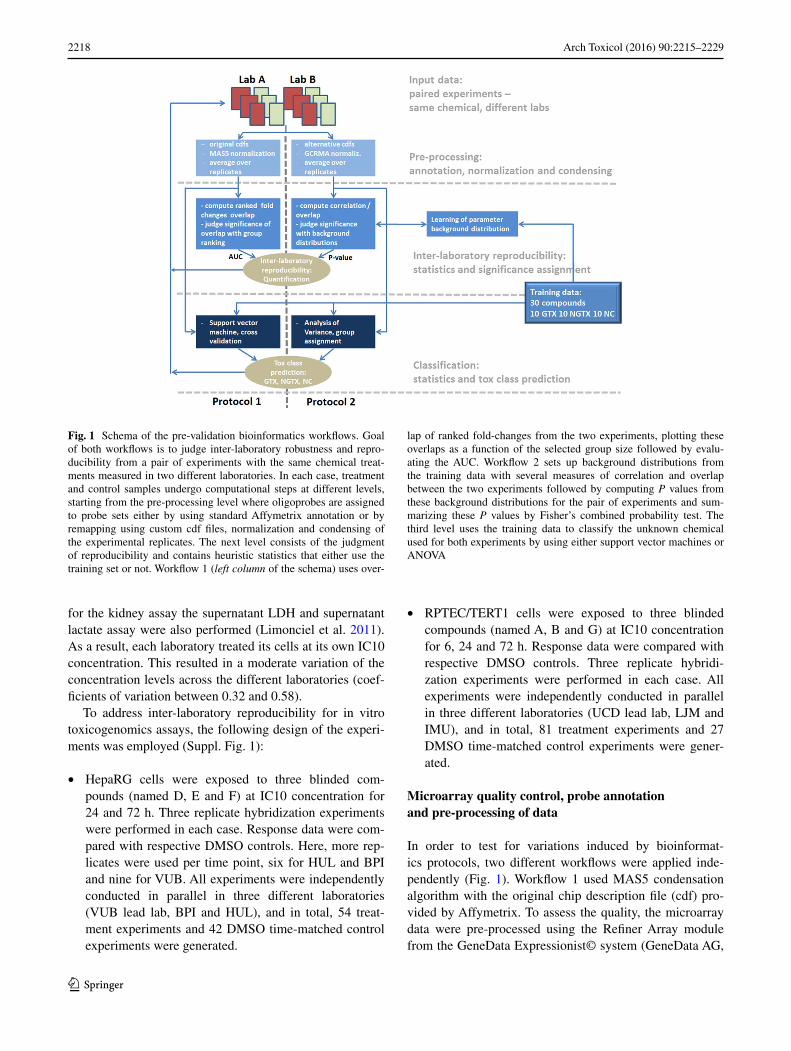
In order to test for variations induced by bioinformat-ics protocols, two different workflows were applied inde-pendently (Fig. 1). Workflow 1 used MAS5 condensation algorithm with the original chip description file (cdf) pro-vided by Affymetrix. To assess the quality, the microarray data were pre-processed using the Refiner Array module from the GeneData Expressionist© system (GeneData AG,
Fig. 1 Schema of the pre-validation bioinformatics workflows. Goal of both workflows is to judge inter-laboratory robustness and repro-ducibility from a pair of experiments with the same chemical treat-ments measured in two different laboratories. In each case, treatment and control samples undergo computational steps at different levels, starting from the pre-processing level where oligoprobes are assigned to probe sets either by using standard Affymetrix annotation or by remapping using custom cdf files, normalization and condensing of the experimental replicates. The next level consists of the judgment of reproducibility and contains heuristic statistics that either use the training set or not. Workflow 1 (left column of the schema) uses over-
lap of ranked fold-changes from the two experiments, plotting these overlaps as a function of the selected group size followed by evalu-ating the AUC. Workflow 2 sets up background distributions from the training data with several measures of correlation and overlap between the two experiments followed by computing P values from these background distributions for the pair of experiments and sum-marizing these P values by Fisher’s combined probability test. The third level uses the training data to classify the unknown chemical used for both experiments by using either support vector machines or ANOVA
2219Arch Toxicol (2016) 90:2215–2229
1 3
Basel, Switzerland). Workflow 2 used alternative, or “cus-tom,” cdf files as described in Dai et al. (2005) followed by normalization with GC-RMA as implemented in R version 2.13.0 on a Linux 64-bit system. It is important to point out that the workflows differ largely in the assignment of oligo-probe annotation in the sense that:
1. probes can match multiple gene loci (workflow 1) ver-sus probes match a unique gene locus (workflow 2),
2. probe sets per gene are uniform in size (i.e., 11 probes per probe set, workflow 1) versus probe sets are not uniform in size but have a varying number of probes (≥3, workflow 2),
3. the resulting number of probe sets/genes differs (54,613 probe sets, workflow 1; and 18,919 genes, workflow 2).
Measures for assessing robustness and inter‑laboratory reproducibility
Workflow 1 The MAS5 P value was set to 1 in order to avoid missing values (probe sets called “absent” using the recommended detection P value threshold of 0.05). The expression values were log-transformed and the geomet-ric mean was determined for each group of replicates. The fold-changes between the treatments and the DMSO con-trols were ranked, and the inter-laboratory reproducibility was determined using these ranked fold-changes for each treatment. Briefly, the overlaps of the top 20, 50, 100, 200, 500, 1000, 2000, 5000, 10,000 and 20,000 ranked tran-scripts were determined for each treatment group (there are overall 54,613 probe sets on the microarray). Random overlaps were determined using the formula
P values or Benjamini–Hochberg q values were calcu-lated with Fisher’s exact test. The data were plotted with the number of top-ranked genes from the selected treat-ment (reference) on the X-axis versus the percentages of overlaps with the two compared treatments on the Y-axis. For the resulting curves, the area under curves (AUC) was calculated and the resulting AUCs were used to judge reproducibility.
Workflow 2 The average of the treatment and control experiments was computed from the replicate experiments for each compound, and for each pair of experiments, sev-eral measures of correlation and overlap were computed:
• Pearson correlation among the entire set of 18,919 genes. The range of this measure is [−1, 1].
• Pearson correlation among the set of response genes that show a significant expression change with at least one compound from the training sample. Response
#{top-ranked probe sets}/54, 613.
genes were identified with Student’s unpaired t test with P < 0.05 comparing all thirty training compound treatments against their controls. The respective lists of differentially expressed genes were merged to gain a list of overall response genes, which resulted in 7837 response genes for HepaRG and 10,831 response genes for RPTEC/TERT1 (range [−1, 1]).
• In addition to the two correlation measures, the com-monality in differentially expressed genes for two treat-ment experiments was assessed. For that, let Ni denote the number of differentially expressed genes in experi-ment i, Nj the number of differentially expressed genes in experiment j and Nij the overlap of both lists; then, a measure of commonality (Cij) is defined by
Note that with perfect overlap, this measure equals 1, while in case of no overlap, the measure is 0, making the range [0,1]. This measure is called the Fowlkes and Mallows statistic and has the interpretation of a nor-malized dot product (Fowlkes and Mallows 1983).
For all three measures, the training data set was used for the construction of background distributions and empirical P values were computed in order to judge the significance of the observation. The three P values were summarized using Fisher’s combined probability test that judges the sig-nificance of independent extreme value tests. The test sta-tistic is X = −2 * Σi ln(pi) where pi is the P value of the ith test, i = 1, 2, 3, and ln is the natural logarithm. The signifi-cance of X can then be judged by a Chi-square distribution with 2*K (K = number of performance measures) degrees of freedom (in our case, 6 degrees of freedom). Since the performance measures were not independent, they needed to be corrected for dependency. This was done with the transformation P valuecorr = P value * (K + 1)/(2 K). Thus, for a pair of reproducible experiments, we required that the summarized empirical P value should be <0.0333 (=0.05 × 4/6).
Measures for predicting carcinogenic hazard
Both workflows incorporated the training set of 30 com-pounds (ten GTX, ten NGTX and ten NC) for both cellu-lar systems for the prediction of the unknown compounds using different numerical methods.
Workflow 1 Cross-validations with the training data sets were performed with Genedata Analyst with support vector machine (SVM) (Cristianini and Shawe-Taylor 2000) as classifier (penalty = 10, kernel = linear) and K-fold cross-validation with K = 10 and 10 repeats. Briefly, data were divided into 10 disjoined subsets of
Cij =Nij
√
Ni ∗ Nj
.
2220 Arch Toxicol (2016) 90:2215–2229
1 3
equal size, and successively, one of these subsets was used for validation and the others for training. In some cases, a critical test of the internal consistency of a ref-erence compendium was performed with a groupwise cross-validation where the biological replicates of each compound at a certain concentration and time point were removed as groups into the test set. Training sets for cross-validations consisted of the GTX, NGTX and NC compounds, with or without the DMSO controls. For the HepaRG model, the most robust reference compen-dium included all experiments (IC10 for 24 and 72 h). However, to obtain a robust reference compendium, the experiments had to be half-z-normalized in order to remove batch effects. For the kidney RPTEC/TERT1 model, the most robust reference compendium was again obtained using all experiments (IC10 for 6, 24 and 72 h) but similarly robust was the reference compendium using only the 72-h experiments. Half-z normalization was not necessary for these data sets because no clear batch effect could be observed. Furthermore, supervised learn-ing methods were used to identify the set of genes that minimizes the prediction error and are therefore the best predictors. Such genes can be used to enhance the per-formance of a classifier and can also be used for biologi-cal interpretation. As gene ranking method, we applied the recursive feature elimination (RFE) method (Guyon et al. 2002). Gene rankings did not reduce significantly the misclassification rates but reduced the number of transcripts for the training sets in order to discriminate between the toxicity classes and for classification analy-ses with the blinded compounds.
Workflow 2 One-way analysis of variance (ANOVA) was performed with the training set. Since ANOVA judges the inter-class variance against the intra-class variance, the number of significant genes (F test P value <0.001) indicates whether the intra-class variance is smaller than the variance between classes. Adding a new (and unknown) compound to its correct toxicity class would yield a larger number of significant genes than adding the compound to the wrong toxicity class. Thus, the idea of the prediction method is to assign the unknown compound to the toxicity class with the highest number of significant genes. Of course one has to take into account the total number of significant genes per compound and per toxicity class (the marginals) in order to account for bias. Thus, as classification score, the log2 ratio of observed versus expected number of significant ANOVA genes was computed, and the unknown com-pound was assigned to the toxicity class with the highest classification score.
The different steps of both workflows are summarized in Fig. 1.
Results
Inter‑laboratory reproducibility: experimental considerations
Training of the laboratories was a necessary step before embarking in an inter-laboratory study, and its aim was to ensure that all participants had a good comprehen-sion of the purpose of the study and that SOPs were well understood and harmonized before the initiation of the experimental phase. The calculation of IC10 appeared to be the most challenging step of the experimental phase of the study. The precise IC10 determination was especially difficult for compounds that induce a low cytotoxicity. This difficulty was solved by refining and better defin-ing the criteria for the evaluation of cytotoxicity. For the kidney cells, the calculation of IC10 based on the MTT assay alone appeared to be problematic since low concen-trations of compounds showed increased MTT conver-sion compared to controls, possibly due to an increase in redox potential. The MTT experiments were thus comple-mented with the LDH assay, the supernatant lactate assay and morphological examination including loss of domes (indicative of loss of epithelial barrier function) where appropriate.
Overall, the laboratories generated acceptable and com-parable MTT results for each of the compounds. Based on these IC10 values, each laboratory carried out the main experiments and generated the samples for transcriptome analyses. Among the laboratories evaluating the kidney model, LJM encountered some problems with the growth of the RPTEC/TERT1 cells, which was very slow possibly because of a detected bacterial infection. In this laboratory, 3–4 weeks was necessary to fully differentiate the cells, compared to 2 weeks in the other laboratories. Experi-mental results of the liver pre-validation have already been described in Doktorova et al. (2014).
Inter‑laboratory reproducibility and robustness of in vitro assays: workflow 1
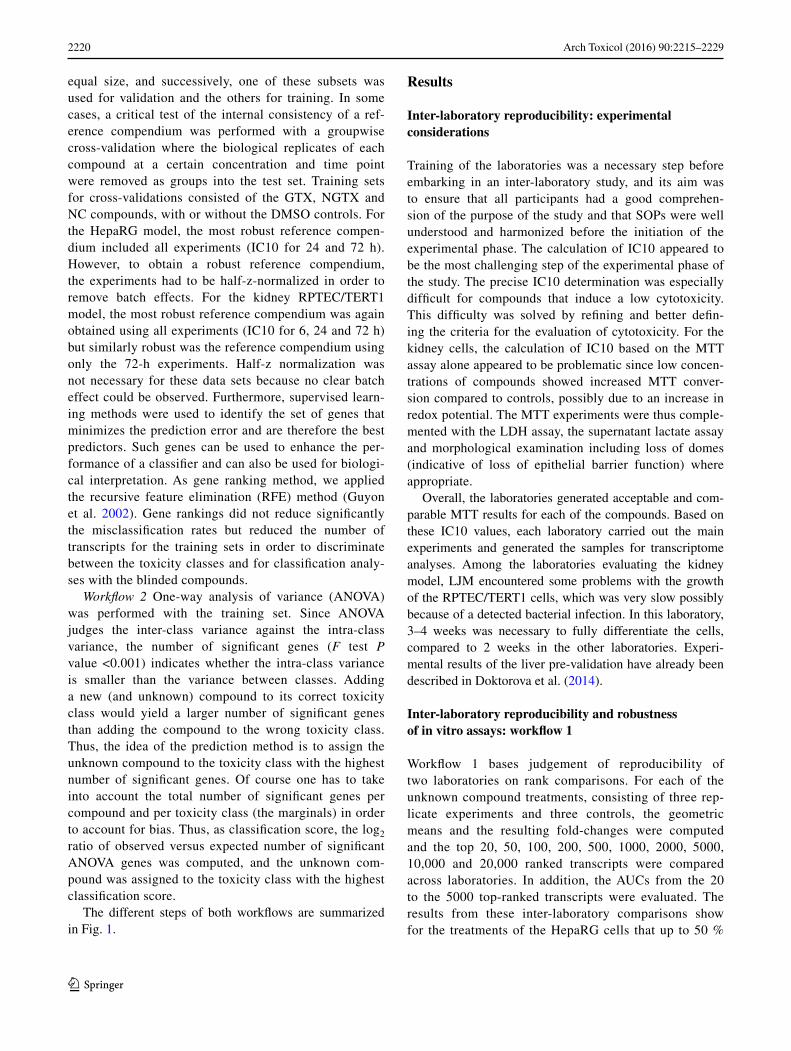
Workflow 1 bases judgement of reproducibility of two laboratories on rank comparisons. For each of the unknown compound treatments, consisting of three rep-licate experiments and three controls, the geometric means and the resulting fold-changes were computed and the top 20, 50, 100, 200, 500, 1000, 2000, 5000, 10,000 and 20,000 ranked transcripts were compared across laboratories. In addition, the AUCs from the 20 to the 5000 top-ranked transcripts were evaluated. The results from these inter-laboratory comparisons show for the treatments of the HepaRG cells that up to 50 %
2221Arch Toxicol (2016) 90:2215–2229
1 3
overlapping transcripts can be detected using the top 20 ranked transcripts and up to 60 % overlaps using the top 20,000 ranked transcripts (Fig. 2). Comparing the AUCs between the 20 and 5000 top-ranked transcripts show that up to ~35 % of the compared treatments over-lap with the reference treatment. The procedure led to a clear separation of reproducible from non-reproduc-ible experiments. For example, compound D showed high overlaps with all pairwise comparisons (Fig. 2a), whereas compound F experiment of BPI shows over-laps close to randomness with the other two laboratories (Fig. 2b). The RPTEC/TERT1 assay showed high over-laps for all compounds when comparing UCD and IMU data, while the overlap of LJM with the other data was rather poor as is shown exemplarily for compound G (Fig. 2c, d), reflecting the problems with the growth of the cells in that laboratory. Comparison of the overlap-ping transcripts and the AUCs from the two other labo-ratories show high overlaps of up to 45 %; the highest values were obtained comparing the compound B. All curves for both assays are shown in Suppl. Fig. 2 and 3.
Inter‑laboratory reproducibility and robustness of in vitro assays: workflow 2
An immediate and crucial question is whether the cells express the same genes when cultivated independently in three different laboratories. We computed the average detection P value for each gene across the replicated exper-iments of each individual laboratory as provided by the MAS5 software. This P value indicates whether the meas-ured intensity of the oligoprobe set is significantly different from the background intensity and thus whether the corre-sponding gene is expressed (P value <0.01) or not (P value ≥0.01) in the system under study.
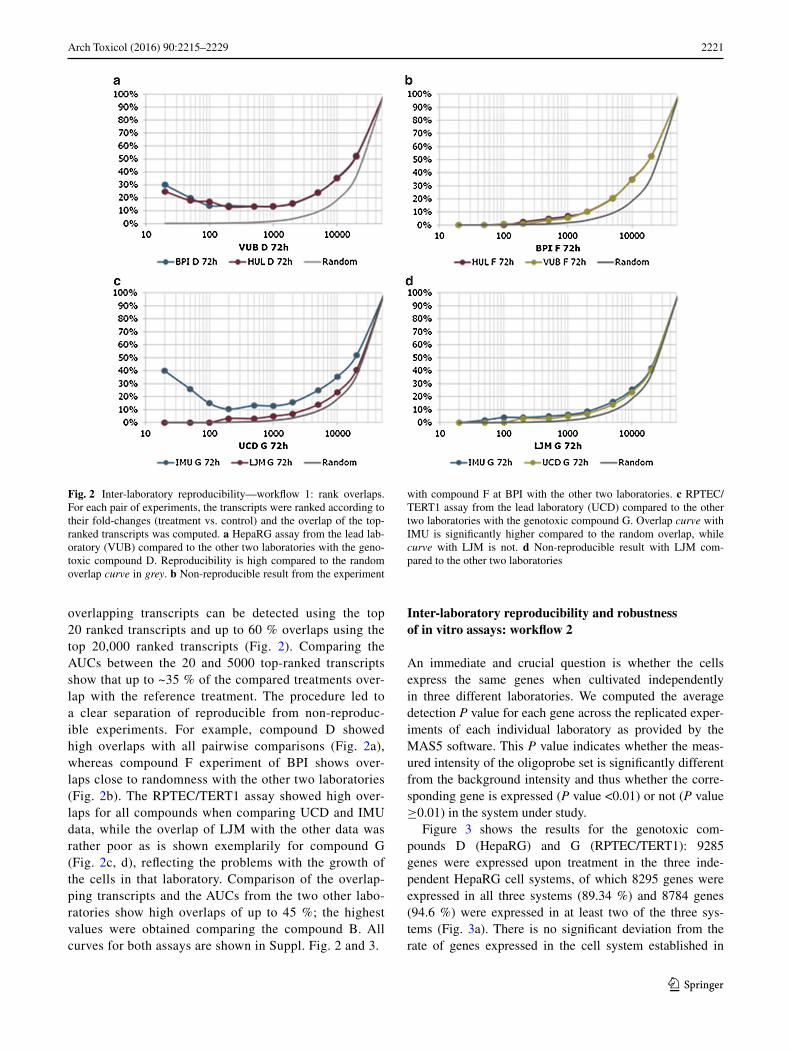
Figure 3 shows the results for the genotoxic com-pounds D (HepaRG) and G (RPTEC/TERT1): 9285 genes were expressed upon treatment in the three inde-pendent HepaRG cell systems, of which 8295 genes were expressed in all three systems (89.34 %) and 8784 genes (94.6 %) were expressed in at least two of the three sys-tems (Fig. 3a). There is no significant deviation from the rate of genes expressed in the cell system established in
Fig. 2 Inter-laboratory reproducibility—workflow 1: rank overlaps. For each pair of experiments, the transcripts were ranked according to their fold-changes (treatment vs. control) and the overlap of the top-ranked transcripts was computed. a HepaRG assay from the lead lab-oratory (VUB) compared to the other two laboratories with the geno-toxic compound D. Reproducibility is high compared to the random overlap curve in grey. b Non-reproducible result from the experiment
with compound F at BPI with the other two laboratories. c RPTEC/TERT1 assay from the lead laboratory (UCD) compared to the other two laboratories with the genotoxic compound G. Overlap curve with IMU is significantly higher compared to the random overlap, while curve with LJM is not. d Non-reproducible result with LJM com-pared to the other two laboratories
2222 Arch Toxicol (2016) 90:2215–2229
1 3
the lead lab compared to the other two laboratories. While 8680 genes were expressed in the HepaRG system estab-lished at VUB, this number was 8708 at BPI (factor 1.003) and 8976 at HUL (factor 1.034). In the RPTEC/TERT1 system, a slightly lower number of genes were expressed upon treatment (8697). Of these genes, 6046 (69.52 %) were expressed in all three laboratories and 7908 (90.93 %) were expressed in at least two (Fig. 3b). The poorer over-all concordance of expressed genes is mainly due to results from one laboratory (LJM) which are less comparable with the other two. In consequence, there is a significant devia-tion from the rate of expressed genes established at the lead lab. While 8482 genes were expressed in the RPTEC/TERT1 system at UCD, this rate is similar at IMU (7962, factor 0.94) but much lower at LJM (6207, factor 0.73). We specifically investigated the functional characteristics of the 1773 genes that were exclusively expressed in the RPTEC/TERT1 systems at UCD and IMU and computed
gene ontology categories (Ashburner et al. 2000) that were over-represented by these genes. Over-represented func-tional categories were associated with mitochondrion (211 genes) and organelle organization, in particular centrosome (62) and cilium (28). This might point to the fact that the LJM system might miss some important cellular functions (Fig. 3c). Additional investigations into the problems with the RPTEC/TERT1 cell culture in LJM indicated that the cells were consuming glucose at a much higher rate than normal and that glutamate and lactate were accumulating at a much higher rate in the cells. These findings plus the iden-tification of gene expression relevant to an E. coli infection pathway in the samples from LJM but not those from UCD and IMU indicate that a bacterial infection could be respon-sible for the lack of inter-laboratory reproducibility.
Finally, we investigated the overlap in expressed genes in all three liver and two kidney systems (Fig. 3d). Out of 9199 genes that were expressed in both in vitro assays upon
Fig. 3 Gene expression in the assay systems. a VENN diagram of genes expressed in the HepaRG assay measured in the three differ-ent laboratories. b VENN diagram of genes expressed in the RPTEC/TERT1 assay measured in the three laboratories. c GO functional
classes enriched by the 1773 genes (P < 10−4) that were exclusively expressed in two kidney laboratories (UCD and IMU) and that were missed by the third (LJM). d VENN diagram of genes expressed by the two assays
2223Arch Toxicol (2016) 90:2215–2229
1 3
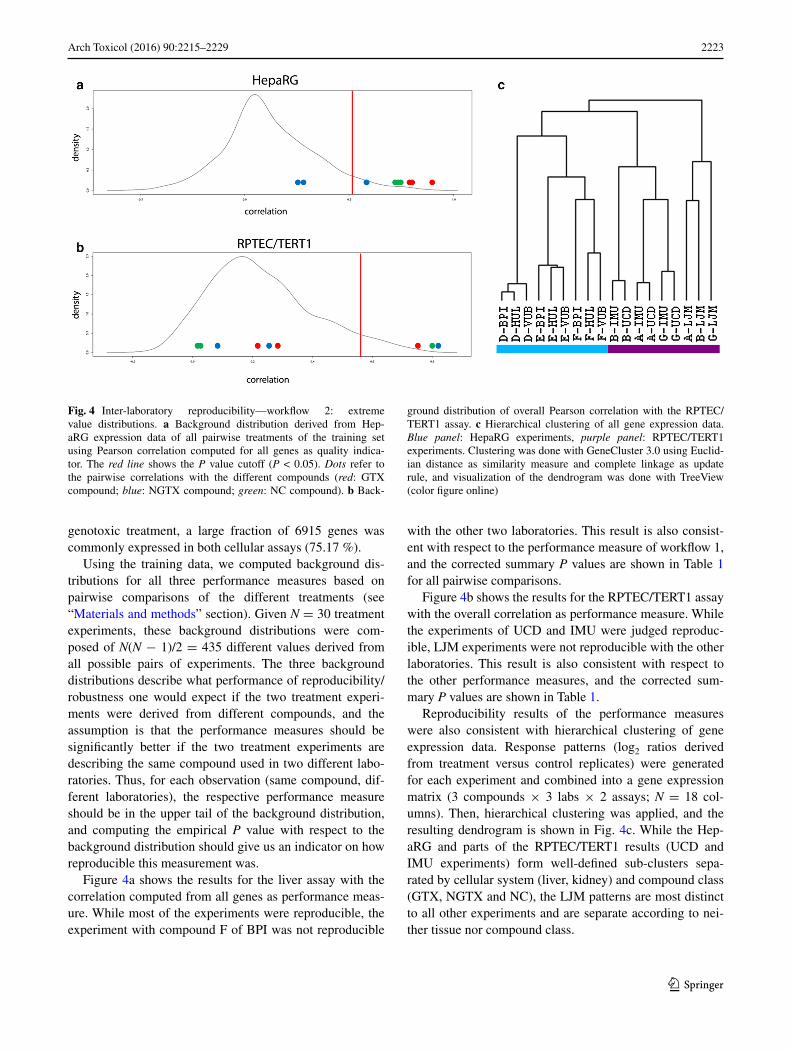
genotoxic treatment, a large fraction of 6915 genes was commonly expressed in both cellular assays (75.17 %).
Using the training data, we computed background dis-tributions for all three performance measures based on pairwise comparisons of the different treatments (see “Materials and methods” section). Given N = 30 treatment experiments, these background distributions were com-posed of N(N − 1)/2 = 435 different values derived from all possible pairs of experiments. The three background distributions describe what performance of reproducibility/robustness one would expect if the two treatment experi-ments were derived from different compounds, and the assumption is that the performance measures should be significantly better if the two treatment experiments are describing the same compound used in two different labo-ratories. Thus, for each observation (same compound, dif-ferent laboratories), the respective performance measure should be in the upper tail of the background distribution, and computing the empirical P value with respect to the background distribution should give us an indicator on how reproducible this measurement was.
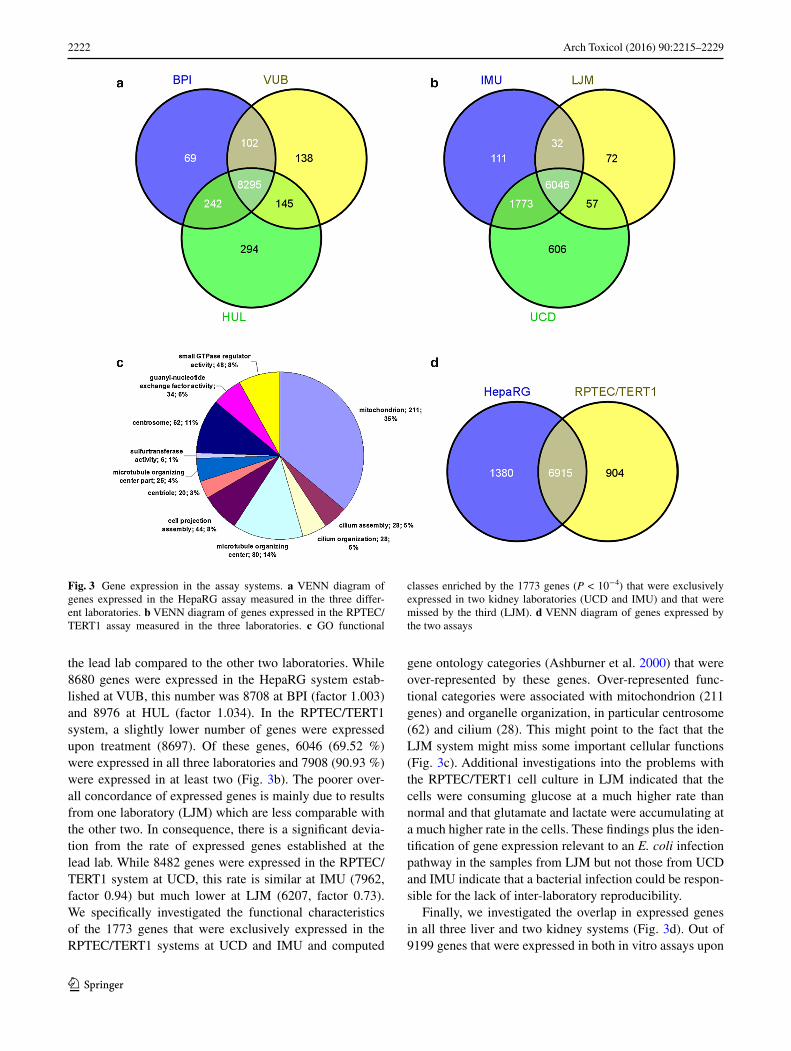
Figure 4a shows the results for the liver assay with the correlation computed from all genes as performance meas-ure. While most of the experiments were reproducible, the experiment with compound F of BPI was not reproducible
with the other two laboratories. This result is also consist-ent with respect to the performance measure of workflow 1, and the corrected summary P values are shown in Table 1 for all pairwise comparisons.
Figure 4b shows the results for the RPTEC/TERT1 assay with the overall correlation as performance measure. While the experiments of UCD and IMU were judged reproduc-ible, LJM experiments were not reproducible with the other laboratories. This result is also consistent with respect to the other performance measures, and the corrected sum-mary P values are shown in Table 1.
Reproducibility results of the performance measures were also consistent with hierarchical clustering of gene expression data. Response patterns (log2 ratios derived from treatment versus control replicates) were generated for each experiment and combined into a gene expression matrix (3 compounds × 3 labs × 2 assays; N = 18 col-umns). Then, hierarchical clustering was applied, and the resulting dendrogram is shown in Fig. 4c. While the Hep-aRG and parts of the RPTEC/TERT1 results (UCD and IMU experiments) form well-defined sub-clusters sepa-rated by cellular system (liver, kidney) and compound class (GTX, NGTX and NC), the LJM patterns are most distinct to all other experiments and are separate according to nei-ther tissue nor compound class.
Fig. 4 Inter-laboratory reproducibility—workflow 2: extreme value distributions. a Background distribution derived from Hep-aRG expression data of all pairwise treatments of the training set using Pearson correlation computed for all genes as quality indica-tor. The red line shows the P value cutoff (P < 0.05). Dots refer to the pairwise correlations with the different compounds (red: GTX compound; blue: NGTX compound; green: NC compound). b Back-
ground distribution of overall Pearson correlation with the RPTEC/TERT1 assay. c Hierarchical clustering of all gene expression data. Blue panel: HepaRG experiments, purple panel: RPTEC/TERT1 experiments. Clustering was done with GeneCluster 3.0 using Euclid-ian distance as similarity measure and complete linkage as update rule, and visualization of the dendrogram was done with TreeView (color figure online)
2224 Arch Toxicol (2016) 90:2215–2229
1 3
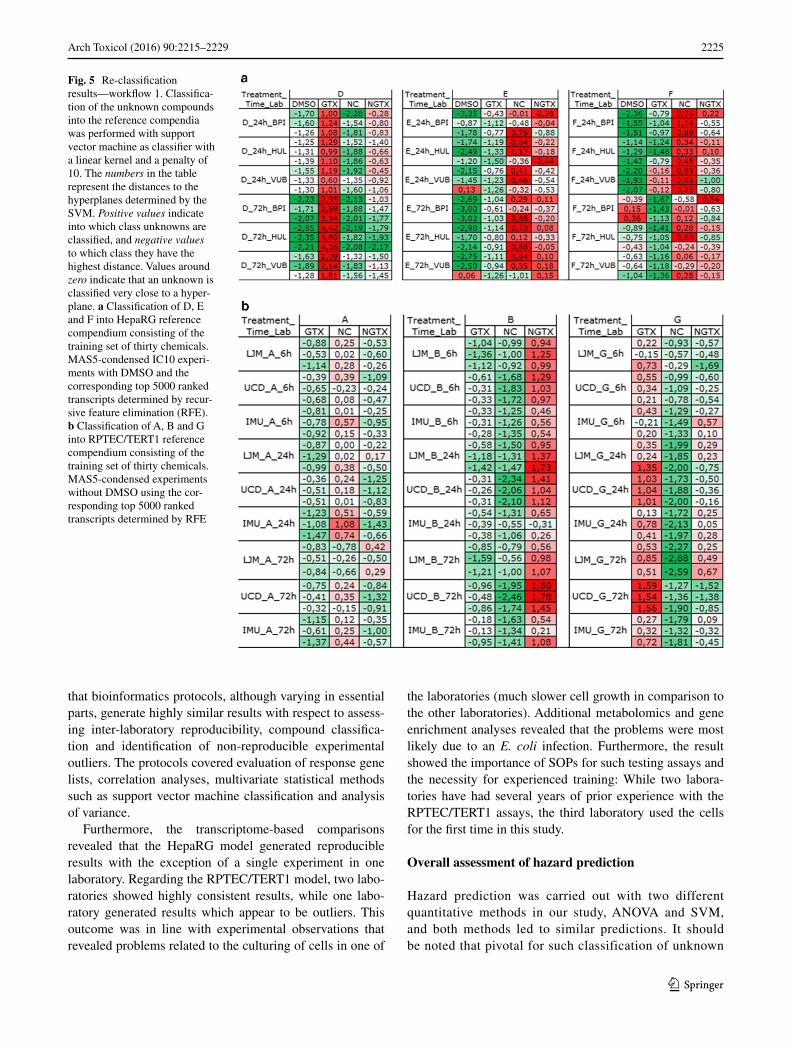
Re‑classification of unknown chemicals: workflow 1
Cross-validations with the HepaRG training sets were per-formed with or without the DMSO controls. Lowest mis-classification rates with 91 % correctly classified experi-ments were obtained with half-z-normalized data without the controls. However, all other tested training sets result in misclassification rates <17 %. Classifying the com-pounds D, E and F and the corresponding DMSO con-trols with SVM as classifier using the reference compen-dium consisting of the thirty compounds and the top 5000 ranked transcripts selected by the recursive feature elimi-nation procedure showed that the DMSO controls classify clearly as controls (Fig. 5a). Compound D was unequivo-cally classified as GTX, but the compounds E and F did not show clear tendencies of classifications into a toxicity class; they are classified equally well as non-genotoxic or as non-carcinogen but definitely not as genotoxic. E 72-h experiments were classified mostly as NGTX. In regard to
reproducibility, most of the treatments from the three labo-ratories were classified into the same toxicity class.
Cross-validations with the RPTEC/TERT1 training sets were performed either with all time points or for each time point (6, 24, 72 h) separately, with only MAS5-condensed data or MAS5-condensed and relative normalized data. Lowest misclassification rates (>80 % correctly classi-fied experiments) were obtained using either the experi-ments from all time points (without the DMSO controls) or the 72-h experiments alone. The 6- or 24-h experiments alone resulted in higher misclassification rates (~30 %). A relative normalization does not lead to lower misclas-sification rates. Classifications with SVM as classifier of the compounds A, B and G into the reference compendia consisting of the previously described training sets can be summarized as follows: compound A is classified as NC, compound B as NGTX and compound G as GTX. Figure 5b shows as an example the classification results using the reference compendium consisting of MAS5-condensed experiments without DMSO controls using the top 5000 ranked transcripts determined by RFE. In regard to reproducibility, most of the three compounds from the three laboratories were classified into the same toxicity class.
Re‑classification of unknown chemicals: workflow 2
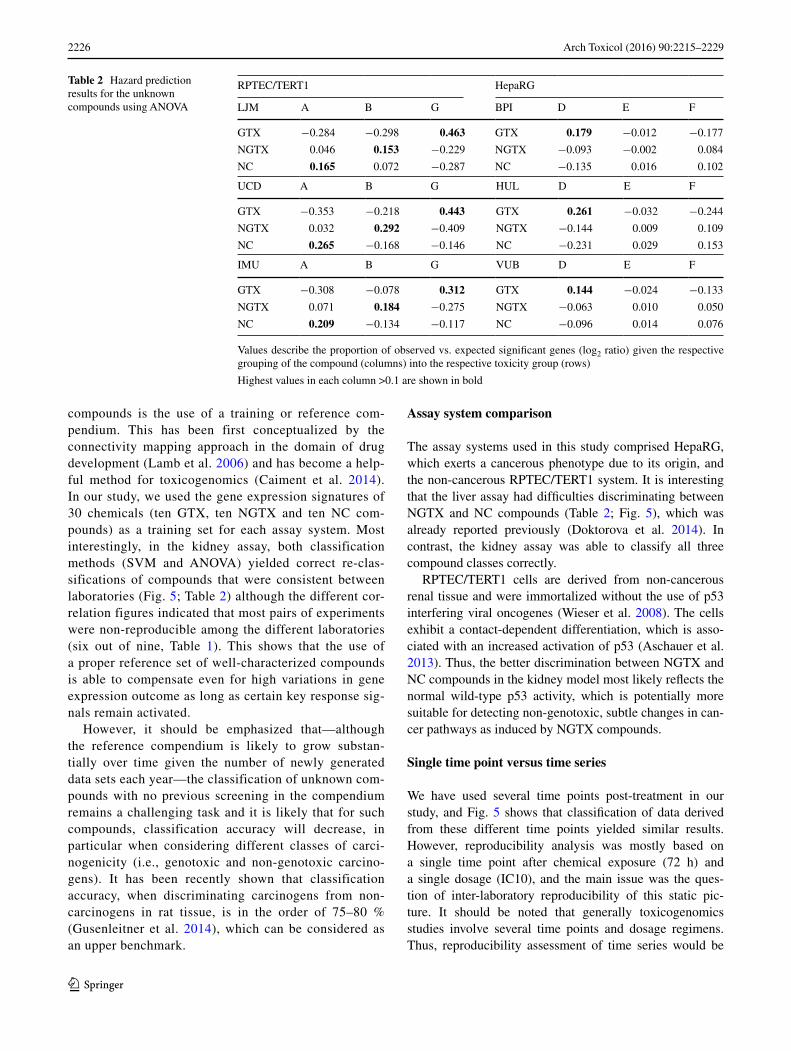
Workflow 2 applied an ANOVA method (see “Materials and methods” section) using the training set. Blinded com-pounds were successively assigned to each toxicity class, and in each case, the number of significant genes was recorded. This observed number was then compared to the expected number of significant genes, and the unknown compound was assigned to the toxicity class with the high-est deviation of observed versus expected numbers (log2 ratios). Table 2 gives an overview for both systems.
As a result of the hazard prediction for HepaRG, com-pound D was predicted consistently as GTX by all three laboratories, whereas for the two other compounds, pre-diction was not as clear. For the RPTEC/TERT1 model, all laboratories showed consistent predictions, i.e., compound G was predicted as GTX, compound B as NGTX and com-pound A as NC.
Discussion
Overall assessment of inter‑laboratory reproducibility
In this study, we addressed the issue of judging reproduci-bility of two human in vitro assays for carcinogenicity test-ing (1) across different laboratories and (2) with different bioinformatics protocols. As the primary result, we found
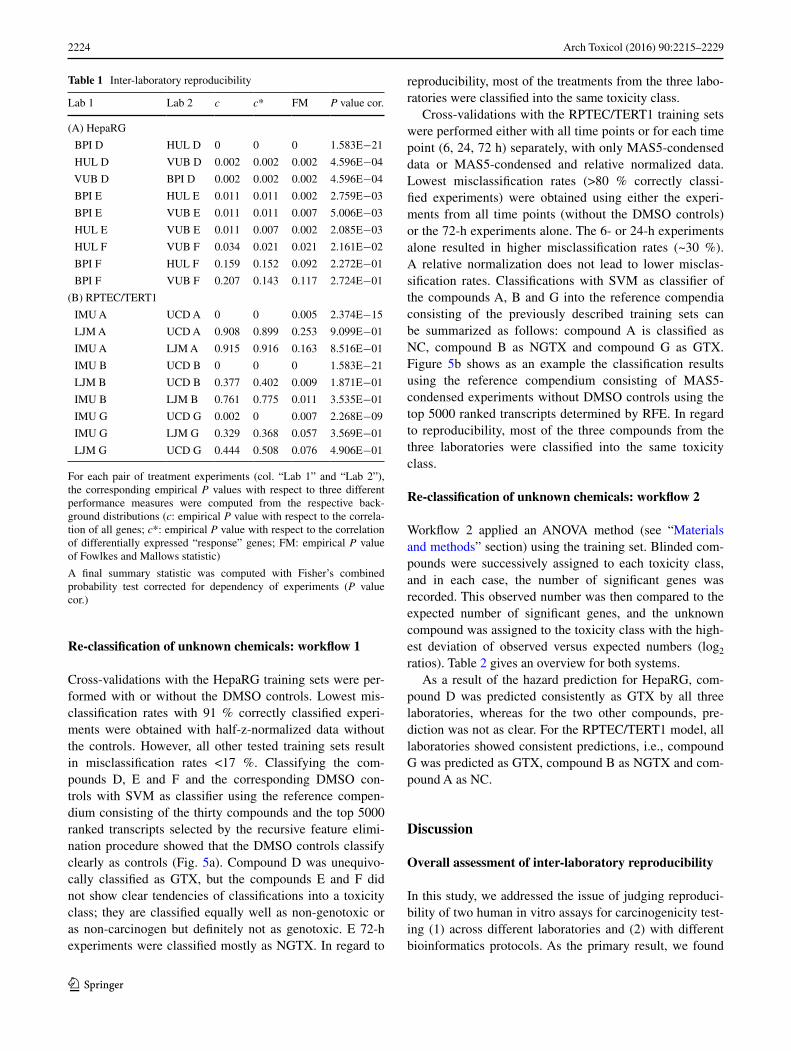
Table 1 Inter-laboratory reproducibility
For each pair of treatment experiments (col. “Lab 1” and “Lab 2”), the corresponding empirical P values with respect to three different performance measures were computed from the respective back-ground distributions (c: empirical P value with respect to the correla-tion of all genes; c*: empirical P value with respect to the correlation of differentially expressed “response” genes; FM: empirical P value of Fowlkes and Mallows statistic)
A final summary statistic was computed with Fisher’s combined probability test corrected for dependency of experiments (P value cor.)
Lab 1 Lab 2 c c* FM P value cor.
(A) HepaRG
BPI D HUL D 0 0 0 1.583E−21
HUL D VUB D 0.002 0.002 0.002 4.596E−04
VUB D BPI D 0.002 0.002 0.002 4.596E−04
BPI E HUL E 0.011 0.011 0.002 2.759E−03
BPI E VUB E 0.011 0.011 0.007 5.006E−03
HUL E VUB E 0.011 0.007 0.002 2.085E−03
HUL F VUB F 0.034 0.021 0.021 2.161E−02
BPI F HUL F 0.159 0.152 0.092 2.272E−01
BPI F VUB F 0.207 0.143 0.117 2.724E−01
(B) RPTEC/TERT1
IMU A UCD A 0 0 0.005 2.374E−15
LJM A UCD A 0.908 0.899 0.253 9.099E−01
IMU A LJM A 0.915 0.916 0.163 8.516E−01
IMU B UCD B 0 0 0 1.583E−21
LJM B UCD B 0.377 0.402 0.009 1.871E−01
IMU B LJM B 0.761 0.775 0.011 3.535E−01
IMU G UCD G 0.002 0 0.007 2.268E−09
IMU G LJM G 0.329 0.368 0.057 3.569E−01
LJM G UCD G 0.444 0.508 0.076 4.906E−01
2225Arch Toxicol (2016) 90:2215–2229
1 3
that bioinformatics protocols, although varying in essential parts, generate highly similar results with respect to assess-ing inter-laboratory reproducibility, compound classifica-tion and identification of non-reproducible experimental outliers. The protocols covered evaluation of response gene lists, correlation analyses, multivariate statistical methods such as support vector machine classification and analysis of variance.
Furthermore, the transcriptome-based comparisons revealed that the HepaRG model generated reproducible results with the exception of a single experiment in one laboratory. Regarding the RPTEC/TERT1 model, two labo-ratories showed highly consistent results, while one labo-ratory generated results which appear to be outliers. This outcome was in line with experimental observations that revealed problems related to the culturing of cells in one of
the laboratories (much slower cell growth in comparison to the other laboratories). Additional metabolomics and gene enrichment analyses revealed that the problems were most likely due to an E. coli infection. Furthermore, the result showed the importance of SOPs for such testing assays and the necessity for experienced training: While two labora-tories have had several years of prior experience with the RPTEC/TERT1 assays, the third laboratory used the cells for the first time in this study.
Overall assessment of hazard prediction
Hazard prediction was carried out with two different quantitative methods in our study, ANOVA and SVM, and both methods led to similar predictions. It should be noted that pivotal for such classification of unknown
Fig. 5 Re-classification results—workflow 1. Classifica-tion of the unknown compounds into the reference compendia was performed with support vector machine as classifier with a linear kernel and a penalty of 10. The numbers in the table represent the distances to the hyperplanes determined by the SVM. Positive values indicate into which class unknowns are classified, and negative values to which class they have the highest distance. Values around zero indicate that an unknown is classified very close to a hyper-plane. a Classification of D, E and F into HepaRG reference compendium consisting of the training set of thirty chemicals. MAS5-condensed IC10 experi-ments with DMSO and the corresponding top 5000 ranked transcripts determined by recur-sive feature elimination (RFE). b Classification of A, B and G into RPTEC/TERT1 reference compendium consisting of the training set of thirty chemicals. MAS5-condensed experiments without DMSO using the cor-responding top 5000 ranked transcripts determined by RFE
2226 Arch Toxicol (2016) 90:2215–2229
1 3
compounds is the use of a training or reference com-pendium. This has been first conceptualized by the connectivity mapping approach in the domain of drug development (Lamb et al. 2006) and has become a help-ful method for toxicogenomics (Caiment et al. 2014). In our study, we used the gene expression signatures of 30 chemicals (ten GTX, ten NGTX and ten NC com-pounds) as a training set for each assay system. Most interestingly, in the kidney assay, both classification methods (SVM and ANOVA) yielded correct re-clas-sifications of compounds that were consistent between laboratories (Fig. 5; Table 2) although the different cor-relation figures indicated that most pairs of experiments were non-reproducible among the different laboratories (six out of nine, Table 1). This shows that the use of a proper reference set of well-characterized compounds is able to compensate even for high variations in gene expression outcome as long as certain key response sig-nals remain activated.
However, it should be emphasized that—although the reference compendium is likely to grow substan-tially over time given the number of newly generated data sets each year—the classification of unknown com-pounds with no previous screening in the compendium remains a challenging task and it is likely that for such compounds, classification accuracy will decrease, in particular when considering different classes of carci-nogenicity (i.e., genotoxic and non-genotoxic carcino-gens). It has been recently shown that classification accuracy, when discriminating carcinogens from non-carcinogens in rat tissue, is in the order of 75–80 % (Gusenleitner et al. 2014), which can be considered as an upper benchmark.
Assay system comparison
The assay systems used in this study comprised HepaRG, which exerts a cancerous phenotype due to its origin, and the non-cancerous RPTEC/TERT1 system. It is interesting that the liver assay had difficulties discriminating between NGTX and NC compounds (Table 2; Fig. 5), which was already reported previously (Doktorova et al. 2014). In contrast, the kidney assay was able to classify all three compound classes correctly.
RPTEC/TERT1 cells are derived from non-cancerous renal tissue and were immortalized without the use of p53 interfering viral oncogenes (Wieser et al. 2008). The cells exhibit a contact-dependent differentiation, which is asso-ciated with an increased activation of p53 (Aschauer et al. 2013). Thus, the better discrimination between NGTX and NC compounds in the kidney model most likely reflects the normal wild-type p53 activity, which is potentially more suitable for detecting non-genotoxic, subtle changes in can-cer pathways as induced by NGTX compounds.
Single time point versus time series
We have used several time points post-treatment in our study, and Fig. 5 shows that classification of data derived from these different time points yielded similar results. However, reproducibility analysis was mostly based on a single time point after chemical exposure (72 h) and a single dosage (IC10), and the main issue was the ques-tion of inter-laboratory reproducibility of this static pic-ture. It should be noted that generally toxicogenomics studies involve several time points and dosage regimens. Thus, reproducibility assessment of time series would be
Table 2 Hazard prediction results for the unknown compounds using ANOVA
Values describe the proportion of observed vs. expected significant genes (log2 ratio) given the respective grouping of the compound (columns) into the respective toxicity group (rows)
Highest values in each column >0.1 are shown in bold
RPTEC/TERT1 HepaRG
LJM A B G BPI D E F
GTX −0.284 −0.298 0.463 GTX 0.179 −0.012 −0.177
NGTX 0.046 0.153 −0.229 NGTX −0.093 −0.002 0.084
NC 0.165 0.072 −0.287 NC −0.135 0.016 0.102
UCD A B G HUL D E F
GTX −0.353 −0.218 0.443 GTX 0.261 −0.032 −0.244
NGTX 0.032 0.292 −0.409 NGTX −0.144 0.009 0.109
NC 0.265 −0.168 −0.146 NC −0.231 0.029 0.153
IMU A B G VUB D E F
GTX −0.308 −0.078 0.312 GTX 0.144 −0.024 −0.133
NGTX 0.071 0.184 −0.275 NGTX −0.063 0.010 0.050
NC 0.209 −0.134 −0.117 NC −0.096 0.014 0.076
2227Arch Toxicol (2016) 90:2215–2229
1 3
of interest but could not be addressed by this work. Build-ing statistical models from time course and multiple dosage data could be done with established statistical tools such as limma (Ritchie et al. 2015) or STEM (Ernst and Bar-Joseph 2006), and it is anticipated that such time series analysis will improve reproducibility judgement as well as hazard classification.
Transcriptomics as a platform for in vitro analysis of chemical carcinogenesis
The central read-out of our study was the transcriptome of the cells under study measured with microarrays. This is similar to large worldwide studies, such as TG-GATES (Kiyosawa et al. 2009) and DrugMatrix (Ganter et al. 2005), and it has been shown that reliable classifiers can be retrieved from such data (Gusenleitner et al. (2014)). Additionally, in light of technology development, there are attempts to improve transcriptomics-based toxicogenomics by the use of high-throughput sequencing platforms which provide more complete genomic signatures and novel infor-mation, for example on differential splicing (van Delft et al. 2012), and which appear increasingly efficient, both in cost and in accuracy (Wang et al. 2014).
Overall, our results present a proof of concept that gene expression analysis is a robust method for investigating chemical-induced injury across different laboratories. This study together with previous experience demonstrates the importance of rigorous and standardized protocols and the need for replicates (N = 3) and appropriate time-matched controls (Jennings et al. 2009).
However, we also identified several shortcomings of the transcriptome approach. First, it should be noted that chem-ical exposure can induce variable outputs even for the same cellular system under analysis. Figure 3a, b indicates that in the case of the HepaRG system, 11 % of the expressed genes in the cells were specific for a single laboratory. In the case of the RPTEC/TERT1 system, where one labo-ratory generated an outlier result, this fraction increases even to 30 %. The variability problem could in principle be solved by involving an even higher number of independ-ent laboratories for testing the assay system, but such an approach seems unpractical because of the imposed costs and time efforts. Instead, we recommend a minimum of three laboratories for inter-laboratory assessment studies of test methods in order to be able to detect such experimen-tal outliers. Secondly, it might become difficult to assess reproducibility when the compound under study induces only a small number of transcriptome changes. A poten-tial solution here could be the incorporation of reference compounds in future experimental setups, for example the compounds used in this study which have a clear response pattern. For testing the reproducibility in liver or kidney
systems, a list of top-ranked transcripts of a reference com-pound could be provided and the positive control consisting of the same reference compound under the same conditions could be compared with the reference.
Finally, it should be noted that a pre-validation study is still a challenging task regarding time and costs. With our setup (i.e., three laboratories, three replicates per com-pound with time-matched control), 18 microarray measure-ments are necessary per time point and dose, which drives the cost factor. However, while experimental costs seem to decrease due to technology development, the time factor is likely to persist. As a matter of fact, the present study took about 1 year from training of the laboratories to the analysis of data. It should be noted that resources for the manage-ment of such study (e.g., organization of training, chemical coding and distribution, etc.) need also to be considered.
Acknowledgments We thank Anja Heymans and Michael David for technical assistance. This work was supported by the European Commission under its 6th Framework Programme with the Grant car-cinoGENOMICS (LSHB-CT-2006-037712) and under its 7th Frame-work Programme with the Grant diXa (283775).
Compliance with ethical standards
Conflict of interest Hans Gmuender, Timo Wittenberger and Arndt Brandenburg are employees of GeneData AG, a company that provides bioinformatics service. Christophe Chesne is employee of Biopredic International, a company that provides human in vitro assays.
References
Annys E, Billington R, Clayton R, Bremm KD, Graziano M, McKel-vie J, Ragan I, Schwarz M, van der Laan JW, Wood C, Öberg M, Wester P, Woodward KN (2014) Advancing the 3Rs in regula-tory toxicology—carcinogenicity testing: scope for harmoniza-tion and advancing the 3Rs in regulated sectors of the European Union. Regul Toxicol Pharmacol 69:234–242
Aschauer L, Gruber LN, Pfaller W, Limonciel A, Athersuch TJ, Cav-ill R, Khan A, Gstraunthaler G, Grillari J, Grillari R, Hewitt P, Leonard MO, Wilmes A, Jennings P (2013) Delineation of the key aspects in the regulation of epithelial monolayer formation. Mol Cell Biol 33:2535–2550
Ashburner M, Ball CA, Blake JA, Botstein D, Butler H, Cherry JM, Davis AP, Dolinski K, Dwight SS, Eppig JT, Harris MA, Hill DP, Issel-Tarver L, Kasarskis A, Lewis S, Matese JC, Richardson JE, Ringwald M, Rubin GM, Sherlock G (2000) Gene ontology: tool for the unification of biology. The Gene Ontology Consortium. Nat Genet 25:25–29
Caiment F, Tsamou M, Jennen D, Kleinjans J (2014) Assessing com-pound carcinogenicity in vitro connectivity mapping. Carcino-genesis 35:201–207
Cristianini N, Shawe-Taylor J (2000) An introduction to support vec-tor machines and other kernel-based learning methods. Cam-bridge University Press, Cambridge
Dai M, Wang P, Boyd AD, Kostov G, Athey B, Jones EG, Bunney WE, Myers RM, Speed TP, Akil H, Watson SJ, Meng F (2005) Evolving gene/transcript definitions significantly alter the inter-pretation of GeneChip data. Nucleic Acids Res 33:e175
2228 Arch Toxicol (2016) 90:2215–2229
1 3
Doktorova TY, Yildirimman R, Vinken M, Vilardell M, Vanhaecke T, Gmuender H, Bort R, Brolen G, Holmgren G, Li R, Chesne C, van Delft J, Kleinjans J, Castell J, Bjorquist P, Herwig R, Rogiers V (2013) Transcriptomic responses generated by hepato-carcinogens in a battery of liver-based in vitro models. Carcino-genesis 34:1393–1402
Doktorova T, Yildirimman R, Ceelen L, Vilardell M, Vanhaecke T, Vinken M, Ates G, Heymans A, Gmuender H, Bort R, Corvi R, Phrakonkham P, Li R, Mouchet N, Chesne C, van Delft J, Klein-jans J, Castell J, Herwig R, Rogiers V (2014) Testing chemi-cal carcinogenicity by using a transcriptomics HepaRG-based model. Exp Clin Sci J 13:623–637
Ernst J, Bar-Joseph Z (2006) STEM: a tool for the analysis of short time series gene expression data. BMC Bioinform 7:191
Fan X, Shao L, Fang H, Tong W, Cheng Y (2011) Cross-platform comparison of microarray-based multiple-class prediction. PLoS ONE 6:e16067
Fowlkes EB, Mallows CL (1983) A method for comparing two hierar-chical clusterings. J Am Stat Assoc 78:553–569
Ganter B et al (2005) Development of a large-scale chemogenom-ics database to improve drug candidate selection and to under-stand mechanisms of chemical toxicity and action. J Biotechnol 119:219–244
Gómez-Lechón MJ, Castell JV, Donato MT (2010) The use of hepatocytes to investigate drug toxicity. Methods Mol Biol 640:389–415
Gusenleitner D, Auerbach SS, Melia T, Gómez HF, Sherr DH, Monti S (2014) Genomic models of short-term exposure accurately predict long-term chemical carcinogenicity and identify putative mechanisms of action. PLoS ONE 9:e102579
Guyon I, Weston J, Barnhill S, Vapnik V (2002) Gene selection for cancer classification using support vector machines. Mach Learn 46:389–422
Hartung T, Bremer S, Casati S, Coecke S, Corvi R, Fortaner S, Grib-aldo L, Halder M, Hoffmann S, Roi AJ, Prieto P, Sabbioni E, Scott L, Worth A, Zuang V (2004) A modular approach to the ECVAM principles on test validity. Altern Lab Anim 32:467–472
Ioannidis JP, Khoury MJ (2011) Improving validation practices in “omics” research. Science 334:1230–1232
Irizarry RA, Warren D, Spencer F, Kim IF, Biswal S, Frank BC, Gabrielson E, Garcia JG, Geoghegan J, Germino G, Griffin C, Hilmer SC, Hoffman E, Jedlicka AE, Kawasaki E, Martínez-Murillo F, Morsberger L, Lee H, Petersen D, Quackenbush J, Scott A, Wilson M, Yang Y, Ye SQ, Yu W (2005) Multiple-laboratory comparison of microarray platforms. Nat Methods 2:345–350
Jennen DG, Magkoufopoulou C, Ketelslegers HB, van Herwijnen MH, Kleinjans JC, van Delft JH (2010) Comparison of HepG2 and HepaRG by whole-genome gene expression analysis for the purpose of chemical hazard identification. Toxicol Sci 115:66–79
Jennings P, Aydin S, Bennett J, McBride R, Weiland C, Tuite N, Gru-ber LN, Perco P, Gaora PO, Ellinger-Ziegelbauer H, Ahr HJ, Kooten CV, Daha MR, Prieto P, Ryan MP, Pfaller W, McMorrow T (2009) Inter-laboratory comparison of human renal proximal tubule (HK-2) transcriptome alterations due to Cyclosporine A exposure and medium exhaustion. Toxicol In Vitro 23:486–499
Jennings P, Weiland C, Limonciel A, Bloch KM, Radford R, Aschauer L, McMorrow T, Wilmes A, Pfaller W, Ahr HJ, Slattery C, Lock EA, Ryan MP, Ellinger-Ziegelbauer H (2012) Transcriptomic alterations induced by Ochratoxin A in rat and human renal proximal tubular in vitro models and comparison to a rat in vivo model. Arch Toxicol 86:571–589
Kiyosawa N, Ando Y, Watanabe K, Niino N, Manabe S, Yamoto T (2009) Scoring multiple toxicological endpoints using a toxicog-enomics database. Toxicol Lett 188:91–97
Lamb J, Crawford ED, Peck D, Modell JW, Blat IC, Wrobel MJ, Lerner J, Brunet JP, Subramanian A, Ross KN, Reich M, Hiero-nymus H, Wei G, Armstrong SA, Haggarty SJ, Clemons PA, Wei R, Carr SA, Lander ES, Golub TR (2006) The connectivity map: using gene-expression signatures to connect small molecules, genes and diseases. Science 313:1929–1935
Limonciel A, Aschauer L, Wilmes A, Prajczer S, Leonard MO, Pfaller W, Jennings P (2011) Lactate is an ideal non-invasive marker for evaluating temporal alterations in cell stress and toxicity in repeat dose testing regimes. Toxicol In Vitro 25:1855–1862
Limonciel A, Wilmes A, Aschauer L, Radford R, Bloch KM, McMor-row T, Pfaller W, van Delft JH, Slattery C, Ryan MP, Lock EA, Jennings P (2012) Oxidative stress induced by potassium bro-mate exposure results in altered tight junction protein expression in renal proximal tubule cells. Arch Toxicol 86:1741–1751
MAQC Consortium (2006) The microarray quality control (MAQC) project shows inter- and intraplatform reproducibility of gene expression measurements. Nat Biotechnol 24:1151–1161
MAQC Consortium (2010) The microarray quality control (MAQC)-II study of common practices for the development and valida-tion of microarray-based predictive models. Nat Biotechnol 28:827–838
Paules RS, Aubrecht J, Corvi R, Garthoff B, Kleinjans JC (2011) Moving forward in human cancer risk assessment. Environ Health Perspect 119:739–743
Radford R, Slattery C, Jennings P, Blacque O, Pfaller W, Gmuender H, Van Delft J, Ryan MP, McMorrow T (2012) Carcinogens induce loss of the primary cilium in human renal proximal tubu-lar epithelial cells independently of effects on the cell cycle. Am J Physiol Renal Physiol 302:F905–F916
Radford R, Frain H, Ryan MP, Slattery C, McMorrow T (2013) Mechanisms of chemical carcinogenesis in the kidneys. Int J Mol Sci 14:19416–19433
Ritchie ME, Phipson B, Wu D, Hu Y, Law CW, Shi W, Smyth GK (2015) Limma powers differential expression analyses for RNA-sequencing and microarray studies. Nucleic Acids Res 43:e47
Silva Lima B, van der Laan JW (2000) Mechanisms of nongenotoxic carcinogenesis and assessment of the human hazard. Regul Toxi-col Pharmacol 32:135–143
Vinken M, Doktorova T, Ellinger-Ziegelbauer H, Ahr HJ, Lock E, Carmichael P, Roggen E, van Delft J, Kleinjans J, Castell J, Bort R, Donato T, Ryan M, Corvi R, Keun H, Ebbels T, Athersuch T, Sansone SA, Rocca-Serra P, Stierum R, Jennings P, Pfaller W, Gmuender H, Vanhaecke T, Rogiers V (2008) The carcinoG-ENOMICS project: critical selection of model compounds for the development of omics-based in vitro carcinogenicity screen-ing assays. Mutat Res 659:202–210
Wang C, Gong B, Bushel PR, Thierry-Mieg J, Thierry-Mieg D, Xu J, Fang H, Hong H, Shen J, Su Z, Meehan J, Li X, Yang L, Li H, Łabaj PP, Kreil DP, Megherbi D, Gaj S, Caiment F, van Delft J, Kleinjans J, Scherer A, Devanarayan V, Wang J, Yang Y, Qian HR, Lancashire LJ, Bessarabova M, Nikolsky Y, Furlanello C, Chierici M, Albanese D, Jurman G, Riccadonna S, Filosi M, Visintainer R, Zhang KK, Li J, Hsieh JH, Svoboda DL, Fuscoe JC, Deng Y, Shi L, Paules RS, Auerbach SS, Tong W (2014) The concordance between RNA-seq and micorarray data depends on chemical treatment and transcript abundance. Nat Biotechnol 32:926–932
Wieser M, Stadler G, Jennings P, Streubel B, Pfaller W, Ambros P, Riedl C, Katinger H, Grillari J, Grillari-Voglauer R (2008) hTERT alone immortalizes epithelial cells of renal proximal tubules without changing their functional characteristics. Am J Physiol Renal Physiol 295:F1365–F1375
Yauk CL, Berndt ML, Williams A, Douglas GR (2004) Comprehen-sive comparison of six microarray technologies. Nucleic Acids Res 32:e124

2229Arch Toxicol (2016) 90:2215–2229
1 3
van Delft J, Gaj S, Lienhard M, Albrecht MW, Kirpiy A, Brauers K, Claessen S, Lizarraga D, Lehrach H, Herwig R, Kleinjans J (2012) RNA-seq provides new insights in the transcriptome responses induced by the carcinogen benzo[a]pyrene. Toxicol Sci 130:427–439
Yildirimman R, Brolén G, Vilardell M, Eriksson G, Synnergren J, Gmuender H, Kamburov A, Ingelman-Sundberg M, Castell J,
Lahoz A, Kleinjans J, van Delft J, Björquist P, Herwig R (2011) Human embryonic stem cell derived hepatocyte-like cells as a tool for in vitro hazard assessment of chemical carcinogenicity. Toxicol Sci 124:278–290