toxicogenomics - university of north carolina at chapel hill · 1 toxicogenomics toxicogenomics is...
TRANSCRIPT

1
ToxicogenomicsToxicogenomics
Toxicogenomics is a new scientific field that elucidates how the entire genome is involved in biological responses of organisms exposed to environmental toxicants/stressors
http://www.niehs.nih.gov/multimedia/qt/ntc/ntcaltcaption.mov
http://video.niehs.nih.gov:7075/ramgen/ntc/ntc-eng03.rm
http://www.niehs.nih.gov/nct/home.htm
Gene Expression Studies:
• Pattern of genes expressed in a cell is characteristic of its current state
• Many differences in cell state or type are correlated with changes in mRNA levels of many genes
• Expression patterns of many previously uncharacterized genes may provide clues to their possible function by comparison with how known genes act
• Gene expression data can be combined with metabolic schemas to understand how pathways are changed under varying conditions (i.e., mechanisms of action)
Microarray Experiments:Microarray Experiments:analysis of gene expressionanalysis of gene expression
• Analyze cell signaling networks (e.g., cell-cycle genes)• Determine effects of various exposures/conditions• Predict/discover function of unknown genes• Compare “normal” to “abnormal” (e.g., tumor cells):
Analyze expression patterns Novel gene association/discoveryDivide tumors into sub-classesDetermine effects of treatment
• Genome-wide (e.g., yeast)• Partial selection of known/unknown genes

2
Scientific Areas in ToxicogenomicsScientific Areas in Toxicogenomics
Disease Mechanisms: application of gene expression profiling technologies to define the mechanistic underpinnings of environmentally related diseases; genetic and environmental components of disease, elucidation of disease pathways and networks, and development of disease models.
Susceptibility: individual and population susceptibilities to exposure and disease as derived from genetic and environmental analysis and integration; identification of gene targets and factors mediating susceptibility, and gender-, strain- and species-susceptibility.
Comparative Genomics: comparative and integrated responses of organisms to environmental stimuli; cross-species comparisons of biological responses to environmental factors at the gene, transcription, and protein level and their integration in model organisms; conserved biological components, pathways and responses to environmental factors; and computational tools to support comparative toxicogenomics.
Predictive Toxicology: development and application of gene expression, proteomics and metabolomics technologies in predictive toxicology; development of model systems and research tools, and linkage of predictive responses to disease phenotype.
Classical Microarray ExperimentsClassical Microarray Experiments
•Normal vs Disease
Example: Analysis of expression patterns in cancer
-Pattern of gene expression-networks
-Novel gene association/discovery
•Molecular Classification
Example: Comparison of Breast Tumors
-Samples classified into subtypes
•Genome-Wide Analysis
Example: Genome-wide expression in S. cerevisiae
-Discovery of yet unidentified molecular pathways
Microarray TechniqueMicroarray Technique
Microarray: A substrate with bound capture probesCapture probe: An oligo/cDNA with gene (DNA sequence) of interest
Generic experimental steps:1. Fabrication:
Photolithography Affymetrix (one-color array) >40,000 genesPrinting Agilent (two-color arrays) ~45,000 genesSpotting In-house (two-color arrays) <24,000 genes
2. Target Generation from a sample of interest:One color (biotin labeled cRNA, phycoerythrin-streptavidin detection) Two color (Cy3 and Cy5 cDNA labeling)
3. Hybridization4. Analysis
“Scanning” of arrayAmount of hybridized target is assessedStatistical interrogation of the data
DNA Microarray TechnologyDNA Microarray Technology
DNA sequences complementary to genes of interest are generated and laid out in
microscopic quantities on solid surfaces at defined positions
Presence of bound DNA is detected by fluorescence following laser excitation
and data is interrogated using specialized computational approaches
cDNAs (from mRNA) from samples are labeled with fluorescent probes and eluted over the
surface complementary DNA binds
Fab
rica
tion
Targ
et
gen
era
tion
an
d
hyb
rid
izati
on
An
aly
sis

3
Spotted Array ConstructionFabrication of twoFabrication of two--color color oligooligo/cDNA arrays/cDNA arrays
Oligos (20-70 bp)or cDNAs 96-well plate 384-well plate printed on a glass slide
Two mRNA sources to be compared are labeled with fluorescent probes:
Cy3 (green) used for one sample (e.g., “control”)
Cy5 (red) used for the other (e.g., “treatment”)
Probes are mixed and washed over the microarray (hybridization)
Each probe is excited using a laser, and its fluorescence (R and G) at each element detected with a scanning confocal microscope
The ratio between the signals in two channels (R:G) is calculated for each array spot
Ratios of intensity of Cy5/Cy3 probes is a reliable measure of the abundance of specific mRNA’s in each sample compared to “control”
Oligo/cDNA Arrays MethodOligo/cDNA Arrays Method
150 µm200 µm
TwoTwo--color color oligooligo/cDNA arrays/cDNA arrays
mRNA from Sample 1 mRNA from Sample 2
Scan and quantitate gene expression levels
TwoTwo--color color oligooligo/cDNA arrays/cDNA arrays

4
AffymetrixAffymetrix®® GeneChipGeneChip array formatarray format
• One-color chip (biotin labeled cRNA, phycoerythrin-streptavidindetection)
• Oligonucleotide probes are synthesized in situ on the chip• Semiconductor photolithography technology is used to
synthesize oligos in situ on a glass substrate 1 cm2
• Masking technology is used to build up oligonuclotides• Oligonucleotides corresponding to 5’, middle and 3’ sections of a
gene of interest are used• Oligonucleotides corresponding to a perfect match and single
mismatch are used to separate signal from noise• Hybridization is measured with a laser, quantified and stored as
a raw value for comparison to data from another chip
Oligonucleotide Oligonucleotide ““one colorone color”” Arrays (Affymetrix)Arrays (Affymetrix)
Targ
et p
repa
ratio
n
A
rray
pre
para
tion
“One Gene”
mRNA reference sequences
Perfect Match/Mismatch probe sets
in situ synthesis by photolitography
Biotin-labeled cRNA
Double stranded cDNA
Total mRNA
Cells/Tissue samples
Ratio array1/array2
perfect match oligo
mismatch oligo
perfect match probe cells
mismatch probe cells
Fluorescence Intensity Image
reference sequenceDNA probe pairs
target mRNA sequence
Affymetrix Affymetrix GeneChipGeneChip detection principledetection principle16-25 mer oligos, perfect match/mismatch, 8-20 per gene of interest

5
Fluidics station(stain/wash)
~2 ½
in
~1 in
Scanner Analysis Software
Affymetrix Affymetrix GeneChipsGeneChips ““in your labin your lab””
Yeast Genome S98 Array Test3 Array Rat Toxicology U34 Array Rat Neurobiology U34 Array Rat Genome U34 Set P. aeruginosa Genome ArrayMurine Genome U74v2 Set Mouse Expression Set 430Human Genome U95 SetHuman Genome U133 SetHuman Genome Focus ArrayE. coli Antisense Genome ArrayDrosophila Genome ArrayC. elegans Genome ArrayArabidopsis ATH1 Genome ArrayCatalog Arrays
p53 AssayHuSNP Mapping AssayGenFlex Tag ArrayCYP450 AssayDNA Analysis Arrays
Made to Order ArraysCustomExpress™ Premier ArraysCustomExpress™ Advantage ArraysCustomExpress™ Arrays
Cost: $250-$1000 apiece
"Mainstream" arrays:"Mainstream" arrays:
Oligonucleotide based (two-color):Home-made vs. Agilent®Capacity: up to 25,000 genes/targets
Oligonucleotide based (one-color):Affymetrix®Capacity: up to 400,000 targets
Need for much greater number of targets on a single array:• minimize energy and materials needed for array production/processing• faster/cheaper• wider dynamic range, increased selectivity and sensitivity
Other platforms that receive attention:• Fiberoptic microarrays• Electrically addressable arrays• Electrokinetic microarrays
From: www.illumina.com
FiberopticFiberoptic Microarrays (ILLUMINA/Tufts U.)Microarrays (ILLUMINA/Tufts U.)
4 x 10⁶/mm25 x 104/mm2Packing Density
200 nm3.1 µmElement Size
NanoarrayMicroarray
From: www.illumina.com
FiberopticFiberoptic Microarrays (ILLUMINA/Tufts U.)Microarrays (ILLUMINA/Tufts U.)
Bead Preparation and Array Production
• Beads individually manufactured and QC’d with full length Oligator® oligos
• Pools produced containing equal mix of 1624 to 24,000+ bead types
• Bead pools applied to fiber bundle or BeadChip, and beads randomly self-assemble into microwells to form functional array with ~30 copies of each bead type
• All elements of the array quality checked for bead presence and type prior to supply (Gunderson et al. Decoding randomly ordered DNA arrays. Genome Research, May 2004)

6
From: www.illumina.com
FiberopticFiberoptic Microarrays (ILLUMINA/Tufts U.)Microarrays (ILLUMINA/Tufts U.)
From: www.illumina.com
FiberopticFiberoptic Microarrays (ILLUMINA/Tufts U.)Microarrays (ILLUMINA/Tufts U.)
From: www.motorola.com/lifesciences
Bioelectronic detection proceeds via a sandwich hybridization assay, wherein three critical components (capture probe, target, and signaling probe) are each present in the cartridge. The signaling probe serves to label the target upon hybridization. Electrons flow to the electrode surface only when the target is present and specifically hybridized to both signaling probe and capture probe. The current generated by this system is measured and interpreted by the eSensor™ DNA Detection Reader and Software.
Electrically Addressable Array (Motorola)Electrically Addressable Array (Motorola)
200 10000 50.00 5.644800 4800 1.00 0.009000 300 0.03 -4.91
Cy3 Cy5Cy5Cy3
log2Cy5Cy3
Slide courtesy of C.M. Perou

7
NAME BC/FUMI0 BC/FUMI4 BC/FUMI4 BC601B-ABC601A-BBC/FUMI1 BC/FUMI2 BC/FUMI2 BC/FUMI1 BC/FUMI1 BC102B-BBC/FUMI2 BC/FUMI3 BC/FUMI3 BC/FUMI1 BC/FUMI1adipose differentiation-related prote 0.242 1.21 -0.253 -0.841 -0.423 -0.363 -0.852 -1.383 -2.642 0.501 -0.25 -0.605 -0.636 0.229 -0.626plasminogen activator, urokinase re 0.908 0.485 -0.397 -0.767 -0.886 -0.251 -0.683 0.057 -0.317 -1.2 0.125 -0.536 -0.248 -0.365plasminogen activator, urokinase re 0.4635 0.3545 -0.8975 -1.23 -0.8335 0.0175 -1.002 0.1555 -0.4325 -1.008 -0.1785 -0.7445 -0.1485 0.0555 0.2055coronin, actin binding protein, 1C A 0.551 0.151 -0.422 0.007 -0.638 0.087 -0.689 -0.91 -0.853 0.052 -0.492 -0.201 -0.152 -0.368 -0.741**coatomer protein complex, subun -1.061 -0.8655 -0.1235 -0.9895 0.3815 -0.4955 -0.2775 -0.1465 -1.109 -0.8635 0.2615 -0.0905 -0.3225 -0.6035 0.0195 -0.9345coactosin-like protein R78490 -0.8835 -0.4545 0.2375 -1.177 0.2155 -0.2975 -0.9385 -0.2815 -1.494 -0.5985 0.4095 -0.3465 0.2185 -0.1345 -0.2895 -0.5525folylpolyglutamate synthase R44864 0.686 1.583 1.313 0.048 -0.272 -0.143 -0.394 0.423 -0.445 -0.854 0.322 -0.03 -0.412 0.214 -1.098 -0.175lysozyme (renal amyloidosis) N639 -0.18 1.155 1.575 -1.635 0.355 0.295 -0.805 0.135 -2.145 -0.955 0.575 0.735 -0.435 -0.855 -0.8 -1.705chemokine (C-C motif) receptor 1 AA036881 0.524 1.233 -1.459 -0.095 -0.122 -0.196 0.101 -0.942 -0.2 -0.133 -0.549 -0.763 -0.059interferon, gamma-inducible protein -0.181 -0.062 0.37 0.064 0.418 -0.33 -0.098 -0.289 -1.042 -0.332 0.907 1.056 -0.8 -0.193 -0.789 -1.25cystatin B (stefin B) H22919 -0.188 -0.489 -0.603 0.074 -0.212 -0.295 -0.54 -0.535 -0.453 -0.479 -0.021 0.291 -0.651 -0.536 -0.401 -0.511cathepsin S AA236164 -0.791 0.334 -0.316 0.723 -0.46 0.39 -0.452 -0.413 1.063 -0.849 -1.088 -0.94 -1.291small inducible cytokine A2 (monoc 0.2665 0.2955 0.5315 -0.1285 0.4255 -1.099 -0.7265 -0.6035 -1.052 -1.438 0.1355 0.0365 -0.4335 0.0875 -1.218 -0.7785natural killer cell transcript 4 AA458 0.483 0.348 0.575 -0.685 0.971 -0.335 -0.222 -0.116 -1.644 -0.66 -0.322 0.885 -0.08 -0.02 -0.441 -0.51superoxide dismutase 2, mitochond 0.431 0.301 -0.836 0.519 -0.492 -0.834 -0.86 0.781 0.005 -1.163 -1.283 -0.969 -0.586superoxide dismutase 2, mitochondrial AA4877 0.3185 -0.6835 0.4865 0.6925 -0.7895 -0.6005 -0.5815 0.4995 0.0165 0.3755 -0.1225 -1.129 -1.137 -0.6935transforming growth factor, beta-ind 0.0235 0.6525 -0.3785 -0.5505 -0.3675 -0.4755 -0.1105 0.3435 0.0785 -0.4735 0.7925 1.532 -0.3355 -0.0885 0.2495 -0.1985glycine dehydrogenase (decarboxy -1.122 -1.412 -1.275 -1.764 -0.611 1.259 -1.25 -0.76 -2.159 -1.72 -1.017 -0.972 -0.715 -0.543 -0.658 -0.818syndecan 2 (heparan sulfate proteo -1.828 -1.7 -1.409 -1.964 -0.975 1.516 -1.24 -1.75 -2.219 -2.477 -1.08 0.29 -1.641 -2.045 -0.315 -1.356glutathione S-transferase pi R33642 -1.726 -1.892 -1.568 1.528 -1.346 -2.157 -3.114 -3.146 -0.943 0.236 -1.349 -1.674 -0.416 -1.557chitinase 3-like 2 AA668821 -0.771 -1.436 -1.454 -0.813 -1.578 0.312 -0.167 0 -0.469 0.129 -0.566 -0.489nuclear factor I/B W87528 0.464 -1.314 -0.187 -1.429 -0.189 0.551 -1.94 -1.372 -2.152 -1.825 -0.441 -0.928 0.316 -1.188ras homolog gene family, member -1.382 -0.471 -0.421 0.304 -0.448 -0.805 -0.945 -0.737 -1.222 -0.915 -0.713 -0.167 0.09 1.074 -0.393ras homolog gene family, member -1.311 -0.763 -0.61 0.198 -0.764 -0.391 -0.867 -1.469 -1.106 -0.486 -0.778 -0.579 0.812 0.348 -0.222**zinc finger, DHHC domain containing 5 AA4 -0.965 -0.571 -0.304 -0.328 -0.417 -0.518 -0.473 -0.973 -0.94 -0.926 -1.153 -0.462 -0.683 0.828 0.347keratin 5 (epidermolysis bullosa sim -0.309 -0.485 -0.748 -0.909 -0.403 -0.127 -0.371 -0.778 -1.596 -1.787 -0.782 0.242 -0.559 -0.804 0.79 0.374keratin 5 (epidermolysis bullosa simplex, Dowl -0.655 -2.421 0.301 0.689 -0.38 -0.131 -1.647 -1.396 0.248 -1.118 -0.389 -1.423 1.963 -0.068keratin 17 AA026100 -0.593 -2.294 0.181 -0.45 0.457 -1.132 -0.754 -2.708 -0.641 -0.148 -0.201 0.161 2.264 1.758tripartite motif-containing 29 AA055 -0.523 -0.763 -0.726 -0.155 -0.401 -1.8 -1.591 -1.789 -1.076 -0.929 -1.132 -1.051 -0.24pleiomorphic adenoma gene-like 1 AA463204 -0.7035 -0.5595 -0.7765 -0.2835 -0.1885 -1.466 -2.035 -0.1475 -0.7075 -0.4025 -1.054 0.3535 -0.5835secreted frizzled-related protein 1 AA002080 -1.951 -2.022 -1.982 0.069 -0.117 -1.543 -2.996 -2.657 -0.275 -1.187 -0.262 -0.688 3.135 0.295Homo sapiens cDNA FLJ11796 fis, clone HEM -1.425 -0.74 -0.798 0.243 -0.225 -0.061 -0.957 -0.001 -0.491 -0.28 0.595 -0.721ESTs AA074677 -0.411 -0.412 -0.879 -0.78 -0.401 -0.135 -0.508 -2.237 0.077 -0.72 -1.057 -1.301pellino homolog 1 (Drosophila) W86 -0.3805 -1.159 -0.6945 -0.3935 -0.1785 -0.3665 -0.3835 -0.2825 0.1245 0.3185 0.2735 -1.329 -0.9455 -1.313 -0.4235matrix metalloproteinase 7 (matrilys -0.887 -2.32 0.16 -1.65 -1.54 -1.065 1.453 -1.55 -2.859 -0.04moesin R22977 0.452 -0.759 -0.433 -0.691 0.148 -0.538 -0.28 -0.478 -0.477 0.019 0.062 -0.001 0.259 -0.24 -0.314prion protein (p27-30) (Creutzfeld-J -0.8095 -1.302 -0.5695 -1.843 -0.8355 -0.3325 -0.7305 0.2015 -0.3825 -0.2335 -0.4605 -1.181 -0.6875 -0.3315 0.2825 -0.0605chitinase 3-like 1 (cartilage glycoprotein-39) A 1.474 1.071 0.678 0.987 -1.357 -2.185 -1.619 3.517 -0.465 -1.549 -1.699 -1.262annexin A8 AA235002 -0.55 -0.832 0.209 0 -0.576 -0.199 -1.046 -0.454 -0.221 0.134 -0.015 0.619 0.519hypothetical protein FLJ20481 N32 -0.078 -0.939 -1.002 0.058 -0.058 -0.158 -1.65 -0.794 -1.612 0.17 1.318 0.404 -0.312 -0.039ADP-ribosylation factor-like 7 N353 -0.9415 -0.0585 -0.3685 -0.9365 -0.2155 0.0715 -0.2825 -0.5505 -1.107 -0.5855 0.2285 -0.2475 0.1635 -0.1405cystatin A (stefin A) W72207 -0.532 -0.941 0.909 1.783 0.164 -0.106 -0.577 -1.496 0.588 3.351 -0.73 -0.855inhibitor of DNA binding 3, dominan -0.46 -0.587 -0.421 -0.358 0.326 0.638 -0.642 -0.224 -0.143 -0.445 -0.58 0.377complement component 1, r subcom 0.116 0.475 -1.506 0.089 -0.624 0.876 -1.115 -1.773 -0.505 -0.276 -0.204 -1.308 0.584 -0.431nicotinamide N-methyltransferase T 0.675 -0.083 0.035 -0.244 0.053 -0.021 -0.365 -1.174 -1.235 -1.789 -0.688 0.972 -0.261 -0.532 0.606 0myosin IE AA029956 -0.6075 -0.5465 -0.8195 -0.3755 -0.3535 -0.5545 -0.6505 -1.089 0.0005 -0.0205 0.1535 -0.1775 -0.0005major histocompatibility complex, c -0.494 -0.582 -1.091 -0.32 0.305 -0.098 -0.085 0.262 -1.668 -1.457 -0.039 -0.362 -0.218 -0.838 -0.197 -0.537fatty acid binding protein 7, brain W72051 -1.595 -2.086 -1.717 -0.387 -2.433 -0.184 -1.441 -0.603 0.446 0.728kynureninase (L-kynurenine hydrolase) H8747 -0.342 -0.591 1.233 0.358 -0.954 -1.687 -1.194 -1.515 -2.291 -0.198 0.075 -0.657 -1.675 -0.58 -1.138cytochrome P450, subfamily I (diox 1.065 -0.579 0 -0.767 0.392 -0.386 -0.479 -0.752 -0.401 -0.549 0.165 0.11 -0.605 -0.779 0.499 -0.131cytochrome P450, subfamily I (diox 2.202 -0.047 -0.231 -0.604 -0.234 -0.713 -0.836 -1.99 -1.558 -1.474 0.425 0.622 -0.872 -1.706 -0.579S100 calcium binding protein A8 (c -1.641 0.014 -1.05 4.29 -0.162 -0.899 -1.625 -1.818 -2.268 -1.165 -1.2 -1.797 -1.329 -1.087signal transducer and activator of transcription -0.2855 -0.6135 2.59 -0.0555 -0.4895 -0.3215 -1.224 -1.718 -1.387 -0.4765 -0.7565 -1.143 -0.8755 -0.9545gamma-aminobutyric acid (GABA) A receptor 3.044 -1.498 0.076 0.153 -0.766 -0.789 -1.485 -0.69 -0.823 -0.104 -0.235EphB6 AA609284 0.6365 -1.062 -0.5295 -0.1345 -0.6565 -0.0415 -0.0885 0.0535 -0.3235secretory leukocyte protease inhibi -2.088 -1.806 -1.596 0.434 -1.378 -1.269 -0.849 -1.961 -2.645 -3.187 -1.637 -0.996 -1.568 0.538 -1.344aldo-keto reductase family 1, member C1 (dih 0.83 0.835 -0.435 1.743 1.173 -0.558 -1.21 -1.547 -0.834 0.712 0.104 -0.296latrophilin W74533 -1.28 0.216 -0.322 -0.467 -0.563 0.111 0.383 -0.648 -0.95 -1.333 -0.903 0.469 0 0.274echinoderm microtubule associated -0.0045 -0.1755 -0.1055 0.1595 -0.2585 -0.5155 -1.05 -0.3895 -0.1395 -0.8335 -0.0445 -0.4845 0.0045 -0.7135 0.1435 -0.2125epidermal growth factor receptor (erythroblast -0.676 -1.527 -0.203 -1.07 -1.157 -0.979 -1.085 -2.181 -1.547 -0.782 -0.768 0.432ERO1-like (S. cerevisiae) AA18680 0.3395 0.4075 -0.6115 -0.3415 -0.4095 -0.8285 -0.4075 -0.4405 -0.4075 -1.335 -0.2325 -0.7075 -0.7125 -0.3035**hypothetical protein FLJ20624 R9 -0.232 -0.341 -0.153 -0.446 0.838 -1.658 0.466 -0.553 -0.909 -0.199 -0.662 -0.334 0.371 -0.029 0.617forkhead box D1 AA069132 -1.192 -0.07 -0.666 -0.596 0.02 0.388 -0.54 0.11 -1.016 -1.28 -1.077 -0.051 -0.477 -0.561 0.796met proto-oncogene (hepatocyte growth factor receptor) AA410591 -1.151 -0.373 0.228 0.322 -0.654 -0.23 0.176 0.74 0.446 0.177ESTs, Weakly similar to TRHY_HUMAN TRICH -0.137 -0.378 -0.339 0.263 0.618 0.02 0.518 -1.656 1.242 0.885 0.19 0.389 -0.164ESTs AA149250 1.847 -0.295 0.293 -0.215 -1.641 -0.868 -0.33 -0.395 0.21 -0.185Homo sapiens mRNA; cDNA DKFZp564O2364 3.135 0.0215 0.3145 0.7915 -0.2245 1.343 -0.0505 -0.1155 1.125 -0.1125 -0.5255 -0.3445hypothetical protein FLJ10337 AA1 -0.6325 0.8375 0.2155 -0.7935 -0.1815 -0.3315 -0.4795 -0.6435 -0.6095 -0.4435 0.2225 0.0585 -0.3355 0.2375 0.1205integral membrane protein 3 AA034 -0.998 -0.313 0.52 -1.106 -0.005 -0.618 -0.901 -0.847 -2.533 -2.828 -1.247 -0.647 -1.005 -1.651 -0.119 -0.465
Slide courtesy of C.M. Perou
Slide courtesy of C.M. Perou Slide courtesy of C.M. Perou

8
Slide courtesy of C.M. Perou
~6,5
00 g
enes
Acute treatment induced/All StrainsApoptosisActivation of MAPK signalingProtein phosphorylationIncrease enzyme catalytic activity
Sub-chronic repressed/All StrainsTCA cycleAcyl-CoA metabolismCytoskeleton biogenesis
Treatment-independent/Strain-specG protein-coupled signalingTGFb3 receptor signalingIon channel activityCalmodulin bindingRNA polymerase transcriptionCell migration
Sub-chronic induced/All StrainsActivation of metabolism (aldehyde dehydrogenase activ.)Innate immune responseG protein-coupled signalingCytokine productionCell growth
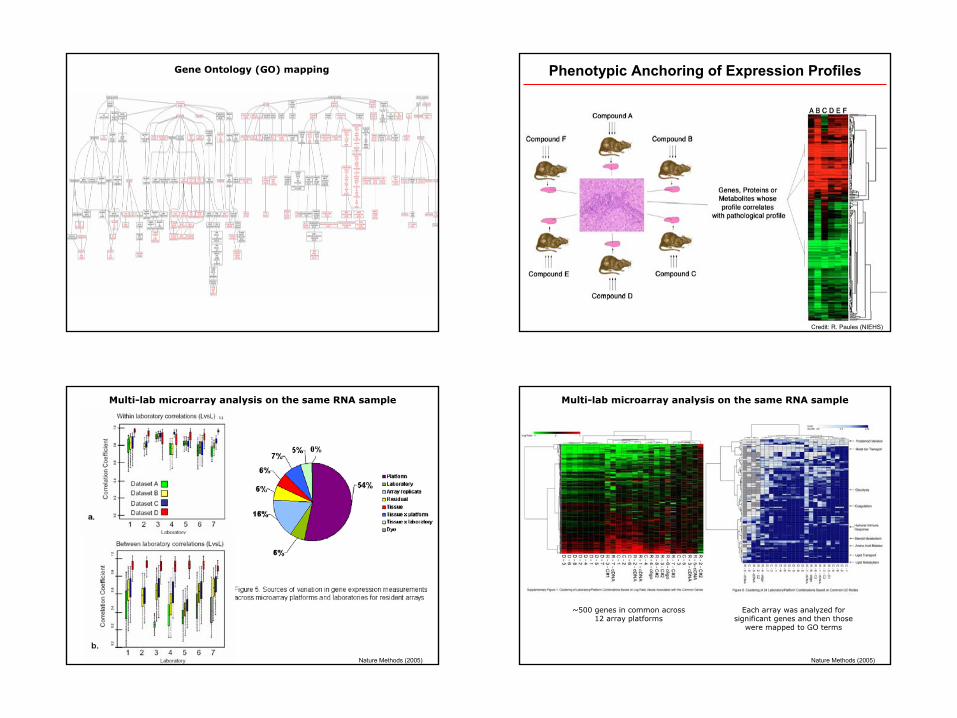
Gene Ontology (GO) mapping Gene Ontology (GO) mapping
9
Gene Ontology (GO) mapping Phenotypic Anchoring of Expression Profiles
Credit: R. Paules (NIEHS)
Multi-lab microarray analysis on the same RNA sample
Nature Methods (2005)
~500 genes in common across 12 array platforms
Each array was analyzed for significant genes and then those
were mapped to GO terms
Multi-lab microarray analysis on the same RNA sample
Nature Methods (2005)