applications of toxicogenomics
TRANSCRIPT
8/6/2019 Applications of Toxicogenomics
http://slidepdf.com/reader/full/applications-of-toxicogenomics 1/16
Applications of Applications of
ToxicogenomicsToxicogenomics
8/6/2019 Applications of Toxicogenomics
http://slidepdf.com/reader/full/applications-of-toxicogenomics 2/16
Toxicology is multidispliniary fieldToxicology is multidispliniary field
It is quantitative & qualitative study of adverseIt is quantitative & qualitative study of adverseeffects of chemicals on living organismseffects of chemicals on living organismsToxicity is the adverse biological response to aToxicity is the adverse biological response to a
chemical reactionchemical reactionToxicogenomicsToxicogenomics provides valuable information on the provides valuable information on theeffects of drugs and chemicals at a molecular level,effects of drugs and chemicals at a molecular level,
providing a more complete understanding of their providing a more complete understanding of their
potential toxic effects potential toxic effects
8/6/2019 Applications of Toxicogenomics
http://slidepdf.com/reader/full/applications-of-toxicogenomics 3/16
F ollowing the law of mass action, the rate if aF ollowing the law of mass action, the rate if achemical reaction depends on concentrationschemical reaction depends on concentrationsof 2 reactants.of 2 reactants.The active toxicant and the biologicalThe active toxicant and the biologicalresponse/targetresponse/targetThe more active toxicant present, the greater isThe more active toxicant present, the greater is
the dose,the dose,More toxicity, the greater is the responseMore toxicity, the greater is the responseThis is doseThis is dose- -response relationshipresponse relationship
8/6/2019 Applications of Toxicogenomics
http://slidepdf.com/reader/full/applications-of-toxicogenomics 4/16
E xposure to a single high conc. Will elicit anE xposure to a single high conc. Will elicit animmediate (acute) response that is qualitativeimmediate (acute) response that is qualitativedifferent from repeated exposure (chronic) to thedifferent from repeated exposure (chronic) to the
same chemical at much lower conc.same chemical at much lower conc.F or ex.a single exposure to 1 mg of afatoxin BF or ex.a single exposure to 1 mg of afatoxin B 11 to ato arat, will result in killing of large numbers of liver rat, will result in killing of large numbers of liver cells and death due to liver failure within 5cells and death due to liver failure within 5- -6 days.6 days.
E xposure to few nanograms for several months doesE xposure to few nanograms for several months doesnot kill liver cells but results liver cancer not kill liver cells but results liver cancer
8/6/2019 Applications of Toxicogenomics
http://slidepdf.com/reader/full/applications-of-toxicogenomics 5/16
Dose response relationshipDose response relationship
Wide quantitative variations in drug responsesWide quantitative variations in drug responsesoccur b/w diff species and within same speciesoccur b/w diff species and within same species
with diff conditionwith diff conditionE ach drug has a characteristic response curveE ach drug has a characteristic response curvefor a specified set of conditions.for a specified set of conditions.The dose response curve forms SThe dose response curve forms S- -shaped or shaped or sigmoid type.sigmoid type.2 types of relationship2 types of relationship
8/6/2019 Applications of Toxicogenomics
http://slidepdf.com/reader/full/applications-of-toxicogenomics 6/16
2 types of relationship2 types of relationship
G raded or quantitative doseG raded or quantitative dose- -responseresponserelationshiprelationship
Quantal or quantitative doseQuantal or quantitative dose- -responseresponserelationshiprelationship
8/6/2019 Applications of Toxicogenomics
http://slidepdf.com/reader/full/applications-of-toxicogenomics 7/16
G raded or quantitative doseG raded or quantitative dose- -
response relationshipresponse relationshipThis type relates the size of the response in a singleThis type relates the size of the response in a single biological unit to the dose of the drug. biological unit to the dose of the drug.As the dose administered to a tissue is increases, theAs the dose administered to a tissue is increases, the
pharmacological response will also increase in graded pharmacological response will also increase in gradedfashion provided the dose has not exceeded thefashion provided the dose has not exceeded thethreshold dose.threshold dose.The degree of response produced by increasing theThe degree of response produced by increasing the
doses of a drug eventually reaches a steady leveldoses of a drug eventually reaches a steady leveltermed astermed as ceiling response.ceiling response.And the dose is called aAnd the dose is called a celing doseceling dose
8/6/2019 Applications of Toxicogenomics
http://slidepdf.com/reader/full/applications-of-toxicogenomics 8/16
If the dose exceed the ceiling dose, there is noIf the dose exceed the ceiling dose, there is nofuther increase in the therapeutic effect.futher increase in the therapeutic effect.
Such dose have undesirable responses.Such dose have undesirable responses.The ceiling dose allows to compare theThe ceiling dose allows to compare thetherapeutic efficacy of varioustherapeutic efficacy of various
pharmacologically active compds. pharmacologically active compds.
8/6/2019 Applications of Toxicogenomics
http://slidepdf.com/reader/full/applications-of-toxicogenomics 9/16
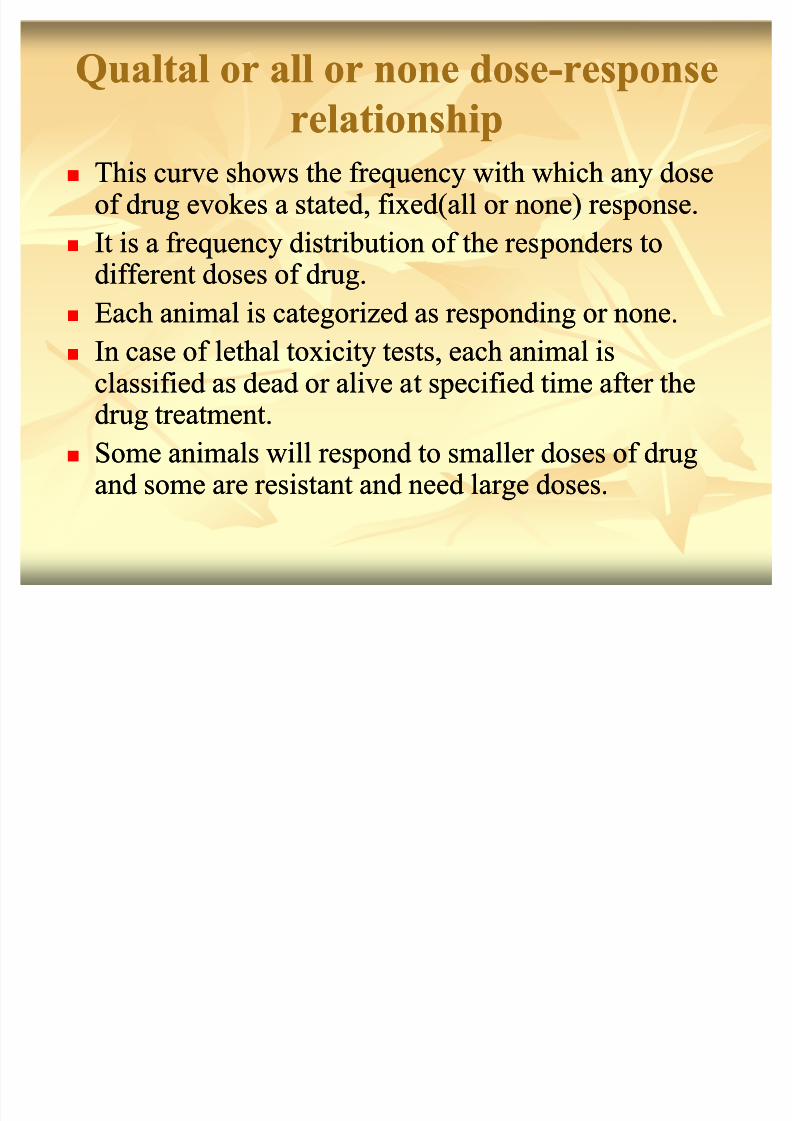
Q ualtal or all or none doseQ ualtal or all or none dose- -responseresponse
relationshiprelationshipThis curve shows the frequency with which any doseThis curve shows the frequency with which any doseof drug evokes a stated, fixed(all or none) response.of drug evokes a stated, fixed(all or none) response.It is a frequency distribution of the responders toIt is a frequency distribution of the responders to
different doses of drug.different doses of drug.E ach animal is categorized as responding or none.E ach animal is categorized as responding or none.In case of lethal toxicity tests, each animal isIn case of lethal toxicity tests, each animal isclassified as dead or alive at specified time after theclassified as dead or alive at specified time after the
drug treatment.drug treatment.Some animals will respond to smaller doses of drugSome animals will respond to smaller doses of drugand some are resistant and need large doses.and some are resistant and need large doses.
8/6/2019 Applications of Toxicogenomics
http://slidepdf.com/reader/full/applications-of-toxicogenomics 10/16
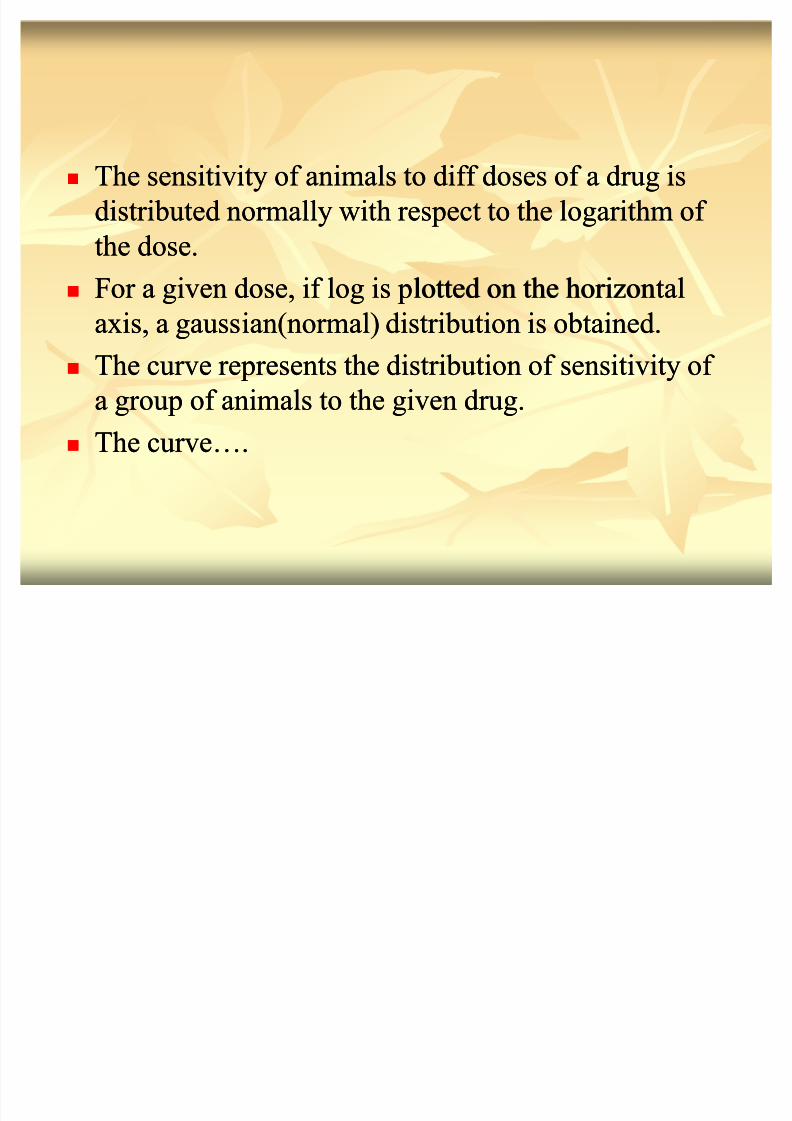
The sensitivity of animals to diff doses of a drug isThe sensitivity of animals to diff doses of a drug isdistributed normally with respect to the logarithm of distributed normally with respect to the logarithm of the dose.the dose.F or a given dose, if log is plotted on the horizontalF or a given dose, if log is plotted on the horizontalaxis, a gaussian(normal) distribution is obtained.axis, a gaussian(normal) distribution is obtained.The curve represents the distribution of sensitivity of The curve represents the distribution of sensitivity of
a group of animals to the given drug.a group of animals to the given drug.The curve«.The curve«.
8/6/2019 Applications of Toxicogenomics
http://slidepdf.com/reader/full/applications-of-toxicogenomics 11/16
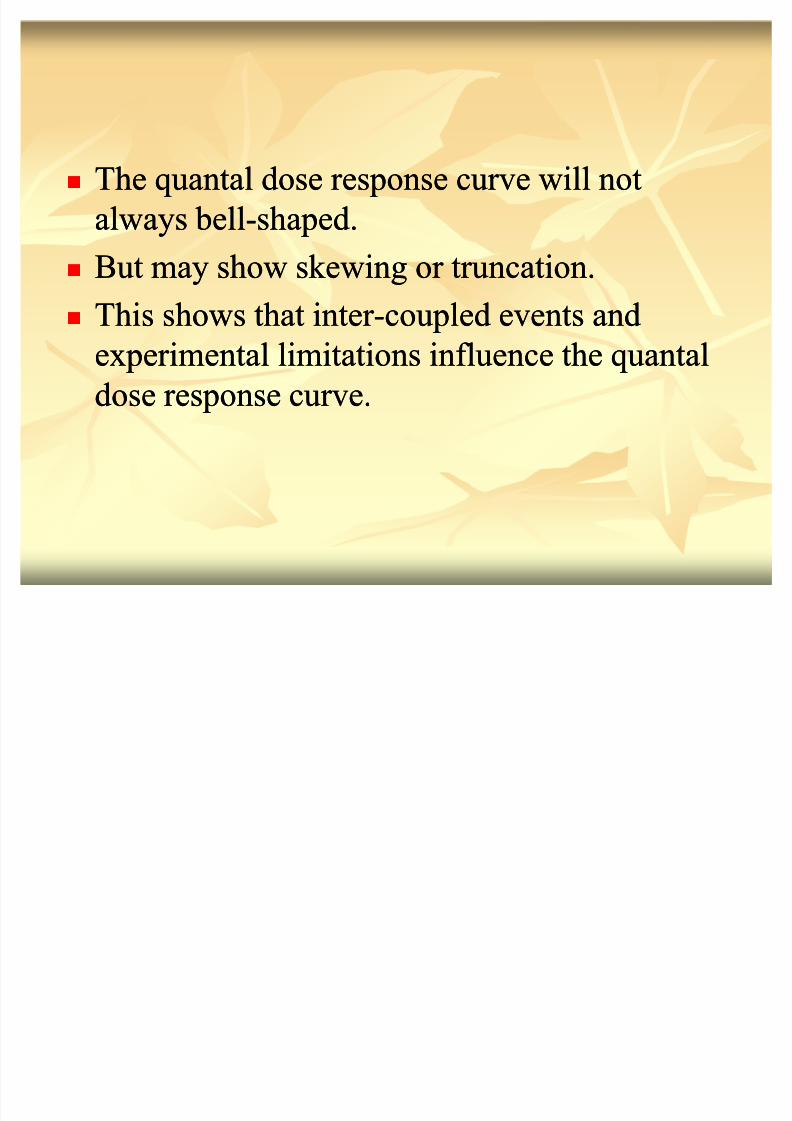
The quantal dose response curve will notThe quantal dose response curve will notalways bellalways bell- -shaped.shaped.
But may show skewing or truncation.But may show skewing or truncation.This shows that inter This shows that inter- -coupled events andcoupled events andexperimental limitations influence the quantalexperimental limitations influence the quantaldose response curve.dose response curve.
8/6/2019 Applications of Toxicogenomics
http://slidepdf.com/reader/full/applications-of-toxicogenomics 12/16
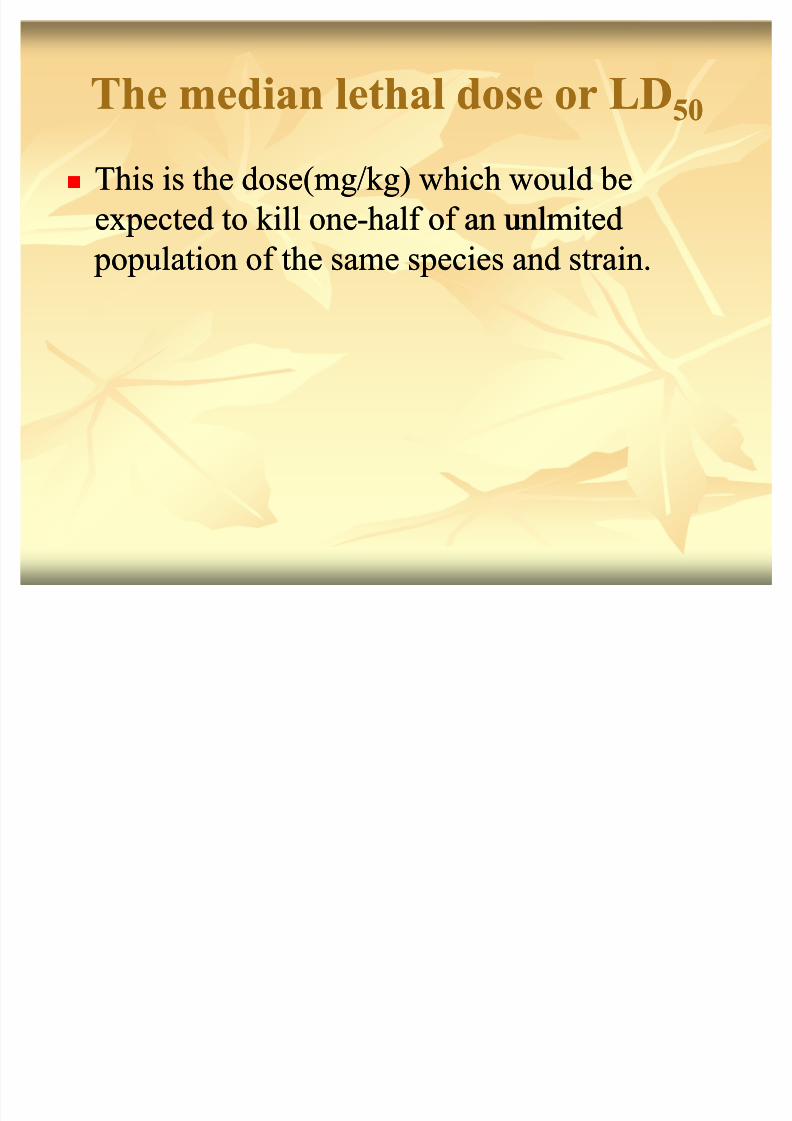
The median lethal dose or L DThe median lethal dose or L D 5050
This is the dose(mg/kg) which would beThis is the dose(mg/kg) which would beexpected to kill oneexpected to kill one- -half of an unlmitedhalf of an unlmited
population of the same species and strain. population of the same species and strain.
8/6/2019 Applications of Toxicogenomics
http://slidepdf.com/reader/full/applications-of-toxicogenomics 13/16
8/6/2019 Applications of Toxicogenomics
http://slidepdf.com/reader/full/applications-of-toxicogenomics 14/16
8/6/2019 Applications of Toxicogenomics
http://slidepdf.com/reader/full/applications-of-toxicogenomics 15/16
M argin of safetyM argin of safety
It is the difference between the therapeutic and lethalIt is the difference between the therapeutic and lethaldose of a drug.dose of a drug.As the drug metabolism varies from species toAs the drug metabolism varies from species tospecies, the therapeutic index will also vary.species, the therapeutic index will also vary.The larger the therapeutic index the safer is the drug.The larger the therapeutic index the safer is the drug.F or safe therapeutic application, the TI must be moreF or safe therapeutic application, the TI must be more
than one.than one.Such drugs will have v.little doseSuch drugs will have v.little dose- -related toxicity.related toxicity.
8/6/2019 Applications of Toxicogenomics
http://slidepdf.com/reader/full/applications-of-toxicogenomics 16/16
The TI gives only a rough idea about theThe TI gives only a rough idea about thesafety.safety.
Depending upon its clinical use, a drug mayDepending upon its clinical use, a drug mayhave many TI.have many TI.E g. The margin of safety of aspirin if used for E g. The margin of safety of aspirin if used for headache is far greater than its margin of headache is far greater than its margin of safety of athritic pain or rhematic fever,safety of athritic pain or rhematic fever,This is because the latter required larger dose.This is because the latter required larger dose.