intelligent vision systems ent 496 object shape identification and representation hema c.r. lecture...
TRANSCRIPT
Intelligent Vision Systems
ENT 496Object Shape Identification and
Representation
Hema C.R.
Lecture 7
Hema ENT 496 Lecture 7
2
Road Map
• Contour
• Chain codes
• Object Recognition
• Object Representation
• Feature Detection
• Hough Transform
• Fourier Descriptors
Hema ENT 496 Lecture 7
3
Contour
• Represented as ordered list of edges or a curve
• Criteria for good contour– Efficiency: simple and compact
representation– Accuracy: accurately fit image
features– Effectiveness: suitable for operations
to be performed at a later stage
Hema ENT 496 Lecture 7
4
Definitions
• Edge list– Ordered set of edge points or fragments
• Contour– Edge list or a curve that is used to represent the
edge list
• Boundary– Closed contour that surrounds a region
Note: The term edge generally refers to edge points
Hema ENT 496 Lecture 7
5
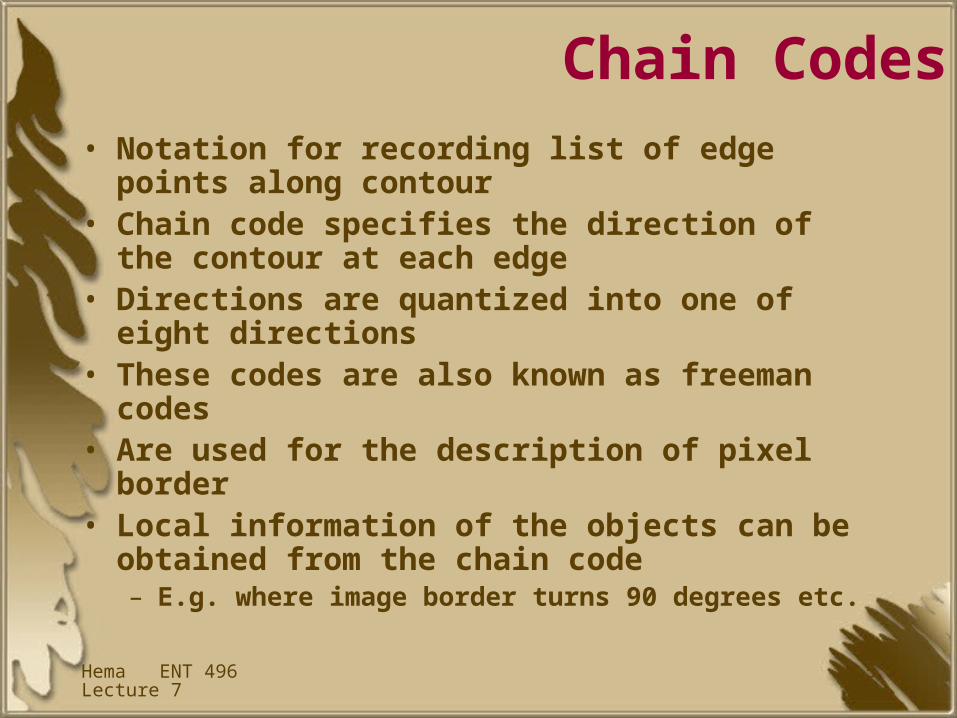
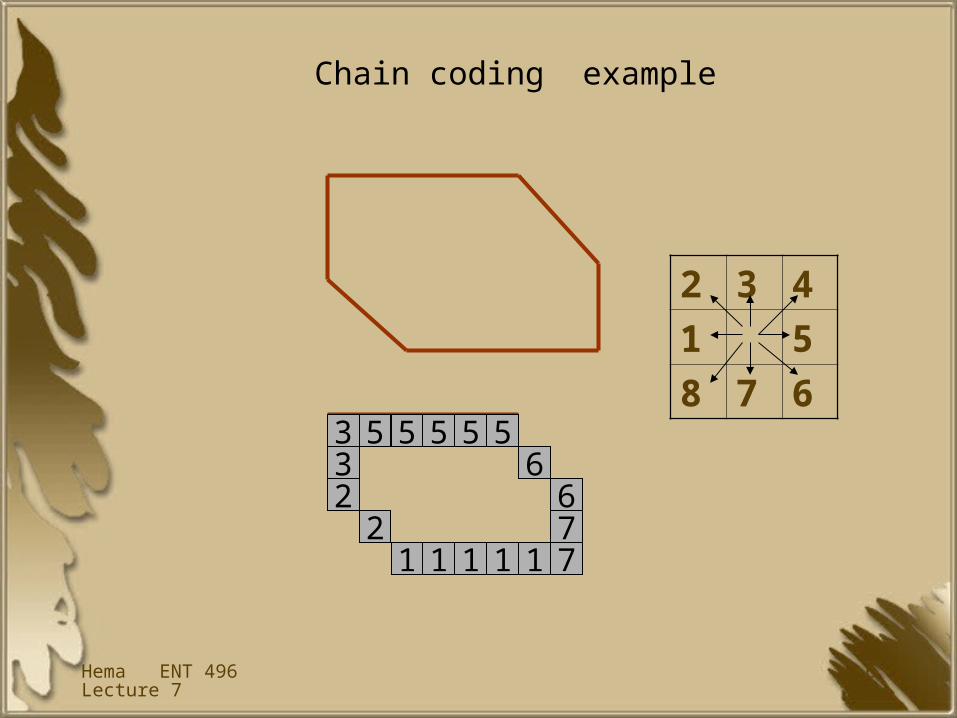
Chain Codes• Notation for recording list of edge points along
contour• Chain code specifies the direction of the contour
at each edge• Directions are quantized into one of eight
directions• These codes are also known as freeman codes• Are used for the description of pixel border• Local information of the objects can be obtained
from the chain code– E.g. where image border turns 90 degrees etc.
Hema ENT 496 Lecture 7
6
3 5 5 5 5 56
67711111
32
2
2 3 4
1 5
8 7 6
Chain coding example
Hema ENT 496 Lecture 7
7
Object Recognition
• Object recognition systems find objects in the real world from an image of the world.
• Object recognition can be defined as a labeling problem based on models of known objects.
Hema ENT 496 Lecture 7
8
Components of a object recognition system
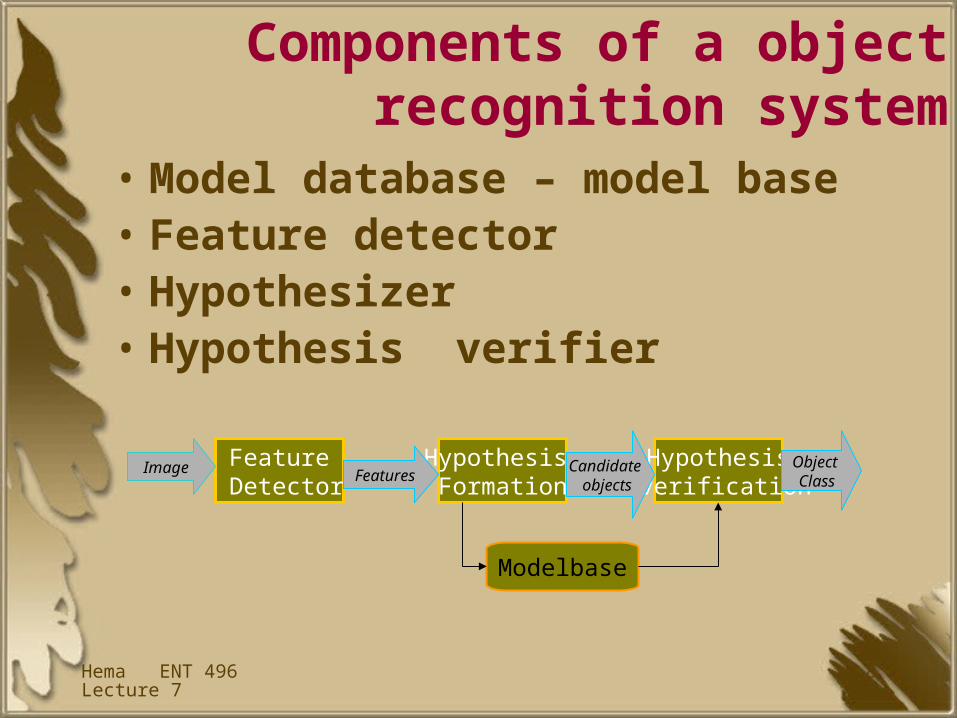
• Model database – model base• Feature detector• Hypothesizer• Hypothesis verifier
Feature Detector
Hypothesis Formation
Hypothesis verification
Modelbase
Image FeaturesCandidate
objects
Object Class
Hema ENT 496 Lecture 7
9
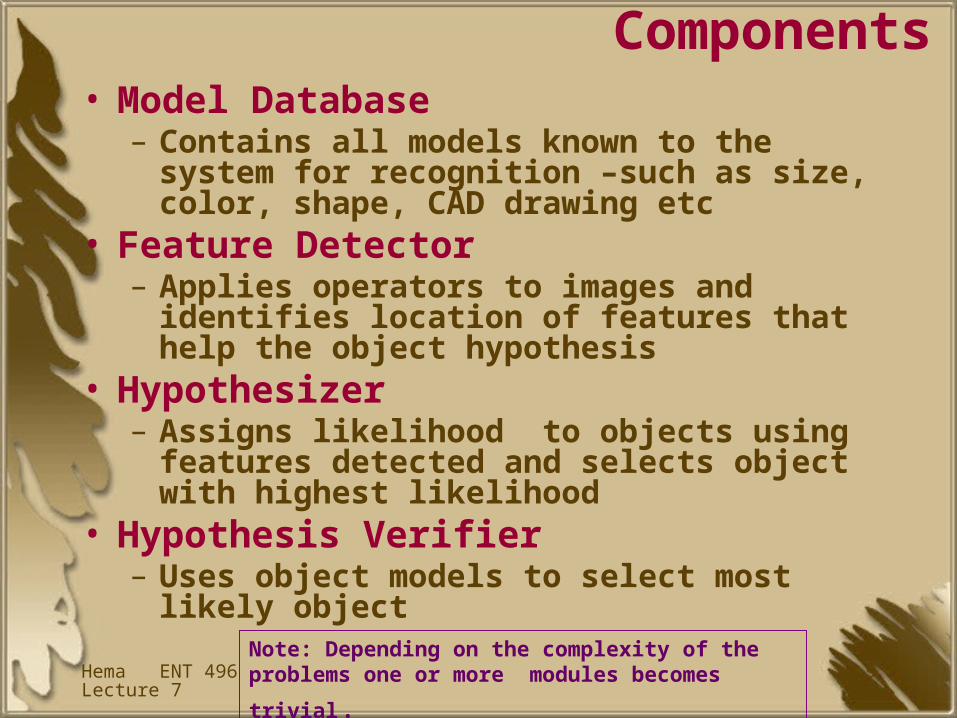
Components• Model Database
– Contains all models known to the system for recognition –such as size, color, shape, CAD drawing etc
• Feature Detector– Applies operators to images and identifies
location of features that help the object hypothesis
• Hypothesizer– Assigns likelihood to objects using features
detected and selects object with highest likelihood
• Hypothesis Verifier– Uses object models to select most likely object
Note: Depending on the complexity of the problems
one or more modules becomes trivial.
Hema ENT 496 Lecture 7
10
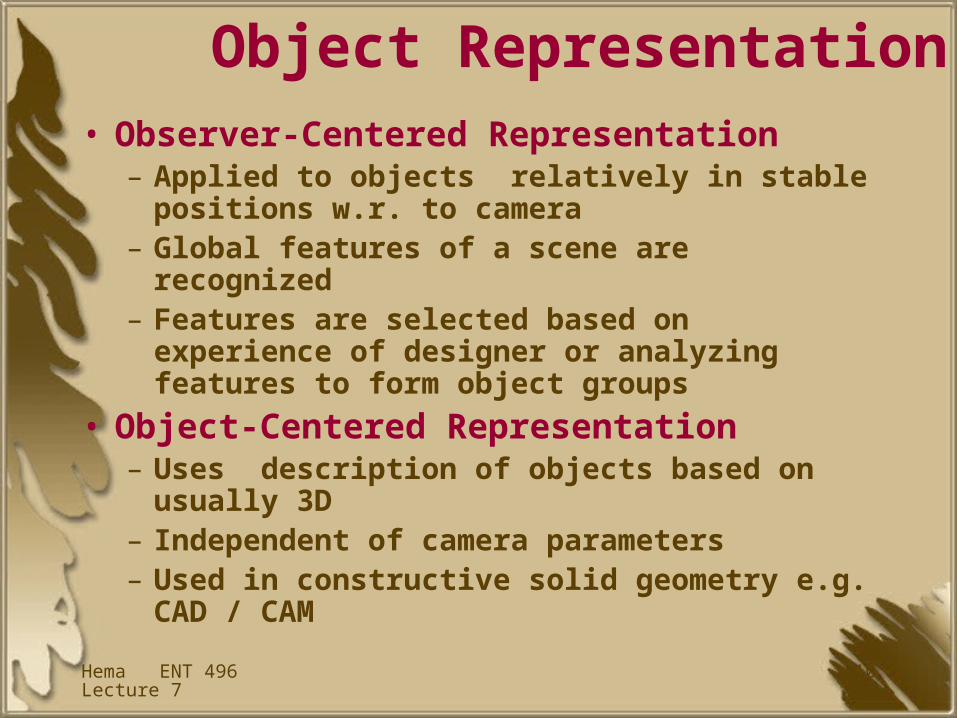
Object Representation• Observer-Centered Representation
– Applied to objects relatively in stable positions w.r. to camera
– Global features of a scene are recognized– Features are selected based on experience of
designer or analyzing features to form object groups
• Object-Centered Representation– Uses description of objects based on usually
3D– Independent of camera parameters– Used in constructive solid geometry e.g. CAD /
CAM
Hema ENT 496 Lecture 7
11
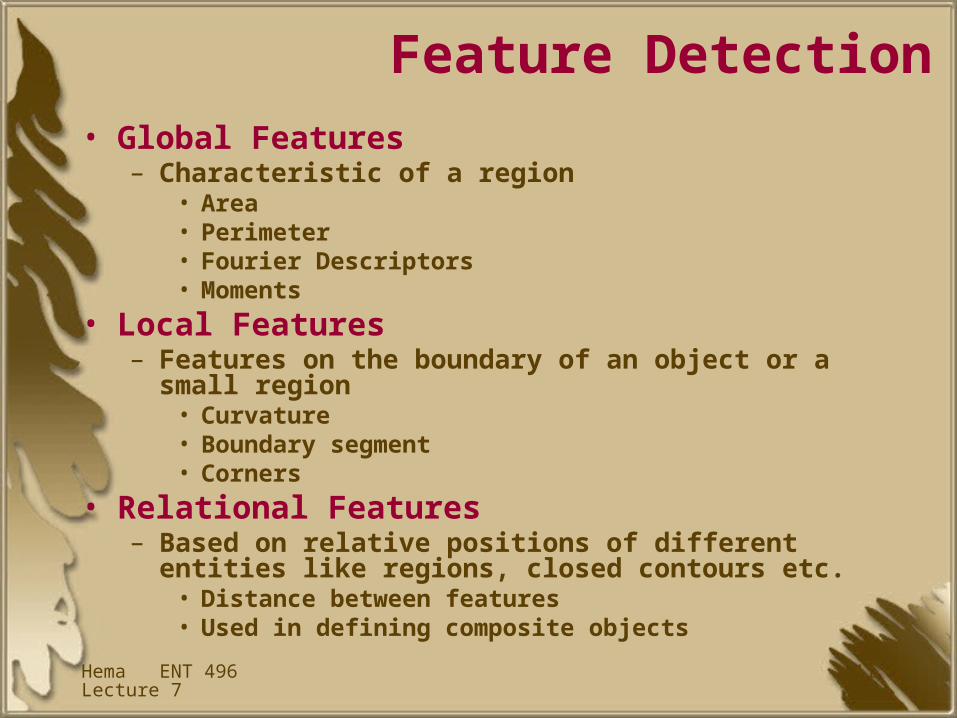
Feature Detection• Global Features
– Characteristic of a region• Area• Perimeter• Fourier Descriptors• Moments
• Local Features– Features on the boundary of an object or a small region
• Curvature• Boundary segment• Corners
• Relational Features– Based on relative positions of different entities like
regions, closed contours etc.• Distance between features• Used in defining composite objects
Hema ENT 496 Lecture 7
12
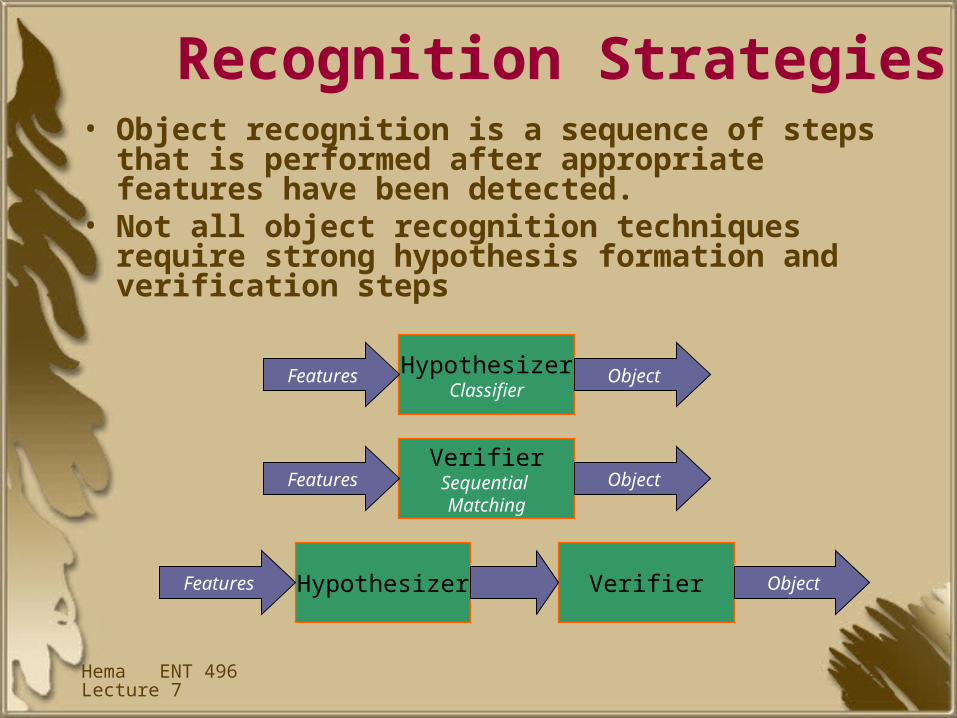
Recognition Strategies• Object recognition is a sequence of steps that is
performed after appropriate features have been detected.
• Not all object recognition techniques require strong hypothesis formation and verification steps
HypothesizerClassifier
VerifierSequential Matching
Hypothesizer Verifier
Features Object
Features
Features
Object
Object
Hema ENT 496 Lecture 7
13
Strategies• Classification
– Nearest neighbor• Similar features in a region are clustered, based on a centroid and distance
– Bayesian Classifier• Used when distribution of objects is not straightforward • When there is an overlap of features of different objects.• Probabilistic knowledge about features and frequency of objects is used
– Neural Nets• Implement a classification approach• Use nonlinear boundary partition of features• Boundaries are used by training a net
– Off-line computations• Computations are done before recognition• Recognition process can be converted to a look-up table
• Matching– Feature Matching
• Known features of the object are matched with unknown objects feature to find matches
– Symbolic Matching• Relation among features are matched• Graph matching
Hema ENT 496 Lecture 7
14
Hough Transform
• The Hough transform is a feature extraction technique
• The classical transform identifies lines in the image, but it has been extended to identifying positions of arbitrary shapes.
• The transform universally used today was invented by Richard Duda and Peter Hart in 1972, who called it a "generalized Hough transform" after the related 1962 patent of Paul Hough.
Hema ENT 496 Lecture 7
15
Hough Transform- Theory• The underlying principle
– there are an infinite number of potential lines that pass through any point, each at a different orientation.
• The purpose of the transform is to determine which of these theoretical lines pass through most features in an image – that is, which lines fit most closely to the data in the image.
• In order to determine that two points lie on the same potential line, it is necessary to create a representation of a line that allows meaningful comparison .
• In the standard Hough transform, each line is represented by two parameters, commonly called r and θ (theta) – which represent the length and angle from the origin of a
normal to the line in question
Hema ENT 496 Lecture 7
16
Hough Transform- Theory• By transforming all the possible lines through a point into
this coordinate system – i.e. calculating the value of r for every possible value of θ - a
sinusoidal curve is created which is unique to that point.
• This representation of the two parameters is sometimes referred to as Hough space.
• If the curves corresponding to two points are superimposed, the location (in Hough space) where they cross correspond to lines (in the original image space) which pass through both points.
• A set of points which form a straight line will produce Hough transforms which cross at the parameters for that line.
Hema ENT 496 Lecture 7
17
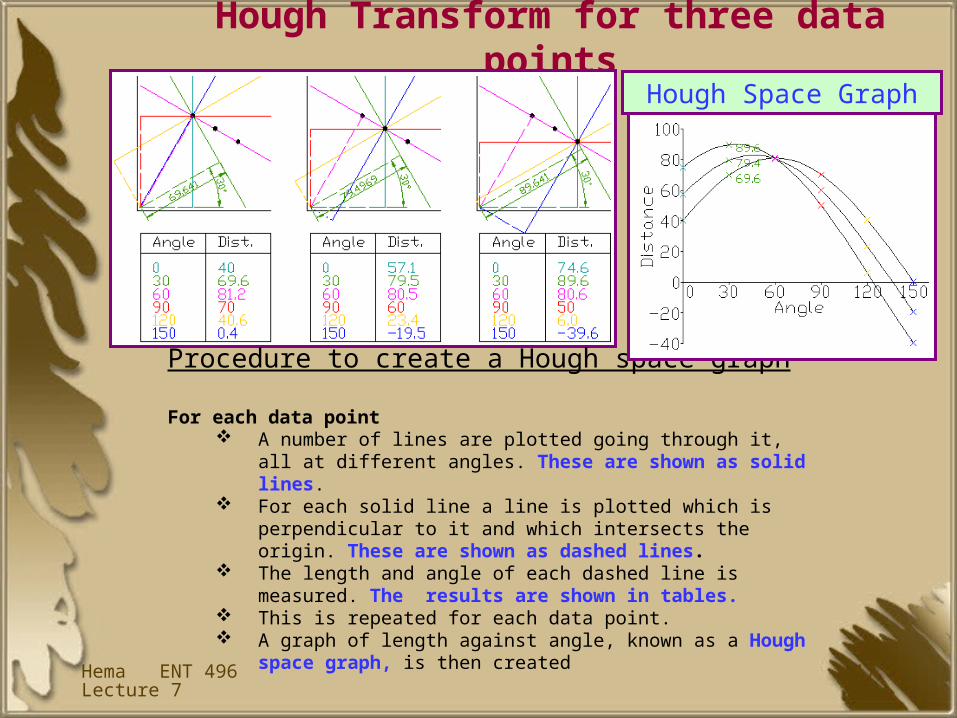
Hough Transform for three data points
Procedure to create a Hough space graph
For each data point A number of lines are plotted going through it, all at different
angles. These are shown as solid lines. For each solid line a line is plotted which is perpendicular to it and
which intersects the origin. These are shown as dashed lines. The length and angle of each dashed line is measured. The
results are shown in tables. This is repeated for each data point. A graph of length against angle, known as a Hough space
graph, is then created
Hough Space Graph
Hema ENT 496 Lecture 7
18
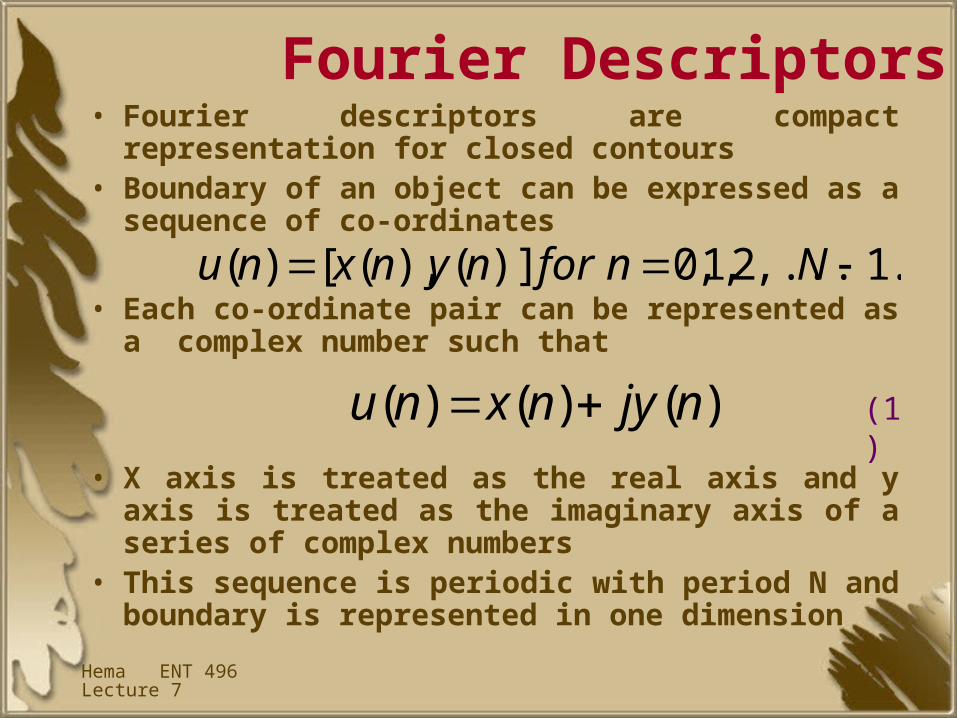
Fourier Descriptors• Fourier descriptors are compact representation for
closed contours• Boundary of an object can be expressed as a
sequence of co-ordinates
• Each co-ordinate pair can be represented as a complex number such that
• X axis is treated as the real axis and y axis is treated as the imaginary axis of a series of complex numbers
• This sequence is periodic with period N and boundary is represented in one dimension
.1,...2,1,0)](),([)( Nnfornynxnu
)()()( njynxnu (1)
Hema ENT 496 Lecture 7
19
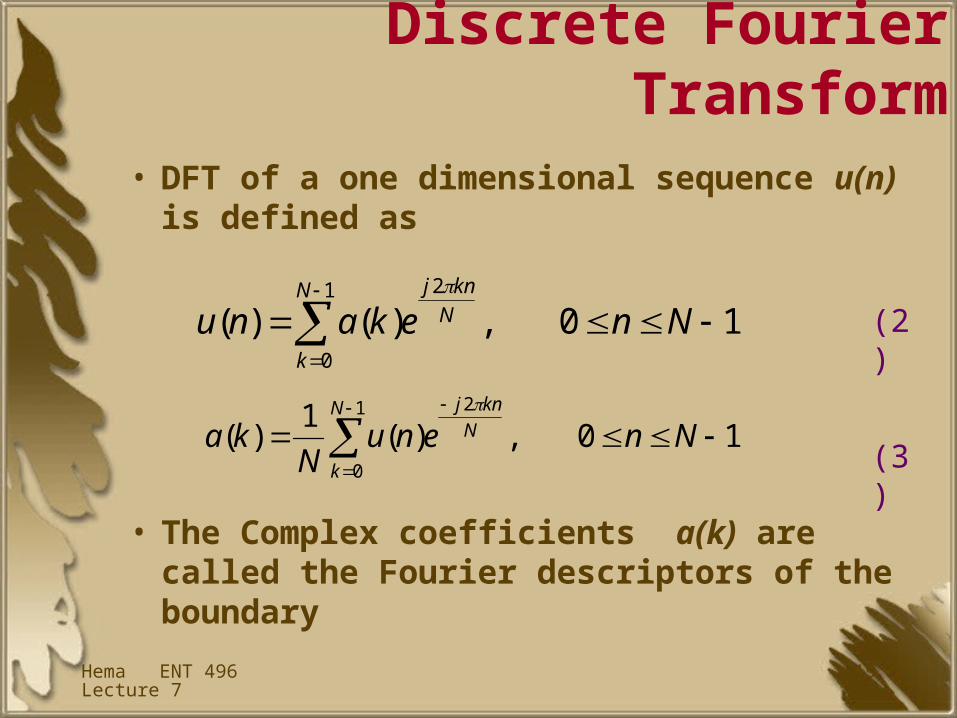
Discrete Fourier Transform
• DFT of a one dimensional sequence u(n) is defined as
• The Complex coefficients a(k) are called the Fourier descriptors of the boundary
10,)()(1
0
2
NnekanuN
k
N
knj
10,)(1
)(1
0
2
NnenuN
kaN
k
N
knj
(3)
(2)
Hema ENT 496 Lecture 7
20
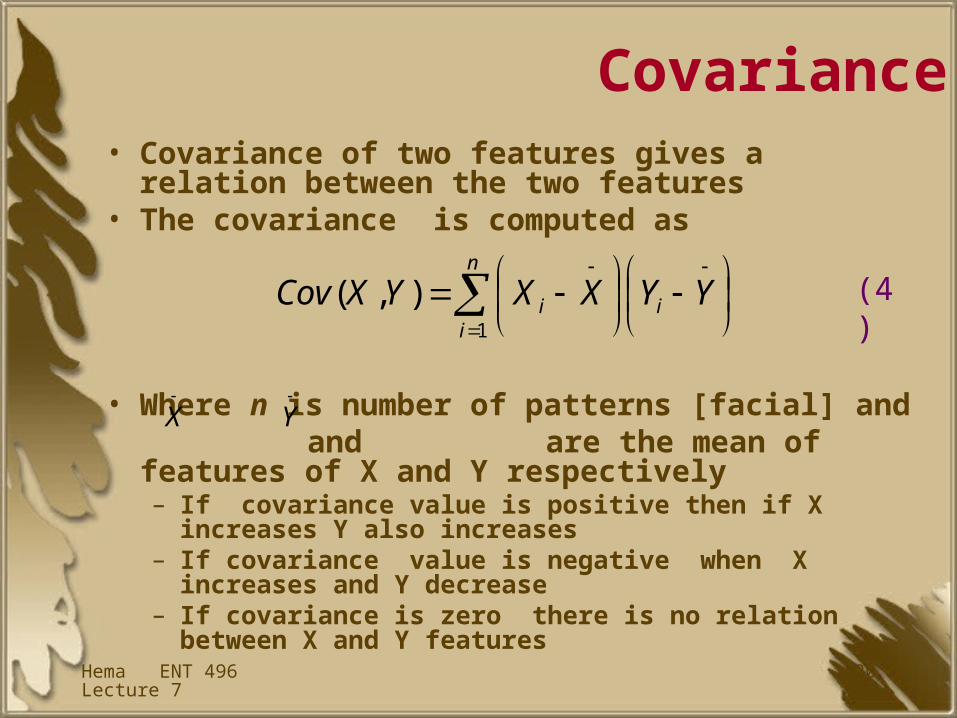
Covariance• Covariance of two features gives a relation
between the two features• The covariance is computed as
• Where n is number of patterns [facial] and and are the mean of features of X and Y
respectively– If covariance value is positive then if X increases Y also
increases– If covariance value is negative when X increases and Y
decrease– If covariance is zero there is no relation between X and Y
features
YYXXYXCov i
n
ii
1
),(
X
Y
(4)
Intelligent Vision Systems
Intelligent Vision Systems
Object Shape Identification and Representation
Hema C.R.
Object Shape Identification and Representation
Hema C.R.
End of Lecture 7