integrative design power point presentation.pptx
TRANSCRIPT

© B. Alan Whitson Company
LCD Monitors Save Space & Money!
Employees in Cubicles 520 520Cubicle Size 8 x 8 6 x 6Cubicles per Cluster/ Number 8/65 10/52Cluster Footprint 16 x 32 12 x 30Total Square Feet w/Circulation 47,027 28,333Use 50% of Saved Square Footage 9,347Total Usable Square Feet 47,027 37,680Gross Up to Rentable (U/R 1.15) 54,081 43,332Rental Rate $24.03 $24.03Rent Year 1 $1,299,566 $1,041,268
Rent Savings Year 1 $258,298Yrs. 1-10 (w/ 2% Escalations) PV @ 5.75% $2,207,533
Savings Per Employee $4,245
© B. Alan Whitson Company
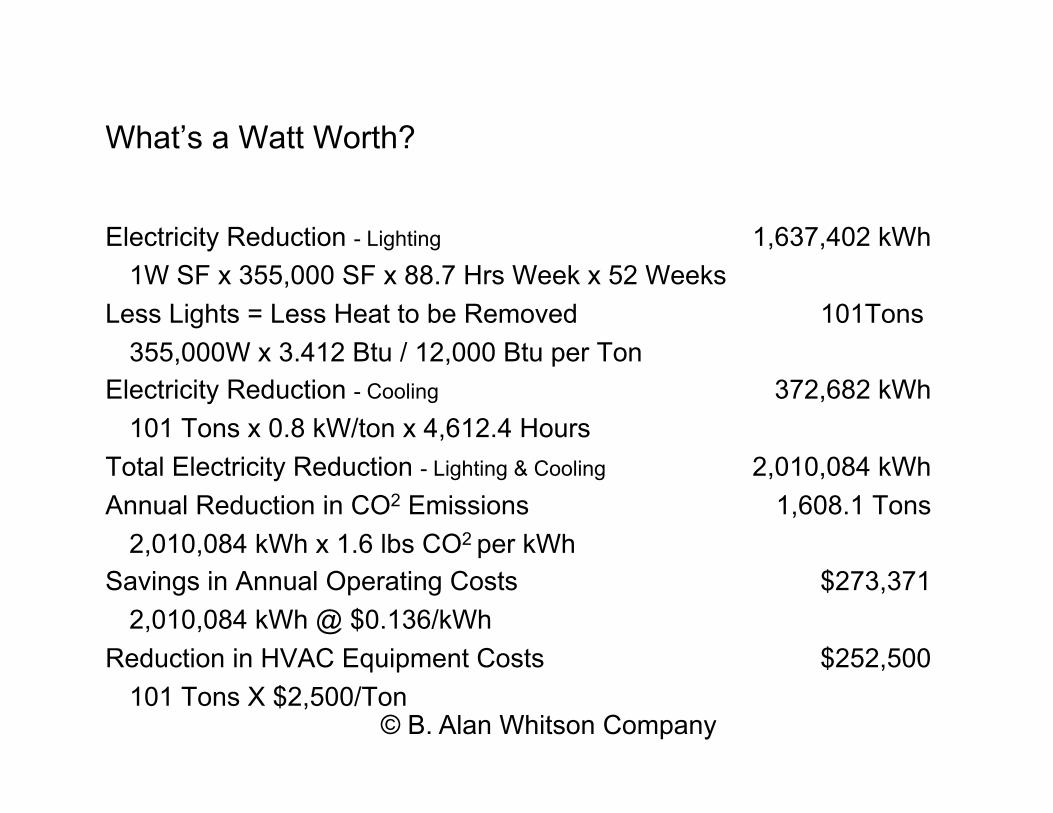
What’s a Watt Worth?
Electricity Reduction - Lighting 1,637,402 kWh
1W SF x 355,000 SF x 88.7 Hrs Week x 52 Weeks
Less Lights = Less Heat to be Removed 101Tons
355,000W x 3.412 Btu / 12,000 Btu per Ton Electricity Reduction - Cooling 372,682 kWh
101 Tons x 0.8 kW/ton x 4,612.4 Hours
Total Electricity Reduction - Lighting & Cooling 2,010,084 kWh
Annual Reduction in CO2 Emissions 1,608.1 Tons
2,010,084 kWh x 1.6 lbs CO2 per kWh Savings in Annual Operating Costs $273,371
2,010,084 kWh @ $0.136/kWh
Reduction in HVAC Equipment Costs $252,500
101 Tons X $2,500/Ton
© B. Alan Whitson Company
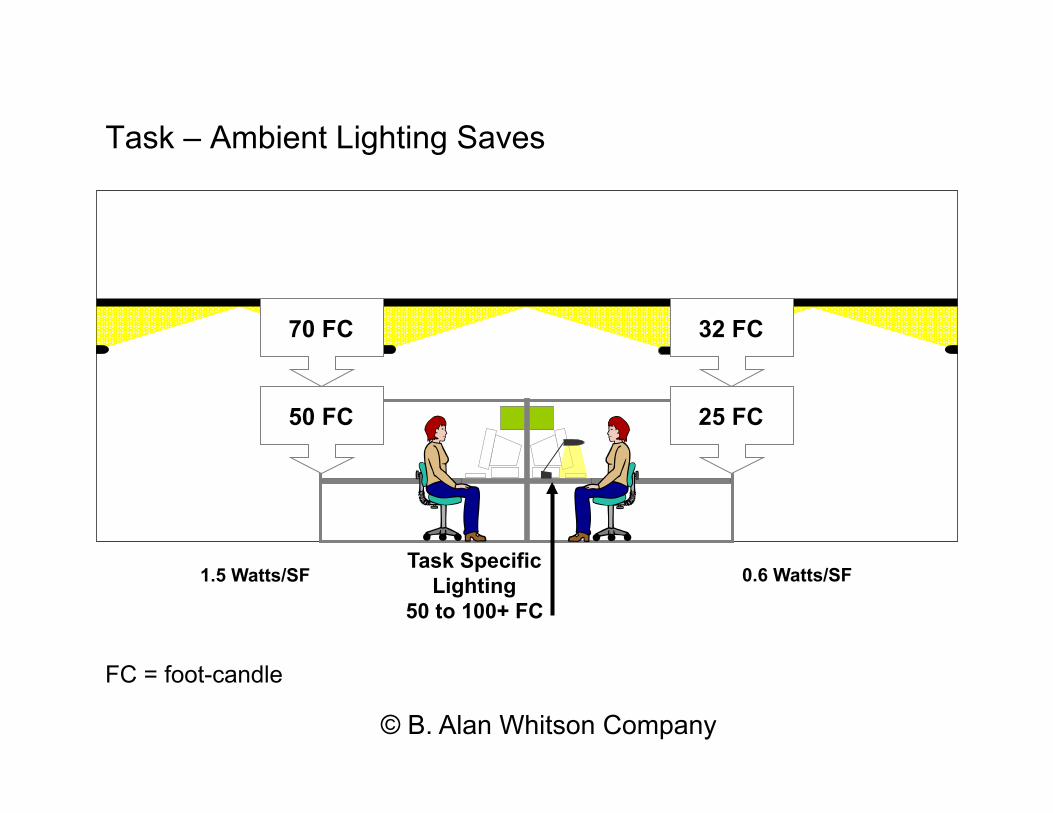
Task – Ambient Lighting Saves
FC = foot-candle
70 FC
50 FC
32 FC
25 FC
Task Specific Lighting
50 to 100+ FC 1.5 Watts/SF 0.6 Watts/SF

What is LCC? (adapted from Nigel Howard’s ‘Cost of Green’ presentation)
All of the costs of owning a building throughout its lifecycle including:
- First Costs to build. . . . . . Once – up front - Operating costs . . . . . . . . Continuous - Maintenance costs . . . . . . Ongoing - Refurbishment costs . . . . Periodic - Disposal costs . . . . . . . . . Once - at end
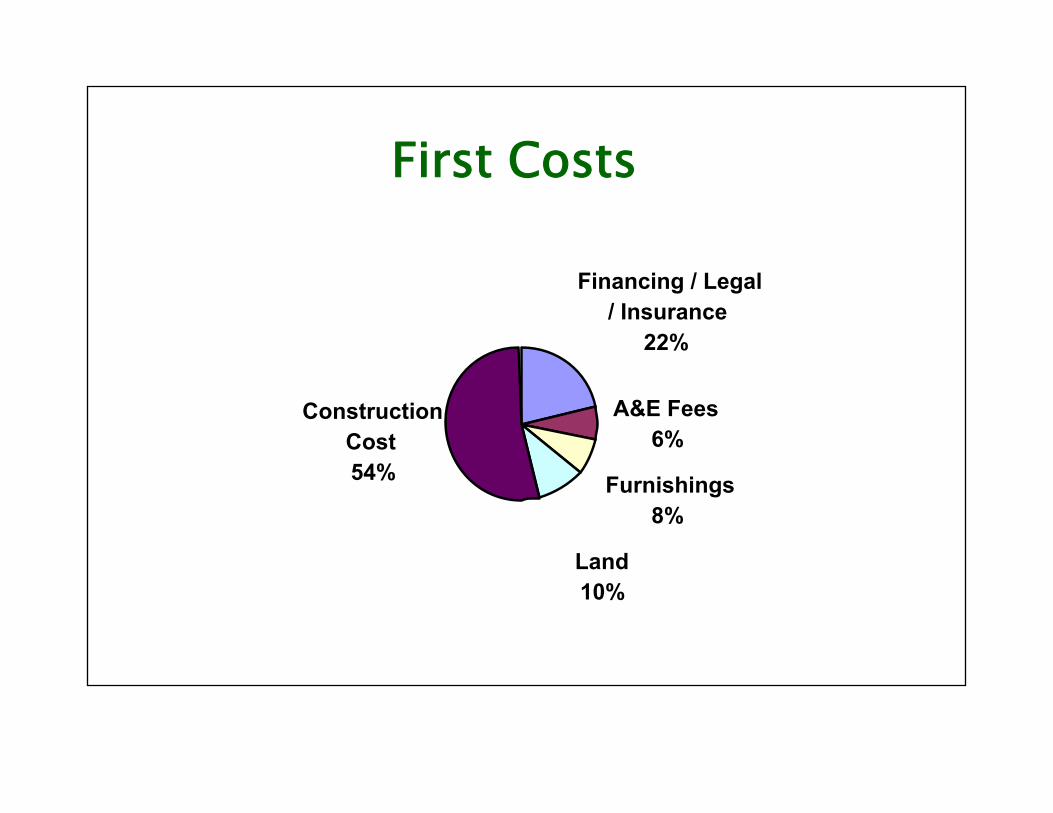
First Costs
Financing / Legal / Insurance
22%
A&E Fees 6%
Furnishings 8%
Land 10%
Construction Cost 54%

Renovations20%
Financing / Legal / Insurance
15%
Taxes17%
Maintenance15%
Operating18%
Construction15%
Life Cycle Costs

Life Cycle - Productivity
Office Costs - $/sf
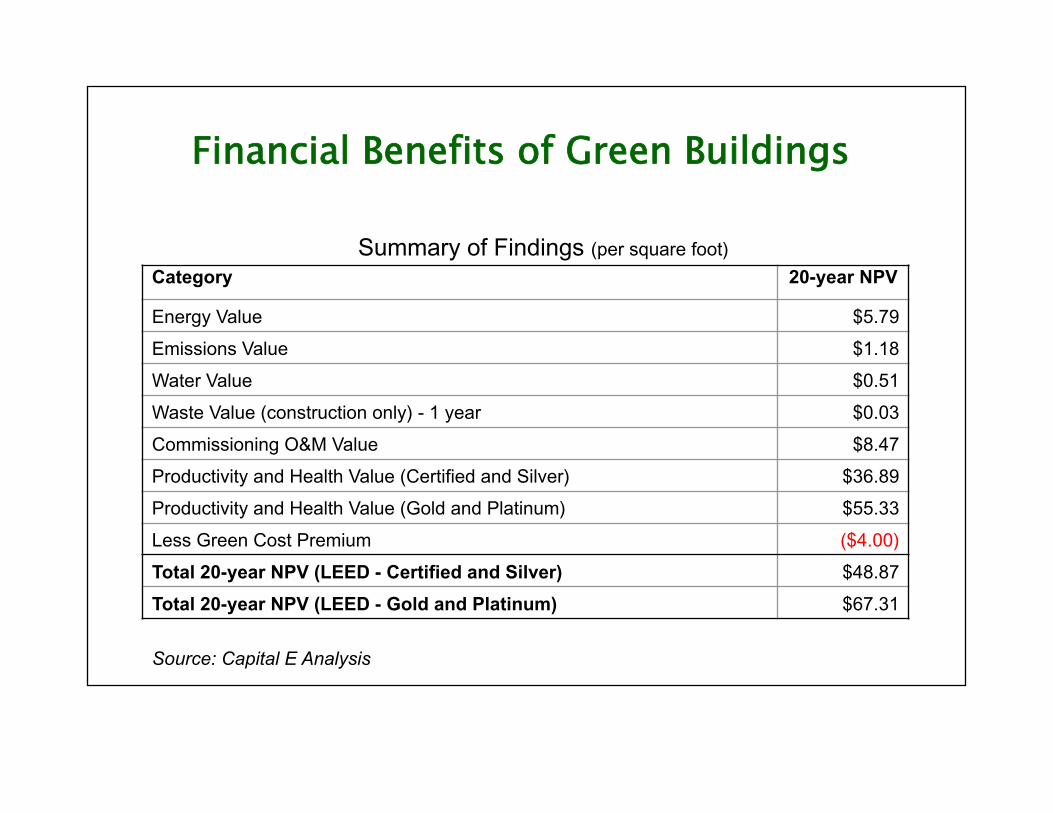
Financial Benefits of Green Buildings
Summary of Findings (per square foot) Category 20-year NPV
Energy Value $5.79
Emissions Value $1.18
Water Value $0.51
Waste Value (construction only) - 1 year $0.03
Commissioning O&M Value $8.47
Productivity and Health Value (Certified and Silver) $36.89
Productivity and Health Value (Gold and Platinum) $55.33
Less Green Cost Premium ($4.00)
Total 20-year NPV (LEED - Certified and Silver) $48.87
Total 20-year NPV (LEED - Gold and Platinum) $67.31
Source: Capital E Analysis
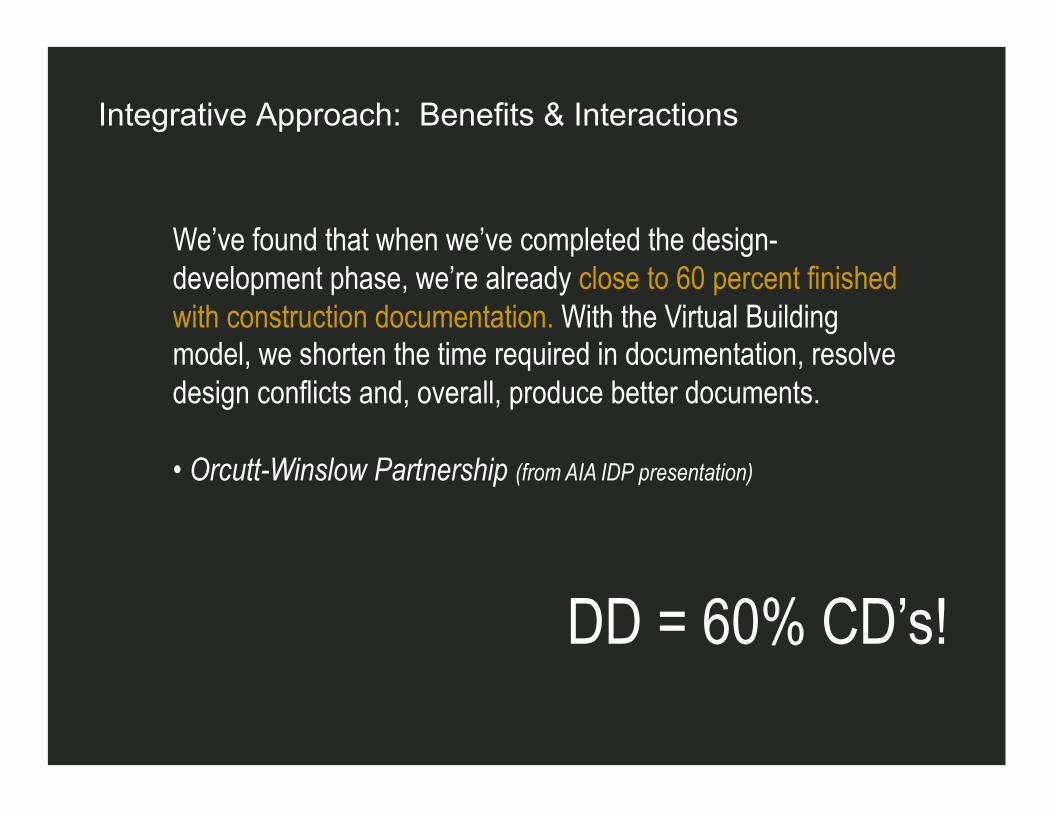
Integrative Approach: Benefits & Interactions
We’ve found that when we’ve completed the design-development phase, we’re already close to 60 percent finished with construction documentation. With the Virtual Building model, we shorten the time required in documentation, resolve design conflicts and, overall, produce better documents.
• Orcutt-Winslow Partnership (from AIA IDP presentation)
DD = 60% CD’s!

Case Study Example: HVAC System Sizing
Air Conditioning ft2/ton
• Standard office building 250 - 400
• PA DEP Spec 600
• PA DEP Cambria Case Study 663
Combining systems impacts to reduce cooling capacity

Case Study Example: Downsize and/or Eliminate Systems
Down-sized HVAC System: - $10,000
High Performance Windows: + $15,000
Perimeter Heating System: - $25,000
- $20,000
Elimination of Perimeter Heating System

Case Study Example: Systems Impacts on Other Systems
How does your interior paint color affect HVAC system costs?
Coefficients of Utilization PRU-9-A-04-2T8-SC-YMW-S-120 Floor effective floor cavity reflectance = .20
Ceiling 80 70 50
Wall 70 50 30 10 70 50 30 10 50 30 10
RCR 0 .72 .72 .72 .72 .62 .62 .62 .62 .43 .43 .43 1 .66 .62 .60 .57 .56 .54 .52 .50 .37 .36 .35 2 .60 .54 .50 .47 .51 .47 .43 .41 .33 .31 .29 3 .54 .48 .43 .39 .46 .41 .37 .34 .29 .26 .24 4 .49 .42 .37 .32 .42 .36 .32 .28 .25 .22 .20 5 .45 .37 .32 .27 .39 .32 .28 .24 .23 .20 .17 6 .41 .33 .28 .24 .35 .29 .24 .21 .20 .17 .15 7 .38 .30 .24 .20 .33 .26 .21 .18 .18 .15 .13 8 .35 .27 .21 .18 .30 .23 .19 .16 .16 .13 .11 9 .33 .24 .19 .15 .28 .21 .17 .14 .15 .12 .10 10 .30 .22 .17 .14 .26 .19 .15 .12 .13 .11 .09
Connections: Paint Lighting HVAC Sizing for cooling
# of light fixtures = footcandles x area lumens x LLF x CU
= 25% Reduction

Case Study Example: Team Process
Relocation of Mechanical Room:
• Original Design for mechanical room – Penthouse
• Optimized Design
Encourage each team member to think outside their discipline
Net First Cost Impact = $ 40,000 Reduction

Manufacturers Contractors Mechanical Engineers Lighting Designers Electrical Engineers Construction Managers Facility Managers Commissioning Agents Clients Architects
Interior Designers Building/Project Users Government agencies Community members Bankers Landscape Architects Civil Engineers Planners Environmentalists Lawyers
Who’s the designer . . . ?

CONVENTIONAL BUILDING TEAM
Client
Builder Architect
THE “CHAMPION” MODEL (Linear Process / Industrial Age Thinking)

Integrative Design: Building and Design Team as an Organism
Systems Integration:
• Understanding relationships between systems
• Not a set of component parts
• Holistic, non-linear process
• Downsize or eliminate systems
• Analysis Tools
Energy modeling
Daylighting modeling
Materials analysis and impacts
• Team is an organism too – not a set of parts
• Manage the design process as a whole

INTEGRATED BUILDING TEAM (COMPOSITE MASTER BUILDER)
Avo
idin
g R
ecip
roca
l Ign
oran
ce
Clie
nt
Structural Eng.
Waste Specialist
Structural Sub.
Energy Modeler
Planner
Landscape Arch.
Mech Sub. Habitat Spec.
M.E.P. Eng.
Civil Sub.
Millwork
Finish Subs.
Electrical Sub.
Commissioning Agent
And so on . . .
Staff Reps.
Decision Maker
Property Broker
Facilities Mngmt.

IDP Team Organization
Source: Roadmap for the Integrated Design Process, BC Green Building Roundtable

IDP Comparison with Conventional Process
Source: Roadmap for the Integrated Design Process, BC Green Building Roundtable
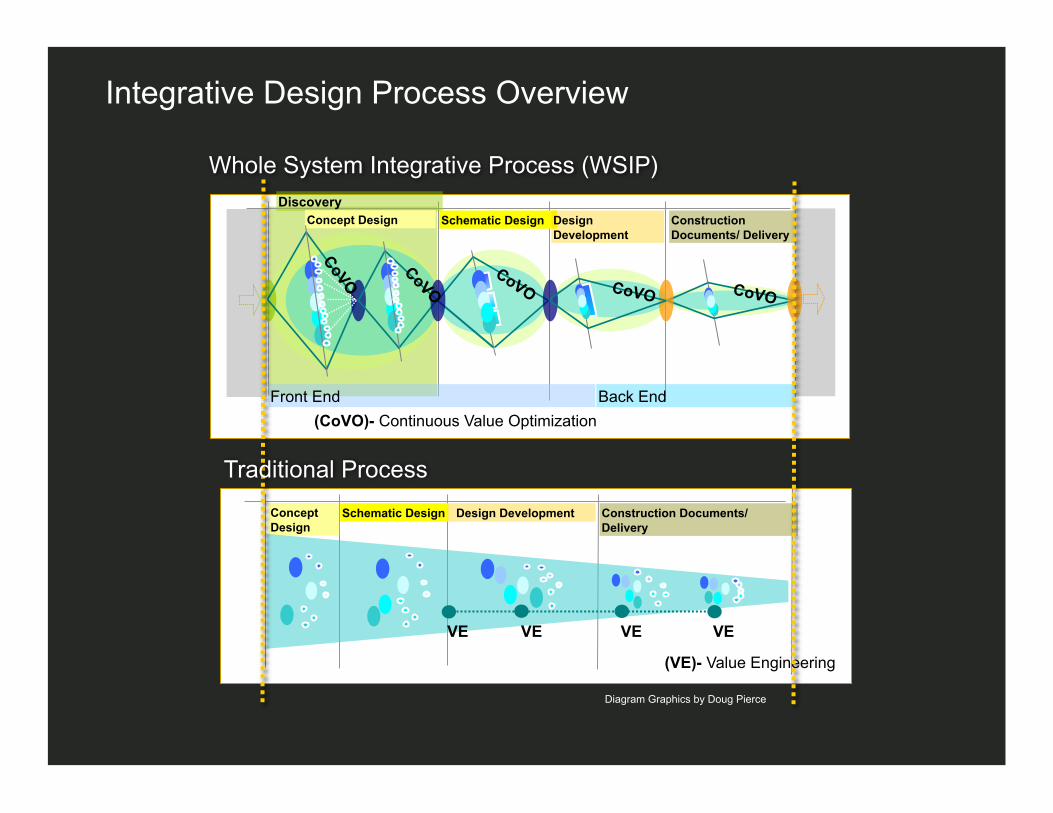
Integrative Design Process Overview
Discovery Schematic Design Construction
Documents/ Delivery Design Development
Front End Back End
Concept Design
(CoVO)- Continuous Value Optimization
CoVO CoVO
Whole System Integrative Process (WSIP)
Schematic Design Design Development Construction Documents/ Delivery
Concept Design
(VE)- Value Engineering
VE VE VE VE
Diagram Graphics by Doug Pierce
Traditional Process

Integrative Design Process: Impacts on Design Schedule
Construction Documents
Construction Documents
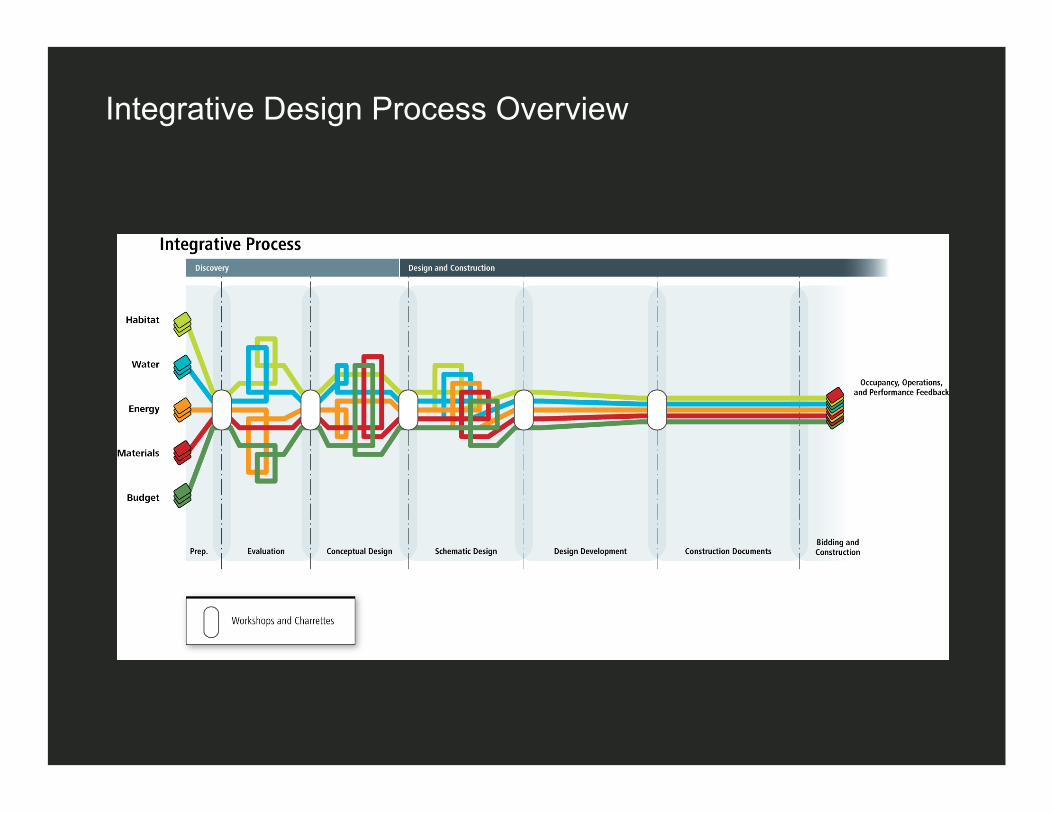
Integrative Design Process Overview
Integrative Design Process Principles
“Optimizing components in isolation tends to pessimize the whole system – and hence the bottom line.”
“You can actually make a system less efficient, simply by not properly linking up those components.”
“If they’re not designed to work with one another, they’ll tend to work against one another.”
Hawken, A. Lovins, H. Lovins, from Natural Capitalism

No experts, only co-learners
Part A: Discovery
Selling this Process to the Client (main decision maker)
Assemble/ Interview Team – process emphasis (ego systems: attachment vs. will)
Discovery Process - (Part A Contract)
Alignment – Purpose, Value-adding, Process – Co-learning (dialogue, developmental)
Identify Key Systems/ Patterns – form shapers (energy, water, habitat, materials)
Commit to Goals and Stretch Goals (or better, principles and potential)
Map the Integration Process – (Part B Contract)
Part B: Design & Construction
Conceptualize the System Designs – Before Concept or Schematic Design Begins
System Stories, Integrative Cost Bundling – BOD, OPR
Iterate – workshops & research/ design: work towards Whole System synergy
Construction Partnering
Part C: Occupancy & Operations
Commission, Maintain, Monitor – Feedback FOREVER
The Basic Elements of Integrative Design
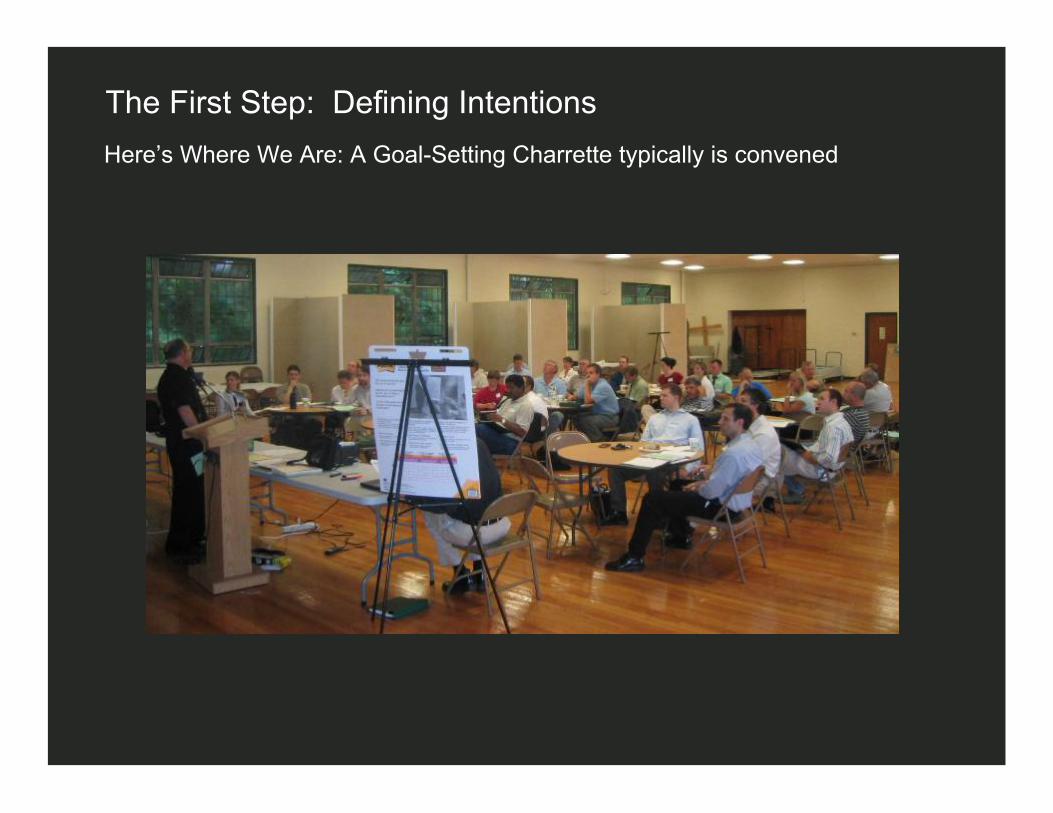
The First Step: Defining Intentions
Here’s Where We Are: A Goal-Setting Charrette typically is convened

The First Step: Defining Intentions
Here’s Where We Are: A LEED Checklist documents initial performance goals
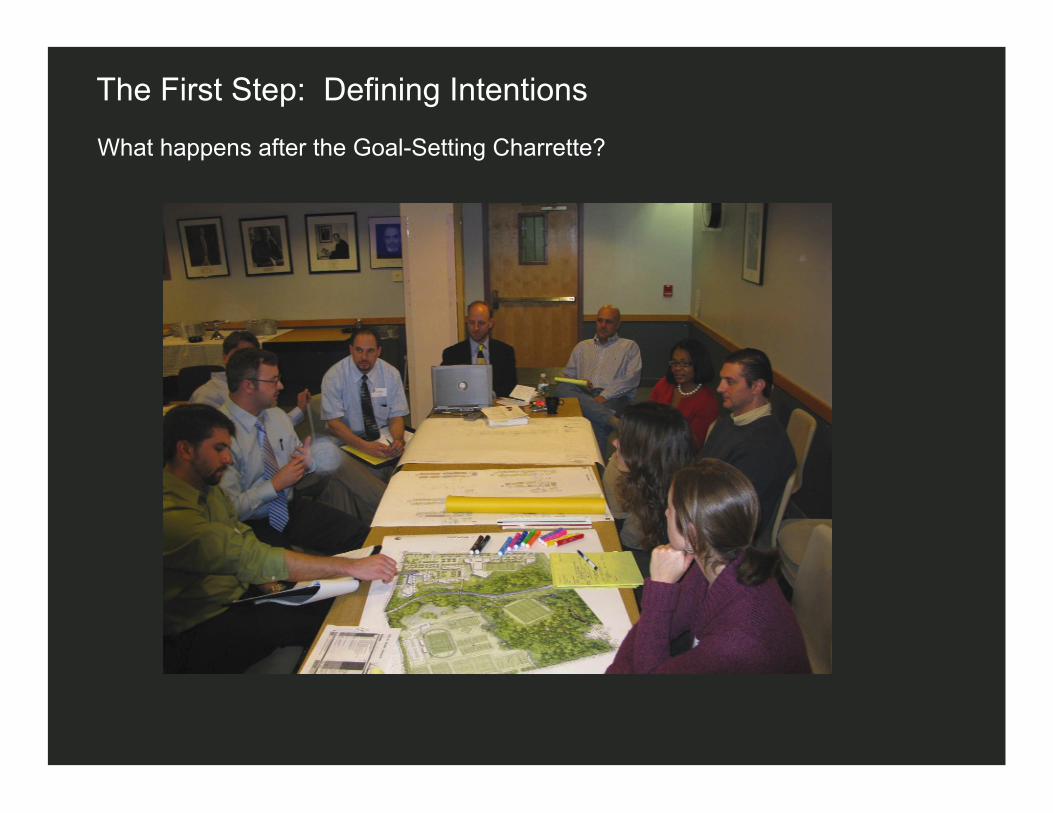
The First Step: Defining Intentions
What happens after the Goal-Setting Charrette?
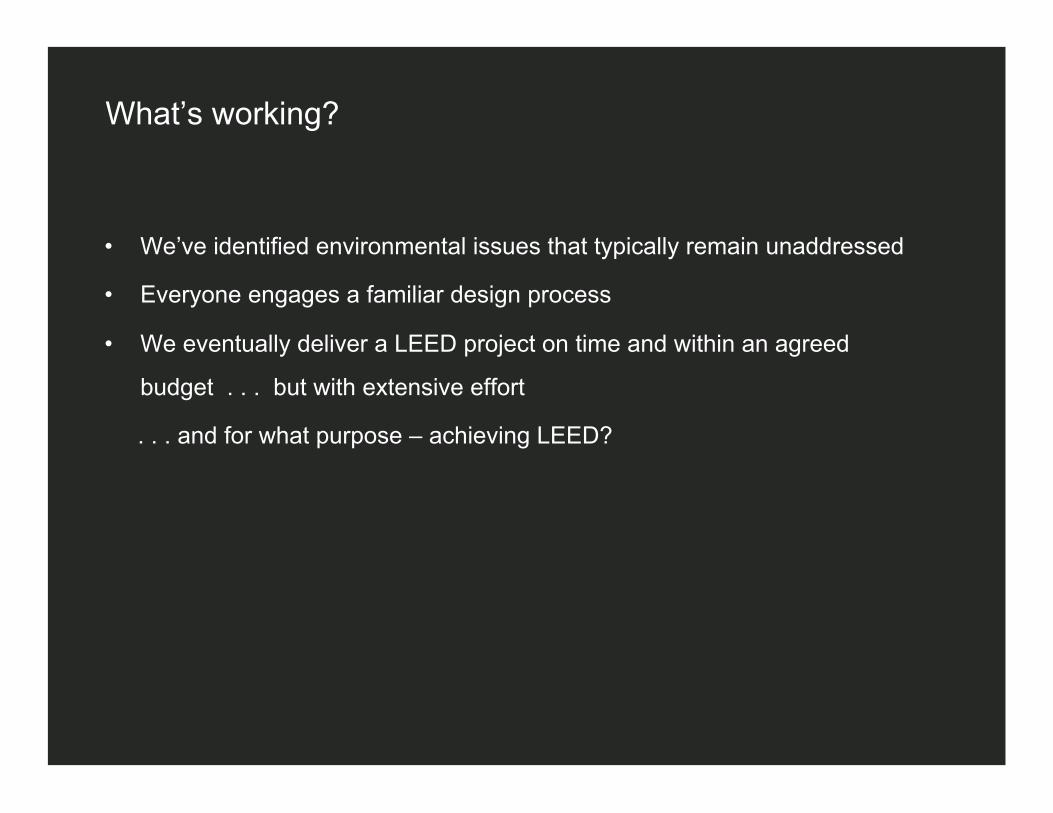
What’s working?
• We’ve identified environmental issues that typically remain unaddressed
• Everyone engages a familiar design process
• We eventually deliver a LEED project on time and within an agreed
budget . . . but with extensive effort
. . . and for what purpose – achieving LEED?
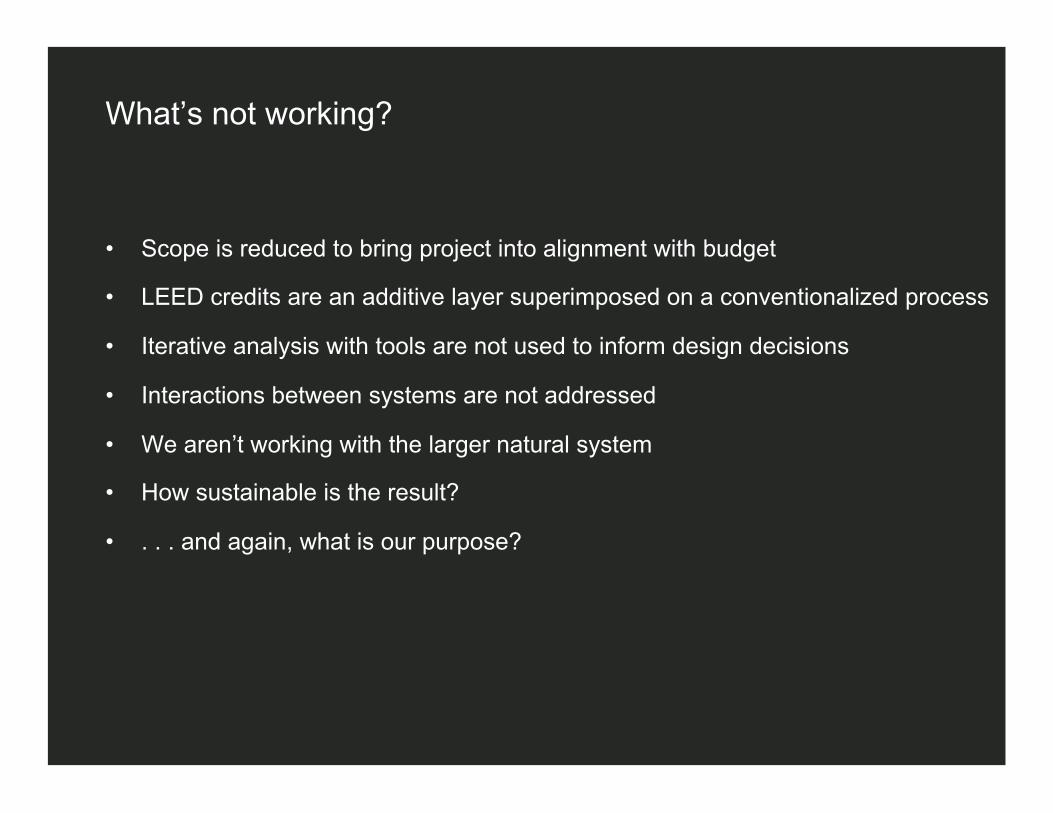
What’s not working?
• Scope is reduced to bring project into alignment with budget
• LEED credits are an additive layer superimposed on a conventionalized process
• Iterative analysis with tools are not used to inform design decisions
• Interactions between systems are not addressed
• We aren’t working with the larger natural system
• How sustainable is the result?
• . . . and again, what is our purpose?

DEP Cambria First LEED v2.0 Gold Building. Built for $93/ft2 in 2000.
“Some esoteric chemistry took place with the team’s willingness to explore new solutions without having to know the answers.”
“My life changed – not immediately, but it was a transformative process over time.”
“It became more than a job – it became a personal passion. . . and this from a career beauroucrat?!?”
- Jim Toothaker, PA DEP
How can we do this differently?
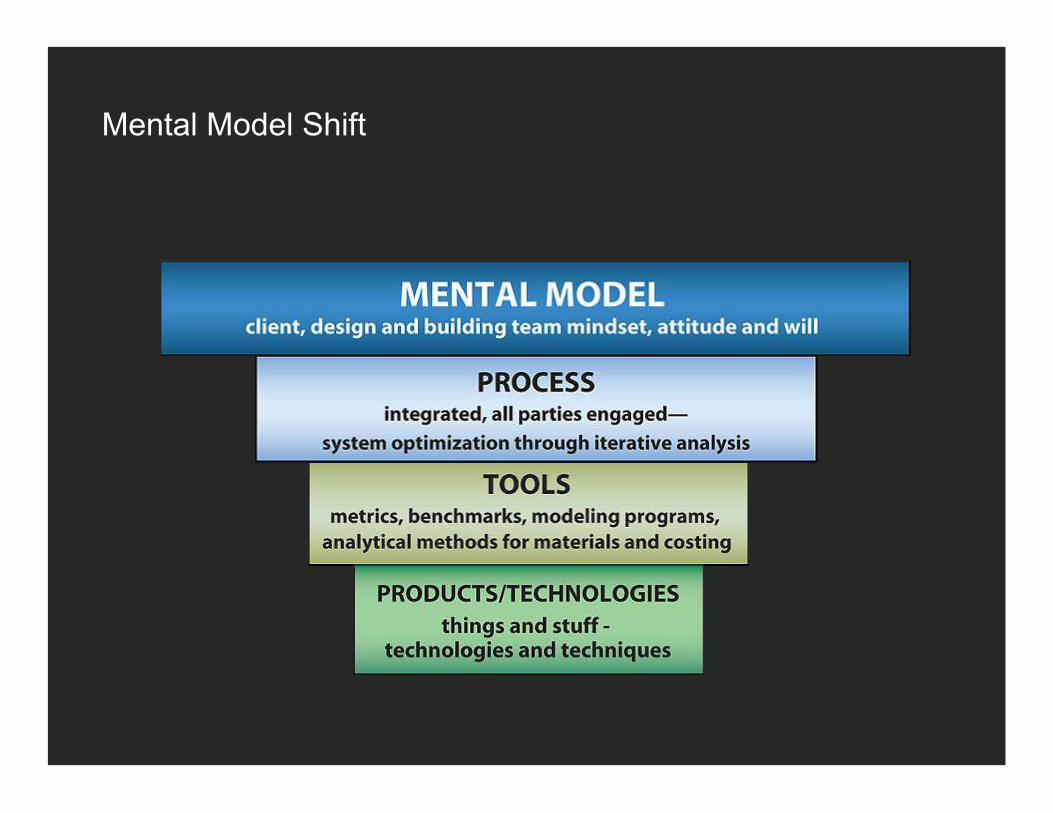
Mental Model Shift

-Regenerative
Less Energy Required More Energy Required
-Restorative
-Sustaining / Conservation
-Conventional Practice
Technologies / Techniques Fragmented Thinking
Living Systems Understanding Whole System Pattern Thinking
Regenerating System
Degenerating System
Trajectory of Environmentally Responsible Design © All rights reserved. Regenesis 2006 - Contact Bill Reed, [email protected] for permission to use
-Conservation -High Performance -Green
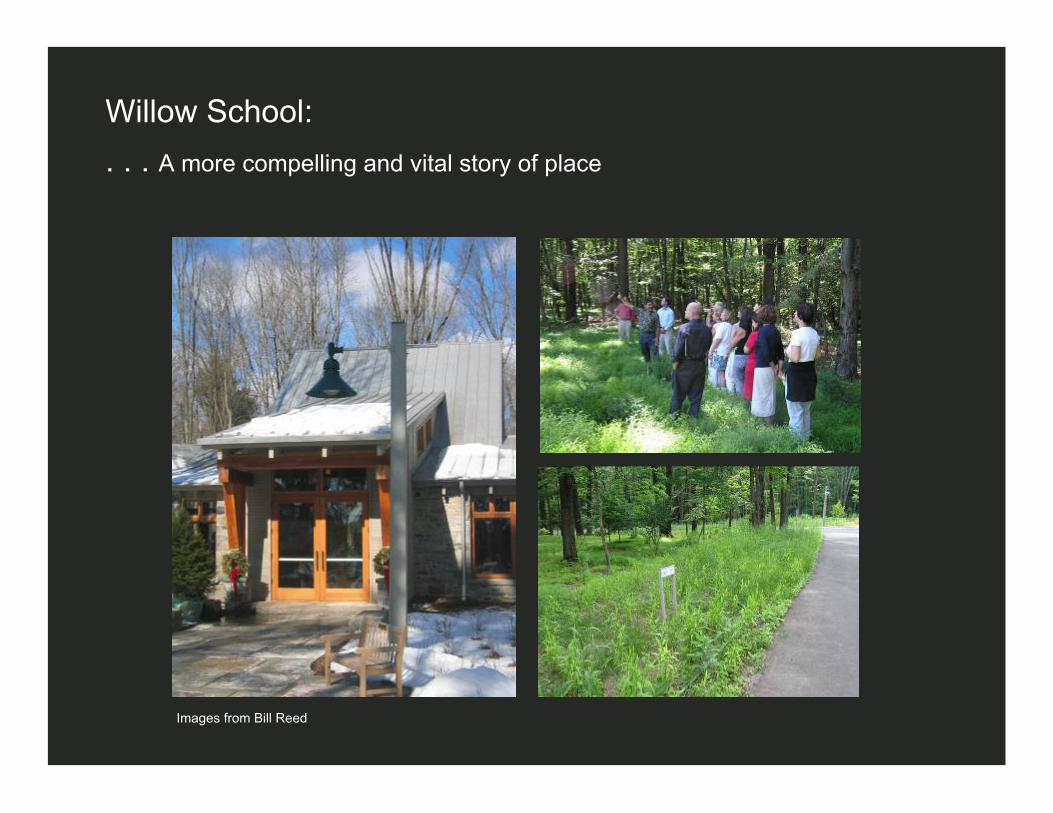
Willow School:
. . . A more compelling and vital story of place
Images from Bill Reed

Understanding Patterns of Place
Images from Regenesis and Tim Murphy

Understanding Patterns of Place

Nested Sub-Systems

Suggested Process Outline Diagram Discovery
Schematic Design Design Development Construction Documents / Delivery
Front End Back End
All Team Workshops / Charrettes
Key Sub-Systems – Breakout Workshops
Pre-Design / Concept Design
All Team Mindset / Goal-Setting Workshop
All Team Coordination Meetings
CoVO - Continuous Value Optimization
CoVO CoVO
Analysis / Research of Strategy or Piece
Diagram Graphics by Doug Pierce
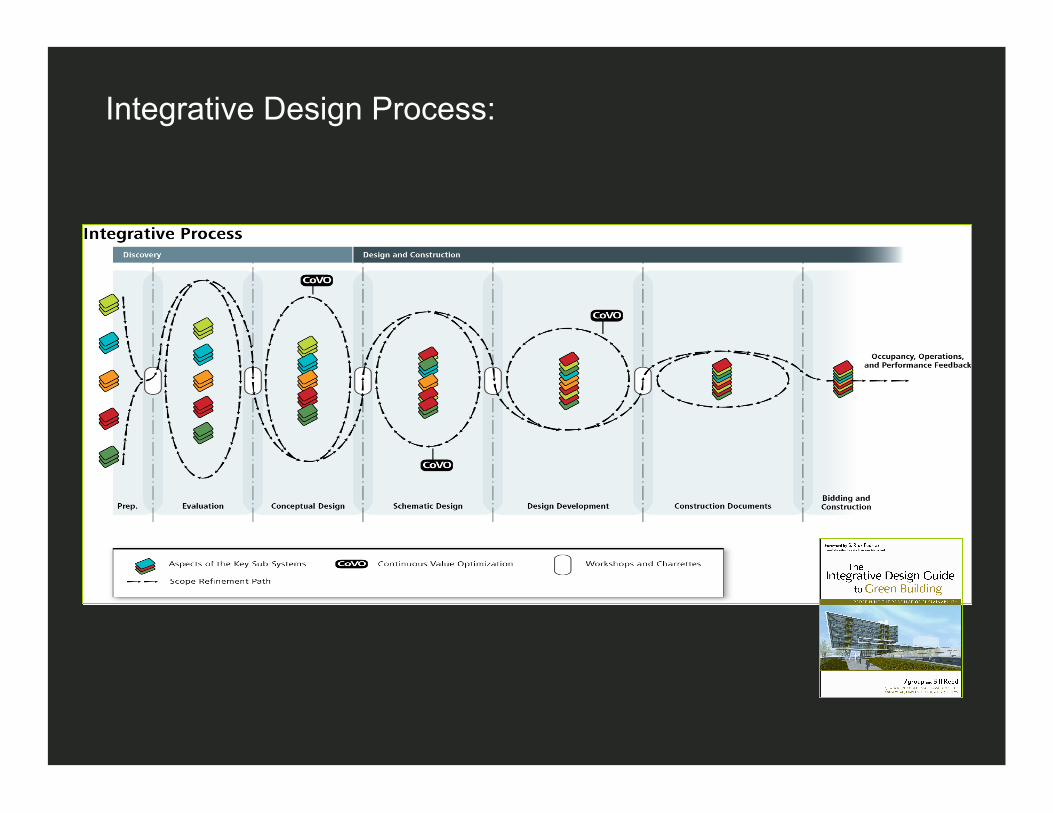
Integrative Design Process:

Integrative Process Roadmap

Pre-Design – The Discovery Phase
Let’s revisit what happens after the Goal-Setting Charrette . . . . and before it
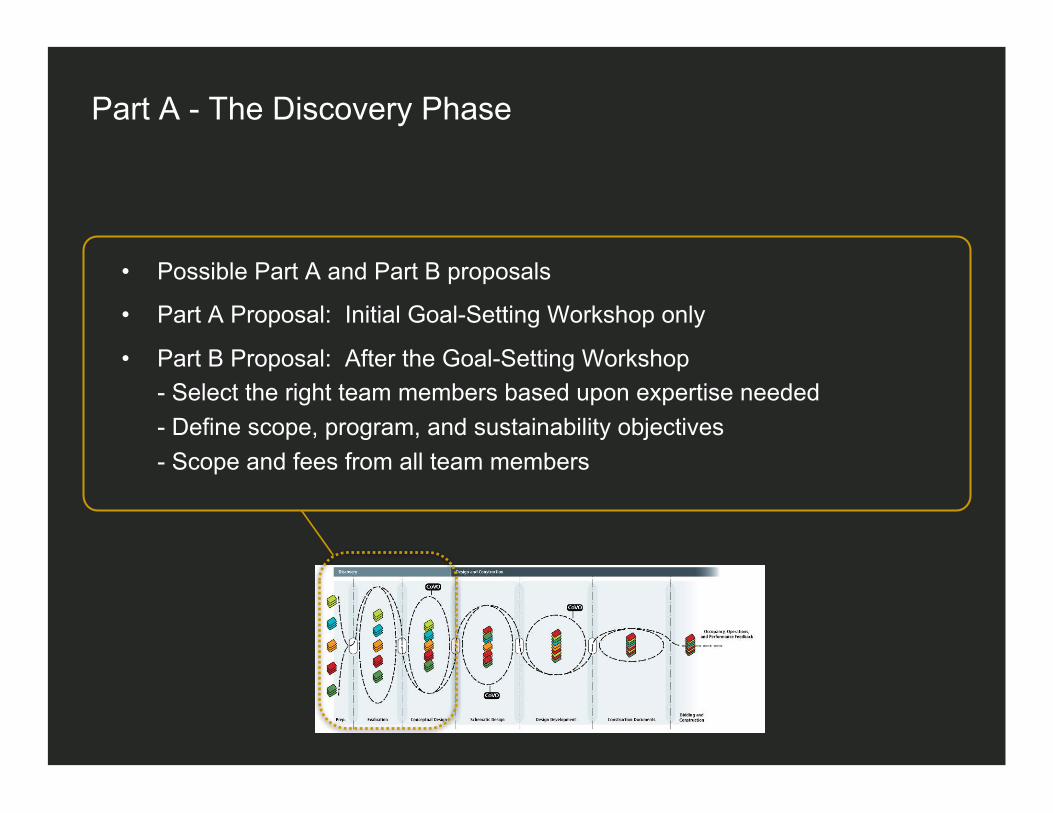
Part A - The Discovery Phase
• Possible Part A and Part B proposals
• Part A Proposal: Initial Goal-Setting Workshop only
• Part B Proposal: After the Goal-Setting Workshop
- Select the right team members based upon expertise needed
- Define scope, program, and sustainability objectives
- Scope and fees from all team members

• Preliminary Research to Prepare for the Goal-Setting Workshop (Workshop #1)
- Site Selection - Assess optional sites
- Context - Identify base ecological conditions: climate, habitat, history, etc.
- Perform preliminary analysis of flows: four key sub-systems
- Identify key stakeholders: People and non-human systems
- Develop initial functional programmatic requirements
Stage A.1- Research and Analysis:
“Preparation”
Avoids a “fact-free” meeting
Four Key Sub-Systems
• Habitat: – Human, earth, and biotic systems
• Water: – Water quality and conservation, hydrology, soils
• Energy: – Energy efficiency and sources, microclimates, building use
• Materials: – Local material sources and waste opportunities

Case Study Example: PA DEP Southeast Regional Office Building

Site Selection
SSc1: Site Selection 1 point SSc2: Development Density 1 point SSc3: Brownfield Redevelopment 1 point SSc4.1: Alternative Transportation: Public Access 1 point SSc4.4: Alternative Transportation: Parking Capacity 1 point
5 points
LEED for New Construction Credits