integrated nanoneedle-microfluidic system for single...
TRANSCRIPT

INTEGRATED NANONEEDLE-MICROFLUIDIC SYSTEM FOR SINGLE CELLINTRACELLULAR TEMPERATURE MEASUREMENT
SALMA ABDULLAH SHAABAN BINSILM
UNIVERSITI TEKNOLOGI MALAYSIA
INTEGRATED NANONEEDLE-MICROFLUIDIC SYSTEM FOR SINGLE CELLINTRACELLULAR TEMPERATURE MEASUREMENT
SALMA ABDULLAH SHAABAN BINSILM
A thesis submitted in fulfilment of therequirements for the award of the degree of
Master of Engineering (Electrical)
Faculty of Electrical EngineeringUniversiti Teknologi Malaysia
JULY 2015

iii
"I dedicate this to my beloved parents; Abdullah Mohammed Binsilm and NasraSalim Daer, my husband Iyad Hamed Alsaqqaf, my brother and his family for theirsupport and encouragement throughout my education. Thank you for always being
there for me"

iv
ACKNOWLEDGEMENT
In the name of Almighty Allah, the most Gracious, the most Merciful, forgiving me the determination and will to complete my master research.
My deepest gratitude goes to my supervisor Dr. Mohd Ridzuan bin Ahmad forgiving me the opportunity to carry out the research under his supervision. I considermyself lucky to be able to have the proper guidance, great support, encouragement,motivation, inspirations and kindness throughout the research
My heartiest and utmost gratitude goes to my parents and my family for theirpatience, sacrifices, understanding, constant concern, moral support and prayers duringmy journey.
I also want to thank my friends and colleagues who have been very helpfulthroughout my research journey especially Amelia Ahmad Khalili, Abdul Hafiz MatSulaiman, Md Habibur Rahman, Ida Laila, Siti Nadia, Arbab Alamgir and MuhammadAsyraf Mandor. Thank you very much for the support that had been given eitherdirectly or indirectly until the very end.

v
ABSTRACT
Single cell analysis has become an important field of research in which cellproperties are studied for an improved understanding of cellular processes. Cellintracellular temperature has proven to be a vital element in most cellular activates,chemical reactions and cell survival. An integrated nanothermal sensor-microfluidicsystem has been proposed to characterize the internal temperature of single cells.A finite element analysis study based on resistance temperature detectors has beenstudied. The first stage was to optimize the sensor design and dimensions wheretungsten was chosen as a sensing material. Results show that a rectangular shape witha gap of 10.8 µm gave an equally distributed current density within the sensor, and90 nm2 cross sectional area caused minimal damage to the cell. Further mechanicalcharacterization has been done and the results show that the nanoneedle could resistramp force applied before failure, up to 22.5 µN. The second stage was to test thenanoneedle ability to measure the temperature of a cell. Electrical measurementon yeast cell was done and the results show that the nanoneedle conductivity wasindependent of cell conductivity. The nanoneedle proved to be able to measure thetemperature with a current difference of 50 nA and the resolution was 0.015 °C inthe range of 24-60 °C. The nanoneedle detected temperature change of 0.02 °C in 10ms. The third stage was to integrate the nanoneedle with the microfluidic system andto study water flow behaviour in the microfluidic channel. Results show that 63 µm2
microchannel cross sectional area was optimum and flow rate of 24.6 pl/min allowedsuccessful cell penetration with minimal cell damage. The developed system can be agood candidate to be used in early disease diagnoses. Also, the system has the potentialto measure electrical properties of cells and to be used for single cell drug delivery.
vi
ABSTRAK
Analisis sel tunggal telah menjadi satu bidang yang penting dalam penyelidikandi mana pencirian sel dikaji bagi memahami proses selular dengan lebih baik. Suhuintraselular sel telah terbukti merupakan elemen penting dalam kebanyakan aktivitiselular, tindak balas kimia, dan kelangsungan hidup sel. Suatu sistem bersepadupengesan nanoterma-microfluidic telah dicadangkan untuk mencirikan suhu dalamansel tunggal. Suatu kajian analisis unsur terhingga berdasarkan rintangan pengesansuhu telah dijalankan. Peringkat pertama adalah pngoptimuman reka bentuk sensordan dimensi di mana tungsten telah dipilih sebagai bahan penderiaan. Keputusanmenunjukkan bahawa bentuk segi empat tepat dengan jurang sebanyak 10.8 µmmemberi ketumpatan arus sekata diedarkan dalam sensor, dan 90 nm2 kawasan keratanrentas menyebabkan kerosakan minimum kepada sel. Pencirian mekanikal lanjut telahdilakukan dan keputusan menunjukkan bahawa, nanoneedle yang dapat menahan dayatanjakan digunakan sebelum kegagalan, sehingga 22.5 µN. Peringkat kedua adalahuntuk menguji keupayaan nanoneedle untuk mengukur suhu sel. Pengukuran elektrikpada sel yis yang telah dilakukan dan keputusan menunjukkan bahawa kekonduksiannanoneedle itu tidak dipengaruhi oeh kekonduksian sel. Nanoneedle terbukti dapatmengukur suhu dengan perbezaan semasa 50 nA dengan resolusi 0.015 °C dalamlingkungan 24-60 °C. Nanoneedle berupaya mengesan perubahan suhu sebanyak 0.02°C dalam 10 ms. Peringkat ketiga adalah untuk mengintegrasikan nanoneedle dengansistem microfluidic dan mengkaji sifat aliran air dalam saluran microfluidic. Hasilkajian menunjukkan bahawa luas keratan rentas 63 µm2 mikro adalah optimum dankadar aliran sebanyak 24.6 pl/min berjaya membenarkan penembusan sel dengankerosakan sel yang minimum. Sistem yang dibangunkan boleh menjadi calon yangbaik untuk digunakan dalam diagnosis penyakit awal. Selain itu, sistem ini mempunyaipotensi untuk mengukur sifat elektrik sel dan digunakan untuk penyampaian ubatkepada sel.
vii
TABLE OF CONTENTS
CHAPTER TITLE PAGE
DECLARATION iiDEDICATION iiiACKNOWLEDGEMENT ivABSTRACT vABSTRAK viTABLE OF CONTENTS viiLIST OF TABLES xiLIST OF FIGURES xiiLIST OF SYMBOLS xixLIST OF ABBREVIATIONS xxLIST OF APPENDICES xxii
1 INTRODUCTION 11.1 Research background 11.2 Temperate effect on cells and natural systems 11.3 Problem statement 21.4 Significance of the project 31.5 Objectives of the project 41.6 Scope of the project 41.7 Organization of the thesis 4
2 LITERATURE REVIEW 62.1 Introduction 62.2 Luminescence thermometers 7
2.2.1 Nanoparticles based thermometry 82.2.1.1 Quantum dots based thermome-
try 112.2.1.2 Quantum mechanical spin of
diamond based thermometry 15
viii
2.2.2 Fluorescent dyes based thermometry 162.3 Nonluminescence thermometers 212.4 Summary of methods 252.5 Theoretical studies 25
2.5.1 The sensor 262.5.2 Single cell model 292.5.3 Microfluidic devices 31
3 METHODOLOGY 333.1 Introduction 333.2 Finite element analysis 333.3 System concept and design 353.4 Integrated nanoneedle microfluidic system 38
3.4.1 Glass Base 393.4.2 Nanoneedle/ Electrode 393.4.3 PDMS-microchannel structure 39
3.5 Simulation modeling verification 413.5.1 Mechanical model verification 433.5.2 Thermal/electric model verification 453.5.3 Heat transfer verification 463.5.4 Fluid flow verification 47
3.6 Summary 50
4 NANONEEDLE DESIGN AND CHARACTERIZATION 514.1 Introduction 514.2 Thermistor based nanoneedle 51
4.2.1 Thermistor based nanoneedle design opti-mization 524.2.1.1 Simulation Setup 534.2.1.2 Simulation Results 54
4.2.2 Thermistor based nanoneedle electricalcharacterization 554.2.2.1 Simulation Setup 564.2.2.2 Simulation Results 56
4.3 Tungsten based nanoneedle 584.3.1 Tungsten based nanoneedle design opti-
mization 584.3.1.1 Simulation Setup 59
ix
4.3.1.2 Simulation Results 594.3.2 Tungsten based nanoneedle
thermal/electric characterization 614.3.2.1 Simulation Setup 614.3.2.2 Simulation Results 62
4.3.3 Tungsten based nanoneedle mechanicalcharacterization 634.3.3.1 Simulation Setup 644.3.3.2 Simulation Results 65
4.4 Single cell thermal/electrical property characteriz-ing 674.4.1 Introduction 674.4.2 Electrical measurement of single cell 67
4.4.2.1 Simulation Setup 684.4.2.2 Simulation Results 68
4.4.3 Temperature measurement via nanonee-dle 694.4.3.1 Simulation Setup 704.4.3.2 Simulation Results 71
4.5 Summary 72
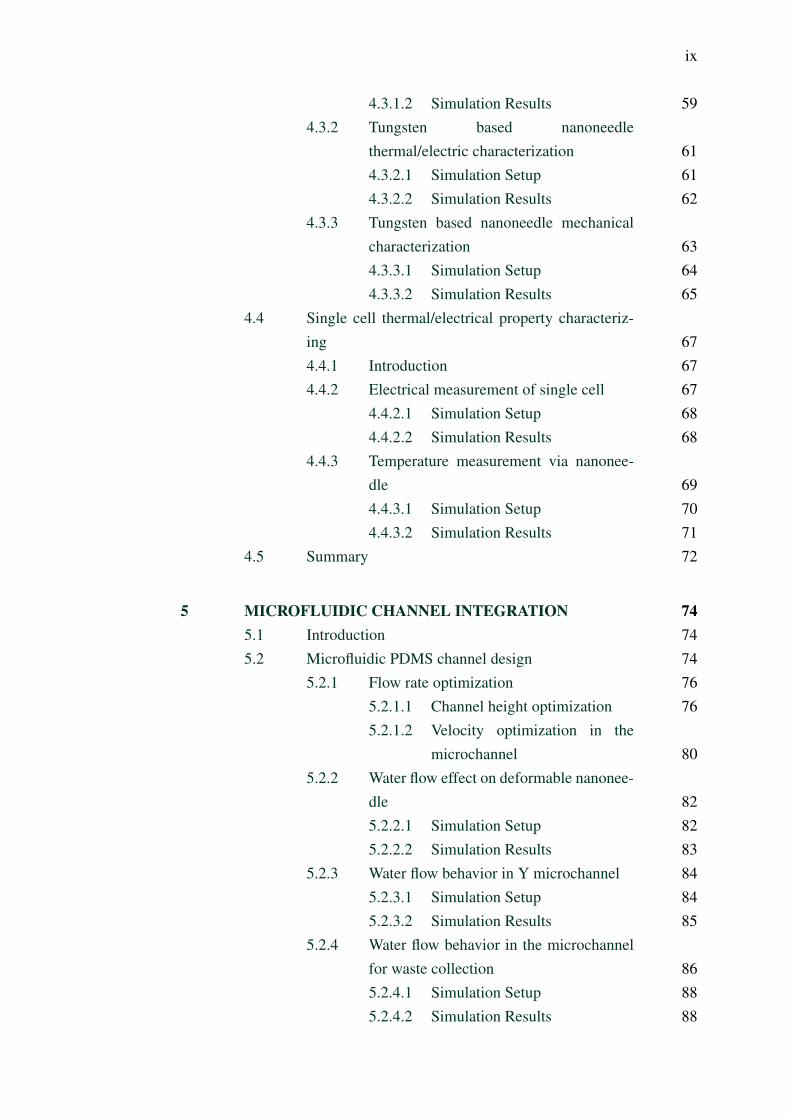
5 MICROFLUIDIC CHANNEL INTEGRATION 745.1 Introduction 745.2 Microfluidic PDMS channel design 74
5.2.1 Flow rate optimization 765.2.1.1 Channel height optimization 765.2.1.2 Velocity optimization in the
microchannel 805.2.2 Water flow effect on deformable nanonee-
dle 825.2.2.1 Simulation Setup 825.2.2.2 Simulation Results 83
5.2.3 Water flow behavior in Y microchannel 845.2.3.1 Simulation Setup 845.2.3.2 Simulation Results 85
5.2.4 Water flow behavior in the microchannelfor waste collection 865.2.4.1 Simulation Setup 885.2.4.2 Simulation Results 88

x
5.3 Summary 90
6 CONCLUSION 916.1 Conclusion 916.2 Research contributions 926.3 Future Recommendations 92
REFERENCES 93
xi
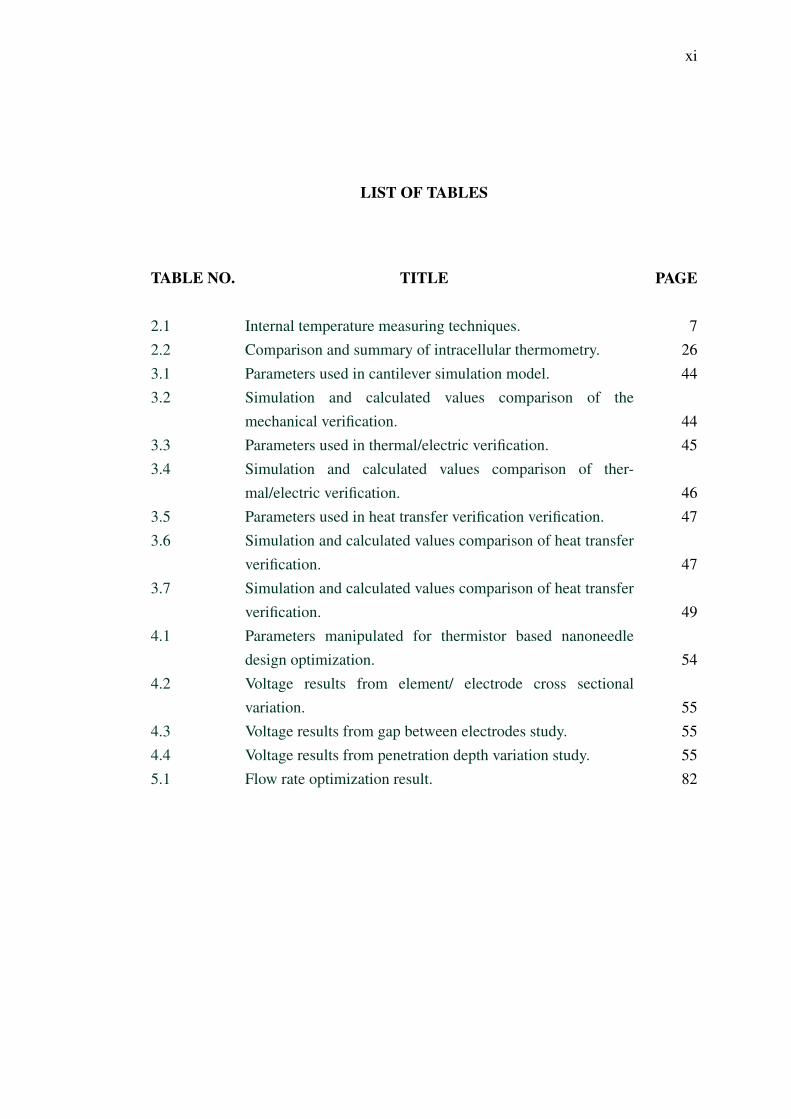
LIST OF TABLES
TABLE NO. TITLE PAGE
2.1 Internal temperature measuring techniques. 72.2 Comparison and summary of intracellular thermometry. 263.1 Parameters used in cantilever simulation model. 443.2 Simulation and calculated values comparison of the
mechanical verification. 443.3 Parameters used in thermal/electric verification. 453.4 Simulation and calculated values comparison of ther-
mal/electric verification. 463.5 Parameters used in heat transfer verification verification. 473.6 Simulation and calculated values comparison of heat transfer
verification. 473.7 Simulation and calculated values comparison of heat transfer
verification. 494.1 Parameters manipulated for thermistor based nanoneedle
design optimization. 544.2 Voltage results from element/ electrode cross sectional
variation. 554.3 Voltage results from gap between electrodes study. 554.4 Voltage results from penetration depth variation study. 555.1 Flow rate optimization result. 82
xii
LIST OF FIGURES
FIGURE NO. TITLE PAGE
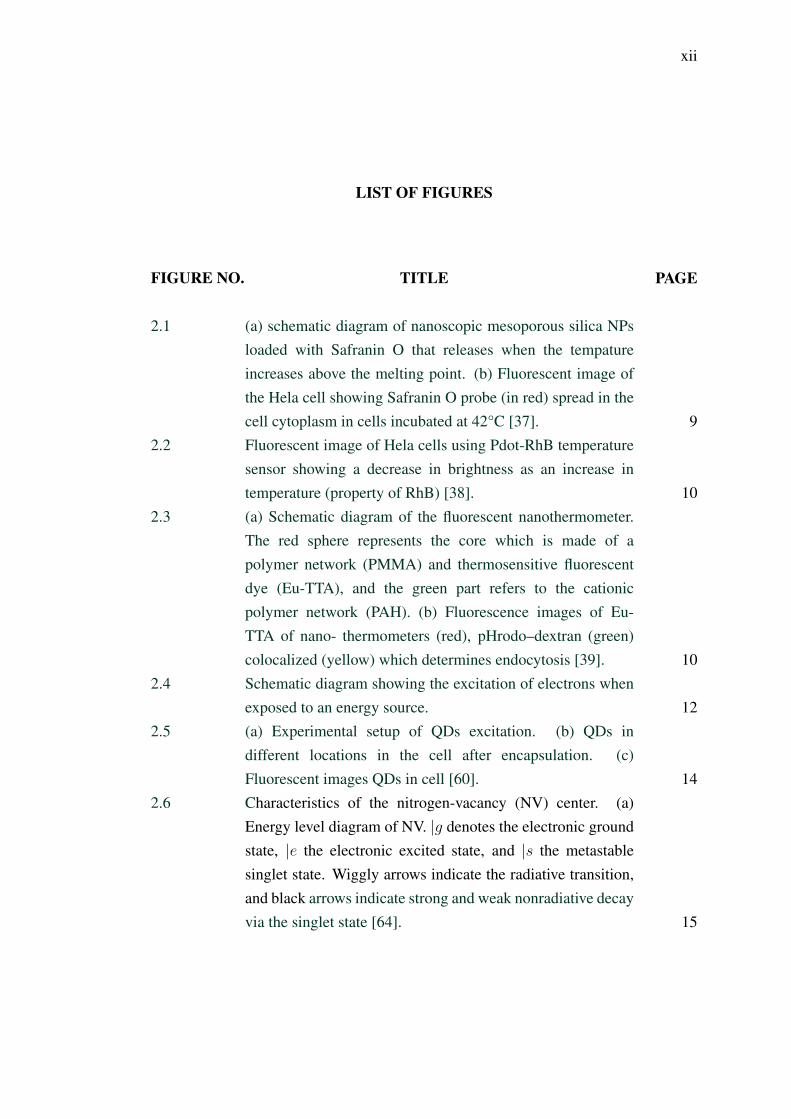
2.1 (a) schematic diagram of nanoscopic mesoporous silica NPsloaded with Safranin O that releases when the tempatureincreases above the melting point. (b) Fluorescent image ofthe Hela cell showing Safranin O probe (in red) spread in thecell cytoplasm in cells incubated at 42°C [37]. 9
2.2 Fluorescent image of Hela cells using Pdot-RhB temperaturesensor showing a decrease in brightness as an increase intemperature (property of RhB) [38]. 10
2.3 (a) Schematic diagram of the fluorescent nanothermometer.The red sphere represents the core which is made of apolymer network (PMMA) and thermosensitive fluorescentdye (Eu-TTA), and the green part refers to the cationicpolymer network (PAH). (b) Fluorescence images of Eu-TTA of nano- thermometers (red), pHrodo–dextran (green)colocalized (yellow) which determines endocytosis [39]. 10
2.4 Schematic diagram showing the excitation of electrons whenexposed to an energy source. 12
2.5 (a) Experimental setup of QDs excitation. (b) QDs indifferent locations in the cell after encapsulation. (c)Fluorescent images QDs in cell [60]. 14
2.6 Characteristics of the nitrogen-vacancy (NV) center. (a)Energy level diagram of NV. |g denotes the electronic groundstate, |e the electronic excited state, and |s the metastablesinglet state. Wiggly arrows indicate the radiative transition,and black arrows indicate strong and weak nonradiative decayvia the singlet state [64]. 15
xiii
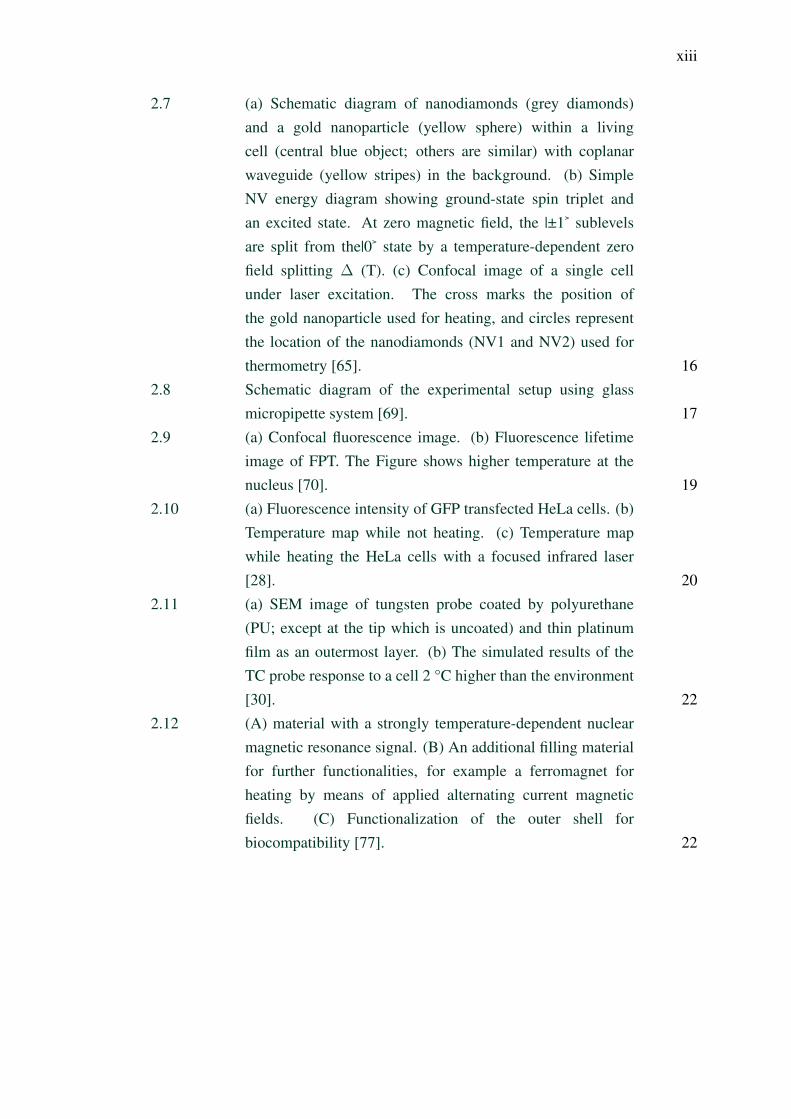
2.7 (a) Schematic diagram of nanodiamonds (grey diamonds)and a gold nanoparticle (yellow sphere) within a livingcell (central blue object; others are similar) with coplanarwaveguide (yellow stripes) in the background. (b) SimpleNV energy diagram showing ground-state spin triplet andan excited state. At zero magnetic field, the |±1¿ sublevelsare split from the|0¿ state by a temperature-dependent zerofield splitting ∆ (T). (c) Confocal image of a single cellunder laser excitation. The cross marks the position ofthe gold nanoparticle used for heating, and circles representthe location of the nanodiamonds (NV1 and NV2) used forthermometry [65]. 16
2.8 Schematic diagram of the experimental setup using glassmicropipette system [69]. 17
2.9 (a) Confocal fluorescence image. (b) Fluorescence lifetimeimage of FPT. The Figure shows higher temperature at thenucleus [70]. 19
2.10 (a) Fluorescence intensity of GFP transfected HeLa cells. (b)Temperature map while not heating. (c) Temperature mapwhile heating the HeLa cells with a focused infrared laser[28]. 20
2.11 (a) SEM image of tungsten probe coated by polyurethane(PU; except at the tip which is uncoated) and thin platinumfilm as an outermost layer. (b) The simulated results of theTC probe response to a cell 2 °C higher than the environment[30]. 22
2.12 (A) material with a strongly temperature-dependent nuclearmagnetic resonance signal. (B) An additional filling materialfor further functionalities, for example a ferromagnet forheating by means of applied alternating current magneticfields. (C) Functionalization of the outer shell forbiocompatibility [77]. 22

xiv
2.13 (a) Schematic of the resonant thermal sensor for heatdetection of living cells in liquid. (b) A BFC attached to thesample stage for measurement. (c) Thermal responses of aBFC over time. (i) Temperature changes in non-stimulatedBFC; heat is generated from the cell in a series of pulses. (ii)Temperature changes in a NE-stimulated BFC; constant heatproduction over 23 min. (iii) Temperature changes in inactivecell; no temperature change is observed [78]. 23
2.14 Photo-thermal heating. The cell was heated by a 100-mW CW laser via a multimode fiber and the intracellulartemperature was monitored by a voice-coil PAM system inreal time [79]. 24
2.15 (a-c) Show the cell images during photo-thermal heating attime 0 s, 320s, and 400s [79]. 24
2.16 Expansion of gallium inside a carbon nanotube withincreasing temperature. a–c, changing level of the galliumat 58 °C (a), 490 °C (b) and 45 °C(c); scale bar, 75 nm. d,Height of the gallium plotted against temperature, measuredin steps of 30–50 °C [80]. 28
2.17 (a) Schematic diagram of the thermal probes with IT0 filmas electrodes. (b) Temperature of resistance of CNT thermalprobes. The resistances of the CNT thermal probes weremeasured in steps of 3-6 °C [83] 28
2.18 Yeast cell structure. 302.19 S.cerevisiae cell structure modeled. 312.20 (a) Schematic diagram of a tether-free SIMBAS chip that
separates whole-blood samples and detecting the presence ofbiotin, or vitamin B7. (b) Image of the actual SIMBAS chip[100]. 31
2.21 Example of a multiprocessing microfluidic system [104]. 323.1 Project flow chart. 343.2 Flow of a finite element problem solving process. 353.3 Schematic diagram of the systems principle, the flow of water
manipulates the cell movement towards the needle. 363.4 Microfluidic system design, plate, sensor and microfluidic
channel of the proposed system. 373.5 Proposed nanoneedle/microfluidic measurement setup. 38
xv
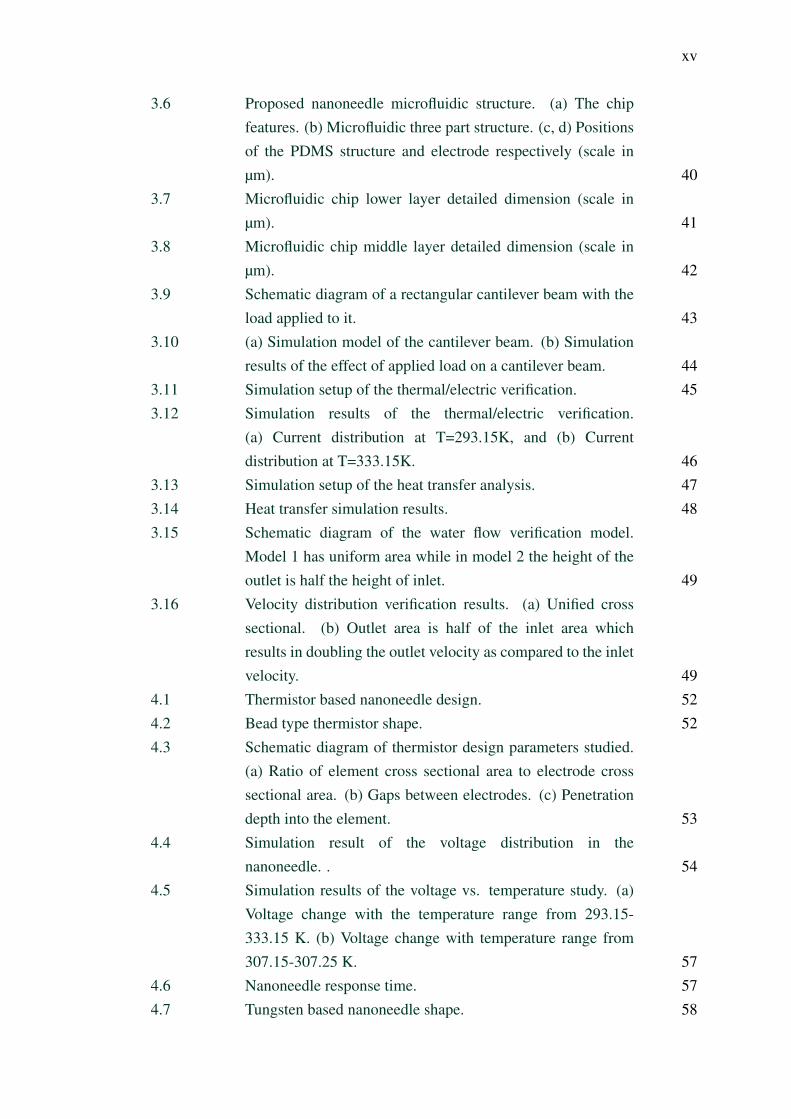
3.6 Proposed nanoneedle microfluidic structure. (a) The chipfeatures. (b) Microfluidic three part structure. (c, d) Positionsof the PDMS structure and electrode respectively (scale inµm). 40
3.7 Microfluidic chip lower layer detailed dimension (scale inµm). 41
3.8 Microfluidic chip middle layer detailed dimension (scale inµm). 42
3.9 Schematic diagram of a rectangular cantilever beam with theload applied to it. 43
3.10 (a) Simulation model of the cantilever beam. (b) Simulationresults of the effect of applied load on a cantilever beam. 44
3.11 Simulation setup of the thermal/electric verification. 453.12 Simulation results of the thermal/electric verification.
(a) Current distribution at T=293.15K, and (b) Currentdistribution at T=333.15K. 46
3.13 Simulation setup of the heat transfer analysis. 473.14 Heat transfer simulation results. 483.15 Schematic diagram of the water flow verification model.
Model 1 has uniform area while in model 2 the height of theoutlet is half the height of inlet. 49
3.16 Velocity distribution verification results. (a) Unified crosssectional. (b) Outlet area is half of the inlet area whichresults in doubling the outlet velocity as compared to the inletvelocity. 49
4.1 Thermistor based nanoneedle design. 524.2 Bead type thermistor shape. 524.3 Schematic diagram of thermistor design parameters studied.
(a) Ratio of element cross sectional area to electrode crosssectional area. (b) Gaps between electrodes. (c) Penetrationdepth into the element. 53
4.4 Simulation result of the voltage distribution in thenanoneedle. . 54
4.5 Simulation results of the voltage vs. temperature study. (a)Voltage change with the temperature range from 293.15-333.15 K. (b) Voltage change with temperature range from307.15-307.25 K. 57
4.6 Nanoneedle response time. 574.7 Tungsten based nanoneedle shape. 58
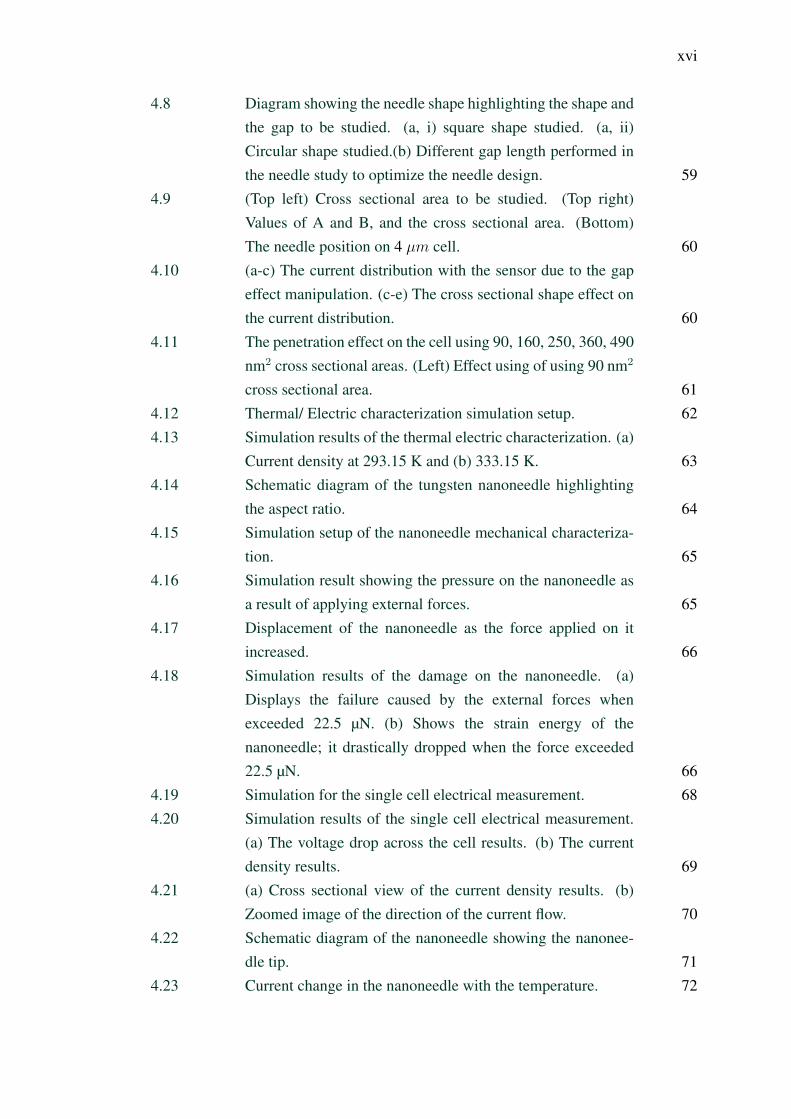
xvi
4.8 Diagram showing the needle shape highlighting the shape andthe gap to be studied. (a, i) square shape studied. (a, ii)Circular shape studied.(b) Different gap length performed inthe needle study to optimize the needle design. 59
4.9 (Top left) Cross sectional area to be studied. (Top right)Values of A and B, and the cross sectional area. (Bottom)The needle position on 4 µm cell. 60
4.10 (a-c) The current distribution with the sensor due to the gapeffect manipulation. (c-e) The cross sectional shape effect onthe current distribution. 60
4.11 The penetration effect on the cell using 90, 160, 250, 360, 490nm2 cross sectional areas. (Left) Effect using of using 90 nm2
cross sectional area. 614.12 Thermal/ Electric characterization simulation setup. 624.13 Simulation results of the thermal electric characterization. (a)
Current density at 293.15 K and (b) 333.15 K. 634.14 Schematic diagram of the tungsten nanoneedle highlighting
the aspect ratio. 644.15 Simulation setup of the nanoneedle mechanical characteriza-
tion. 654.16 Simulation result showing the pressure on the nanoneedle as
a result of applying external forces. 654.17 Displacement of the nanoneedle as the force applied on it
increased. 664.18 Simulation results of the damage on the nanoneedle. (a)
Displays the failure caused by the external forces whenexceeded 22.5 µN. (b) Shows the strain energy of thenanoneedle; it drastically dropped when the force exceeded22.5 µN. 66
4.19 Simulation for the single cell electrical measurement. 684.20 Simulation results of the single cell electrical measurement.
(a) The voltage drop across the cell results. (b) The currentdensity results. 69
4.21 (a) Cross sectional view of the current density results. (b)Zoomed image of the direction of the current flow. 70
4.22 Schematic diagram of the nanoneedle showing the nanonee-dle tip. 71
4.23 Current change in the nanoneedle with the temperature. 72
xvii
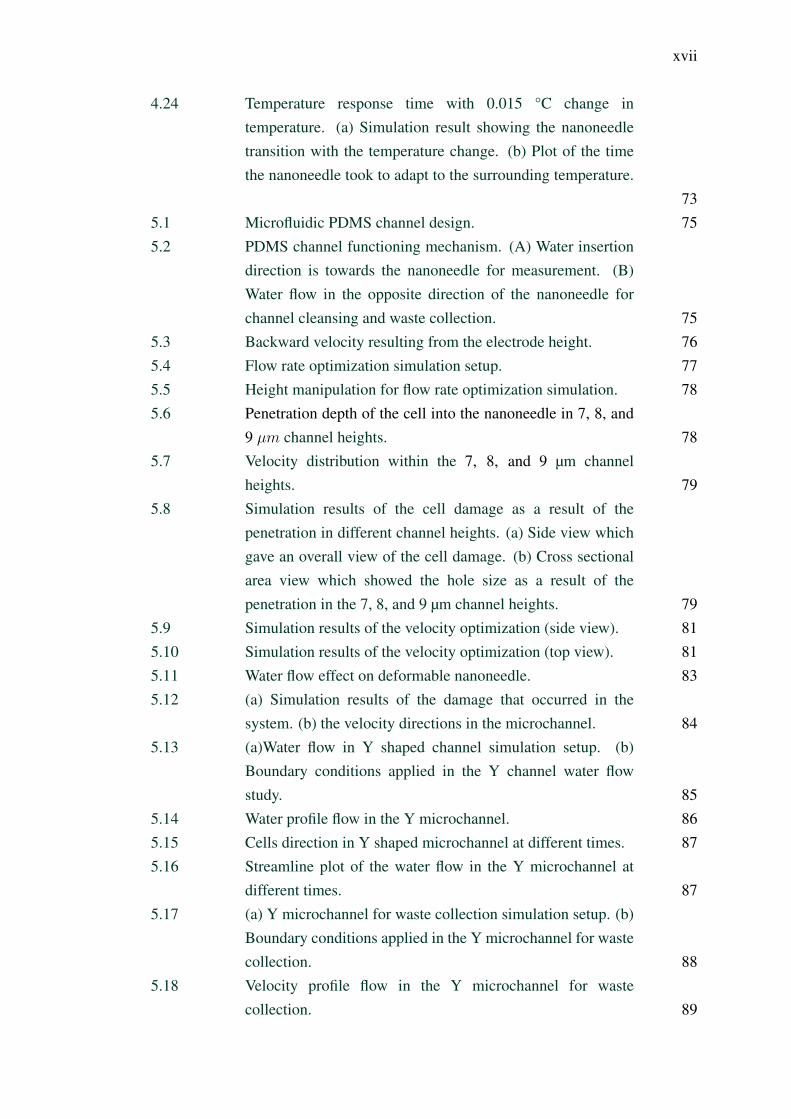
4.24 Temperature response time with 0.015 °C change intemperature. (a) Simulation result showing the nanoneedletransition with the temperature change. (b) Plot of the timethe nanoneedle took to adapt to the surrounding temperature.
735.1 Microfluidic PDMS channel design. 755.2 PDMS channel functioning mechanism. (A) Water insertion
direction is towards the nanoneedle for measurement. (B)Water flow in the opposite direction of the nanoneedle forchannel cleansing and waste collection. 75
5.3 Backward velocity resulting from the electrode height. 765.4 Flow rate optimization simulation setup. 775.5 Height manipulation for flow rate optimization simulation. 785.6 Penetration depth of the cell into the nanoneedle in 7, 8, and
9 µm channel heights. 785.7 Velocity distribution within the 7, 8, and 9 µm channel
heights. 795.8 Simulation results of the cell damage as a result of the
penetration in different channel heights. (a) Side view whichgave an overall view of the cell damage. (b) Cross sectionalarea view which showed the hole size as a result of thepenetration in the 7, 8, and 9 µm channel heights. 79
5.9 Simulation results of the velocity optimization (side view). 815.10 Simulation results of the velocity optimization (top view). 815.11 Water flow effect on deformable nanoneedle. 835.12 (a) Simulation results of the damage that occurred in the
system. (b) the velocity directions in the microchannel. 845.13 (a)Water flow in Y shaped channel simulation setup. (b)
Boundary conditions applied in the Y channel water flowstudy. 85
5.14 Water profile flow in the Y microchannel. 865.15 Cells direction in Y shaped microchannel at different times. 875.16 Streamline plot of the water flow in the Y microchannel at
different times. 875.17 (a) Y microchannel for waste collection simulation setup. (b)
Boundary conditions applied in the Y microchannel for wastecollection. 88
5.18 Velocity profile flow in the Y microchannel for wastecollection. 89

xviii
5.19 Waste collection simulation results showing the cell directionand the velocity streamline. 89
xix
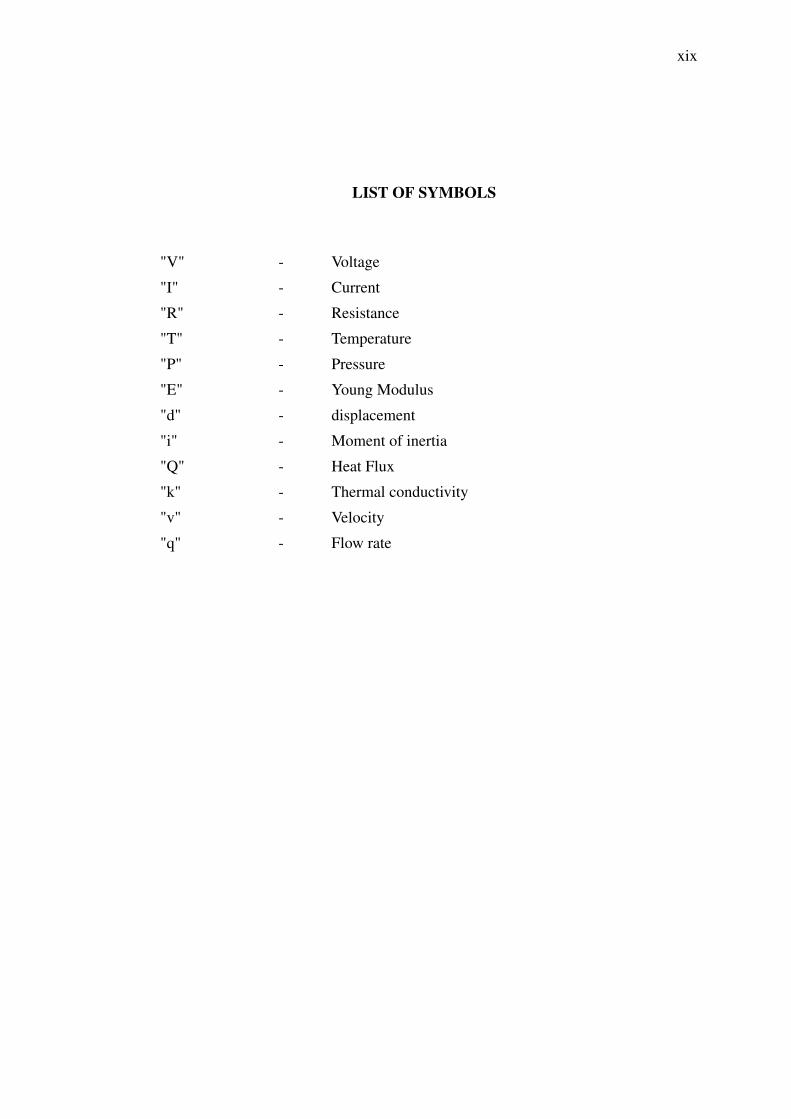
LIST OF SYMBOLS
"V" - Voltage
"I" - Current
"R" - Resistance
"T" - Temperature
"P" - Pressure
"E" - Young Modulus
"d" - displacement
"i" - Moment of inertia
"Q" - Heat Flux
"k" - Thermal conductivity
"v" - Velocity
"q" - Flow rate

xx
LIST OF ABBREVIATIONS
Nps - Nano Particles
PEG - Polyethyleneglycol
QDs - Quantum dots
Pdots - Polymer dots
RhB - Rhodamine B
PMMA - Polymethylmethacrylate
PAH - Polyallylaminehydrochloride
SPE - Single Photon Excitation
TPE - Two Photon Excitation
QGY - Human Hepatocellular Carcinoma
KB - Human Nasopharynx Carcinoma
OS - OrganoSilica
PEG - Polyethylene glycol
Cr - Color difference of red
Cb - Color difference of blue
Eu-TTA - Europium (III) thenoyltrifluoro-acetonate
CHO - Chinese hamster ovary
ACh - Acetylcholine
FPT - Fluorescent Polymeric Thermometer
MBs - Molecular Beacons
GFP - Green Fluorescent Proteins
FPA - Fluorescence Polarization Anisotropy
NV - Nitrogen Vacancy
MWCNTS - Multi Walled Carbon Nanotubes
PU - Polyurethane
BFCs - Brown fat cells
NE - Norepinephrine
NMR - Nuclear Magnetic Resonance
CNT - Carbon nanotube
NTC - Negative Temperature Coefficient

xxi
TCR - Temperature Coefficient of Resistance
LOC - Lab on a chip
MEMS - Microelectromechanical Systems
xxii
LIST OF APPENDICES
APPENDIX TITLE PAGE
A List of Publications 103
B Microfluidic chip dimensions 105
CHAPTER 1
INTRODUCTION
1.1 Research background
Traditional microbiological studies have been done at a population level inwhich information on how cells interact with each other, react to external stimuliand undergo complex processes such as gene expression was always obtained frompopulation study data [1]. However, such information does not consider the identityand the importance of individual cells, which may lead to low level of precisionand accuracy in the resulted data. The recent emerging techniques that have highersensitivity and the need for cellular heterogeneity has driven research towards focusingon developing techniques that support the study of individual cells. Single cell analysishas become an important field of research that allows the differentiation between cellsin living organisms and the ability to relate them to different biological functions anddisease progression. Different cell properties such as electrical [2-4], mechanical [5-7]and thermal [8-10] are currently being studied for individual cell profiling that can helpin the identification of rare cell types and identify the health condition of specific cellsthat has the potential for early disease diagnosis applications.
1.2 Temperate effect on cells and natural systems
Temperature is an important physical property of a matter that can determinethe internal energy contained within a system; it can be defined as the measurementof the average kinetic energy of molecules in an object or system. It plays animportant role governing many physical and chemical processes humans and plantsundergo throughout their lifecycles [11-14]. For instance, in plants when increasingthe temperature, a noticeable growth is observed in specific areas as compared to therest of the plant such as, elongation in stem, growth in the leaf area, and the plant
2
biomass [15]. In humans, the environmental temperature shows a direct relationshipwith the rate of food consumption by humans. During the summer the rate of foodintake is considered lower compared to days when the weather is cold. This is due tothe difficulties the body undergoes when trying to lose heat to the surroundings. Onthe other hand, in winter the body needs extra heat to protect itself against hypothermia[16].
A single cell level, temperature shows the ability to differentiate cells with anabnormality i.e. cancerous cells and cells that are healthy. The human body is made upof billions of cells that grow and divide to produce more cells to keep the body healthy.However, sometimes cells become sick when the genetic material (DNA) is damagedor changed and cause mutations that affect normal cell growth and division. Thisprocess of mutation is accompanied by extraordinary heat production, which makesthe internal cell temperature higher compared to the healthy cells. These mutatedcells tend to become dangerous after several divisions, usually at that late stages whenpatients seek medical attention, but in most cases it is too late to be cured. Being ableto measure the temperature of a cell at early stages of division can help in the earlydisease detection and probably save many lives [17].
1.3 Problem statement
Many attempts have been carried out in order to determine the internaltemperature of single cells. Some of these techniques rely on materials that use thefluorescence properties as the determining factor with the change of the temperature.These sensors tend to show a high level of sensitivity. However, several factors stilldiscourage their use, for instance, photo-bleaching in which the fluorescence is lostthrough irreversible alteration of the sensor’s molecular structure by photo-damage,enzymatic degradation, and chemical damage [18], the insertion of material into thecell and the movement of material inside cell which can damage the cell [19], and thepossible of toxicity due to the material degradation [20, 21].
There are few other attempts to measure the internal temperature that are notbased on the luminescence properties [22]. However, such methods depend on theuse of bulky operating systems that need highly trained operators and a constrainedexperimental environment. These systems are with no doubt important because of theirnovelty, but their significance can only be evident in the early stages of conducting a
3
research. These systems require upgrading and further improvements otherwise canbe very time consuming, impractical and costly. Also the need for highly skilledoperators makes them inefficient and not user-friendly. Besides, some of these systemsare restricted to specific cell types which limit their implementation diversity.
The need to develop a system that has the ability to improve single cellstudies is critical in the upcoming years of research by being portable, easy to use,inexpensive, and produces quantitative results in a prompt manner that does not requireuser interpretation.
1.4 Significance of the project
This project focuses on developing a nano-thermal sensor microfluidic systemthat can measure the internal temperature of a variety of single cells efficiently and ina more manageable procedure. The use of microfluidic devices facilitate sequentialsample pre-treatment and increase sample throughput through parallel analysis. Theyalso have added the advantages of improved portability due to miniaturization, reducedsample and reagent consumption, and accelerated speed of reaction and analysis [23,24].
By knowing the temperature of a single cell, several important advancementsin the fundamentals of cell biology and its cellular activities can be investigated. Heatgeneration inside cells has been used as one of the measures to understand the functionof all constituent parts of living organisms and, ultimately, understand the chemistryof life.
Integrating a nano-thermal sensor into a microfluidic chip can facilitate theresearch studies and allow the researchers to carry out experiments in a moreconvenient way without the need of using bulky equipment. In addition, this systemhas the potential to be used for many other applications, for instance, early diseasediagnoses, drug delivery, and many others. It will help produce a device that hasmultiple implementations and high reproducibility in a short time.
4
1.5 Objectives of the project
The main objective of this project is to develop an integrated nanoneedle-microfluidic system for measuring single cell temperature. The sub objectives are asfollows:
• To design and optimize a thermal nano-sensor for single cell’s internaltemperature measurement.
• To integrate the nano-sensor with a microfluidic system.
• To measure the internal temperature of a single cell using the integrated thermal-microfluidic system.
1.6 Scope of the project
The project is simulation based study that is mainly about designing andoptimizing a thermal nano-sensor that measures the internal temperature of singlecells. It is divided into three main parts: firstly, the sensor design and optimizationwhich covers the shape, dimensions and structure of the sensor. It also includes theelectrical and mechanical characterizations of the sensor. The second part is aboutthe electrical characterization of a cell and the nanoneedle ability to measurement thetemperature. The third part covers the integrating of the sensor into a microfluidicchannel which study the water flow direction, water flow rate in the proposed channeldesign. The research study was done using a finite element analysis and designingsoftwares, mainly ABAQUS and Solidworks, and the cell model used was based onSaccharomy cerevisiae (2.5.2).
1.7 Organization of the thesis
The thesis is divided into 6 chapters. First chapter is an introduction of theproject, explaining the problems and motivations that encouraged to conduct thisresearch, objectives and the scope of the research. The second chapter is a thoroughdiscussion of the current techniques used in the single cell intracellular temperaturemeasurements with a table that summarize the advantages and disadvantages ofthe conventional techniques, and theoritical studies explaining different sensing
5
mechanisms. The third chapter is a discussion on the methodology undertakenduring the research with a detailed explanation on the system concept and thereasons for selecting of each part. The forth chapter is the nanoneedle designand characterization which covers topics in the thermal/electrical and mechanicalcharacterization of the nanoneedle and cell temperature measurement. The fifthchapter is the microfluidic channel integration discussing the parameters needed in theintegration of the nanoneedle microfluidic system. The last chapter is the conclusionand future recommendations for this research.
REFERENCES
[1] B. F. Brehm-Stecher and E. A. Johnson, “Single-cell microbiology: tools,
technologies, and applications,” Microbiol. Mol. Biol. Rev., vol. 68, no. 3, pp.
538–559, 2004.
[2] M. R. Ahmad, M. Nakajima, M. Kojima, S. Kojima, M. Homma, and T.
Fukuda, “Instantaneous and Quantitative Single Cells Viability Determination
Using Dual Nanoprobe Inside ESEM,” Nanotechnology, IEEE Trans., vol. 11,
no. 2, pp. 298–306, 2012.
[3] J. Chen, Y. Zheng, Q. Tan, Y. L. Zhang, J. Li, W. R. Geddie, M. A. S. Jewett,
and Y. Sun, “A microfluidic device for simultaneous electrical and
mechanical measurements on single cells,” Biomicrofluidics, vol. 5, no. 1, p.
14113, 2011.
[4] J. L. Sebastian Franco, A. Sanchis Otero, J. R. Madronero, and S. M. San
Martin, “Dielectric Characterization of the Yeast Cell Budding Cycle,” Prog.
Electromagn. Res., vol. 134, pp. 1–22, 2013.
[5] M. R. Ahmad, M. Nakajima, S. Kojima, M. Homma, and T. Fukuda, “In situ
single cell mechanics characterization of yeast cells using nanoneedles inside
environmental SEM,” Nanotechnology, IEEE Trans., vol. 7, no. 5, pp. 607–
616, 2008.
[6] M. R. Ahmad, M. Nakajima, M. Kojima, S. Kojima, M. Homma, and T.
Fukuda, “Nanofork for Single Cells Adhesion Measurement via ESEM-
Nanomanipulator System,” in NanoBioscience, IEEE Transactions, 2012, vol.
11, no. 1, pp. 70–78.
[7] E.-Y. Kwon, Y.-T. Kim, and D.-E. Kim, “Investigation of penetration force of
living cell using an atomic force microscope,” J. Mech. Sci. Technol., vol. 23,
no. 7, pp. 1932–1938, 2009.
[8] D. Evanko, “Sensors and probes: A thermometer for cells,” Nat. Methods, vol.
9, no. 4, pp. 328–328, Mar. 2012.
[9] K. M. Mccabe and M. Hernandez, “Molecular Thermometry,” NIH Public
Access, vol. 67, no. 5, pp. 469–475, 2011.
94
[10] S. Li, K. Zhang, J.-M. Yang, L. Lin, and H. Yang, “Single quantum dots as
local temperature markers,” Nano Lett., vol. 7, no. 10, pp. 3102–5, Oct. 2007.
[11] A. Bahat, I. Tur-Kaspa, A. Gakamsky, L. C. Giojalas, H. Breitbart, and M.
Eisenbach, “Thermotaxis of mammalian sperm cells: a potential navigation
mechanism in the female genital tract,” Nat. Med., vol. 9, no. 2, pp. 149–150,
2003.
[12] R. S. Seymour, “Biophysics and physiology of temperature regulation in
thermogenic flowers.,” Biosci. Rep., vol. 21, no. 2, pp. 223–36, Apr. 2001.
[13] B. B. Lowell and B. M. Spiegelman, “Towards a molecular understanding of
adaptive thermogenesis.,” Nature, vol. 404, no. 6778, pp. 652–60, Apr. 2000.
[14] D. a Warner and R. Shine, “The adaptive significance of temperature-
dependent sex determination in a reptile.,” Nature, vol. 451, no. 7178, pp.
566–8, Jan. 2008.
[15] D. Patel and K. A. Franklin, “Temperature-regulation of plant architecture,”
Plant Signal Behav, vol. 4, no. 7, pp. 577–579, 2009.
[16] J. R. Brobeck, “Food intake as a mechanism of temperature regulation,” Yale
J. Biol. Med., vol. 20, no. 6, p. 545, 1948.
[17] B. Lewin and G. Dover, Genes v, vol. 299. Oxford University Press Oxford,
1994.
[18] K.-H. Lee, “Quantum dots: a quantum jump for molecular imaging?,” J. Nucl.
Med., vol. 48, no. 9, pp. 1408–10, Sep. 2007.
[19] J. Weng and J. Ren, “Luminescent quantum dots: a very attractive and
promising tool in biomedicine,” Curr. Med. Chem., vol. 13, no. 8, pp. 897–
909, 2006.
[20] R. Hardman, “A toxicologic review of quantum dots: toxicity depends on
physicochemical and environmental factors,” Environ. Health Perspect., pp.
165–172, 2006.
[21] W. K. Leutwyler, S. L. Bürgi, H. Burgl, and others, “Semiconductor clusters,
nanocrystals, and quantum dots,” Science (80-. )., vol. 271, no. 5251, pp. 933–
937, 1996.
[22] J. Stenson and P. Hartley, “Determining the mechanical properties of yeast
cell walls,” Biotechnol. …, vol. 27, no. 2, pp. 505–12, 2011.
[23] J. Lee, S. a Soper, and K. K. Murray, “Microfluidic chips for mass
spectrometry-based proteomics.,” J. Mass Spectrom., vol. 44, no. 5, pp. 579–
93, May 2009.
95
[24] J. Lee, S. a Soper, and K. K. Murray, “Development of an efficient on-chip
digestion system for protein analysis using MALDI-TOF MS.,” Analyst, vol.
134, no. 12, pp. 2426–33, Dec. 2009.
[25] T. M. Tritt, “Thermal conductivity,” in Theory, properties and applications.
Kluwer Academic/Plenum, New York/Boston/Dirdrecht/London/Moscow,
Springer, 2004.
[26] F. Vera, R. Rivera, and C. Núñez, “Burning a Candle in a Vessel, a Simple
Experiment with a Long History,” Sci. Educ., vol. 20, no. 9, pp. 881–893,
Feb. 2011.
[27] J. M. Adams, Electrical Safety: A Guide to the Causes and Prevention of
Electrical Hazards. Institution of Electrical Engineers, 1994.
[28] J. S. Donner, S. a Thompson, M. P. Kreuzer, G. Baffou, and R. Quidant,
“Mapping intracellular temperature using green fluorescent protein,” Nano
Lett., vol. 12, no. 4, pp. 2107–11, Apr. 2012.
[29] J. Davda and V. Labhasetwar, “Characterization of nanoparticle uptake by
endothelial cells.,” Int. J. Pharm., vol. 233, no. 1–2, pp. 51–9, Feb. 2002.
[30] C. Wang, R. Xu, W. Tian, X. Jiang, Z. Cui, M. Wang, H. Sun, K. Fang, and
N. Gu, “Determining intracellular temperature at single-cell level by a novel
thermocouple method,” Cell Res., vol. 21, no. 10, pp. 1517–9, Oct. 2011.
[31] C. D. S. Brites, P. P. Lima, N. J. O. Silva, A. Millán, V. S. Amaral, F. Palacio,
and L. D. Carlos, “Thermometry at the nanoscale,” Nanoscale, vol. 4, no. 16,
pp. 4799–829, Aug. 2012.
[32] S. Wang, S. Westcott, and W. Chen, “Nanoparticle Luminescence
Thermometry,” J. Phys. Chem. B, vol. 106, no. 43, pp. 11203–11209, Oct.
2002.
[33] J. R. Lakowicz and C. D. Geddes, Topics in fluorescence spectroscopy, vol. 1.
Springer, 1991.
[34] M. J. Ruedas-Rama, J. D. Walters, A. Orte, and E. A. H. Hall, “Fluorescent
nanoparticles for intracellular sensing: a review,” Anal. Chim. Acta, vol. 751,
pp. 1–23, 2012.
[35] J. Lee and N. A. Kotov, “Thermometer design at the nanoscale,” Nanotoday,
vol. 2, no. 1, pp. 48–51, 2007.
[36] J. Lee, A. O. Govorov, and N. a. Kotov, “Nanoparticle Assemblies with
Molecular Springs: A Nanoscale Thermometer,” Angew. Chemie, vol. 117,
no. 45, pp. 7605–7608, Nov. 2005.
[37] E. Aznar, L. Mondragón, J. V Ros-Lis, F. Sancenón, M. D. Marcos, R.
Martínez-Máñez, J. Soto, E. Pérez-Payá, and P. Amorós, “Finely tuned
96
temperature-controlled cargo release using paraffin-capped mesoporous silica
nanoparticles.,” Angew. Chem. Int. Ed. Engl., vol. 50, no. 47, pp. 11172–5,
Nov. 2011.
[38] F. Ye, C. Wu, Y. Jin, Y.-H. Chan, X. Zhang, and D. T. Chiu, “Ratiometric
temperature sensing with semiconducting polymer dots.,” J. Am. Chem. Soc.,
vol. 133, no. 21, pp. 8146–8149, 2011.
[39] K. Oyama, M. Takabayashi, Y. Takei, S. Arai, S. Takeoka, S. Ishiwata, and
M. Suzuki, “Walking nanothermometers: spatiotemporal temperature
measurement of transported acidic organelles in single living cells.,” Lab
Chip, vol. 12, no. 9, pp. 1591–3, May 2012.
[40] D. Jaque, L. M. Maestro, E. Escudero, E. M. Rodríguez, J. A. Capobianco, F.
Vetrone, A. Juarranz De La Fuente, F. Sanz-Rodríguez, M. C. Iglesias-De La
Cruz, C. Jacinto, and others, “Fluorescent nano-particles for multi-photon
thermal sensing,” J. Lumin., vol. 133, pp. 249–253, 2013.
[41] R. Sharma and C. J. Chen, “Newer nanoparticles in hyperthermia treatment
and thermometry,” J. nanoparticle Res., vol. 11, no. 3, pp. 671–689, 2009.
[42] I. H. El-Sayed, X. Huang, and M. A. El-Sayed, “Selective laser photo-thermal
therapy of epithelial carcinoma using anti-EGFR antibody conjugated gold
nanoparticles,” Cancer Lett., vol. 239, no. 1, pp. 129–135, 2006.
[43] S. Eustis and M. a el-Sayed, “Why gold nanoparticles are more precious than
pretty gold: noble metal surface plasmon resonance and its enhancement of
the radiative and nonradiative properties of nanocrystals of different shapes.,”
Chem. Soc. Rev., vol. 35, no. 3, pp. 209–17, Mar. 2006.
[44] S. Link and M. A. El-Sayed, “Optical properties and ultrafast dynamics of
metallic nanocrystals,” Annu. Rev. Phys. Chem., vol. 54, no. 1, pp. 331–366,
2003.
[45] T. Jamieson, R. Bakhshi, D. Petrova, R. Pocock, M. Imani, and A. M.
Seifalian, “Biological applications of quantum dots,” Biomaterials, vol. 28,
no. 31, pp. 4717–4732, 2007.
[46] C. Hsia, A. Wuttig, and H. Yang, “An accessible approach to preparing water-
soluble Mn2+-doped (CdSSe)ZnS (core)shell nanocrystals for ratiometric
temperature sensing,” ACS Nano, vol. 5, no. 12, pp. 9511–9522, 2011.
[47] Q.-F. Ma, J.-Y. Chen, X. Wu, P.-N. Wang, Y. Yue, and N. Dai,
“Photostability comparison of CdTe and CdSe/CdS/ZnS quantum dots in
living cells under single and two-photon excitations,” J. Lumin., vol. 131, no.
11, pp. 2267–2272, Nov. 2011.
[48] E. J. McLaurin, V. a Vlaskin, and D. R. Gamelin, “Water-soluble dual-
emitting nanocrystals for ratiometric optical thermometry.,” J. Am. Chem.
Soc., vol. 133, no. 38, pp. 14978–80, Sep. 2011.

97
[49] L. M. Maestro, E. M. Rodríguez, F. S. Rodríguez, M. C. I. la Cruz, A.
Juarranz, R. Naccache, F. Vetrone, D. Jaque, J. A. Capobianco, and J. G. Solé,
“CdSe quantum dots for two-photon fluorescence thermal imaging,” Nano
Lett., vol. 10, no. 12, pp. 5109–5115, 2010.
[50] S. Kim, Y. T. Lim, E. G. Soltesz, A. M. De Grand, J. Lee, A. Nakayama, J. A.
Parker, T. Mihaljevic, R. G. Laurence, D. M. Dor, and others, “Near-infrared
fluorescent type II quantum dots for sentinel lymph node mapping,” Nat.
Biotechnol., vol. 22, no. 1, pp. 93–97, 2003.
[51] N. I. Chalmers, R. J. Palmer, L. Du-Thumm, R. Sullivan, W. Shi, and P. E.
Kolenbrander, “Use of quantum dot luminescent probes to achieve single-cell
resolution of human oral bacteria in biofilms.,” Appl. Environ. Microbiol., vol.
73, no. 2, pp. 630–6, Jan. 2007.
[52] W. W. Yu, E. Chang, R. Drezek, and V. L. Colvin, “Water-soluble quantum
dots for biomedical applications,” Biochem. Biophys. Res. Commun., vol. 348,
no. 3, pp. 781–786, 2006.
[53] M. Nakamura, S. Ozaki, M. Abe, T. Matsumoto, and K. Ishimura, “One-pot
synthesis and characterization of dual fluorescent thiol-organosilica
nanoparticles as non-photoblinking quantum dots and their applications for
biological imaging,” J. Mater. Chem., vol. 21, no. 12, p. 4689, 2011.
[54] X. Wang, L.-H. Liu, O. Ramström, and M. Yan, “Engineering nanomaterial
surfaces for biomedical applications.,” Exp. Biol. Med. (Maywood)., vol. 234,
no. 10, pp. 1128–39, Oct. 2009.
[55] E.-Q. Song, Z.-L. Zhang, Q.-Y. Luo, W. Lu, Y.-B. Shi, and D.-W. Pang,
“Tumor cell targeting using folate-conjugated fluorescent quantum dots and
receptor-mediated endocytosis.,” Clin. Chem., vol. 55, no. 5, pp. 955–63, May
2009.
[56] J.-M. Yang, H. Yang, and L. Lin, “Quantum dot nano thermometers reveal
heterogeneous local thermogenesis in living cells,” ACS Nano, vol. 5, no. 6,
pp. 5067–5071, 2011.
[57] Y. Jui-Ming, Y. Haw, and L. Liwei, “Thermogenesis detection of single living
cells via quantum dots,” in Micro Electro Mechanical Systems (MEMS), 2010
IEEE 23rd International Conference on, 2010, pp. 963–966.
[58] L. M. Maestro, C. Jacinto, U. R. Silva, F. Vetrone, J. a Capobianco, D. Jaque,
and J. G. Solé, “CdTe quantum dots as nanothermometers: towards highly
sensitive thermal imaging.,” Small, vol. 7, no. 13, pp. 1774–8, Jul. 2011.
[59] L. M. Maestro, J. E. Ramírez-Hernández, N. Bogdan, J. a. Capobianco, F.
Vetrone, J. G. Solé, and D. Jaque, “Deep tissue bio-imaging using two-photon
excited CdTe fluorescent quantum dots working within the biological
window,” Nanoscale, vol. 4, no. 1, p. 298, 2012.
98
[60] H. Maruyama, K. Tomita, T. Masuda, and F. Arai, “Temperature
measurement by color analysis of fluorescent spectrum using cell
investigation tool impregnated with quantum dot for cell measurement on a
microfluidic chip,” in Intelligent Robots and Systems (IROS), 2011 IEEE/RSJ
International Conference on, 2011, pp. 13–18.
[61] N. Mohan, C.-S. Chen, H.-H. Hsieh, Y.-C. Wu, and H.-C. Chang, “In vivo
imaging and toxicity assessments of fluorescent nanodiamonds in
Caenorhabditis elegans,” Nano Lett., vol. 10, no. 9, pp. 3692–3699, 2010.
[62] C.-C. Fu, H.-Y. Lee, K. Chen, T.-S. Lim, H.-Y. Wu, P.-K. Lin, P.-K. Wei, P.-
H. Tsao, H.-C. Chang, and W. Fann, “Characterization and application of
single fluorescent nanodiamonds as cellular biomarkers,” Proc. Natl. Acad.
Sci., vol. 104, no. 3, pp. 727–732, 2007.
[63] D. M. Toyli, F. Charles, D. J. Christle, V. V Dobrovitski, and D. D.
Awschalom, “Fluorescence thermometry enhanced by the quantum coherence
of single spins in diamond,” Proc. Natl. Acad. Sci., vol. 110, no. 21, pp. 8417–
8421, 2013.
[64] D. M. Toyli, D. J. Christle, A. Alkauskas, B. B. Buckley, C. G. de Walle, and
D. D. Awschalom, “Measurement and control of single nitrogen-vacancy
center spins above 600 K,” Phys. Rev. X, vol. 2, no. 3, p. 31001, 2012.
[65] G. Kucsko, P. C. Maurer, N. Y. Yao, M. Kubo, H. J. Noh, P. K. Lo, H. Park,
and M. D. Lukin, “Nanometre-scale thermometry in a living cell.,” Nature,
vol. 500, no. 7460, pp. 54–8, Aug. 2013.
[66] C. Gota, K. Okabe, T. Funatsu, Y. Harada, and S. Uchiyama, “Hydrophilic
fluorescent nanogel thermometer for intracellular thermometry,” J. Am. Chem.
Soc., vol. 131, no. 8, pp. 2766–2767, 2009.
[67] J. Wang, K. P. Loh, Z. Wang, Y. Yan, Y. Zhong, Q.-H. Xu, and P. C. Ho,
“Fluorescent nanogel of arsenic sulfide nanoclusters,” Angew. Chemie Int.
Ed., vol. 48, no. 34, pp. 6282–6285, 2009.
[68] O. Zohar, M. Ikeda, H. Shinagawa, H. Inoue, H. Nakamura, D. Elbaum, D. L.
Alkon, and T. Yoshioka, “Thermal imaging of receptor-activated heat
production in single cells.,” Biophys. J., vol. 74, no. 1, pp. 82–89, 1998.
[69] M. Suzuki, V. Tseeb, K. Oyama, and S. Ishiwata, “Microscopic detection of
thermogenesis in a single HeLa cell,” Biophys. J., vol. 92, no. 6, pp. L46–L48,
2007.
[70] K. Okabe, N. Inada, C. Gota, Y. Harada, T. Funatsu, and S. Uchiyama,
“Intracellular temperature mapping with a fluorescent polymeric thermometer
and fluorescence lifetime imaging microscopy,” Nat. Commun., vol. 3, p. 705,
Jan. 2012.
99
[71] T. Tsuji, S. Yoshida, A. Yoshida, and S. Uchiyama, “Cationic fluorescent
polymeric thermometers with the ability to enter yeast and mammalian cells
for practical intracellular temperature measurements.,” Anal. Chem., vol. 85,
no. 20, pp. 9815–23, Oct. 2013.
[72] S. Uchiyama, Y. Matsumura, A. P. de Silva, and K. Iwai, “Fluorescent
molecular thermometers based on polymers showing temperature-induced
phase transitions and labeled with polarity-responsive benzofurazans,” Anal.
Chem., vol. 75, no. 21, pp. 5926–5935, 2003.
[73] G. Ke, C. Wang, Y. Ge, N. Zheng, Z. Zhu, and C. J. Yang, “L-DNA
molecular beacon: a safe, stable, and accurate intracellular nano-thermometer
for temperature sensing in living cells.,” J. Am. Chem. Soc., vol. 134, no. 46,
pp. 18908–11, Nov. 2012.
[74] X. Huang, S. Tang, X. Mu, Y. Dai, G. Chen, Z. Zhou, F. Ruan, Z. Yang, and
N. Zheng, “Freestanding palladium nanosheets with plasmonic and catalytic
properties.,” Nat. Nanotechnol., vol. 6, no. 1, pp. 28–32, Jan. 2011.
[75] G. a Maroniche, V. C. Mongelli, V. Alfonso, G. Llauger, O. Taboga, and M.
del Vas, “Development of a novel set of Gateway-compatible vectors for live
imaging in insect cells.,” Insect Mol. Biol., vol. 20, no. 5, pp. 675–85, Oct.
2011.
[76] J. S. Donner, S. A. Thomson, C. Alonso-Ortega, J. Morales, L. G. Rico, S. I.
C. O. Santos, and R. Quidant, “Imaging of Plasmonic Heating in a Living
Organism,” ACS Nano, vol. 7, no. 10, pp. 8666–8672, 2013.
[77] A. Vyalikh, A. U. B. Wolter, S. Hampel, D. Haase, M. Ritschel, A. Leonhardt,
H.-J. Grafe, A. Taylor, K. Krämer, B. Büchner, and R. Klingeler, “A carbon-
wrapped nanoscaled thermometer for temperature control in biological
environments,” Nanomedicine (Lond)., vol. 3, no. 3, pp. 321–7, Jun. 2008.
[78] N. Inomata, M. Toda, M. Sato, A. Ishijima, and T. Ono, “Pico calorimeter for
detection of heat produced in an individual brown fat cell,” Appl. Phys. Lett.,
vol. 100, no. 15, p. 154104, 2012.
[79] L. Gao, L. Wang, C. Li, Y. Liu, H. Ke, C. Zhang, and L. V Wang, “Single-
cell photoacoustic thermometry.,” J. Biomed. Opt., vol. 18, no. 2, p. 26003,
Mar. 2013.
[80] Y. Gao and Y. Bando, “Nanotechnology: Carbon nanothermometer containing
gallium,” Nature, vol. 415, no. 6872, p. 599, 2002.
[81] C.-Y. Wang and L.-J. Chen, “Nanothermometers for Transmission Electron
Microscopy - Fabrication and Characterization,” Eur. J. Inorg. Chem., vol.
2010, no. 27, pp. 4298–4303, Sep. 2010.
[82] M. Saka, Metallic Micro and Nano Materials. Springer Berlin Heidelberg,
2011, pp. 2–4.

100
[83] F. Arai, C. Ng, P. Liu, L. Dong, Y. Imaizumi, K. Maeda, H. Maruyama, A.
Ichikawa, and T. Fukuda, “Ultra-small site temperature sensing by carbon
nanotube thermal probes,” in Nanotechnology, 2004. 4th IEEE Conference,
2004, pp. 146–148.
[84] G. Singh, P. Rice, R. L. Mahajan, and J. R. McIntosh, “Fabrication and
characterization of a carbon nanotube-based nanoknife.,” Nanotechnology,
vol. 20, no. 9, p. 095701, Mar. 2009.
[85] T. G. Claggett, R. W. Worrall, B. G. Lipták, and B. S. Girão, “4.12
Thermistors,” 2003.
[86] P. Sahoo, H. Djieutedjeu, and P. F. P. Poudeu, “Co 3 O 4 nanostructures: the
effect of synthesis conditions on particles size, magnetism and transport
properties,” J. Mater. Chem. A, vol. 1, no. 47, pp. 15022–15030, 2013.
[87] H. ElShimy, M. Nakajima, F. Arai, and T. Fukuda, “Sensing Temperature in
Water using FIB CVD Nano Thermal Sensors,” in Micro-NanoMechatronics
and Human Science, 2007. MHS’07. International Symposium on, 2007, pp.
7–11.
[88] H. ElShimy, M. Nakajima, and Y. Imaizumi, “Fabrication of FIB-CVD
Nanotemperature Sensor Probe for Local Temperature Sensing in Water
Environments,” J. Robot. …, vol. 19, no. 5, 2007.
[89] G. R. Fink and C. Guthrie, Guide to yeast genetics and molecular and cell
biology. Academic Press, 2002.
[90] J. W. Gouw, J. Krijgsveld, and A. J. R. Heck, “Quantitative proteomics by
metabolic labeling of model organisms.,” Mol. Cell. Proteomics, vol. 9, no. 1,
pp. 11–24, Jan. 2010.
[91] J. A. Simon, P. Szankasi, D. K. Nguyen, C. Ludlow, H. M. Dunstan, C. J.
Roberts, E. L. Jensen, L. H. Hartwell, and S. H. Friend, “Differential toxicities
of anticancer agents among DNA repair and checkpoint mutants of
Saccharomyces cerevisiae,” Cancer Res., vol. 60, no. 2, pp. 328–333, 2000.
[92] L. H. Hartwell, “Yeast and cancer,” Biosci. Rep., vol. 24, no. 4, pp. 523–544,
2004.
[93] A. Carroll and C. Somerville, “Cellulosic biofuels,” Annu. Rev. Plant Biol.,
vol. 60, pp. 165–182, 2009.
[94] A. H. M. Sulaiman and M. R. Ahmad, “Integrated dual nanoprobe-
microfluidic system for single cell penetration,” in Control System,
Computing and Engineering (ICCSCE), 2013 IEEE International Conference
on, 2013, pp. 568–572.
101
[95] A. E. Smith, Z. Zhang, C. R. Thomas, K. E. Moxham, and A. P. J.
Middelberg, “The mechanical properties of Saccharomyces cerevisiae,” Proc.
Natl. Acad. Sci., vol. 97, no. 18, pp. 9871–9874, 2000.
[96] A. E. Pelling, S. Sehati, E. B. Gralla, J. S. Valentine, and J. K. Gimzewski,
“Local nanomechanical motion of the cell wall of Saccharomyces cerevisiae,”
Science (80-. )., vol. 305, no. 5687, pp. 1147–1150, 2004.
[97] J. D. Stenson, C. R. Thomas, and P. Hartley, “Modelling the mechanical
properties of yeast cells,” Chem. Eng. Sci., vol. 64, no. 8, pp. 1892–1903, Apr.
2009.
[98] A. K. Bryan, A. Goranov, A. Amon, and S. R. Manalis, “Measurement of
mass, density, and volume during the cell cycle of yeast.,” Proc. Natl. Acad.
Sci. U. S. A., vol. 107, no. 3, pp. 999–1004, Jan. 2010.
[99] L. Kang, B. G. Chung, R. Langer, and A. Khademhosseini, “Microfluidics for
drug discovery and development: From target selection to product lifecycle
management,” Drug Discov. Today, vol. 13, no. 1, pp. 1–13, 2008.
[100] I. K. Dimov, L. Basabe-Desmonts, J. L. Garcia-Cordero, B. M. Ross, A. J.
Ricco, and L. P. Lee, “Stand-alone self-powered integrated microfluidic blood
analysis system (SIMBAS),” Lab Chip, vol. 11, no. 5, pp. 845–850, 2011.
[101] V. Lecault, A. K. White, A. Singhal, and C. L. Hansen, “Microfluidic single
cell analysis: from promise to practice,” Curr. Opin. Chem. Biol., vol. 16, no.
3, pp. 381–390, 2012.
[102] P. A. Auroux, D. Iossifidis, D. R. Reyes, and A. Manz, “Micro total analysis
systems. 2. Analytical standard operations and applications,” Anal. Chem.,
vol. 74, no. 12, pp. 2637–2652, 2002.
[103] K. E. Herold and A. Rasooly, Lab on a Chip Technology: Fabrication and
microfluidics, vol. 1. Horizon Scientific Press, 2009.
[104] M. A. Burns, B. N. Johnson, S. N. Brahmasandra, K. Handique, J. R. Webster,
M. Krishnan, T. S. Sammarco, P. M. Man, D. Jones, D. Heldsinger, and
others, “An integrated nanoliter DNA analysis device,” Science (80 )., vol.
282, no. 5388, pp. 484–487, 1998.
[105] E. Lassner and W.-D. Schubert, Tungsten: properties, chemistry, technology
of the element, alloys, and chemical compounds. Springer Science & Business
Media, 2012.
[106] B. B. Xu, Y.-L. Zhang, H. Xia, W.-F. Dong, H. Ding, and H.-B. Sun,
“Fabrication and multifunction integration of microfluidic chips by
femtosecond laser direct writing,” Lab Chip, vol. 13, no. 9, pp. 1677–1690,
2013.
102
[107] G. M. Whitesides, E. Ostuni, S. Takayama, X. Jiang, and D. E. Ingber, “Soft
lithography in biology and biochemistry,” Annu. Rev. Biomed. Eng., vol. 3,
no. 1, pp. 335–373, 2001.
[108] J. De Jong, R. G. H. Lammertink, and M. Wessling, “Membranes and
microfluidics: a review,” Lab Chip, vol. 6, no. 9, pp. 1125–1139, 2006.
[109] D. M. Cannon Jr, B. R. Flachsbart, M. A. Shannon, J. V Sweedler, and P. W.
Bohn, “Fabrication of single nanofluidic channels in poly
(methylmethacrylate) films via focused-ion beam milling for use as molecular
gates,” Appl. Phys. Lett., vol. 85, no. 7, pp. 1241–1243, 2004.
[110] B. R. Eggins, Biosensors: an introduction. Wiley Chichester, UK:, 1996.
[111] E. A. Boucher, “Theory and applications of thermistors,” J. Chem. Educ., vol.
44, no. 11, p. A935, 1967.
[112] R. W. A. Scarr and R. A. Setterington, “Thermistors, their theory,
manufacture and application,” Proc. IEE-Part B Electron. Commun. Eng.,
vol. 107, no. 35, pp. 395–405, 1960.
[113] J. A. Becker, C. B. Green, and Gl. Pearson, “Properties and Uses of
Thermistors, Thermally Sensitive Resistors,” Am. Inst. Electr. Eng. Trans.,
vol. 65, no. 11, pp. 711–725, 1946.