integral imaging based 3d display of holographic data
TRANSCRIPT

Integral imaging based 3D display ofholographic data
Ali Ozgur Yontem∗ and Levent OnuralDepartment of Electrical and Electronics Engineering, Bilkent University, TR-06800 Bilkent,
Ankara, Turkey∗Corresponding author: [email protected]
Abstract: We propose a method and present applications of this methodthat converts a diffraction pattern into an elemental image set in orderto display them on an integral imaging based display setup. We generateelemental images based on diffraction calculations as an alternative tocommonly used ray tracing methods. Ray tracing methods do not accom-modate the interference and diffraction phenomena. Our proposed methodenables us to obtain elemental images from a holographic recording of a 3Dobject/scene. The diffraction pattern can be either numerically generateddata or digitally acquired optical data. The method shows the connectionbetween a hologram (diffraction pattern) and an elemental image set ofthe same 3D object. We showed three examples, one of which is thedigitally captured optical diffraction tomography data of an epitheliumcell. We obtained optical reconstructions with our integral imaging displaysetup where we used a digital lenslet array. We also obtained numericalreconstructions, again by using the diffraction calculations, for comparison.The digital and optical reconstruction results are in good agreement.
© 2012 Optical Society of America
OCIS codes: (110.0110) Imaging systems; (110.4190) Multiple imaging; (110.6880) Three-dimensional image acquisition.
References and links1. G. Lippmann, “La photographie integrale,” C.R. Hebd. Seances Acad. Sci. 146, 446-451 (1908).2. F. Okano, H. Hoshino H. A. Jun, and I. Yuyama, “Real-time pickup method for a three-dimensional image based
on the integral photography,” Appl. Opt. 36, 1–14 (1997).3. S. S. Athineos, N. P. Sgouros, P. G. Papageorgas, D. E. Maroulis, M. S. Sangriotis, and N. G. Theofanous, “Pho-
torealistic integral photography using a ray-traced model of capturing optics,” J. Electron Imaging 15, 0430071–0430078 (2006).
4. S.-W. Min, K. S. Park, B. Lee, Y. Cho, and M. Hahn, “Enhanced image mapping algorithm for computer-generated integral imaging system,” Jpn. J. Appl. Phys. 45, L744–L747 (2006).
5. S.-H. Lee, S.-C. Kim, and E.-S. Kim, “Reconstruction of digital hologram generated by sub-image of integralimaging,” Proc. of SPIE 6912, 69121F1–69121F10 (2008).
6. S.-W. Min, S. Jung, J.-H. Park, and B. Lee, “Three-dimensional display system based on computer-generatedintegral photgraphy,” Proc. of SPIE 4297, 187–195 (2001).
7. J.-K. Lee, S.-C. Kim, and E.-S. Kim, “Reconstruction of three-dimensional object and system analysis using raytracing in practical integral imaging system,” Proc. of SPIE 6695, 6695191–66951912 (2007).
8. B.-N.-R. Lee, Y. Cho, K. .S. Park, S.-W. Min, J.-S. Lim, M. C. Whang, and K. R. Park, “Design and implemen-tation of a fast integral image rendering method,” Lect. Notes Comput. Sc. 4161, 135–140 (2006).
9. U. Schnars and W. P. O. Juptner, “Digital recording and numerical reconstruction of holograms,” Meas. Sci. andTech. 13, R85–R110 (2002).
10. L. Onural, “Sampling of the diffraction field,” Appl. Opt. 39, 5929–5935 (2000).11. A. O. Yontem and Levent Onural, “Integral imaging using phase-only LCoS spatial light modulators as Fresnel
lenslet arrays,” J. Opt. Soc. Am. A 28, 2359–2375 (2011).
#171562 - $15.00 USD Received 29 Jun 2012; revised 24 Sep 2012; accepted 24 Sep 2012; published 8 Oct 2012(C) 2012 OSA 22 October 2012 / Vol. 20, No. 22 / OPTICS EXPRESS 24175

12. B. E. A. Saleh and M. C. Teich, Fundamentals of Photonics (John Wiley and Sons, Inc., 1991).13. J. W. Goodman, Introduction to Fourier Optics (Mc-Graw-Hill, 1996).14. T. Mishina, M. Okui, and F. Okano, “Generation of holograms using integral photography,” Proc. of SPIE 5599,
114–122 (2004).15. R. V. Pole, “3-D imagery and holograms of objects illuminated in white light,” Appl. Phys. Lett. 10, 20–22
(1967).16. B. Javidi and S.-H. Hong, “Three-dimensional holographic image sensing and integral imaging display,” J. Disp.
Technol 1, 341–346 (2005).17. C. Quan, X. Kang, and C. J. Tay, “Speckle noise reduction in digital holography by multiple holograms,” Opt.
Eng. 46 1158011–1158016 (2007).18. J. G.-Sucerquia, J. A. H. Ramırez, and D. V. Prieto, “Reduction of speckle noise in digital holography by using
digital image processing,” Optik 116, 44–48 (2005).19. T. Baumbach, E. Kolenovic, V. Kebbel, and W. Juptner, “Improvement of accuracy in digital holography by use
of multiple holograms,” Appl. Opt. 45, 6077–6085 (2006).20. T. Ito and K. Okano, “Color electroholography by three colored reference lights simultaneously incident upon
one hologram panel,” Opt. Express 12, 4320–4325 (2004).21. F. Yaras and L. Onural, “Color holographic reconstruction using multiple SLMs and LED illumination,” Proc. of
SPIE 7237, 72370O1–72370O5 (2010).22. I. Bergoend, C. Arfire, N. Pavillon, and C. Depeursinge, “Diffraction tomography for biological cells imaging
using digital holographic microscopy,” Proc. of SPIE 7376, 7376131–7376138 (2010).23. D. Mas, J. Garcia, C. Ferreira, L. M. Bernardo, and F. Marinho, “Fast algorithms for free-space diffraction
patterns calculation,” Opt. Commun. 164, 233–245 (1999).24. H. Kang, T. Fujii, T. Yamaguchi, and H. Yoshikawa, “Compensated phase-added stereogram for real-time holo-
graphic display,” Opt. Eng. 46, 0958021–09580211 (2007).25. T. Shimobaba, T. Ito, N. Masuda, Y. Abe, Y. Ichihashi, H. Nakayama, N. Takada, A. Shiraki, and T. Sugie,
“Numerical calculation library for diffraction integrals using the graphic processing unit: the GPU-based waveoptics library,” J. Opt. A-Pure and Appl. Opt. 10, 0753081–0753085 (2009).
26. J.-S. Jang and B. Javidi, “Three-dimensional integral imaging with electronically synthesized lenslet arrays,”Opt. Lett. 27, 1767–1769 (2002).
27. M. Kovachev, R. Ilieva, P. Benzie, G. B. Esmer, L. Onural, J. Watson, and T. Reyhan, “Holographic 3DTV dis-plays using spatial light modulators,” in Three-Dimensional Television-Capture, Transmission, Display, H. Oza-ktas, and L. Onural, eds. (Springer, 2008), pp. 529-555.
28. L. Onural, F. Yaras, and H. Kang, “Digital holographic three-dimensional video displays,” Proc. of IEEE 99,576–589 (2011).
29. F. Yaras, H. Kang, and L. Onural, “Circular holographic video display system,” Opt. Express 19, 9147–9156(2011).
30. S.-W. Min, S. Jung, H. Choi Y. Kim, J.-H. Park, and B. Lee, “Wide-viewing-angle integral three-dimensionalimaging system by curving a screen and a lens array,” Appl. Opt. 44, 546–552 (2005).
31. D.-H. Shin, B.-G. Lee, J. Hyun, D.-C. Hwang, and E.-S. Kim, “Curved projection integral imaging using anadditional large-aperture convex lens for viewing angle improvement,” ETRI J. 31, 105–110 (2009).
1. Introduction
Integral imaging is a promising 3D capture and display system. Conventional integral imagingsystems are composed of two stages: a pick-up system to obtain elemental images of a 3Dobject/scene and a display stage which integrates the elemental images for reconstruction [1].These parts are physical optical setups. These setups are usually not end-to-end, that is, twosetups are separate. In the capture part, the elemental images are imaged by means of a seriesof lenses and a lenslet array, on a CCD array or a digital camera. In the display setup, theobtained elemental images are displayed on a LCD and the reconstruction is observed througha lenslet array. It is necessary to match the size of the captured elemental images on the CCDto the displayed ones on the LCD in the display setup since the physical sizes of the devices areusually different. Furthermore, the pixel size of the CCD sensor does matter since the qualityof the reconstruction depends on it. Finally, the LCD panel in the display setup should be ableto accommodate all of the captured elemental images. To display a good quality still 3D imageor a video sequence, both setups require usual adjustments and alignments (imaging distances,magnification ratios, etc.) of optical elements. Such a work is studied rigorously in [2]. Thatwork is an example for the case where optically captured elemental images of a physical 3D
#171562 - $15.00 USD Received 29 Jun 2012; revised 24 Sep 2012; accepted 24 Sep 2012; published 8 Oct 2012(C) 2012 OSA 22 October 2012 / Vol. 20, No. 22 / OPTICS EXPRESS 24176

object are reconstructed optically at the display end. Such integral imaging systems consist ofdecoupled capture and display units, and therefore, both units need careful adjustments. Forapplications such as 3D gaming, 3D modeling, animation, etc., the only physically needed partis the display. In those systems, the elemental images are digitally obtained for synthetic 3Dobjects and then displayed on an optical display setup. Digital techniques are more flexiblecompared to optical capture processes. If the elemental images are obtained by computation,optical adjustments are needed only for the display part. Ray tracing methods can be usedto generate elemental images. There are many reported studies using ray tracing methods toobtain elemental images for computer generated integral imaging systems [3–7]. The captureprocess, for computer generated integral imaging systems, is performed using certain computergraphics algorithms such as point retracing rendering, multiple viewpoint rendering, parallelgroup rendering, viewpoint vector rendering, etc., [8]. All of these algorithms are based on raytracing.
In our work, as an alternative method to generate elemental images, we performed diffrac-tion calculations using wave propagation methods based on the Fresnel kernel. To the best ofour knowledge, such an approach is not reported before. One can compute the scalar field dis-tribution in the space using the Fresnel propagation model [9, 10]. We can generate elementalimages by first modeling the optical system with image processing tools and then by applyingoptical wave propagation principles [11]. Wave propagation models accommodate diffractionand interference phenomena whereas ray models do not [12,13]. Wave propagation models areespecially useful for the cases where we have holographic data of a 3D object/scene. This is infact an inverse problem of hologram generation from elemental images [5, 14, 15]; that is, weobtain elemental images from a holographic recording as in [16].
There are certain problems with direct optical reconstruction from holographic data by holo-graphic means, such as speckle noise due to coherent illumination. Thus, certain image pro-cessing techniques (filtering and averaging) are usually performed to remove the noise and toreconstruct the data digitally [17–19]. This way, the visibility in digital reconstructions can beimproved. However, in holographic optical reconstructions, speckle noise is present due to co-herent illumination. In our case, at least on the display side, we do not have additional specklenoise problem since we use incoherent illumination for the reconstructions.
It is not desirable to use lasers for the reconstruction due to potential hazards to the eye,either. It may be possible to use LED illumination to avoid laser hazards while observing theholographic reconstructions [20, 21]. However, the reconstruction quality would be lower dueto spectral properties of the light source.
On the other hand, integral imaging works primarily with incoherent illumination. It maybe desirable to reconstruct holographic data by an integral imaging display. A conversion fromholographic data to elemental image data is needed to reconstruct the 3D image using incoher-ent light and integral imaging techniques. Such an idea is studied in [16]. In that work, first aseries of images are reconstructed at different depths, creating a set of slices of 3D data. Then,the elemental images are generated using another process which maps each slice to the elemen-tal image plane. Instead of such an approach, we directly use holographic data to display 3Dimages on an integral imaging setup. For this purpose, we designed a direct pick-up integralimaging capture system, [6]. This digital pick-up system is realized solely by a computer pro-gram that simulates wave propagation. Lenslet arrays that we used in the design are composedof digital synthetic Fresnel thin lenslets [11]. We processed the input holographic data with thissimulator to obtain computer generated elemental images. This way, we generate the elementalimages in one step. We used these computer generated elemental images in a physical displaysetup to reconstruct optically 3D images. In our proposed display, we used a modified versionof the setup given in [11] where we replaced the analog lenslet array with a digitally controlled
#171562 - $15.00 USD Received 29 Jun 2012; revised 24 Sep 2012; accepted 24 Sep 2012; published 8 Oct 2012(C) 2012 OSA 22 October 2012 / Vol. 20, No. 22 / OPTICS EXPRESS 24177
synthetic Fresnel lenslet array written on a phase-only LCoS SLM. By this procedure, we cangenerate elemental images digitally from recorded holographic input data and optically recon-struct a 3D image from them on our integral imaging display. For example, our method can beused to generate elemental images from holograms captured within a diffraction tomographysetup [22].
In some cases, diffraction calculation might be slower than ray tracing calculations. Thereare several fast algorithms which implement diffraction calculations based on the Fresnel ker-nel [23]. Even real-time diffraction calculations are possible [24]. Indeed, one of the implemen-tations uses the graphical processing unit to further increase the computation speed [25]. Ourelemental image generation method is quite similar to techniques used in digital hologram gen-eration procedures. We calculated the diffraction fields using DFT. We computed the DFT usingan FFT algorithm. It is possible to apply other abovementioned faster algorithms to our case,as well. However, the comparison of the effects of such different computational procedures tothe performance is not a part of this study.
Presented numerical and optical results show that the computationally generated elementalimages using wave propagation principle from synthetic or real objects can be used to success-fully reconstruct 3D images. Furthermore, a digitally controlled synthetic lenslet array can beused at the display stage setup of an integral imaging system [11, 26].
In Section 2 we describe the proposed system. We explain the method to obtain elementalimages and present the optical setup that we use to reconstruct the 3D objects. In Section 3, weshow the optical display experiment results of the proposed system together with the computersimulations. Finally, we draw conclusions, with notes, in the last section.
2. Proposed system
In this section, we present the method for elemental image generation from holographic dataand an integral imaging optical setup to reconstruct 3D images from the computer generatedelemental images. The holographic data may be acquired either by optical means or computedusing digital techniques. We present our method in the first subsection. In the second subsec-tion, we present the algorithm and in the third subsection we present three examples. In the firstexample, we obtain the elemental images of two letters at different depths. We first generatedthe diffraction patterns (computer generated holograms) of the letters. The complex diffractionpattern is then used as the input to our algorithm. The output of the algorithm gives the ele-mental image set of these letters at the imaging distance. For the second example, we obtainthe elemental images of a 3D pyramid shaped object. In the last example, we obtain the setof elemental images as the output from a digitally captured optical holographic data which isobtained using a diffraction tomography technique [22]; the object is an epithelium cell. Inthe last subsection, we describe the optical setup which we used to reconstruct the 3D imagefrom elemental images. Thus we show that the obtained elemental images can be used foroptical reconstruction. The object sizes and display distances should match the optical setuprequirements. Thus, the holographic data should be further processed if the object sizes and thedistances do not match the display system. This processing is especially needed for opticallycaptured holographic data.
2.1. The method
Suppose we have digitally recorded holographic data (diffraction data) of a 3D object; a setupis shown in Fig. 1(a). Since, our aim is to display 3D image of a holographically recorded ob-ject/scene data by using an integral imaging technique, we need to convert the holographic datato elemental images. An in-line hologram of a 3D object is related to the diffraction field of thatobject [10]. This diffraction field can either be obtained digitally by calculating the propagation
#171562 - $15.00 USD Received 29 Jun 2012; revised 24 Sep 2012; accepted 24 Sep 2012; published 8 Oct 2012(C) 2012 OSA 22 October 2012 / Vol. 20, No. 22 / OPTICS EXPRESS 24178
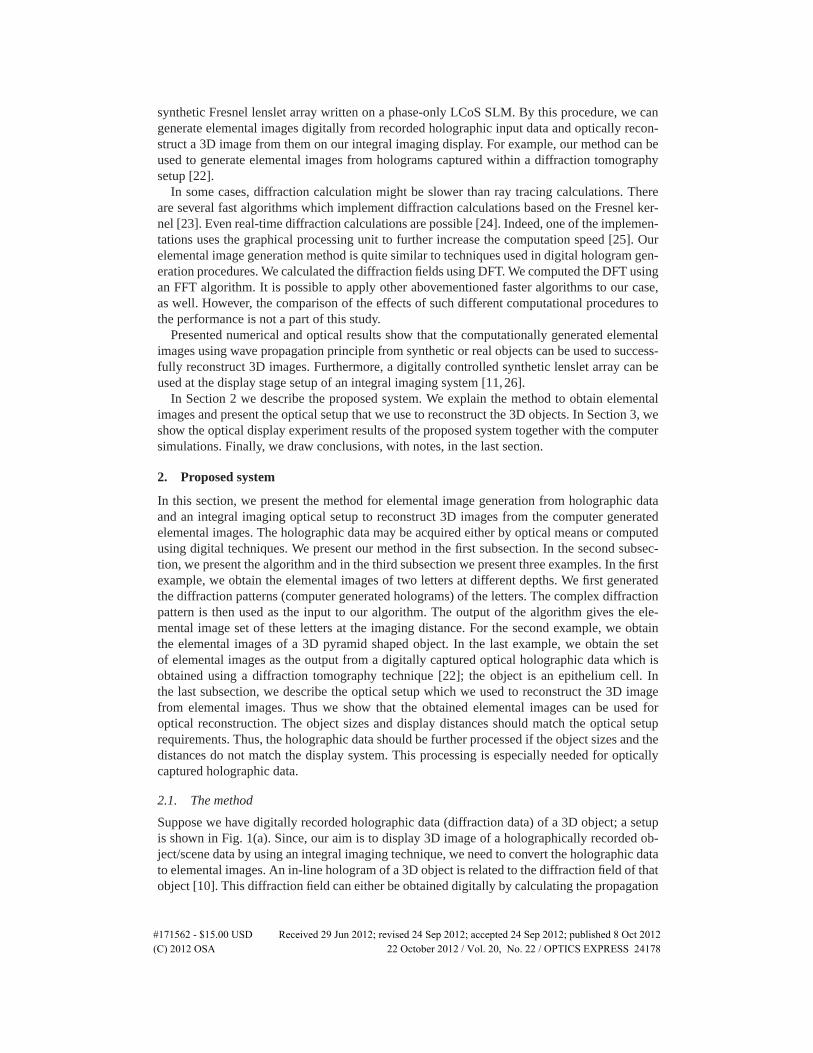
of light field scattered from the object or captured by optical means. In Fig. 1(a), a sketch of thediffraction pattern at z = z0 of a cube is shown. In Fig. 1(b), a generic setup is demonstrated toholographically reconstruct the 3D image of the original object. In a digital holographic displaysystem, diffraction field is sampled and written on a SLM. When the SLM is illuminated by alaser light source, an observer can perceive the 3D image [27]. For the integral imaging setup,
Fig. 1. (a) A generic sketch of holographic recording. The diffraction pattern at z = z0 iscaptured. (b) A generic sketch of 3D image reconstruction from the captured hologram.
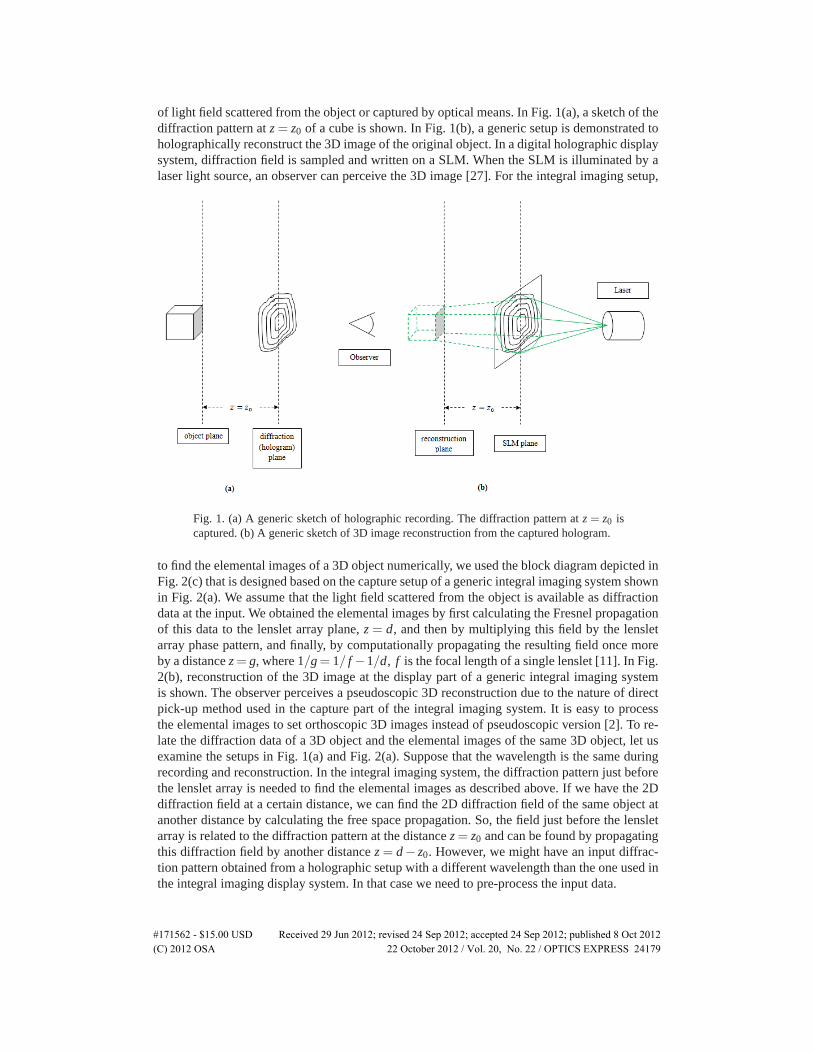
to find the elemental images of a 3D object numerically, we used the block diagram depicted inFig. 2(c) that is designed based on the capture setup of a generic integral imaging system shownin Fig. 2(a). We assume that the light field scattered from the object is available as diffractiondata at the input. We obtained the elemental images by first calculating the Fresnel propagationof this data to the lenslet array plane, z = d, and then by multiplying this field by the lensletarray phase pattern, and finally, by computationally propagating the resulting field once moreby a distance z= g, where 1/g= 1/ f −1/d, f is the focal length of a single lenslet [11]. In Fig.2(b), reconstruction of the 3D image at the display part of a generic integral imaging systemis shown. The observer perceives a pseudoscopic 3D reconstruction due to the nature of directpick-up method used in the capture part of the integral imaging system. It is easy to processthe elemental images to set orthoscopic 3D images instead of pseudoscopic version [2]. To re-late the diffraction data of a 3D object and the elemental images of the same 3D object, let usexamine the setups in Fig. 1(a) and Fig. 2(a). Suppose that the wavelength is the same duringrecording and reconstruction. In the integral imaging system, the diffraction pattern just beforethe lenslet array is needed to find the elemental images as described above. If we have the 2Ddiffraction field at a certain distance, we can find the 2D diffraction field of the same object atanother distance by calculating the free space propagation. So, the field just before the lensletarray is related to the diffraction pattern at the distance z = z0 and can be found by propagatingthis diffraction field by another distance z = d − z0. However, we might have an input diffrac-tion pattern obtained from a holographic setup with a different wavelength than the one used inthe integral imaging display system. In that case we need to pre-process the input data.
#171562 - $15.00 USD Received 29 Jun 2012; revised 24 Sep 2012; accepted 24 Sep 2012; published 8 Oct 2012(C) 2012 OSA 22 October 2012 / Vol. 20, No. 22 / OPTICS EXPRESS 24179
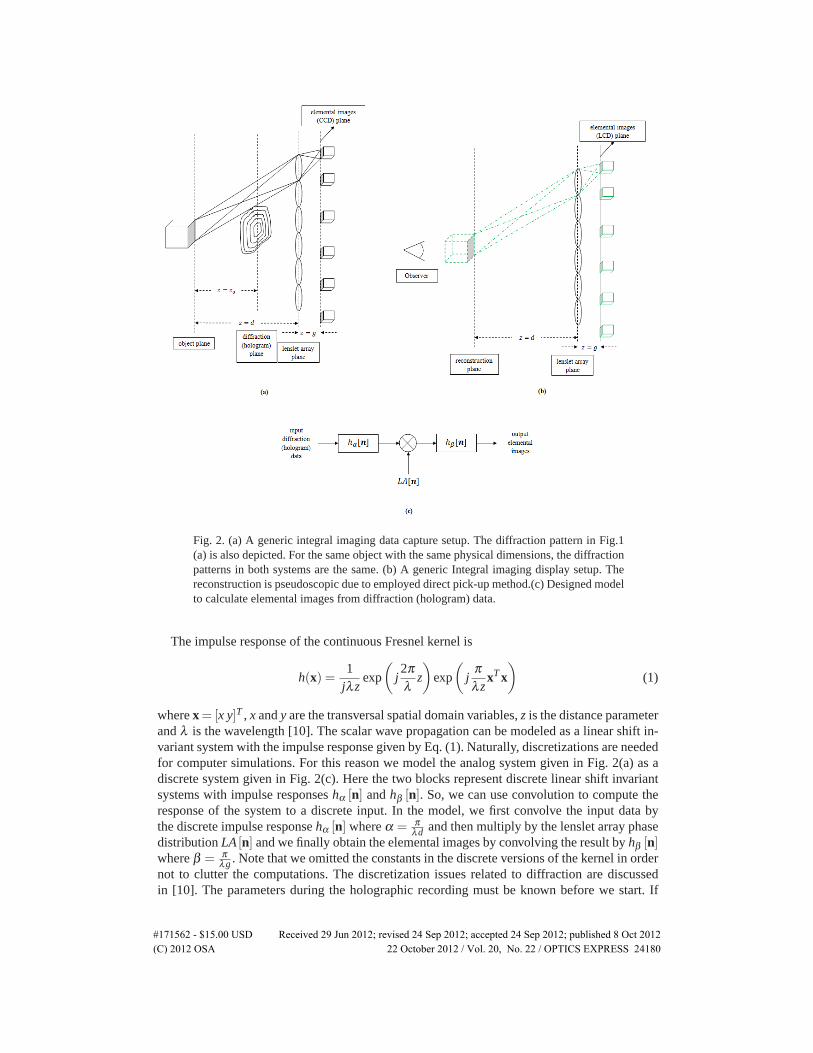
Fig. 2. (a) A generic integral imaging data capture setup. The diffraction pattern in Fig.1(a) is also depicted. For the same object with the same physical dimensions, the diffractionpatterns in both systems are the same. (b) A generic Integral imaging display setup. Thereconstruction is pseudoscopic due to employed direct pick-up method.(c) Designed modelto calculate elemental images from diffraction (hologram) data.
The impulse response of the continuous Fresnel kernel is
h(x) =1
jλ zexp
(j2πλ
z
)exp
(j
πλ z
xT x)
(1)
where x= [x y]T , x and y are the transversal spatial domain variables, z is the distance parameterand λ is the wavelength [10]. The scalar wave propagation can be modeled as a linear shift in-variant system with the impulse response given by Eq. (1). Naturally, discretizations are neededfor computer simulations. For this reason we model the analog system given in Fig. 2(a) as adiscrete system given in Fig. 2(c). Here the two blocks represent discrete linear shift invariantsystems with impulse responses hα [n] and hβ [n]. So, we can use convolution to compute theresponse of the system to a discrete input. In the model, we first convolve the input data bythe discrete impulse response hα [n] where α = π
λd and then multiply by the lenslet array phasedistribution LA [n] and we finally obtain the elemental images by convolving the result by hβ [n]where β = π
λg . Note that we omitted the constants in the discrete versions of the kernel in ordernot to clutter the computations. The discretization issues related to diffraction are discussedin [10]. The parameters during the holographic recording must be known before we start. If
#171562 - $15.00 USD Received 29 Jun 2012; revised 24 Sep 2012; accepted 24 Sep 2012; published 8 Oct 2012(C) 2012 OSA 22 October 2012 / Vol. 20, No. 22 / OPTICS EXPRESS 24180

there is a mismatch between the recording parameters and the display parameters, we shouldprocess the hologram to match the parameters of these two steps. This is necessary because wewant to focus the elemental images at the output.
During the process, we wish to first back propagate the holographic data to a location whichwe call the “origin”. The origin is defined as the effective depth of the nearest point of the objectto the lenslet array.
In case of a mismatch between the physical parameters of the holographic recording stepand our display the matching process is equivalent to equating the corresponding discrete Fres-nel kernels. To find the relation between the kernels, let us assume that hα1 [n] represents thepropagation associated with the holographic input setup parameters and the kernel hα2 [n] rep-resents the propagation with the integral imaging setup parameters. If we equate the quadraticphases in hα1 [n] and hα2 [n], we can find the relation that matches the physical parameters. Letexp
[jα1nT n
]be the quadratic phase in the Fresnel kernel representing the 2D diffraction field
of the holographic setup where α1 =πX2
1(λ1z1)
, λ1 is the wavelength, z1 is the propagation distance,
X1 is the sampling period of the field in both directions. n = [n1 n2]T where n1,n2 are integers.
Let exp[
jα2nT n]
be the quadratic phase in the Fresnel kernel representing the 2D diffraction
field of the integral imaging setup where α2 =πX2
2(λ2z2)
. If we equate the parameters of these func-
tions ∀n, we get, α1 = α2 thus π(λ1z1)
X21 = π
(λ2z2)X2
2 . So, we can find that z2 = z1.λ1λ2.X2
2X2
1. So,
back-propagating the input data by z2 is equivalent to placing the 3D object effectively at theorigin as in Fig. 2(a).
2.2. The algorithm
The algorithm is given by the flowchart shown in Fig. 3. The input of the algorithm is diffractiondata. Additional preprocessing steps may be needed depending on the nature of input data andthe desired quality of the output display. For example, if the input is not from an object with adiffusing surface, we may need to multiply the associated field with a random phase to improvethe visibility at the output. Also, for the cases where the recording physical parameters donot match with the display system parameters and where the object size is small compared tothe display size, we may need to pre-process the data. The procedures for such cases will bediscussed in detail later in this section. However, here we should mention that for all thesecases, we first want to find the complex object field at the origin and then apply the specifiedprocesses. Actually, this step is not a necessity. On the contrary, we can generate the elementalimages with the given diffraction pattern directly. To cover all cases by a single uniform step,we first back-propagate all input to the origin, and then apply the fixed process as described inFig.2(c). This will then directly give the elemental images regardless of the properties of theoriginal data.
We use the DFT method to compute the convolution to find outputs of the discrete systems.However, our discretized signals have a support that span both sides of the axes; i.e. n1,n2
can take zero, positive or negative values. Therefore, we must modify the commonly usedDFT definition to operate also on such signals. Suppose that for a finite length signal x [n],n1,n2 = −N/2, · · · ,N/2− 1 we define the modified finite length ˆDFT X [k] = ˆDFT {x [n]},k1,k2 =−N/2, · · · ,N/2−1 as follows: Let the periodic X [k] be given by,
X [k] =N−1
∑n1=0
N−1
∑n2=0
x [n]e− j2πN
kT n k1,k2 ∈ (−∞,∞) · (2)
Here, X [k] and x [n] are periodic extensions of finite length X [k] and x [n], respectively, as,X [k1 −N/2, k2 −N/2] = X [(k1)modN −N/2, (k2)modN −N/2], and x [n1 −N/2, n2 −N/2] =
#171562 - $15.00 USD Received 29 Jun 2012; revised 24 Sep 2012; accepted 24 Sep 2012; published 8 Oct 2012(C) 2012 OSA 22 October 2012 / Vol. 20, No. 22 / OPTICS EXPRESS 24181
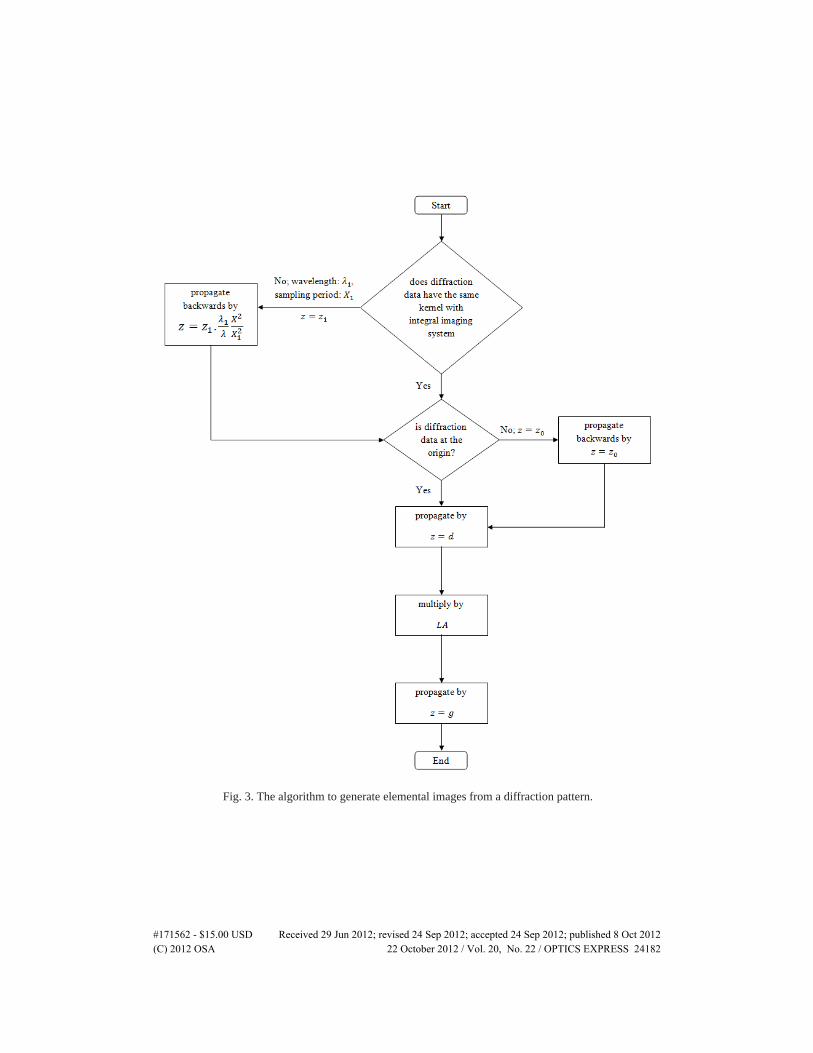
Fig. 3. The algorithm to generate elemental images from a diffraction pattern.
#171562 - $15.00 USD Received 29 Jun 2012; revised 24 Sep 2012; accepted 24 Sep 2012; published 8 Oct 2012(C) 2012 OSA 22 October 2012 / Vol. 20, No. 22 / OPTICS EXPRESS 24182
x [(n1)modN −N/2, (n2)modN −N/2], n1,n2 are integers (−∞, ∞) and consequently, X [k] isone period over k1,k2 = −N/2, · · · ,N/2 − 1 of X [k] and x [n] is one period over n1,n2 =−N/2, · · · ,N/2− 1 of x [n]. In order to avoid aliasing that might be caused by the periodicityassociated with DFT, while using this method, the computation window size should be selectedsufficiently larger than the signal window in both directions. Outside the signal window, wechose to pad the computation window with zeros (opaque borders). Thus, we compute the lin-ear convolution of the signals by approximating the circular convolution by padding zeros in thecomputation array. Moreover, this way, we simulate the case where those points on the objectsurface are the only possible source points. In our examples, the signal window sizes are chosensmaller than 1920×1920 while the computation window sizes are chosen as 3840×3840. TheFresnel diffraction kernel is used to model wave propagation. Let us denote the signal windowby t [n]. The diffraction pattern, td [n], of the signal is calculated by
td [n] = ˆIDFT{
ˆDFT {wt [n]}Hθ [k]}
(3)
where n = [n1 n2]T and k = [k1 k2]
T represent the discrete spatial domain variables and the dis-crete spatial frequency domain variables, respectively, and n1,n2,k1,k2 are integers; we choosethe range for n1,n2,k1 and k2 as [−1920, 1919] in our examples. wt [n] is the computationalwindow and t[n] is centered inside wt [n]. 2D ˆDFT and 2D ˆIDFT of the matrices are computedusing 2D FFT and 2D IFFT algorithms, respectively.
In order to speed up the computations, we used the Fresnel kernel in the spatial frequencydomain. The Fourier transform of continuous Fresnel kernel is
H (f) = exp
(j2πλ
z
)exp
(− jπλ zfT f)
(4)
where f = [ fx fy]T , fx and fy are the spatial frequency domain variables in cycles per unit dis-tance in (−∞, ∞). To compute the discrete Fresnel kernel, we discretize Eq. (4) by substitutingf with Uk and we obtain
Hθ [k] = exp(− jθkT UT Uk
)(5)
where k = [k1 k2]T and k1,k2 = −N/2, · · · ,N/2− 1, U =
[1/(NX) 0
0 1/(NX)
]is the 2D
rectangular sampling matrix in the spatial frequency domain and θ = πλd. N is the total numberof pixels along one side of the discrete 2D calculation array, X is the spatial sampling periodand d is the propagation distance. We omitted the phase constant, which appears in Eq. (4), inorder not to clutter the computations.
On the lenslet array plane, we generate the lenslet array complex phase pattern given asin [11]. A single lenslet of the array is given by
l [n] = exp(− jγnT VT Vn
)(6)
which is obtained by discretizing
l (x) = exp
(− j
πλ f
xT x)
(7)
and by substituting x by Vn where n1,n2 are in the interval [−M/2, M/2− 1] and γ = πλ f ,
V =
[X 00 X
]is the 2D rectangular sampling matrix in the spatial domain. We chose the
focal length as f = M X2
λ to cover the entire normalized frequency range in the interval [−π, π)radians where M is the length of one side of a lenslet. A 2D array of lenslets, LA[n], is generated
#171562 - $15.00 USD Received 29 Jun 2012; revised 24 Sep 2012; accepted 24 Sep 2012; published 8 Oct 2012(C) 2012 OSA 22 October 2012 / Vol. 20, No. 22 / OPTICS EXPRESS 24183
by replicating l[n] in both directions in a rectangular fashion. LA[n] is centered within thecomputation window wLA[n]. Also, the lenslet array is large enough to image most of the lightscattered from the object. wLA[n] is multiplied with the diffraction pattern, td [n], of the object.Focal length of the lenslets is chosen such that it satisfies the imaging equation 1/ f = 1/g+1/dand proper magnification ratios are obtained at the imaging plane. To give numerical examples,we chose f = 10.8mm and d = 7 f . Finally, we calculate the diffraction pattern due to theresulting complex field of the multiplication wLA[n]td [n] at the imaging depth, g. The resultantcomplex diffraction pattern is given by
p[n] = ˆIDFT{
ˆDFT {wLA [n] td [n]}Hσ [k]}
(8)
where σ = πλg Taking the square magnitude of this pattern simulates the discrete intensityrecording,
I [n] = |p [n]|2 · (9)
As a result, we obtain computer generated elemental images of the 3D object.
2.3. The examples
Now we will proceed with the examples of three different input diffraction patterns, as a proofof the concept, we chose three examples. In the reconstructions, we demonstrate the depth offocus, viewing angle and parallax of our display, qualitatively. The first example is a set oftwo planar letters; the letters are at different depths. Such an example is extensively used inthe literature [4, 5, 7]. This example helps us to understand whether we are able to distinguishdifferent depths in the reconstructions. Also, it gives an idea about the depth of focus of thelenslets. Our second example is an extension of the first one. We sliced down a pyramid objectto create several planar objects. This time our aim is to show the parallax that can be obtainedusing our display. Since, we have a depth variation in the object, it is easier to observe theparallax effect. The last example presents the most important aspect of our method. We useda digitally obtained optical diffraction tomography data as the input of our method. We cangenerate elemental images even from such physical data.
In the first example, we have two different digital letters at two different depths. One letter islocated at the origin, and the other one is located at z =−5 f where f = 10.8mm. These lettersare separated along the x-axis by 2.6mm. The amplitude of the object points on the letters aretaken as 1 and the other points outside the letters are 0. Let the letter located at distance z=−5 fis represented by the computation window wt1 [n] and the other is represented by wt2 [n]. So, wehave two slices in the space. To find wt [n] we perform the following computation:
wt [n] = ˆIDFT{
ˆDFT {wt1 [n]R1 [n]}Hη [k]}+{wt2 [n]R2 [n]} (10)
where η = πλ (5 f ), Ri [n], i ∈ {1, 2}, is a random matrix with entries Ri [n] = [rn1n2 ] wherern1n2 = exp(− j2πX ) and where X is a random variable uniformly distributed in [0, 1]. Thus,the window wt1 [n] is first multiplied by a random phase R1 [n] and then propagated by an ef-fective distance of 5 f . The result is added to wt2 [n] which is also multiplied by another randomphase factor. The second slice is not propagated since it is already located at the origin. Theassumption is that, the multiple diffraction effects from each slice of the object are negligible.Thus, each slice is assumed to contribute to the diffraction field independently of others. Thisis because, the multiplication with the random phase simulates diffusing surfaces, and thus,ensures that the light traveling in the space well scatters almost everywhere. To note that, theobject at z =−5 f distance will be 5 f in front the object at the origin in the reconstruction. So,the object at the origin will be reconstructed at d = 7 f , which is the distance we chose whilegenerating the elemental images, and the other object will be observed at 12 f . The generated
#171562 - $15.00 USD Received 29 Jun 2012; revised 24 Sep 2012; accepted 24 Sep 2012; published 8 Oct 2012(C) 2012 OSA 22 October 2012 / Vol. 20, No. 22 / OPTICS EXPRESS 24184
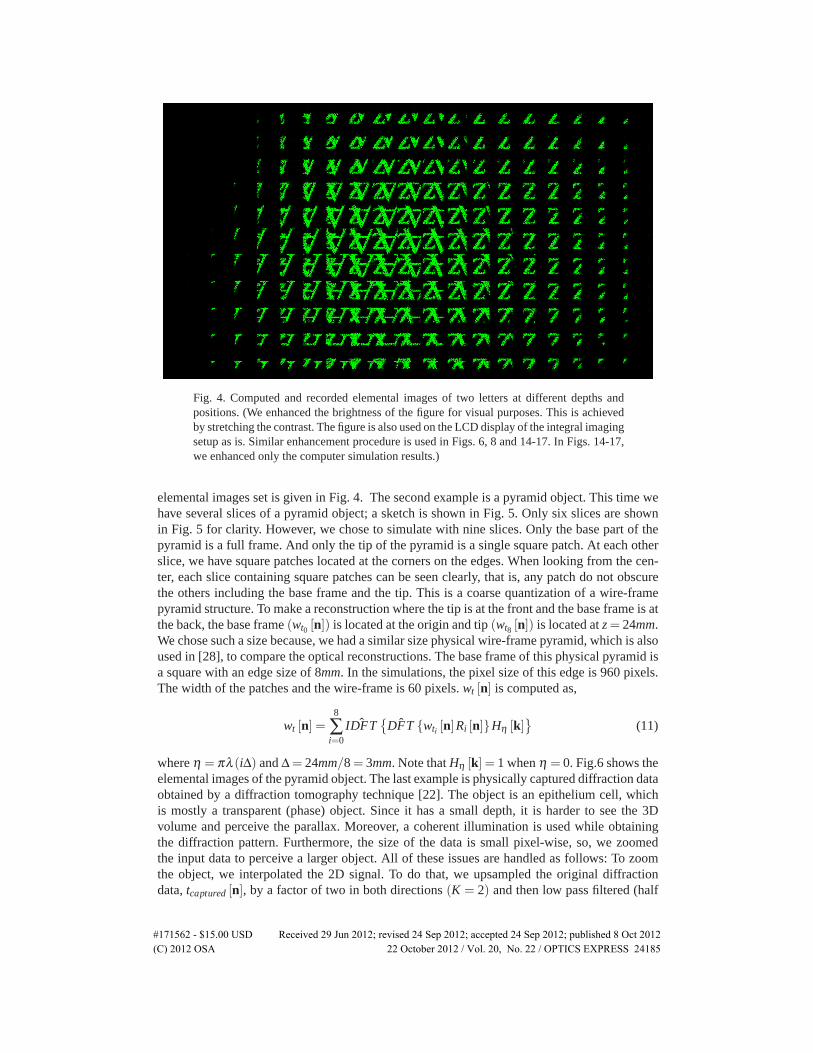
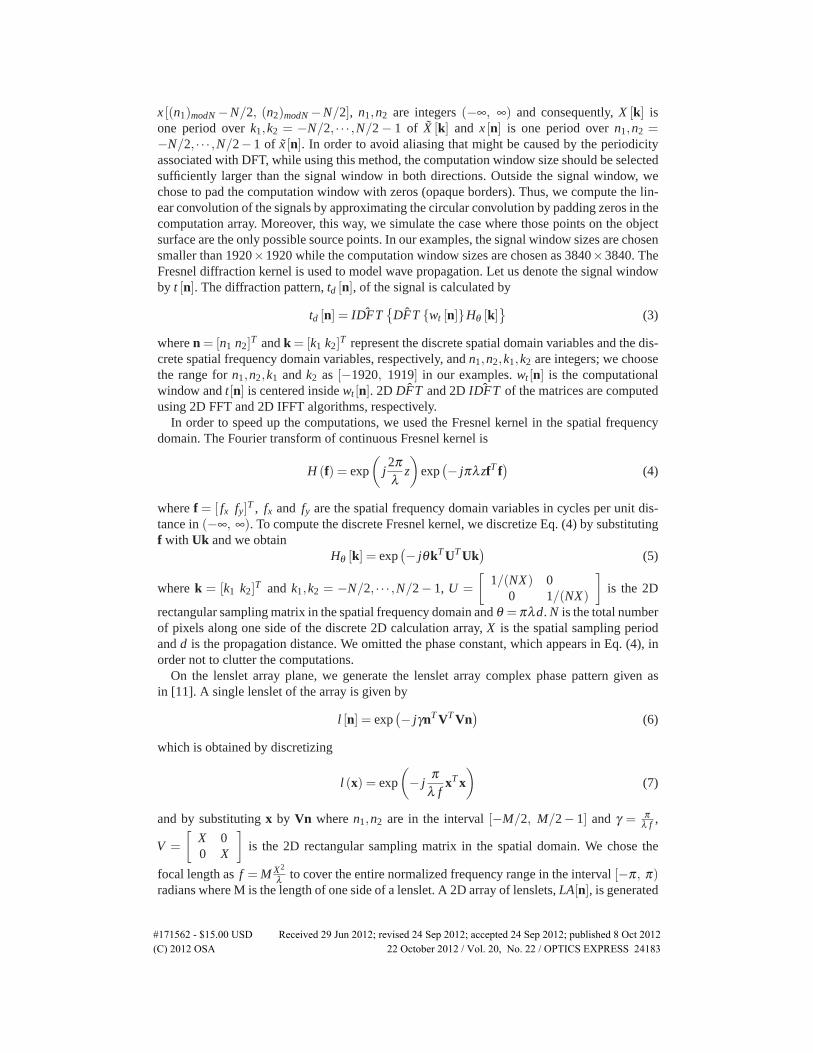
Fig. 4. Computed and recorded elemental images of two letters at different depths andpositions. (We enhanced the brightness of the figure for visual purposes. This is achievedby stretching the contrast. The figure is also used on the LCD display of the integral imagingsetup as is. Similar enhancement procedure is used in Figs. 6, 8 and 14-17. In Figs. 14-17,we enhanced only the computer simulation results.)
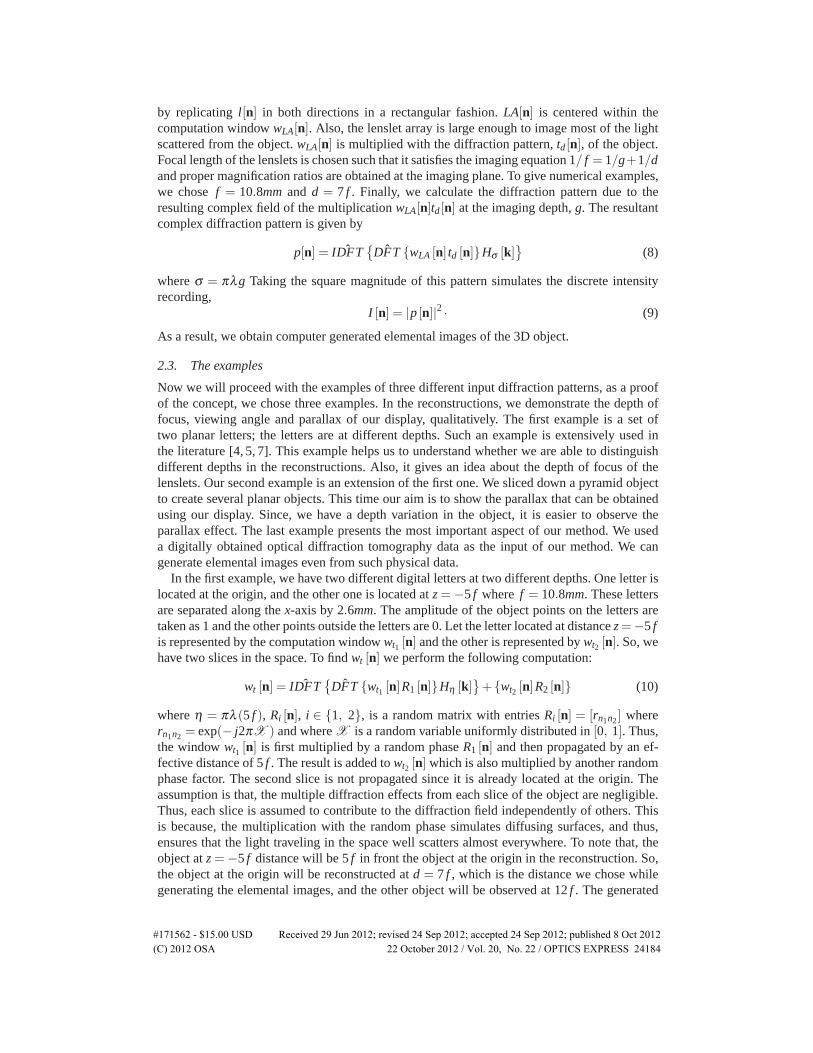
elemental images set is given in Fig. 4. The second example is a pyramid object. This time wehave several slices of a pyramid object; a sketch is shown in Fig. 5. Only six slices are shownin Fig. 5 for clarity. However, we chose to simulate with nine slices. Only the base part of thepyramid is a full frame. And only the tip of the pyramid is a single square patch. At each otherslice, we have square patches located at the corners on the edges. When looking from the cen-ter, each slice containing square patches can be seen clearly, that is, any patch do not obscurethe others including the base frame and the tip. This is a coarse quantization of a wire-framepyramid structure. To make a reconstruction where the tip is at the front and the base frame is atthe back, the base frame (wt0 [n]) is located at the origin and tip (wt8 [n]) is located at z= 24mm.We chose such a size because, we had a similar size physical wire-frame pyramid, which is alsoused in [28], to compare the optical reconstructions. The base frame of this physical pyramid isa square with an edge size of 8mm. In the simulations, the pixel size of this edge is 960 pixels.The width of the patches and the wire-frame is 60 pixels. wt [n] is computed as,
wt [n] =8
∑i=0
ˆIDFT{
ˆDFT {wti [n]Ri [n]}Hη [k]}
(11)
where η = πλ (iΔ) and Δ = 24mm/8 = 3mm. Note that Hη [k] = 1 when η = 0. Fig.6 shows theelemental images of the pyramid object. The last example is physically captured diffraction dataobtained by a diffraction tomography technique [22]. The object is an epithelium cell, whichis mostly a transparent (phase) object. Since it has a small depth, it is harder to see the 3Dvolume and perceive the parallax. Moreover, a coherent illumination is used while obtainingthe diffraction pattern. Furthermore, the size of the data is small pixel-wise, so, we zoomedthe input data to perceive a larger object. All of these issues are handled as follows: To zoomthe object, we interpolated the 2D signal. To do that, we upsampled the original diffractiondata, tcaptured [n], by a factor of two in both directions (K = 2) and then low pass filtered (half
#171562 - $15.00 USD Received 29 Jun 2012; revised 24 Sep 2012; accepted 24 Sep 2012; published 8 Oct 2012(C) 2012 OSA 22 October 2012 / Vol. 20, No. 22 / OPTICS EXPRESS 24185
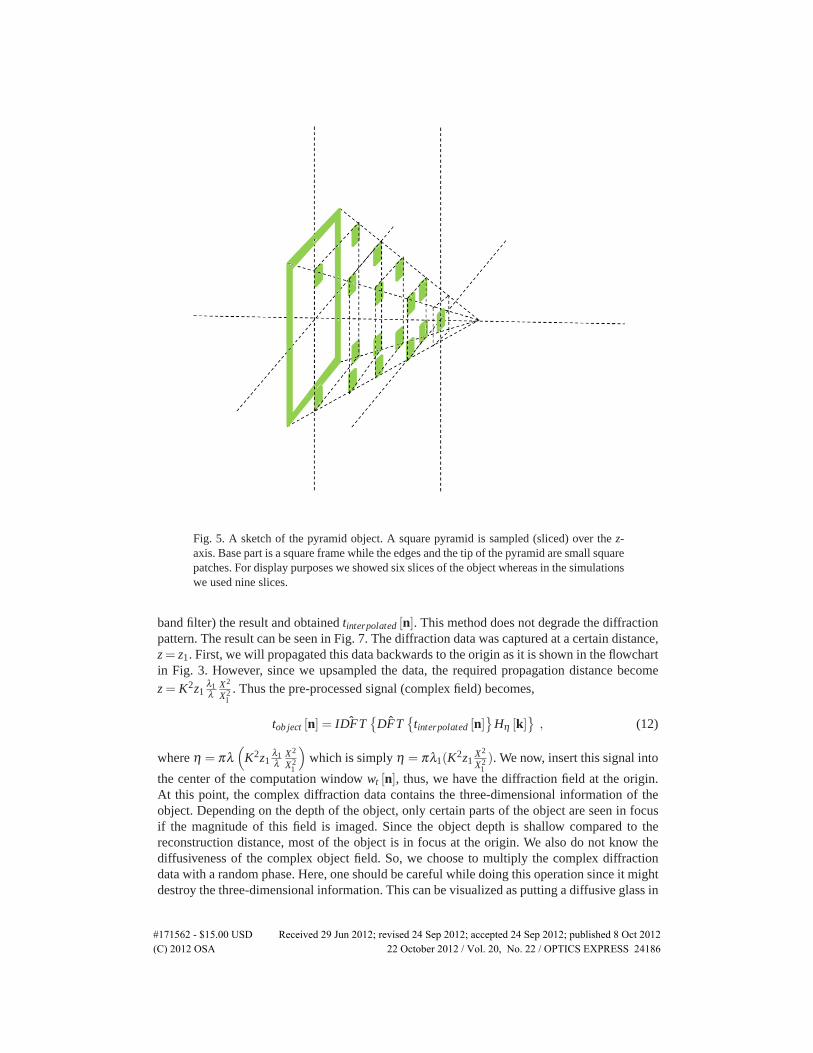
Fig. 5. A sketch of the pyramid object. A square pyramid is sampled (sliced) over the z-axis. Base part is a square frame while the edges and the tip of the pyramid are small squarepatches. For display purposes we showed six slices of the object whereas in the simulationswe used nine slices.
band filter) the result and obtained tinterpolated [n]. This method does not degrade the diffractionpattern. The result can be seen in Fig. 7. The diffraction data was captured at a certain distance,z = z1. First, we will propagated this data backwards to the origin as it is shown in the flowchartin Fig. 3. However, since we upsampled the data, the required propagation distance becomez = K2z1
λ1λ
X2
X21
. Thus the pre-processed signal (complex field) becomes,
tob ject [n] = ˆIDFT{
ˆDFT{
tinterpolated [n]}
Hη [k]}, (12)
where η = πλ(
K2z1λ1λ
X2
X21
)which is simply η = πλ1(K2z1
X2
X21). We now, insert this signal into
the center of the computation window wt [n], thus, we have the diffraction field at the origin.At this point, the complex diffraction data contains the three-dimensional information of theobject. Depending on the depth of the object, only certain parts of the object are seen in focusif the magnitude of this field is imaged. Since the object depth is shallow compared to thereconstruction distance, most of the object is in focus at the origin. We also do not know thediffusiveness of the complex object field. So, we choose to multiply the complex diffractiondata with a random phase. Here, one should be careful while doing this operation since it mightdestroy the three-dimensional information. This can be visualized as putting a diffusive glass in
#171562 - $15.00 USD Received 29 Jun 2012; revised 24 Sep 2012; accepted 24 Sep 2012; published 8 Oct 2012(C) 2012 OSA 22 October 2012 / Vol. 20, No. 22 / OPTICS EXPRESS 24186
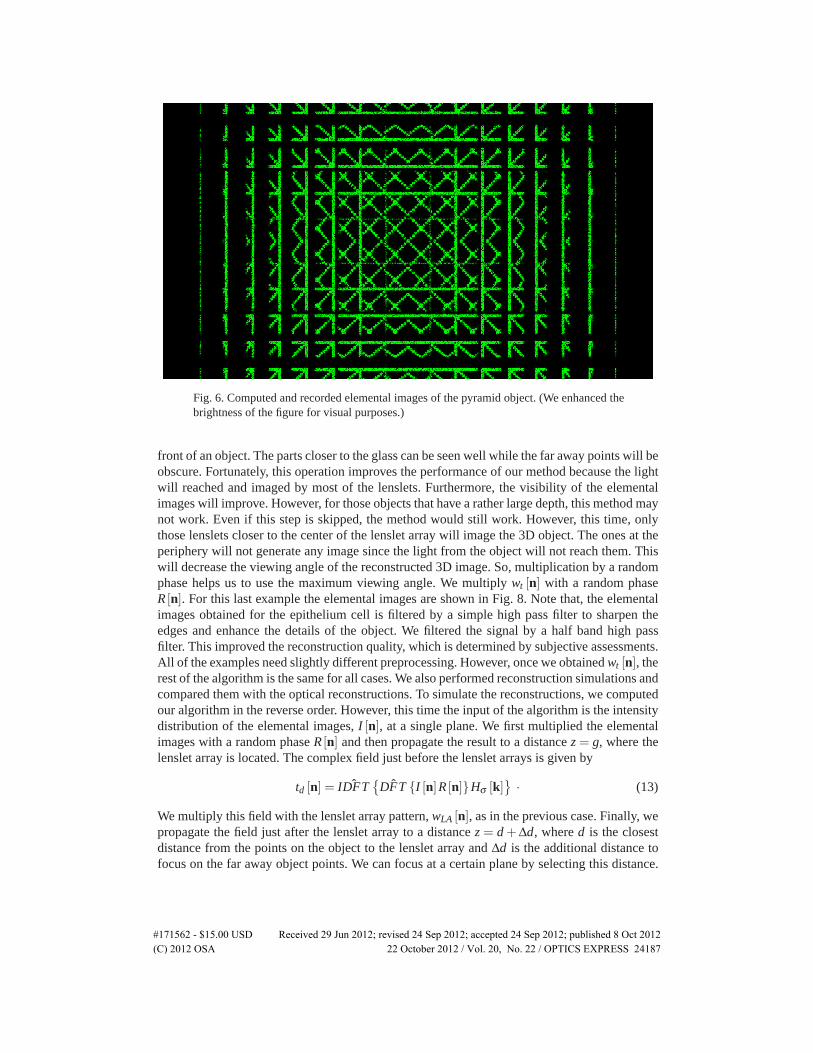
Fig. 6. Computed and recorded elemental images of the pyramid object. (We enhanced thebrightness of the figure for visual purposes.)
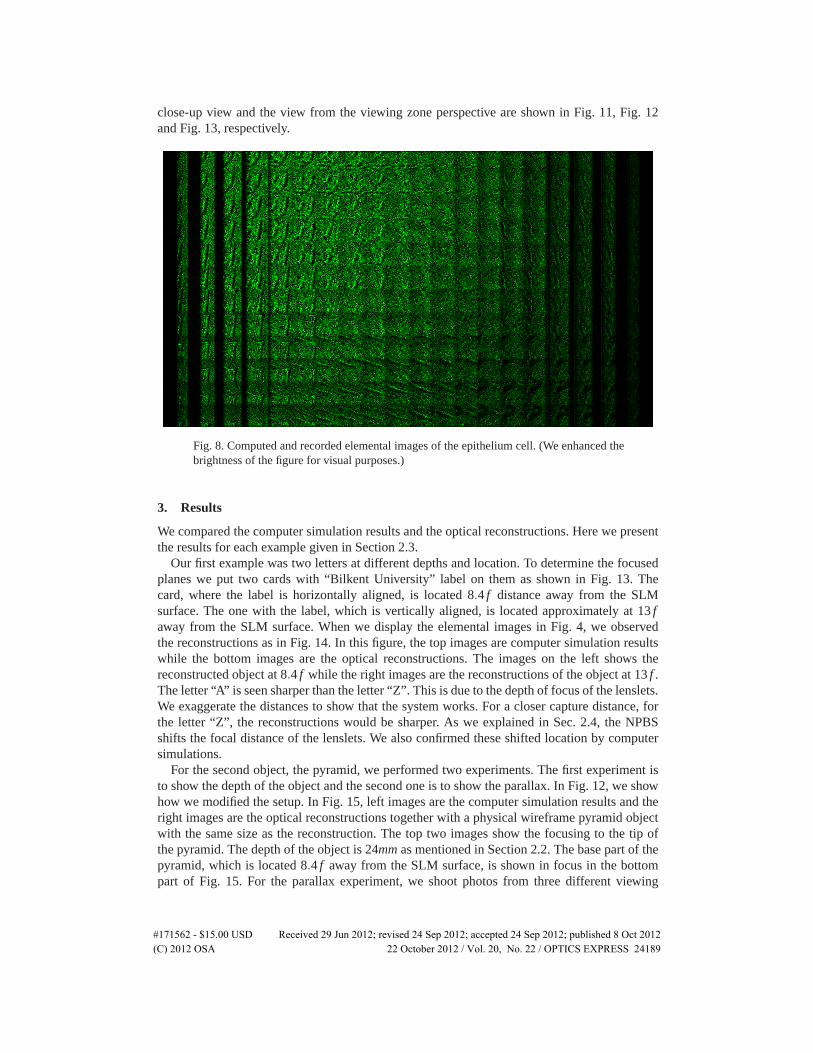
front of an object. The parts closer to the glass can be seen well while the far away points will beobscure. Fortunately, this operation improves the performance of our method because the lightwill reached and imaged by most of the lenslets. Furthermore, the visibility of the elementalimages will improve. However, for those objects that have a rather large depth, this method maynot work. Even if this step is skipped, the method would still work. However, this time, onlythose lenslets closer to the center of the lenslet array will image the 3D object. The ones at theperiphery will not generate any image since the light from the object will not reach them. Thiswill decrease the viewing angle of the reconstructed 3D image. So, multiplication by a randomphase helps us to use the maximum viewing angle. We multiply wt [n] with a random phaseR [n]. For this last example the elemental images are shown in Fig. 8. Note that, the elementalimages obtained for the epithelium cell is filtered by a simple high pass filter to sharpen theedges and enhance the details of the object. We filtered the signal by a half band high passfilter. This improved the reconstruction quality, which is determined by subjective assessments.All of the examples need slightly different preprocessing. However, once we obtained wt [n], therest of the algorithm is the same for all cases. We also performed reconstruction simulations andcompared them with the optical reconstructions. To simulate the reconstructions, we computedour algorithm in the reverse order. However, this time the input of the algorithm is the intensitydistribution of the elemental images, I [n], at a single plane. We first multiplied the elementalimages with a random phase R [n] and then propagate the result to a distance z = g, where thelenslet array is located. The complex field just before the lenslet arrays is given by
td [n] = ˆIDFT{
ˆDFT {I [n]R [n]}Hσ [k]} · (13)
We multiply this field with the lenslet array pattern, wLA [n], as in the previous case. Finally, wepropagate the field just after the lenslet array to a distance z = d +Δd, where d is the closestdistance from the points on the object to the lenslet array and Δd is the additional distance tofocus on the far away object points. We can focus at a certain plane by selecting this distance.
#171562 - $15.00 USD Received 29 Jun 2012; revised 24 Sep 2012; accepted 24 Sep 2012; published 8 Oct 2012(C) 2012 OSA 22 October 2012 / Vol. 20, No. 22 / OPTICS EXPRESS 24187
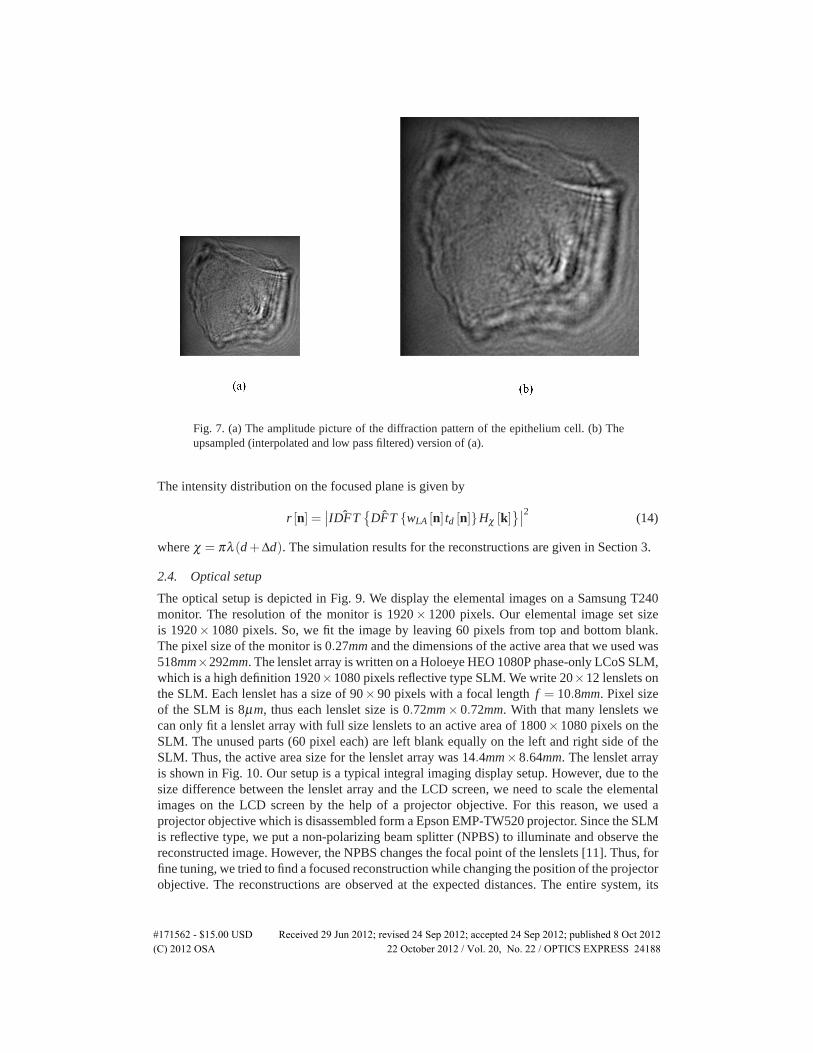
Fig. 7. (a) The amplitude picture of the diffraction pattern of the epithelium cell. (b) Theupsampled (interpolated and low pass filtered) version of (a).
The intensity distribution on the focused plane is given by
r [n] =∣∣ ˆIDFT
{ˆDFT {wLA [n] td [n]}Hχ [k]
}∣∣2 (14)
where χ = πλ (d+Δd). The simulation results for the reconstructions are given in Section 3.
2.4. Optical setup
The optical setup is depicted in Fig. 9. We display the elemental images on a Samsung T240monitor. The resolution of the monitor is 1920× 1200 pixels. Our elemental image set sizeis 1920× 1080 pixels. So, we fit the image by leaving 60 pixels from top and bottom blank.The pixel size of the monitor is 0.27mm and the dimensions of the active area that we used was518mm×292mm. The lenslet array is written on a Holoeye HEO 1080P phase-only LCoS SLM,which is a high definition 1920×1080 pixels reflective type SLM. We write 20×12 lenslets onthe SLM. Each lenslet has a size of 90×90 pixels with a focal length f = 10.8mm. Pixel sizeof the SLM is 8μm, thus each lenslet size is 0.72mm× 0.72mm. With that many lenslets wecan only fit a lenslet array with full size lenslets to an active area of 1800×1080 pixels on theSLM. The unused parts (60 pixel each) are left blank equally on the left and right side of theSLM. Thus, the active area size for the lenslet array was 14.4mm×8.64mm. The lenslet arrayis shown in Fig. 10. Our setup is a typical integral imaging display setup. However, due to thesize difference between the lenslet array and the LCD screen, we need to scale the elementalimages on the LCD screen by the help of a projector objective. For this reason, we used aprojector objective which is disassembled form a Epson EMP-TW520 projector. Since the SLMis reflective type, we put a non-polarizing beam splitter (NPBS) to illuminate and observe thereconstructed image. However, the NPBS changes the focal point of the lenslets [11]. Thus, forfine tuning, we tried to find a focused reconstruction while changing the position of the projectorobjective. The reconstructions are observed at the expected distances. The entire system, its
#171562 - $15.00 USD Received 29 Jun 2012; revised 24 Sep 2012; accepted 24 Sep 2012; published 8 Oct 2012(C) 2012 OSA 22 October 2012 / Vol. 20, No. 22 / OPTICS EXPRESS 24188
close-up view and the view from the viewing zone perspective are shown in Fig. 11, Fig. 12and Fig. 13, respectively.
Fig. 8. Computed and recorded elemental images of the epithelium cell. (We enhanced thebrightness of the figure for visual purposes.)
3. Results
We compared the computer simulation results and the optical reconstructions. Here we presentthe results for each example given in Section 2.3.
Our first example was two letters at different depths and location. To determine the focusedplanes we put two cards with “Bilkent University” label on them as shown in Fig. 13. Thecard, where the label is horizontally aligned, is located 8.4 f distance away from the SLMsurface. The one with the label, which is vertically aligned, is located approximately at 13 faway from the SLM surface. When we display the elemental images in Fig. 4, we observedthe reconstructions as in Fig. 14. In this figure, the top images are computer simulation resultswhile the bottom images are the optical reconstructions. The images on the left shows thereconstructed object at 8.4 f while the right images are the reconstructions of the object at 13 f .The letter “A” is seen sharper than the letter “Z”. This is due to the depth of focus of the lenslets.We exaggerate the distances to show that the system works. For a closer capture distance, forthe letter “Z”, the reconstructions would be sharper. As we explained in Sec. 2.4, the NPBSshifts the focal distance of the lenslets. We also confirmed these shifted location by computersimulations.
For the second object, the pyramid, we performed two experiments. The first experiment isto show the depth of the object and the second one is to show the parallax. In Fig. 12, we showhow we modified the setup. In Fig. 15, left images are the computer simulation results and theright images are the optical reconstructions together with a physical wireframe pyramid objectwith the same size as the reconstruction. The top two images show the focusing to the tip ofthe pyramid. The depth of the object is 24mm as mentioned in Section 2.2. The base part of thepyramid, which is located 8.4 f away from the SLM surface, is shown in focus in the bottompart of Fig. 15. For the parallax experiment, we shoot photos from three different viewing
#171562 - $15.00 USD Received 29 Jun 2012; revised 24 Sep 2012; accepted 24 Sep 2012; published 8 Oct 2012(C) 2012 OSA 22 October 2012 / Vol. 20, No. 22 / OPTICS EXPRESS 24189
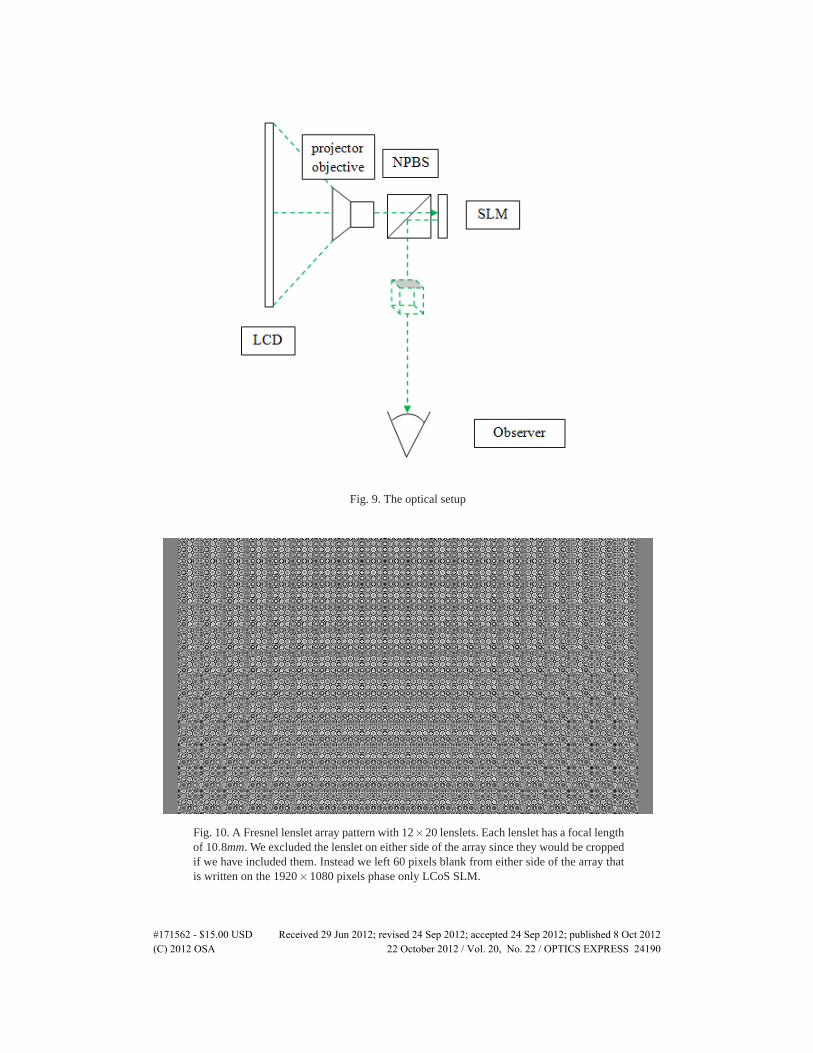
Fig. 9. The optical setup
Fig. 10. A Fresnel lenslet array pattern with 12×20 lenslets. Each lenslet has a focal lengthof 10.8mm. We excluded the lenslet on either side of the array since they would be croppedif we have included them. Instead we left 60 pixels blank from either side of the array thatis written on the 1920×1080 pixels phase only LCoS SLM.
#171562 - $15.00 USD Received 29 Jun 2012; revised 24 Sep 2012; accepted 24 Sep 2012; published 8 Oct 2012(C) 2012 OSA 22 October 2012 / Vol. 20, No. 22 / OPTICS EXPRESS 24190
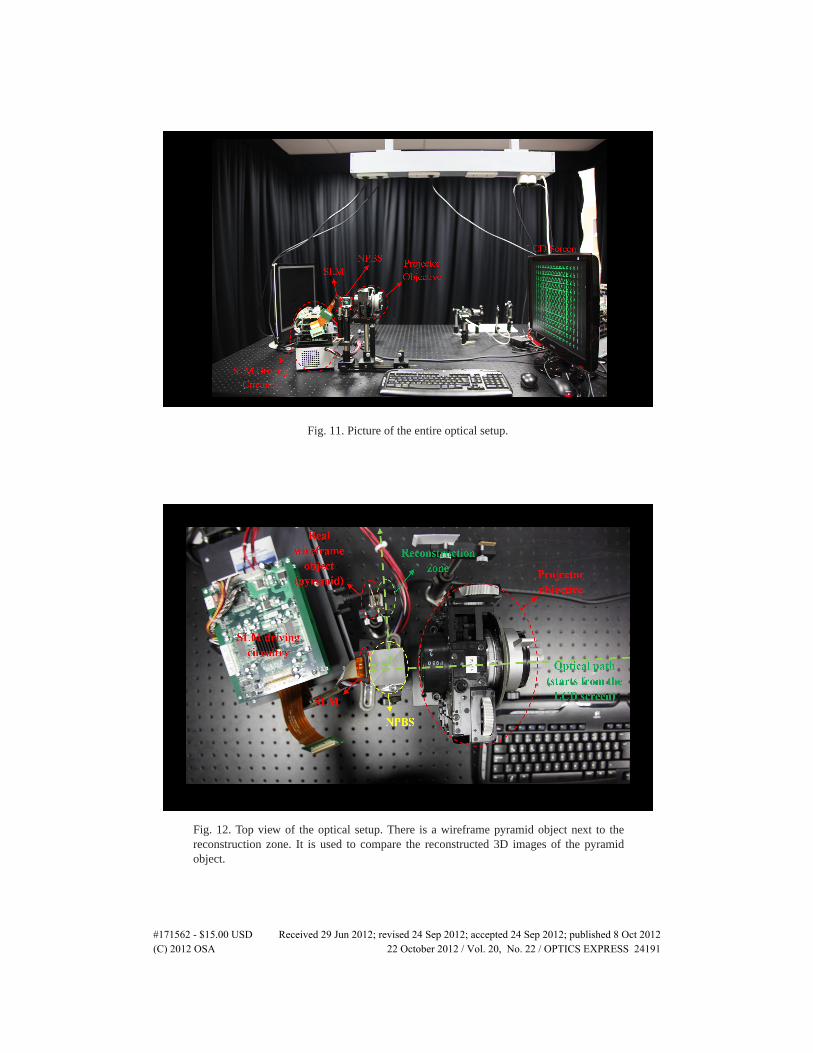
Fig. 11. Picture of the entire optical setup.
Fig. 12. Top view of the optical setup. There is a wireframe pyramid object next to thereconstruction zone. It is used to compare the reconstructed 3D images of the pyramidobject.
#171562 - $15.00 USD Received 29 Jun 2012; revised 24 Sep 2012; accepted 24 Sep 2012; published 8 Oct 2012(C) 2012 OSA 22 October 2012 / Vol. 20, No. 22 / OPTICS EXPRESS 24191
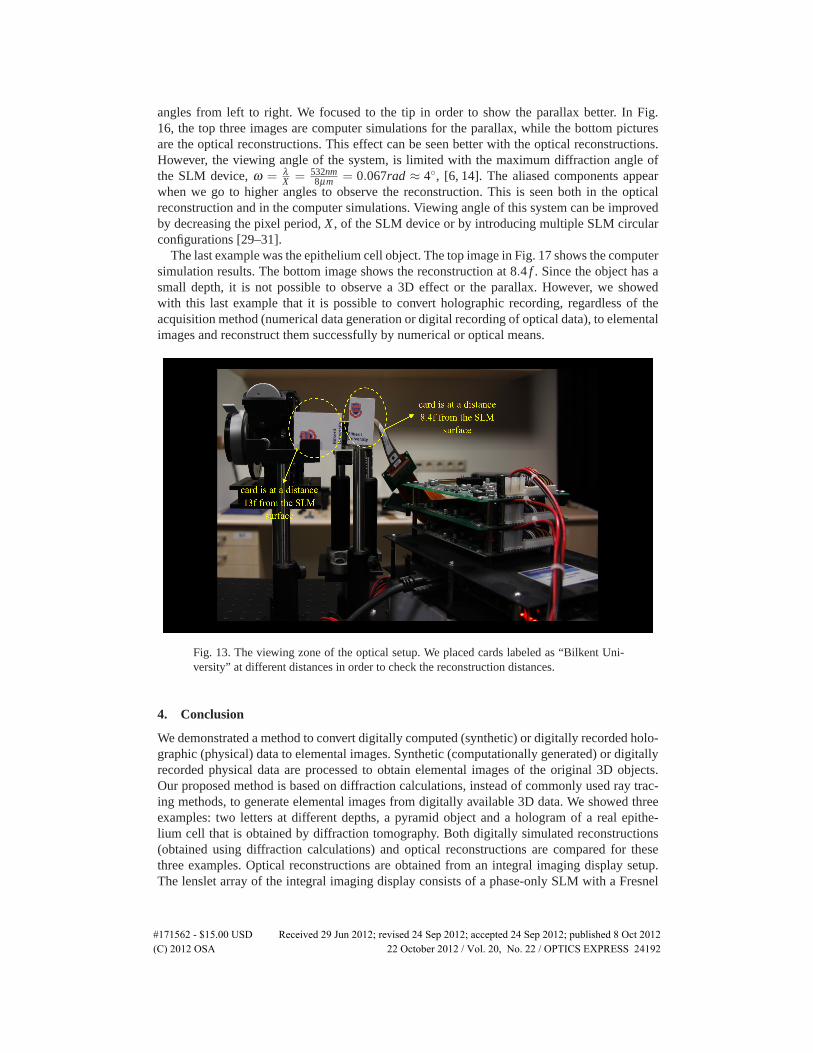
angles from left to right. We focused to the tip in order to show the parallax better. In Fig.16, the top three images are computer simulations for the parallax, while the bottom picturesare the optical reconstructions. This effect can be seen better with the optical reconstructions.However, the viewing angle of the system, is limited with the maximum diffraction angle ofthe SLM device, ω = λ
X = 532nm8μm = 0.067rad ≈ 4◦, [6, 14]. The aliased components appear
when we go to higher angles to observe the reconstruction. This is seen both in the opticalreconstruction and in the computer simulations. Viewing angle of this system can be improvedby decreasing the pixel period, X , of the SLM device or by introducing multiple SLM circularconfigurations [29–31].
The last example was the epithelium cell object. The top image in Fig. 17 shows the computersimulation results. The bottom image shows the reconstruction at 8.4 f . Since the object has asmall depth, it is not possible to observe a 3D effect or the parallax. However, we showedwith this last example that it is possible to convert holographic recording, regardless of theacquisition method (numerical data generation or digital recording of optical data), to elementalimages and reconstruct them successfully by numerical or optical means.
Fig. 13. The viewing zone of the optical setup. We placed cards labeled as “Bilkent Uni-versity” at different distances in order to check the reconstruction distances.
4. Conclusion
We demonstrated a method to convert digitally computed (synthetic) or digitally recorded holo-graphic (physical) data to elemental images. Synthetic (computationally generated) or digitallyrecorded physical data are processed to obtain elemental images of the original 3D objects.Our proposed method is based on diffraction calculations, instead of commonly used ray trac-ing methods, to generate elemental images from digitally available 3D data. We showed threeexamples: two letters at different depths, a pyramid object and a hologram of a real epithe-lium cell that is obtained by diffraction tomography. Both digitally simulated reconstructions(obtained using diffraction calculations) and optical reconstructions are compared for thesethree examples. Optical reconstructions are obtained from an integral imaging display setup.The lenslet array of the integral imaging display consists of a phase-only SLM with a Fresnel
#171562 - $15.00 USD Received 29 Jun 2012; revised 24 Sep 2012; accepted 24 Sep 2012; published 8 Oct 2012(C) 2012 OSA 22 October 2012 / Vol. 20, No. 22 / OPTICS EXPRESS 24192
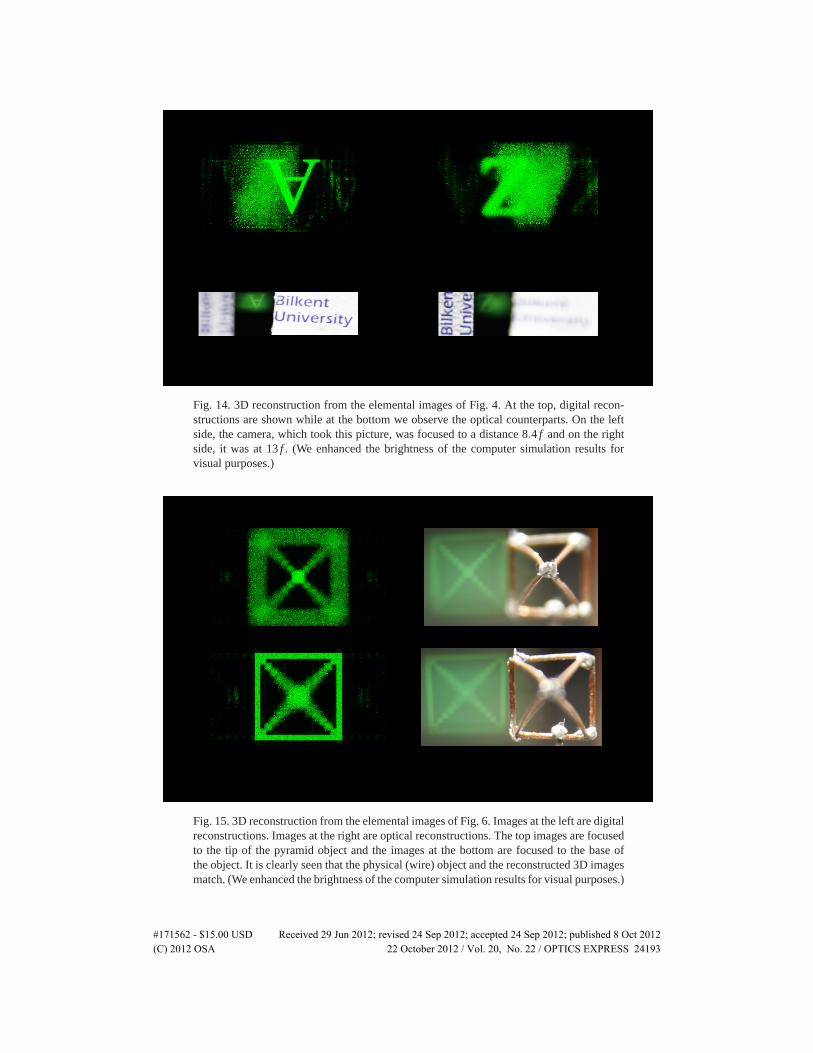
Fig. 14. 3D reconstruction from the elemental images of Fig. 4. At the top, digital recon-structions are shown while at the bottom we observe the optical counterparts. On the leftside, the camera, which took this picture, was focused to a distance 8.4 f and on the rightside, it was at 13 f . (We enhanced the brightness of the computer simulation results forvisual purposes.)
Fig. 15. 3D reconstruction from the elemental images of Fig. 6. Images at the left are digitalreconstructions. Images at the right are optical reconstructions. The top images are focusedto the tip of the pyramid object and the images at the bottom are focused to the base ofthe object. It is clearly seen that the physical (wire) object and the reconstructed 3D imagesmatch. (We enhanced the brightness of the computer simulation results for visual purposes.)
#171562 - $15.00 USD Received 29 Jun 2012; revised 24 Sep 2012; accepted 24 Sep 2012; published 8 Oct 2012(C) 2012 OSA 22 October 2012 / Vol. 20, No. 22 / OPTICS EXPRESS 24193
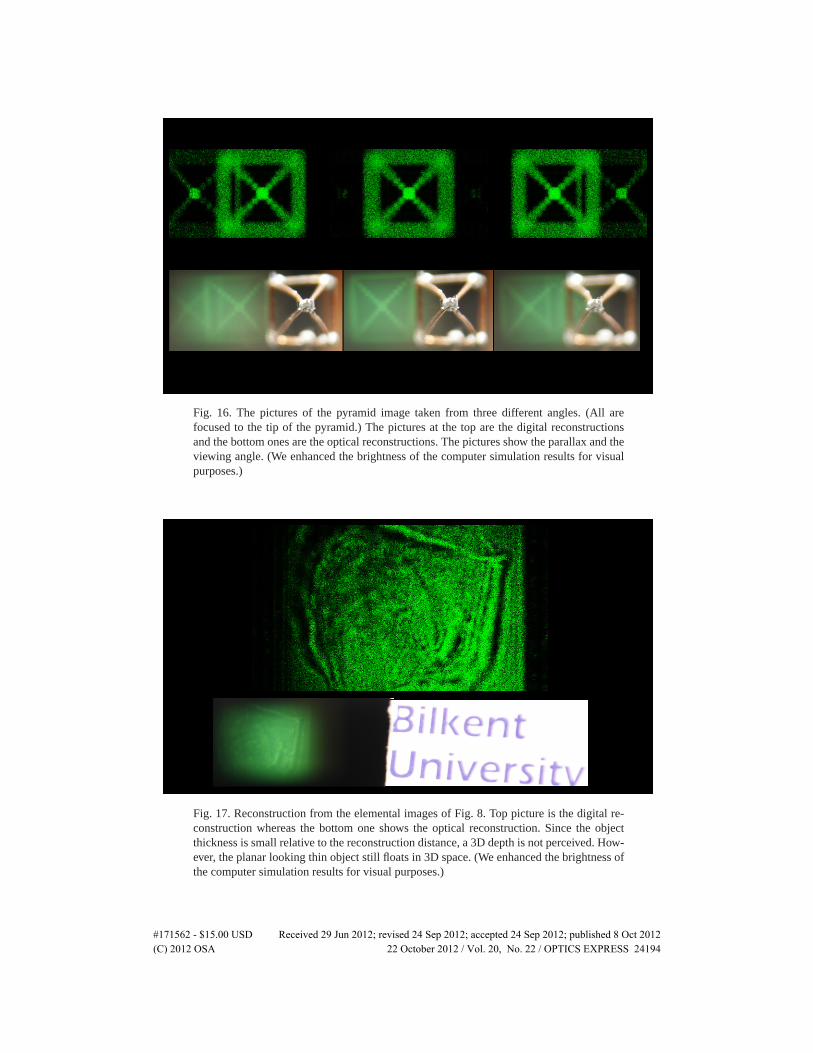
Fig. 16. The pictures of the pyramid image taken from three different angles. (All arefocused to the tip of the pyramid.) The pictures at the top are the digital reconstructionsand the bottom ones are the optical reconstructions. The pictures show the parallax and theviewing angle. (We enhanced the brightness of the computer simulation results for visualpurposes.)
Fig. 17. Reconstruction from the elemental images of Fig. 8. Top picture is the digital re-construction whereas the bottom one shows the optical reconstruction. Since the objectthickness is small relative to the reconstruction distance, a 3D depth is not perceived. How-ever, the planar looking thin object still floats in 3D space. (We enhanced the brightness ofthe computer simulation results for visual purposes.)
#171562 - $15.00 USD Received 29 Jun 2012; revised 24 Sep 2012; accepted 24 Sep 2012; published 8 Oct 2012(C) 2012 OSA 22 October 2012 / Vol. 20, No. 22 / OPTICS EXPRESS 24194

lenslet array pattern written on it. The optical reconstructions provide satisfactory results. Thefirst example gives an idea about the depth of focus of the digital lenslet array. We showed withthe synthetic 3D pyramid object example that the display provides a good parallax, which islimited by the maximum diffraction angle of the SLM. We also compared the reconstructionwith a physical wire-frame pyramid object and it confirmed that our system works well withinits physical limitations. We also showed that we can use digitally captured optical diffractiondata to computationally generate a set of elemental images and reconstruct the 3D image of thecell from these elemental images on a physical integral imaging display. Our proposed displaysystem and the method for obtaining elemental images make it possible to display holographicrecordings on an integral imaging display setup.
Acknowledgments
This work is supported by the European Commission within FP7 under grant 216105 with theacronym Real 3D. We thank Isabelle Bergoend and Christian Depeursinge from EPFL for theepithelium cell diffraction data they provided. A. Ozgur YONTEM thanks TUBITAK for thescholarship he received during his doctoral studies.
#171562 - $15.00 USD Received 29 Jun 2012; revised 24 Sep 2012; accepted 24 Sep 2012; published 8 Oct 2012(C) 2012 OSA 22 October 2012 / Vol. 20, No. 22 / OPTICS EXPRESS 24195