institutional presentation 2 q13 v3
DESCRIPTION
TRANSCRIPT

R:152
G:216
B:218
R:80
G:179
B:207
R:216
G:181
B:163
R:177
G:181
B:121
R:119
G:119
B:119
R:217
G:217
B:217
R:160
G:160
B:160
R:208
G:240
B:232
| Apresentação do Roadshow
1
As of June, 2013 August, 2013

R:152
G:216
B:218
R:80
G:179
B:207
R:216
G:181
B:163
R:177
G:181
B:121
R:119
G:119
B:119
R:217
G:217
B:217
R:160
G:160
B:160
R:208
G:240
B:232
Statements regarding the Company’s future business perspectives and projections of operational and
financial results are merely estimates and projections, and as such they are subject to different risks and
uncertainties, including, but not limited to, market conditions, domestic and foreign performance in general
and in the Company’s line of business.
These risks and uncertainties cannot be controlled or sufficiently predicted by the Company management
and may significantly affect its perspectives, estimates, and projections. Statements on future
perspectives, estimates, and projections do not represent and should not be construed as a guarantee of
performance. The operational information contained herein, as well as information not directly derived from
the financial statements, have not been subject to a special review by the Company’s independent
auditors and may involve premises and estimates adopted by the management.
2
Disclaimer

R:152
G:216
B:218
R:80
G:179
B:207
R:216
G:181
B:163
R:177
G:181
B:121
R:119
G:119
B:119
R:217
G:217
B:217
R:160
G:160
B:160
R:208
G:240
B:232
| Company overview

R:152
G:216
B:218
R:80
G:179
B:207
R:216
G:181
B:163
R:177
G:181
B:121
R:119
G:119
B:119
R:217
G:217
B:217
R:160
G:160
B:160
R:208
G:240
B:232 .1 Platform of brands of reference
Arezzo&Co is the leading Company in the footwear and accessories sector through its platform of Top of Mind brands
1
4

R:152
G:216
B:218
R:80
G:179
B:207
R:216
G:181
B:163
R:177
G:181
B:121
R:119
G:119
B:119
R:217
G:217
B:217
R:160
G:160
B:160
R:208
G:240
B:232 .2 Company overview
Arezzo&Co is the reference in the Brazilian retail sector and has a unique positioning combining growth with high cash generation
1
5
Notes:
1. LTM as of June, 2013.
2. Refers to the Brazilian women footwear market (source: Euromonitor, IBGE and Company estimates) . Estimated for 2011.
Leading company
in the footwear
and accessories
sector with
presence in all
Brazilian states
Controlling
shareholders are
the reference in
the sector
Development of
collections with
efficient supply
chain
Asset light: high
operational
efficiency
Strong cash
generation and
high growth
9.8 million pairs of shoes (1)
591 thousand handbags (1)
2,842 points of sale
12% market share (2)
More than 40 years of
experience in the sector
Wide recognition
~11,500 models created
per year
Lead time of 40 days
7 to 9 launches per year
90% outsourced production
ROIC of 32.7% in 2Q13
2,014 employees
Net revenues CAGR:
33.2% (2007- 2Q13¹)
Net Profit CAGR: 39.6%
(2007- 2Q13¹)
Increased operating
leverage

R:152
G:216
B:218
R:80
G:179
B:207
R:216
G:181
B:163
R:177
G:181
B:121
R:119
G:119
B:119
R:217
G:217
B:217
R:160
G:160
B:160
R:208
G:240
B:232
Founded in 1972
Focused on brand and
product
Consolidation of industrial
business model located in
Minas Gerais
1.5 mm pairs per year
and 2,000 employees
Focus on retail
R&D and production
outsourcing on Vale dos Sinos
- RS
Franchises expansion
Specific brands for each
segment
Expansion of distribution
channels
Efficient supply chain
First store
Fast Fashion
concept
Launch of the
first design with
national success
+
Schutz launch
Launch of
new brands
Merger
Commercial operations
centralized in São Paulo
Strategic Partnership
(November 2007)
Industry Reference Foundation and structuring Industrial Era Corporate Era Retail Era
2012 and 2013 70‟s 80‟s 90‟s 00‟s
Opening of the first
shoe factory
Opening of the flagship
store at Oscar Freire
.3 Successful track record of
entrepreneurship
The right changes at the right time accelerated the Company's development 1
Consolidate
leadership
position
Initial Public Offering
(February 2011)
6

R:152
G:216
B:218
R:80
G:179
B:207
R:216
G:181
B:163
R:177
G:181
B:121
R:119
G:119
B:119
R:217
G:217
B:217
R:160
G:160
B:160
R:208
G:240
B:232
Post-offering
.4 Shareholder structure 1
Notes:
1. Arezzo&Co capital stock is composed of 88,637,034 common shares, all nominative, book-entry shares with no par value.
2. Including Stock Option Plan – Arezzo&Co’s executives
Shareholder structure as of September, 2013. 7
52.4% 47.6%
Birman family Others
1 Management ²
0.9%
Float
46.7%

R:152
G:216
B:218
R:80
G:179
B:207
R:216
G:181
B:163
R:177
G:181
B:121
R:119
G:119
B:119
R:217
G:217
B:217
R:160
G:160
B:160
R:208
G:240
B:232
8
.5 Culture & Management
1 01 That which is not transparent should not be done.
02 Always be true, so that at some point you are not false in your job. Always be authentic.
03 Clearly negotiate your goals and responsibilities, and consider compliance as a requirement for
continuity.
04 Do not uncover problems only. Blaming others will never be the solution. Take risks, propose
solutions. If you disagree with something, act!
05 Formalize everything, even in an informal way.
06 Always be flexible. Always be willing and ready for changes.
07 Goals met are, at least, the basis for the next goal.
08 Unite we stand! Divergences are constructive, conflicts are destructive.
09 A humble stance: the key to our success.
10 Enjoy. Like. Get involved. And always be happy!
Principles of success at Arezzo&Co:
2154

R:152
G:216
B:218
R:80
G:179
B:207
R:216
G:181
B:163
R:177
G:181
B:121
R:119
G:119
B:119
R:217
G:217
B:217
R:160
G:160
B:160
R:208
G:240
B:232 .6 Strong platform of brands
Strong platform of brands, aimed at specific target markets, enables the Company to capture growth from different income segments
1
9
Notes:
1. Points of sales (2Q13); O = Owned Stores; F = Franchised Stores; MB = Multi-brand Stores; EX = Exports
2. % of each brand gross revenues (FY 2012)
3. 2Q13 (LTM) gross revenues, internal market only: does not include other revenues (not generated by the 4 brands)
4. % total (2Q13 LTM) gross revenues
Trendy
New
Easy to wear
Eclectic
Fashion
Up to date
Bold
Provocative
16 - 60 years old 18 - 40 years old
R$ 305.00/pair
R$ 705.9 million R$ 422.9 million
Pop
Flat shoes
Affordable
Colorful
12 - 60 years old
R$ 99.00/pair
R$ 36.9 million
Design
Exclusivity
Identity
Seduction
R$ 960.00/pair
R$ 4.7 million
20 - 45 years old
60.3% 36.1% 3.2% 0.4%
Brands
profile
Female
target
market
Sales
Volume 3
% Gross
Revenues 4
Retail price
point
Foundation 1972 1995 2008 2009
MB
7
O
2
O
17
F
332
MB
994
R$ 189.00/pair
O
28
F
29
MB
1,509
Dis
trib
uti
on
ch
an
nel
1
POS 1
%
gross
rev.2
72% 15% 12% 7% 49% 36%
EX
14
1%
EX
132
8%
EX
45
49% 9% 42%
MB
858
O
9
EX
5
46% 53% 1%

R:152
G:216
B:218
R:80
G:179
B:207
R:216
G:181
B:163
R:177
G:181
B:121
R:119
G:119
B:119
R:217
G:217
B:217
R:160
G:160
B:160
R:208
G:240
B:232 .7 Multiple distribution channels
1
10
Flexible platform through three distribution channels with differentiated strategies, maximizing the Company's profitability
Gross Revenues per Channel
56 owned stores
being 7 Flagship
stores
Reach about 1,161
cities and 2,425
multi-brands
361 franchises in
more than 160 cities
Broad distribution in
every Brazilian state
Gross Revenue Breakdown – (R$ mm)¹
Franchises Multi-brands Owned stores Exports ² Total
Notes:
1. 2Q13 (LTM) gross revenues
2. Also includes other revenues in the domestic market
46% 25% 23% 6% 100%
554
304
283
63 2
1,204

R:152
G:216
B:218
R:80
G:179
B:207
R:216
G:181
B:163
R:177
G:181
B:121
R:119
G:119
B:119
R:217
G:217
B:217
R:160
G:160
B:160
R:208
G:240
B:232
| Business model

R:152
G:216
B:218
R:80
G:179
B:207
R:216
G:181
B:163
R:177
G:181
B:121
R:119
G:119
B:119
R:217
G:217
B:217
R:160
G:160
B:160
R:208
G:240
B:232
Management
BRANDS OF REFERENCE
Customer focus: we are at the forefront of Brazilian women fashion and design
Multi-channel Sourcing & Logistics Communication &
Marketing
SEASONED
MANAGEMENT
TEAM WITH
PERFORMANCE
BASED INCENTIVES
NATIONWIDE
DISTRIBUTION
STRATEGY
EFFICIENT
SUPPLY CHAIN
SOLID MARKETING
AND
COMMUNICATION
PROGRAM
ABILITY TO
INNOVATE
R&D
1 2 3 4 5
12
Unique business model in Brazil
2

R:152
G:216
B:218
R:80
G:179
B:207
R:216
G:181
B:163
R:177
G:181
B:121
R:119
G:119
B:119
R:217
G:217
B:217
R:160
G:160
B:160
R:208
G:240
B:232 .1 Ability to Innovate
We produce 7 to 9 collections per year 2 I. Research
Creation: 11,500 SKUs / year
II. Development III. Sourcing IV. Delivery
Arezzo&Co fulfills the various aspirations of women, delivering on average 5 new models per day, allowing for consistent desire-driven purchases
Available for selection:
63% of SKUs created / year
13
Stores: 52% of SKUs created /
year
Creation
Launch
Orders
Production
Delivery
Normal sale
Discount sale
Winter I Winter II Winter III Summer I Summer II Summer III Summer IV
Activities JAN FEV MAR APR MAY JUN JUL AUG SEP OCT NOV DEC

R:152
G:216
B:218
R:80
G:179
B:207
R:216
G:181
B:163
R:177
G:181
B:121
R:119
G:119
B:119
R:217
G:217
B:217
R:160
G:160
B:160
R:208
G:240
B:232
CRM – VIP sales
In-store events – PA
Stylists Fashion Advisors
.2 Broad media plan
2
14
The brand has an integrated and expressive communication strategy, from the creation
of campaigns to the point of sales
Strong presence in printed media
85 inserts in printed media in 170 pages in 2012 (32 million readers) Over 300 exhibition in fashion editorials in 1S13
Digital communication
Presence in electronic media and television
Demi Moore
Seasonal showroom in Los Angeles near
the Red Carpet Season
Celebrity Endorsement Marketing Events
830k accesses to site/month
(120k monthly access to Schutz‟s Blog)
Average navigation time: 8 minutes
Gisele Bündchen Blake Lively
+750 exhibition on TV e 150 exhibition in cinema in 2012 + 80 million impact
* Source: Indexsocial/ Agência Espalhe, 2013
Over 3 mm followers/ fans: Facebook,
Instagram and Twitter (all 4 Brands)
Arezzo is leader in interactions*

R:152
G:216
B:218
R:80
G:179
B:207
R:216
G:181
B:163
R:177
G:181
B:121
R:119
G:119
B:119
R:217
G:217
B:217
R:160
G:160
B:160
R:208
G:240
B:232 .2 Communication & marketing program
reflected in every aspect of the stores
Stores constantly modified to incorporate the concept of each new collection, creating desire-driven purchases
2
15
All visual communication at stores is monitored and updated simultaneously throughout Brazil for each new collection
Flagship stores Store layout & visual merchandising
POS materials (catalogs, packaging, among others)

R:152
G:216
B:218
R:80
G:179
B:207
R:216
G:181
B:163
R:177
G:181
B:121
R:119
G:119
B:119
R:217
G:217
B:217
R:160
G:160
B:160
R:208
G:240
B:232
Distinguished storefront
.2 Atmosphere of stores: differentiated
concepts for each brand 2
16
Verão – Flagship Oscar Freire
Inverno – Flagship Oscar Freire
Visual merchandising:
Updates at low cost investment
Brings relevant information from
each collection to stores’ level
3 main updates per year
Chameleon project: constant
modification to incorporate the new
collection’s concept
Vídeo Wall
Closet Essentials
Niches and lighting
Jackets and accessories
Campaigns and marketing actions
Preeminence for products
Differentiated products
Exposure of a large variety of
products
Selling area inventory: lower
necessity of area for storage
Atmosphere of a jewelry store
Private shop experience
Focus on exclusivity, design and
highly selected materials
Wall display
Combos
Each theme is disposed in different niches
Accessories Sophisticated lighting Storage

R:152
G:216
B:218
R:80
G:179
B:207
R:216
G:181
B:163
R:177
G:181
B:121
R:119
G:119
B:119
R:217
G:217
B:217
R:160
G:160
B:160
R:208
G:240
B:232
Reception: 100,000 units/ day
Storage: 100,000 units/ day
Picking: 150,000 units/ day
Distribution: 200,000 units/ day
.3 Flexible production process…
2
17
Production speed, flexibility and scalability to ensure Arezzo&Co‟s expected growth based on asset light model
Arezzo’s scale and structure gives flexibility to source a large number
of SKU’s from various factories on a short time frame at competitive
prices
Owned factory with capacity to produce 1.1 million pairs annually
and strong relationship with Vale dos Sinos production cluster as
the main outsourcing region
Sourcing Model Gains of scale
Joint purchases Certification and auditing of suppliers
In-house certification and auditing ensure quality and punctuality
(ISO 9001 certification in 2008)
Coordination of material purchase jointly with shoe, handbag and
accessories’ suppliers
New Distribution Center Sourcing model – 90% of production outsourced
Consolidation and improvement of distribution in
national scale
1 2
3 4
10,2%
89,8%
AREZZO&CO OWNED FACTORY
OTHERS

R:152
G:216
B:218
R:80
G:179
B:207
R:216
G:181
B:163
R:177
G:181
B:121
R:119
G:119
B:119
R:217
G:217
B:217
R:160
G:160
B:160
R:208
G:240
B:232 .4 Large capillarity and scale of store
chain 2
18
Brand Average
size (m2)
Net Revenue/ m2
(R$ 000s)
Total
Stores 1,2
67 324 399
111 214 638
1,650 10 214
1,030 6 368
234 13 206
Mono-brand store chain with high capillarity, reaching more than 160 cities and well-positioned among the retail companies Size and average sales per mono-brand stores - 2012
5
332 franchises +
17 owned stores(i) +
994 multi-brand clients
(i) 4 discount outlet
29 franchises +
28 owned stores(ii) +
1,509 multi-brand clients
(ii)1 discount outlet
Points of sale (2Q13)
TOTAL
9 owned stores
858 multi-brand clients
2 owned store +
7 multi-brand clients
361 franchises6 +
56 owned stores6 +
2,425 multi-brand clients
=2,842 points of sales
Source: IBGE, Companies’ Reports; number of stores according to latest data provided by the Companies Notes: 1. Considers only mono-brand stores of Arezzo and Schutz; 2. For Hering, considers only Hering Store chain stores; 3. 2008 data; 4. Net Revenue (assuming that sales taxes and deduction = 30% of gross revenues); 5. Considers Arezzo + Schutz, except for outlets, handbags’ stores and Schutz franchise; 6. Including export market
GDP³: 18%
A&C¹: 17%
GDP³: 55%
A&C¹: 57%
GDP³: 15%
A&C¹: 15%
GDP³: 7%
A&C¹: 7%
GDP³: 5%
A&C¹: 4%
57 sq m
85 sq m
80 sq m
Points of sale – average size: new stores are
increasing network average size
2010 2011 new stores 2012 new stores 2013 new stores
80 sq m

R:152
G:216
B:218
R:80
G:179
B:207
R:216
G:181
B:163
R:177
G:181
B:121
R:119
G:119
B:119
R:217
G:217
B:217
R:160
G:160
B:160
R:208
G:240
B:232 .4 ...through owned stores…
Capturing value from the chain while developing retail know how and brands‟ visibility
2 Flagship Stores
19
Arezzo – Iguatemi / SP
Schutz – Oscar Freire/ SP
Anacapri – Eldorado/ SP
Greater brand awareness coupled with operational efficiencies
Clustering higher productivity stores in main areas (mainly SP and RJ) improving
operational efficiency and profitability:
Direct costumers interaction develops retail competences which are also reflected at
franchised stores
Flagship stores ensure greater visibility and reinforce brand image
R$ 3,289M
R$ 5,119M
Ow
ned
Fra
nchis
e
Annual Average
Sales per Store
2012
Total sales area and # of owned stores (sq. m)
# owned Stores
Arezzo – Oscar Freire/ SP
Schutz – Morumbi/ SP
88% 91% 81% 77%
80% 78% 80%
12% 9%
19%
23%
20%
22% 20%
2007 2008 2009 2010 2011 2012 2Q13
Flagship
Standard store
1,044
1,369 2,067
2,967
4,686
5,897 5,842
6 10
21 29
45
57 56

R:152
G:216
B:218
R:80
G:179
B:207
R:216
G:181
B:163
R:177
G:181
B:121
R:119
G:119
B:119
R:217
G:217
B:217
R:160
G:160
B:160
R:208
G:240
B:232
Structure applied to retail in order to achieve better sales and margin results as well as integrating and connecting all monobrand stores‟ back office
2
20
.4 … based on a retail oriented
structure...
Strong focus on Franchise & Owned Store performance
• All sales team (4000+) get connected through national internet broadcast for 3 Sales Conferences per year, creating an aligned sales pitch and great sense of motivation before each season
• Large service program to assist franchisees on sales and profitability goals
• Recurring training programs in products, fashion trends, sales techniques, store management, IT, among others
• Strong visual merchandising, trade marketing and ambiance investments and training

R:152
G:216
B:218
R:80
G:179
B:207
R:216
G:181
B:163
R:177
G:181
B:121
R:119
G:119
B:119
R:217
G:217
B:217
R:160
G:160
B:160
R:208
G:240
B:232
Intense retail training
Ongoing support: average of 6 stores/ consultant and average of
22 visits per store/ year
Strong relationship with and ongoing support to franchisee
IT integration with our franchises amount 100%
As mono-brand stores, franchises reinforce the branding in each
city they are located
2
4 or more
franchises
1 franchise
2 franchises
3 franchises
49%
10%
27%
15%
.4 …with efficient management of the
franchise network...
Model allows rapid expansion with little invested capital by Arezzo&Co and high profitability to franchisees Successful Partnership: “Win – Win” Franchise Concentration per Operator
100% of on-time payments
96% satisfaction of franchises1
Excellency in Franchising Award in the last 8 years (ABF)
Best Franchise in Brazil (2005 and 2012) and in the sector for 7 years since 2004
(# of Franchisees by # of Franchises)
Notes: 1H13 data
1. 96% of the current franchisees indicated they would be interested in opening a
franchise if they did not already have one
2. Annual sales of R$ 3,3 million + average initial investment of R$ 900 thousand +
working capital of R$ 600 thousand
21
5-year contract and average payback of 40 months2

R:152
G:216
B:218
R:80
G:179
B:207
R:216
G:181
B:163
R:177
G:181
B:121
R:119
G:119
B:119
R:217
G:217
B:217
R:160
G:160
B:160
R:208
G:240
B:232 .4 ...and of the multi-brand stores
2
Multi-brand stores
22
Multi-brand stores‟ Gross Revenue¹ LTM Improved distribution and brand visibility Greater brand capillarity
Presence in over 1,161 cities
Rapid expansion at low investment and risk
Main Focus: share of wallet
Owner’s loyalty
Schutz Club – Relationship program that gives
advantages to the 50 Top Multi-brand stores, such as
better products display, training and awards to the best
sales teams.
Important sales channel for smaller cities
Sales team optimization: internal team and commissioned sales
representatives
Multi-brand stores widen the distribution capillarity and the brands‟ visibility, resulting in a strong retail footprint
Notes:
1. Domestic market only LTM
255.9
303.6
2,224
2,425
2000
2050
2100
2150
2200
2250
2300
2350
2400
2450
2500
210.000
220.000
230.000
240.000
250.000
260.000
270.000
280.000
290.000
300.000
2Q12 LTM 2Q13 LTM
Gross Revenue (R$ mn) # Stores
Multi-brand stores

R:152
G:216
B:218
R:80
G:179
B:207
R:216
G:181
B:163
R:177
G:181
B:121
R:119
G:119
B:119
R:217
G:217
B:217
R:160
G:160
B:160
R:208
G:240
B:232
Years
at Arezzo
Years of
experience
.5 Seasoned and professional
management team 2
Years
at Arezzo
Years of
experience Name
Title
Highly qualified management team
Stock option plan for key executives
Performance based compensation package for all employees
Independent business units leveraged on a single shared service structure: Industrial, Logistics, Financial and HR
Alexandre Birman
CEO
Claudia Narciso
Arezzo
David Python
Schutz
Yumi Chibusa
Anacapri
Milena Penteado
Alexandre Birman
Thiago Borges
CFO and Investor Relations Officer 18
14
2
18
24
10
5 10
5 15
5 13
Schutz
David Python
Supply Chain/
Sourcing
Cisso Klaus
CFO
Thiago Borges
CTO
Kurt Richter
HR
Raquel Carneiro
Marco Coelho
Internal Auditing
Arezzo
Claudia Narciso
Alexandre Birman
Anacapri
Yumi Chibusa
Alexandre
Birman
Milena Penteado
23
Name
Title
Kurt Ritchter
Director – CTO
Cisso Klaus
Director – Supply Chain/ Sourcing
Marco Coelho
Director – Internal Auditing
Raquel Carneiro
Director – HR
11
9
30
3
32
47
41
13
Maicon Americo
Director – Commercial 1 20
Commercial
Maicon Americo
Independent business units

R:152
G:216
B:218
R:80
G:179
B:207
R:216
G:181
B:163
R:177
G:181
B:121
R:119
G:119
B:119
R:217
G:217
B:217
R:160
G:160
B:160
R:208
G:240
B:232 .6 Corporate governance
2
24
Welerson Cavalieri
Risk, Audit and Finance Committee
Juliana Rozenbaum (Coordinator)
José Bolonha (Coordinator)
Committees
Strategy Committee People Committee
Members:
Guilherme A. Ferreira and Thiago Borges (CFO)
Members:
Fabio Hering, Carolina Faria and Arthur N.
Grynbaum¹
Members:
Claudia Soares and Raquel Carneiro (HR
Director)
The new Board is comprised of 10 members, of which 4 are independent, and has a very large engagement on the strategic planning of Arezzo&Co
Name Experience Name Experience
Title Title
Board of Directors
Anderson Birman Chairman of the Board
Founder and Chairman of the Board, with over 40 years of
experience in the industry
Carolina Faria Member
Marketing consultant at True Brand & Business – Soul
Brand Services from 2010 to 2012. Previously, worked as
an executive at Ambev.
Fabio Hering Independent member
CEO and board member of Cia. Hering, where he has
been working for over 28 years.
Rodrigo C. Galindo Independent member
CEO of Kroton Educacional S/A, one of the biggest
education companies in the world, with over 500 thousand
students in colleges.
Welerson Cavalieri
Member
Partner at INDG/FALCONI Consultores de Resultados,
where he works for more than 19 years. Previously, was
an executive in big mining companies.
Juliana Rozenbaum Member
Over 13 years of experience as sell side equity research
analyst, focused mainly in retail and consumer companies.
Claudia Soares Independent Member
Former CFO and IR Officer at Via Varejo S.A. and
Executive Vice-President of Market Strategy at Companhia
Brasileira de Distribuição – GPA.
José Murilo Carvalho Member
President of the Attorney’s Association of Minas Gerais,
Board Member of the Brazilian Bar Association
Guilherme A. Ferreira Independent Member
CEO of Bahema Participações, board member of Pão de
Açúcar, Banco Signatura Lazard, Eternit, Tavex and Rio
Bravo Investimentos
José Bolonha Vice Chairman of the Board
Founder and CEO of “Ethos Desenvolvimento Humano e
Organizacional“; Board member of the Inter-American
Economic and Social Council (UN, WHO
1- CEO of Grupo Boticário (largest franchise company in Brazil)
and Vice-President at Abihpec (Brazilian Association Personal
Hygiene, Perfumes & cosmetics Industries)

R:152
G:216
B:218
R:80
G:179
B:207
R:216
G:181
B:163
R:177
G:181
B:121
R:119
G:119
B:119
R:217
G:217
B:217
R:160
G:160
B:160
R:208
G:240
B:232
| Market Overview and
| Sourcing and Industry Characteristics

R:152
G:216
B:218
R:80
G:179
B:207
R:216
G:181
B:163
R:177
G:181
B:121
R:119
G:119
B:119
R:217
G:217
B:217
R:160
G:160
B:160
R:208
G:240
B:232 .1 Social upward mobility driving internal
consumption 3
26
Income growth and job creation lead to rapid social upward mobility and increasing internal consumption
2003 70 (36%) 54 (27%) 96 (55%)
+14 mi (2003-14E)
+49 mi (2003-14E)
2014E 2011
27 (14%) 22 (11%) 13 (8%)
66 (38%)
100 (52%)
115 (59%)
(Consumption growth as a result of the upward mobility in social classes; indexed 100 = class D/E)
Source: IBGE, FGV, LCA, Bain & Co., BCG, Roland Berger, IPC Maps
Classes A/B: monthly income above R$6,977 | Class C: monthly income between R$1,618 and R$6,977 | Class D: monthly income between R$1,013 and R$1,618 | Class E: monthly income below R$1,013
Class
D/E Class
C Class
B Class
A
Out-of Home Food
Furniture
Apparel and
Footwear
Prescription/OTC drugs
Hygiene and
Personal Care
Footwear and
apparel have the
largest growth
potential
Class C
Class A/B
Class D/E
Brazil experiences an accelerated process of social upward migration... (Millions of people)
1.0x
1.0x
1.0x
1.0x
4.2x
3.2x
3.4x
3.4x
7.0x
5.6x
5.3x
5.6x
9.4x
7.9x
7.3x
7.6x
Classes A/B: monthly income above R$4,808 | Class C: monthly income between R$1,115 and R$4,408 | Class D: monthly income between R$768 and R$1,115 | Class E: monthly income below R$768
...Resulting in a significant rise of consumer goods consumption, including Footwear and Apparel
1,0x 3,7x 6,6x 9,2x

R:152
G:216
B:218
R:80
G:179
B:207
R:216
G:181
B:163
R:177
G:181
B:121
R:119
G:119
B:119
R:217
G:217
B:217
R:160
G:160
B:160
R:208
G:240
B:232
30%
40%
15%
15%
Footwear Consumption 2013
10%
40% 42%
8%
Income Class
27
.2 Brazilian footwear market overview
3 Arezzo&Co has a significant stake of the women footwear market and has consistently increased its market share
Sports
Men
Kids
Women
Footwear
Class A Class D/E
Class C Class B
Arezzo&Co‟s market share1
Source: IBOPE Inteligência (Pyxis), Satra, World Bank, ABICALÇADOS, IEMI, MTE, MDIC, / SECEX, IBGE
Note: 1. Based on Euromonitor research and IBOPE Inteligência (Pyxis). Estimated Arezzo&Co market share considering women footwear market
Total footwear market (R$ bn)
Women footwear
Total footwear
2013E
CAGR (03-13E): + 9.2%
15.9
40.3
4%
7% 8%
9% 10%
11%
2007 2008 2009 2010 2011 2012

R:152
G:216
B:218
R:80
G:179
B:207
R:216
G:181
B:163
R:177
G:181
B:121
R:119
G:119
B:119
R:217
G:217
B:217
R:160
G:160
B:160
R:208
G:240
B:232 .3 Brazilian handbags market overview
3 Arezzo&Co also has a relevant position within the fast growing handbag market in Brazil
Source: IBOPE Inteligência (Pyxis), Satra, World Bank, ABICALÇADOS, IEMI, MTE, MDIC, / SECEX, IBGE
Arezzo&Co current sell out breakdown 2Q13 LTM (R$ mn) Breakdown based on owned stores
Consolidated (including handbags and shoes) market
share: 9,3%
Opportunity to consolidate handbag leading position
86%
11%
Footwear
Handbags303.6
Note: 3% accessories
Total handbags market (R$ bn)
Women handbags
Total handbags
2013E
CAGR (03-13E): + 10.7%
4.0
5.1
Total addressable market (R$ bn)
80%
20%
Footwear
Handbags
19.9
28

R:152
G:216
B:218
R:80
G:179
B:207
R:216
G:181
B:163
R:177
G:181
B:121
R:119
G:119
B:119
R:217
G:217
B:217
R:160
G:160
B:160
R:208
G:240
B:232
Pairs
(millions)
Production World share
China 12,597 62.4%
Índia 2,060 10.2%
Brazil 894 4.4%
Vietnam 760 3,8%
Indonesia 658 3.3%
Pakistan 292 1.4%
Brazil is the third biggest footwear producer, with production mostly destined to supply
the domestic market. Competitive costs, flexibility on minimum production and short
lead time are the pillars to serve the fast fashion market
.4 Footwear Industry - Global Overview
and competitive advantages
Pairs (millions) Consumption World share
China 2,700 15.2%
USA 2,335 13.4%
India 2,034 11.7%
Brazil 780 4,5%
Japan 693 4.0%
Indonesia 627 3.6%
BRAZIL
Lead time: 40 days
Minimum/model: 800 pairs
Minimum/construction: 4,000 pairs
Production cap. (pairs) 894 million
Cost (w/o tax): USD 21/pair
Cost (w/tax): USD 27/pair
CHINA (different clusters)
Lead time: 120 to 150 days
Minimum/model: 5,000 pairs
Minimum/construction: 20,000 pairs
Production cap. (pairs): 12,000 million
Cost (FOB): USD 16-18/pair
Cost (DDP): USD 42-45/pair
INDIA
Lead time: 160 days
Minimum/model: 5,000 pairs
Minimum/construction: 20,000 pairs
Production cap. (pairs): 2,060
million
Cost (FOB): USD 15/pair
Cost (DDP): USD 23/pair
ITALY
Lead time: 70 days
Minimum/model: 800 pairs
Minimum/construction: 4,000 pairs
Production cap. (pairs): 202 million
Cost (FOB): USD 35/pair
Cost (DDP): USD 49/pair
VIETNAM
Lead time: 120 to 150 days
Minimum/model: 2,000 pairs
Minimum/construction: 8,000 pairs
Production cap. (pairs): 760million
Cost (FOB): USD 18/pair
Cost (DDP): USD 26/pair
3
Source: Abicalçados, Footwear News, Company estimates 29

R:152
G:216
B:218
R:80
G:179
B:207
R:216
G:181
B:163
R:177
G:181
B:121
R:119
G:119
B:119
R:217
G:217
B:217
R:160
G:160
B:160
R:208
G:240
B:232
Brazil is recognized by the quality and high specialization within different and complex
categories of shoes. The industry has been qualitatively developed in order to add
value to products and thus increase its competitive advantages over Asian suppliers
.5 Footwear Industry - Global footwear
offering
Global Footwear Offering: the higher and more centralized the country is
in the pyramid, the more focused it is in fashion, creation, design, luxury market ,
marketing and distribution management, with smaller production scale
Equipment assembly
Manufacturing operation
Manufacturer with own design and mostly local brand
Manufacturer with own design and global brand
Global Brands
Receive product and process specifications, as well as components and raw material
Assembly activities only
Usually don’t produce; Creation + own brand management Design and product specification Mostly internationally outsourced Supply chain management Totally decide over marketing and commercialization
Valu
e a
dd
ed
+
-
France
Italy Spain
Taiwan Brazil
Mexico
China India
Thailand Vietnam Other global
suppliers
Indonesia
B
A
C
D
E
Industry segmentation vs. value creation:
3
Source: BNDES, Company estimates 30

R:152
G:216
B:218
R:80
G:179
B:207
R:216
G:181
B:163
R:177
G:181
B:121
R:119
G:119
B:119
R:217
G:217
B:217
R:160
G:160
B:160
R:208
G:240
B:232 .6 Arezzo&Co sourcing: Brazilian
competitive advantages
Vale dos Sinos region offer strong competitive advantages, a combination of production capacity, production flexibility, skilled labor and strong structure to support incentives for innovation and strengthening of industry‟s competitiveness
Source: Abicalçados, 2012 / ASSINTECAL / FAO / AICSUL.
Brazil is the world’s third largest
footwear producer
The world’s largest cattle: 13% of
the market
RS: 1 third (R$ 1 billion) of
Brazilian revenue in leather industry
Vale dos Sinos: one of the world’s
largest footwear manufacturing hubs
1,700 companies and entities: components,
footwear, machinery, tanneries, trade entities,
research and teaching institutions
Abundant skilled and specialized labor
Production flexibility:
volume X variety X speed
Production (million pairs)
Jobs (thousands)
819
338
Production (million pairs)
Jobs (thousands)
270
138
Production (million pairs)
Jobs (thousands)
216
110
BRAZIL
SOUTHERN REGION
VALE DOS SINOS
Vale dos Sinos: 26% of Brazilian footwear production
3
31

R:152
G:216
B:218
R:80
G:179
B:207
R:216
G:181
B:163
R:177
G:181
B:121
R:119
G:119
B:119
R:217
G:217
B:217
R:160
G:160
B:160
R:208
G:240
B:232
Trends and style
Design Technical
Design Engineering Samples Showroom
Logistics and distribution Store
Raw material price negotiations Scheduling + Manufacturer negotiation
1 2 3 4 5 6 7
.8 Arezzo&Co Sourcing Process and
supply chain management
Sourcing process and supply chain management focused on ensuring flexibility, speed
and cost control in the creation of new products Arezzo&Co sourcing process:
Coordinated management of production chain associated with Investments in product engineering: specific know
how
Arezzo&Co Raw materials
Finished products
Cost control
Engineering folder
Cost management efficiency
Quality standard guarantee
Efficient lead time
Flexibility
Chemicals and textile
Components
3
32
SKU
MODEL
CONSTRUCTION
10%
35%
70%
Reuse from collection to collection:

R:152
G:216
B:218
R:80
G:179
B:207
R:216
G:181
B:163
R:177
G:181
B:121
R:119
G:119
B:119
R:217
G:217
B:217
R:160
G:160
B:160
R:208
G:240
B:232
| Value Drivers Update
R:152
G:216
B:218
R:80
G:179
B:207
R:216
G:181
B:163
R:177
G:181
B:121
R:119
G:119
B:119
R:217
G:217
B:217
R:160
G:160
B:160
R:208
G:240
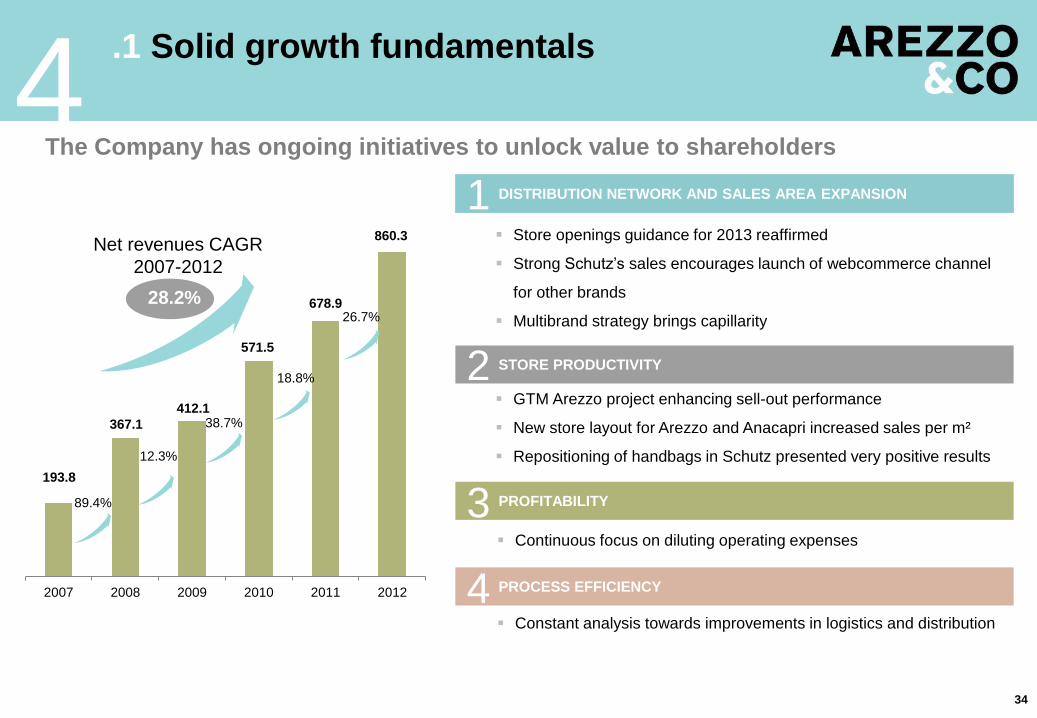
B:232 .1 Solid growth fundamentals
4
34
The Company has ongoing initiatives to unlock value to shareholders
193.8
367.1
412.1
571.5
678.9
860.3
2007 2008 2009 2010 2011 2012
89.4%
12.3%
38.7%
18.8%
26.7%
Net revenues CAGR
2007-2012
28.2%
Store openings guidance for 2013 reaffirmed
Strong Schutz’s sales encourages launch of webcommerce channel
for other brands
Multibrand strategy brings capillarity
DISTRIBUTION NETWORK AND SALES AREA EXPANSION
GTM Arezzo project enhancing sell-out performance
New store layout for Arezzo and Anacapri increased sales per m²
Repositioning of handbags in Schutz presented very positive results
STORE PRODUCTIVITY 2
Continuous focus on diluting operating expenses
PROFITABILITY 3
Constant analysis towards improvements in logistics and distribution
PROCESS EFFICIENCY 4
1

R:152
G:216
B:218
R:80
G:179
B:207
R:216
G:181
B:163
R:177
G:181
B:121
R:119
G:119
B:119
R:217
G:217
B:217
R:160
G:160
B:160
R:208
G:240
B:232 .1 2013 Expansion Plan
Since IPO, for 2 consecutive years, store opening guidance was achieved; 2013 expansion is committed to 53 new stores with 14% growth in sales area
4
1) Includes international store operation
33
58
53 In addition to the store openings,
the company is committed to
expand existing stores by a total
of 1,000 sqm in 2013 and 2014
90% of the contracts already
signed
17 stores opened in 1H13
274 296 342
389
29
45
57
63
303
341
399
452
2010 2011 2012 2013
# Owned Stores
# Franchises
35

R:152
G:216
B:218
R:80
G:179
B:207
R:216
G:181
B:163
R:177
G:181
B:121
R:119
G:119
B:119
R:217
G:217
B:217
R:160
G:160
B:160
R:208
G:240
B:232
36
.1 Web commerce
4 With a strong growth in the last twelve months, web commerce represents 5% of
Schutz brands revenues
Best store in terms of sales in the whole chain
80 thousand pairs sold in the last 12 months
Vast and rich product mix assortment
5%+ of Schutz brand revenues in the 1H13
Roll-out to other brands expected in 2014

R:152
G:216
B:218
R:80
G:179
B:207
R:216
G:181
B:163
R:177
G:181
B:121
R:119
G:119
B:119
R:217
G:217
B:217
R:160
G:160
B:160
R:208
G:240
B:232
37
.2 GTM Arezzo
4 Under GTM Arezzo the Company expects to increase the product accuracy with new collection calendar a shorter lead time
Life cycle More fashion content; largest collections
presented to the franchisees
Collection
Continuables
Classic
Showroom
Fashion complement
Fast fashion
Continuables
Classic
Supply model
Fashion complement using information
from the sell out
Capturing quick trends, not only from
Arezzo’s stores, but also from market
research
Products automatically replaced in the
stores with some season colors
Open size run replacement
Products also automatically replaced in
the stores; only two colors. Full mark-up
sell-through

R:152
G:216
B:218
R:80
G:179
B:207
R:216
G:181
B:163
R:177
G:181
B:121
R:119
G:119
B:119
R:217
G:217
B:217
R:160
G:160
B:160
R:208
G:240
B:232 .2 Store productivity increase
4
38
Niches and lighting
Vídeo Wall
Iguatemi São Paulo Mall
Wall display
Combos
Accessories
Floor Storage
New Arezzo store layout reinforces the brand identity
More productive store: 60% more products per m²
Allows a better display of non-shoe categories, especially
handbags and accessories;
New pilot became the brand’s most productive store
Very replicable store format for different locations: from
street to malls and from small to very large cities
First pilot franchise inaugurated on August, 8th
New store layouts increase productivity while reinforcing brand identity

R:152
G:216
B:218
R:80
G:179
B:207
R:216
G:181
B:163
R:177
G:181
B:121
R:119
G:119
B:119
R:217
G:217
B:217
R:160
G:160
B:160
R:208
G:240
B:232
39
.2 Schutz handbags
4 New positioning of handbags in Schutz brand resulted in strong growth
Focus on product development fostering supply chain
Target strategy designed for each channel
Subdivision of categories by potential use
Reduction in the number of models
Different product mix by channel
Recent repositioning of Schutz handbags delivering positive results
5%
9%
2Q12 2Q13
Handbags as % of
Schutz revenues

R:152
G:216
B:218
R:80
G:179
B:207
R:216
G:181
B:163
R:177
G:181
B:121
R:119
G:119
B:119
R:217
G:217
B:217
R:160
G:160
B:160
R:208
G:240
B:232 Key takeaways
40
Undisputable category leader 1
Significant growth potential 2
Reference brands 3
Scalable platform with operating leverage 5
Efficient and market oriented supply chain 4
High return on invested capital 6
4

R:152
G:216
B:218
R:80
G:179
B:207
R:216
G:181
B:163
R:177
G:181
B:121
R:119
G:119
B:119
R:217
G:217
B:217
R:160
G:160
B:160
R:208
G:240
B:232
| 2Q13 Financial Highlights 05

R:152
G:216
B:218
R:80
G:179
B:207
R:216
G:181
B:163
R:177
G:181
B:121
R:119
G:119
B:119
R:217
G:217
B:217
R:160
G:160
B:160
R:208
G:240
B:232 .1 Operational and financial highlights
5
42
111.8 134.5 209.3 251.4 74.0
87.6
129.8 147.6
60.2
69.8
104.7
131.3
3.0
1.9
6.5
5.2
2Q12 2Q13 1H12 1H13
20.3%
16.0%
450.3
18.0%
535.4
18.3% 20.1%
25.4%
18.9%
13.7% 249.0
293.9
The Company’s main sales channels presented growth in 2Q13. In special, Franchises increased
20.3%, leveraged by 52 stores openings and expansion of 10 stores in the last twelve months.
Gross Revenue by channel – Domestic Market (R$ million)
Franchise Multi-brand Owned Stores Others¹
SSS Sell-out (owned stores + franchise )
SSS Sell-in (franchises)
1) Other: decreasing of 35.0% in 2Q13 and 20,3% in 1H13
1.2%
5.5%
3.7%
6.7%
n/a
10.4%
n/a
14.5%

R:152
G:216
B:218
R:80
G:179
B:207
R:216
G:181
B:163
R:177
G:181
B:121
R:119
G:119
B:119
R:217
G:217
B:217
R:160
G:160
B:160
R:208
G:240
B:232
255 276 309 361
25 31
50
56 16.3
18.4
23.1
28.0
2Q10 2Q11 2Q12 2Q13
+58359
417
280307 +52
+27
21.1%
13.3%
25.6%
Franchises Owned Stores Total sq m
5
43
.2 Operational and financial highlights
Key highlights
Strong Gross Revenue growth, especially in the Schutz brand that increased by 35.0% in 2Q13 compared to 2Q12
2Q13 ended with 417 store chain and Sales area expansion of 21.1% year-over-year
2Q13 Net Revenue increased by 19.1% year-over-year
Number of Stores (R$ mn) and Total Area (sq m - „000) CAGR 07-13 (2Q13 LTM): 33.2%
Net Revenues (R$ mn)
Area CAGR 07- 13 (1Q13LTM): 17.0%
199.5 237.6 193.8
367.1 412.1
571.5 678.9
860,3
2Q12 2Q13 2007 2008 2009 2010 2011 2012
19.1%
89.4%
12.3%
38.7%
26.7% 18.8%

R:152
G:216
B:218
R:80
G:179
B:207
R:216
G:181
B:163
R:177
G:181
B:121
R:119
G:119
B:119
R:217
G:217
B:217
R:160
G:160
B:160
R:208
G:240
B:232
8.0
57.316.9%20.6%
34.6 40.5
49.3
69.1
17.4%17.0%
15.9% 15.8%
2Q12 2Q13 1H12 1H13
EBITDA EBITDA margin
5
44
.3 Operational and financial highlights
Gross Profit (R$ million)
89.9
106.1
157.1
195.5
45.1% 44.6%
43.5% 44.6%
2Q12 2Q13 1H12 1H13
Gross profit Gross margin
17.9%
24.4%
EBITDA (R$ million)
15.6%
1 2.8%
25.8 29.1 36.6
48.4
12.9% 12.2%
11.6% 11.0%
2Q12 2Q13 1H12 1H13
Net income Net Margin
5.3 41.9
Net Income (R$ million)
R:152
G:216
B:218
R:80
G:179
B:207
R:216
G:181
B:163
R:177
G:181
B:121
R:119
G:119
B:119
R:217
G:217
B:217
R:160
G:160
B:160
R:208
G:240
B:232
45
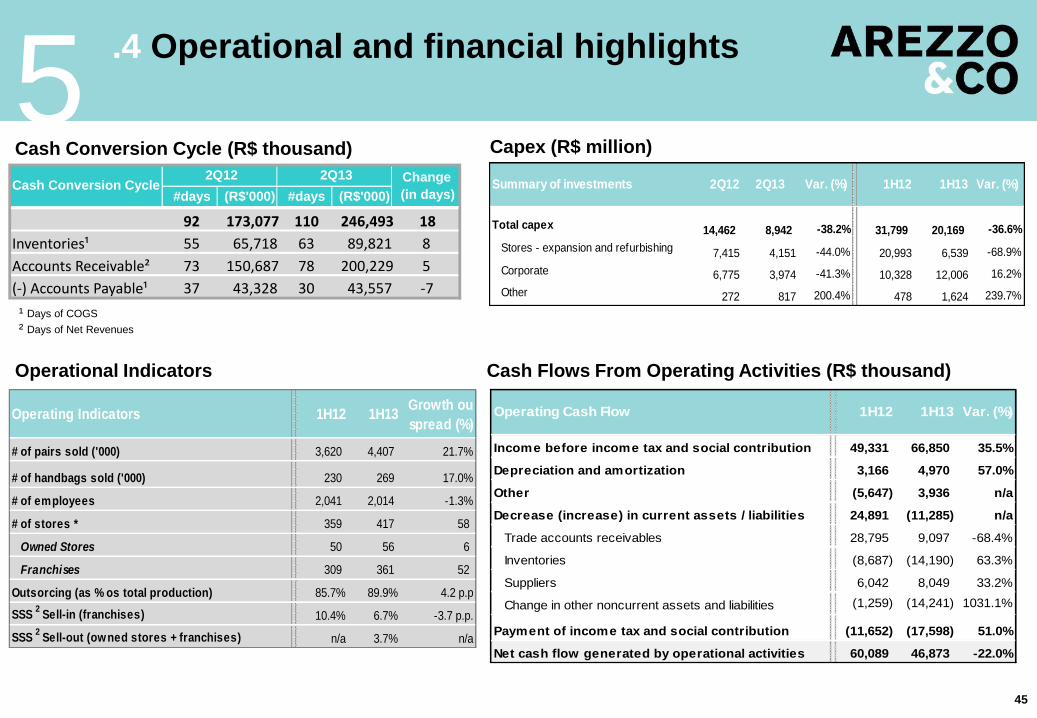
5 .4 Operational and financial highlights
Cash Conversion Cycle (R$ thousand)
Cash Flows From Operating Activities (R$ thousand)
Capex (R$ million)
¹ Days of COGS
² Days of Net Revenues
Operational Indicators
,
,
,
,
Total capex 14,462 8,942 -38.2% 31,799 20,169 -36.6%
Stores - expansion and refurbishing 7,415 4,151 -44.0% 20,993 6,539 -68.9%
Corporate 6,775 3,974 -41.3% 10,328 12,006 16.2%
Other 272 817 200.4% 478 1,624 239.7%
Summary of investments Var. (%)1H132Q12 1H122Q13 Var. (%)
1H12 1H13 Growth ou
spread (%)
# of pairs sold ('000) 3,620 4,407 21.7%
# of handbags sold ('000) 230 269 17.0% 0.2%
# of employees 2,041 2,014 -1.3%
# of stores * 359 417 58
Owned Stores 50 56 6
Franchises 309 361 52
Outsorcing (as % os total production) 85.7% 89.9% 4.2 p.p
SSS 2 Sell-in (franchises) 10.4% 6.7% -3.7 p.p.
SSS 2 Sell-out (owned stores + franchises) n/a 3.7% n/a
Operating Indicators
Income before income tax and social contribution 49,331 66,850 35.5%
Depreciation and amortization 3,166 4,970 57.0%
Other (5,647) 3,936 n/a
Decrease (increase) in current assets / liabilities 24,891 (11,285) n/a
Trade accounts receivables 28,795 9,097 -68.4%
Inventories (8,687) (14,190) 63.3%
Suppliers 6,042 8,049 33.2%
(1,259) (14,241) 1031.1%
Payment of income tax and social contribution (11,652) (17,598) 51.0%
Net cash flow generated by operational activities 60,089 46,873 -22.0%
Change in other noncurrent assets and liabilities
1H13 Var. (%)Operating Cash Flow 1H12
#days (R$'000) #days (R$'000)
92 173,077 110 246,493 18
Inventories¹ 55 65,718 63 89,821 8
Accounts Receivable² 73 150,687 78 200,229 5
(-) Accounts Payable¹ 37 43,328 30 43,557 -7
Cash Conversion Cycle 2Q12 2Q13 Change
(in days)

R:152
G:216
B:218
R:80
G:179
B:207
R:216
G:181
B:163
R:177
G:181
B:121
R:119
G:119
B:119
R:217
G:217
B:217
R:160
G:160
B:160
R:208
G:240
B:232
46
5 .5 Operational and financial highlights
Indebtedness (R$ thousand)
Indebtedness totaled R$ 107.9 million in 2Q13 versus
R$ 87.9 million in 1Q12
Long-term debt relevance stood at 43.7% in 2Q13 versus
53.1% in 1Q12
Indebtedness policy remained conservative, with low
weighted-average cost of Company's total debt
2Q12 1Q13 2Q13
Cash 205,819 213,306 214,411
Total debt 51,117 87,880 107,862
Short term 25,548 41,226 60,763
% total debt 50.0% 46.9% 56.3%
Long-term 25,569 46,654 47,099
% total debt 50.0% 53.1% 43.7%
Net debt (154,702) (125,426) (106,549)
Cash position and
Indebtedness
EBITDA LTM 118.007 149.731 155.575
Net debt/EBITDA LTM -1,3x -0,8x -0,7x

R:152
G:216
B:218
R:80
G:179
B:207
R:216
G:181
B:163
R:177
G:181
B:121
R:119
G:119
B:119
R:217
G:217
B:217
R:160
G:160
B:160
R:208
G:240
B:232
47
Appendix

R:152
G:216
B:218
R:80
G:179
B:207
R:216
G:181
B:163
R:177
G:181
B:121
R:119
G:119
B:119
R:217
G:217
B:217
R:160
G:160
B:160
R:208
G:240
B:232
48
.4 Key financial indicators
A
1 - Includes non-recurring expense in 1Q12 in Other Operating Revenues and Expenses: Arezzo&Co terminated its contract with Star Export Assessoria e Exportação Ltda. (“Star”), which had been providing
technical support and advice services for procurement and inspection of independent factories and workshops contracted to make products. As part of the termination, a payment of R$ 8 million was made and
Star signed a five-year non-compete agreement. On the same date, a contract was signed with another company that has the same technical capability, providing the same type of services on special commercial
terms to reduce costs while maintaining the same quality of services.
2 - Working Capital: current assets minus cash, cash equivalents and marketable securities less current liabilities minus loans and financing and dividends payable.
3 - Invested capital: working capital plus fixed assets and other long-term assets less income tax and deferred social contribution.
4 - Net debt is equal to total interest-bearing debt position at the end of a period less cash and cash equivalents and short-term financial investments.
2Q12 2Q13Growth or
spread%1H12 1H13
Growth or
spread%
Net revenues 199,468 237,639 19.1% 360,829 438,678 21.6%
COGS (109,533) (131,581) 20.1% (203,721) (243,187) 19.4%
Gross profit 89,935 106,058 17.9% 157,108 195,491 24.4%
Gross margin 45.1% 44.6% -0.5 p.p. 43.5% 44.6% 1.1 p.p. -
SG&A (57,050) (67,965) 19.1% (110,972) (131,347) 18.4% - 10,915.00
% of Revenues 28.6% 28.6% 0.0 p.p 30.8% 29.9% -0.9 p.p
Selling expenses (40,895) (48,582) 18.8% (75,152) (92,445) 23.0% - 7,687.00
Ow ned stores (18,543) (22,020) 18.8% (34,042) (44,357) 30.3% - 3,477.00
Selling, logistics and supply (22,352) (26,562) 18.8% (41,110) (48,088) 17.0% - 4,210.00
General and administrative expenses (14,209) (17,891) 25.9% (25,808) (35,220) 36.5% - 3,682.00
Other operating revenues (expenses)1 (197) 893 n/a (6,846) 1,288 n/a 1,090.00
Depreciation and amortization (1,749) (2,385) 36.4% (3,166) (4,970) 57.0% - 636.00
Ebitda 34,634 40,478 16.9% 49,302 69,114 40.2%
Ebitda margin 17.4% 17.0% -0.4 p.p. 13.7% 15.8% 2.1 p.p.
Net income 25,763 29,057 12.8% 36,615 48,423 32.2%
Net margin 12.9% 12.2% -0.7 p.p. 10.1% 11.0% 0.9 p.p.
Working capital2 - as % of revenues 21.8% 26.1% 4.3 p.p 21.8% 26.1% 4.3 p.p
Invested capital3 - as % of revenues 29.4% 33.9% 4.5 p.p. 29.4% 33.9% 4.5 p.p.
Total debt 51,117 107,862 111.0% 51,117 107,862 111.0%
Net debt4 (154,702) (106,549) n/a (154,702) (106,549) n/a
Net debt/EBITDA LTM -1.3 X -0.7 X n/a -1.3 X -0.7 X n/a
Key financial indicators

R:152
G:216
B:218
R:80
G:179
B:207
R:216
G:181
B:163
R:177
G:181
B:121
R:119
G:119
B:119
R:217
G:217
B:217
R:160
G:160
B:160
R:208
G:240
B:232
49
.5 History – Franchises and Owned Stores
A
1. Includes areas in square meters of 9 international stores
2. Includes 5 outlet-type stores with a total area of 1,227 m2
3. Includes areas in square meters of stores expansion
2Q12 3Q12 4Q12 1Q13 2Q13
Sales area 1,3 - Total (m²) 23,112 24,531 26,543 26,659 27,996
Sales area - franchises (m²) 18,005 19,125 20,646 20,731 22,154
Sales area - Ow ned stores2 (m²) 5,107 5,406 5,897 5,928 5,842
Total number of domestic stores 351 368 390 391 408
# of franchises 301 316 334 335 353
Arezzo 295 300 311 312 324
Schutz 6 16 23 23 29
# of owned stores 50 52 56 56 55
Arezzo 19 19 19 19 17
Schutz 22 24 27 27 27
Alexandre Birman 1 2 2 2 2
Anacapri 8 7 8 8 9
Total number of international stores 8 9 9 9 9
# of franchises 8 8 8 8 8
# of owned stores 0 1 1 1 1
History - Franchises and Owned Stores1

R:152
G:216
B:218
R:80
G:179
B:207
R:216
G:181
B:163
R:177
G:181
B:121
R:119
G:119
B:119
R:217
G:217
B:217
R:160
G:160
B:160
R:208
G:240
B:232
50
.6 Balance Sheet - IFRS
A Assets 2Q12 1Q13 2Q13
Current assets 441,382 539,360 537,059
Cash and cash equivalents 4,799 8,427 7,515
Financial Investments 201,020 204,879 206,896
Trade accounts receivables 150,687 211,251 200,229
Inventory 65,718 87,481 89,821
Taxes recoverable 7,393 15,797 18,460
Other credits 11,765 11,525 14,138
Non-current assets 105,507 132,558 137,303
Long-term receivables 16,135 15,657 15,530
Financial Investments 98 178 21
Taxes recoverable 360 377 377
Deferred income and social contribution 8,705 8,007 6,898
Other credits 6,972 7,095 8,234
Property, plant and equipment 47,693 63,338 65,014
Intangible assets 41,679 53,563 56,759
Total Assets 546,889 671,918 674,362
Liabilities 2Q12 1Q13 2Q13
Current liabilities 107,458 146,211 148,087
Loans and financing 25,548 41,226 60,763
Suppliers 43,328 69,021 43,556
Dividends and interest on equity capital payable 9,701 0 9,346
Other liabilities 28,881 35,964 34,422
Non-current liabilities 29,984 52,102 54,386
Loans and financing 25,569 46,654 47,099
Related parties 975 969 978
Other liabilities 3,440 4,479 6,309
Equity 409,447 473,605 471,889
Capital 105,917 106,857 156,000
Capital reserve 172,830 173,838 125,190
Income reserves 105,407 173,544 153,162
Profit 25,293 19,366 37,537
Total liabilities and shareholders' equity 546,889 671,918 674,362

R:152
G:216
B:218
R:80
G:179
B:207
R:216
G:181
B:163
R:177
G:181
B:121
R:119
G:119
B:119
R:217
G:217
B:217
R:160
G:160
B:160
R:208
G:240
B:232
51
.7 Income Statement - IFRS
A Income statement - IFRS 2Q12 2Q13 Var.% 1H12 1H13 Var.%
Net operating revenue 199,468 237,639 19.1% 360,829 438,678 21.6%
Cost of goods sold (109,533) (131,581) 20.1% (203,721) (243,187) 19.4%
Gross profit 89,935 106,058 17.9% 157,108 195,491 24.4%
Operating income (expenses): (57,050) (67,965) 19.1% (110,972) (131,347) 18.4%
Selling (41,811) (49,709) 18.9% (76,818) (95,008) 23.7%
Administrative and general expenses (15,042) (19,149) 27.3% (27,308) (37,627) 37.8%
Other operating income net (197) 893 n/a (6,846) 1,288 n/a
Income before financial result 32,885 38,093 15.8% 46,136 64,144 39.0%
Financial income 810 666 -17.8% 3,195 2,706 -15.3%
Income before income taxes 33,695 38,759 15.0% 49,331 66,850 35.5%
Income tax and social contribution (7,932) (9,702) 22.3% (12,716) (18,427) 44.9%
Current (6,164) (8,593) 39.4% (11,409) (19,061) 67.1%
Deferred (1,768) (1,109) -37.3% (1,307) 634 -148.5%
Net income for period 25,763 29,057 12.8% 36,615 48,423 32.2%

R:152
G:216
B:218
R:80
G:179
B:207
R:216
G:181
B:163
R:177
G:181
B:121
R:119
G:119
B:119
R:217
G:217
B:217
R:160
G:160
B:160
R:208
G:240
B:232
52
.8 Cash Flow Statement - IFRS
A Statement of cash flow 2Q12 2Q13 1H12 1H13
Operating activities
Income before income tax and social contribution 33,695 38,759 49,331 66,850 1
231 7,139 (2,481) 8,906
Depreciation and amortization 1,749 2,385 3,166 4,970
Income from financial investments (2,743) (2,896) (6,604) (6,165)
Interest and exchange rate 1,336 5,057 814 5,067
Other (111) 2,593 143 5,034
Decrease (increase) in assets
Customer receivables 22,801 11,471 28,795 9,097
Inventory (108) (2,716) (8,687) (14,190)
Recoverable taxes 2,331 (2,663) 2,796 (4,179)
Variation other current assets (1,378) (3,394) (65) (3,223)
Judicial deposits (123) (359) (641) 545
Decrease (increase) in liabilities
Suppliers (12,798) (25,464) 6,042 8,049
Labor liabilities 4,100 4,338 1,269 (181)
Fiscal and social liabilities 1,268 (2,467) (4,347) (8,771)
Variation in other liabilities (477) 1,732 (271) 1,568
Payment of income tax and social contribution (11,652) (13,935) (11,652) (17,598)
Net cash flow from operating activities 37,890 12,441 60,089 46,873
Net cash used in investing activities (52,221) (7,906) (68,207) (30,266)
Net cash used in financing activities - third parties 18,937 14,926 11,644 8,712
Net cash used in financing activities (6,020) (20,373) (14,255) (29,322)
Increase (decrease) in cash and cash equivalents (1,414) (912) (10,729) (4,003)
Increase (decrease) in cash and cash equivalents (1,414) (912) (10,729) (4,003)
Adjustments to reconcile net income with
cash from operational activities

R:152
G:216
B:218
R:80
G:179
B:207
R:216
G:181
B:163
R:177
G:181
B:121
R:119
G:119
B:119
R:217
G:217
B:217
R:160
G:160
B:160
R:208
G:240
B:232 IR Contacts
Thiago Borges
Leonardo Pontes dos Reis, CFA
Phone: +55 11 2132-4300
www.arezzoco.com.br
CFO and IR Officer
IR Manager