inspire: investigating stellar population in relics
TRANSCRIPT
1
INSPIRE: Investigating Stellar Population In RElics
Data Release 1 (DR1)
C. Spiniello1,2, L. Coccato3, F. La Barbera2, G. D’Ago4, C. Tortora2 & the INSPIRE Team
1Sub-Dep. of Astrophysics, University of Oxford, Denys Wilkinson Building, Keble Road, Oxford, UK 2INAF - Osservatorio Astronomico di Capodimonte, Salita Moiariello, 16, I-80131 Napoli, Italy 3European Southern Observatory, Karl-Schwarzschild-Strasse 2, 85748, Garching, Germany 4Institute of Astrophysics, Pontificia Universidad Católica de Chile, Av. Vicuna Mackenna 4860, 7820436 Macul, Santiago, Chile
Abstract
This document describes the first public data release (DR1) of the X-Shooter ESO Large Program 1104.B-0370, “INvestigating Stellar Population In Relics (INSPIRE), which is presented in the INSPIRE pilot project (Spiniello et al., 2021a, A&A, 646, A28. doi:10.1051/0004-6361/202038936, hereafter S21a) and in Spiniello et al. 2021b (arXiv:2103.12086 hereafter S21b). In this DR1 we release one-dimensional (1D) spectra in the UVB and VIS arms, of 19 ultra-compact massive galaxies which were observed from October 22nd 2019 until December 31st 2020 and were classified as relics or not in S21b. Scientific Context The first generation of extremely massive Early-Type Galaxies (ETGs) is already in place at (Guo et al., 2013); their number density dramatically increases between 3 < z < 1 (Trujillo et al. 2007) and then only mildly evolves at z < 1 (Bell et al. 2003). Interestingly, at higher redshift, massive red objects are found to have 3–5 times smaller sizes than in the local Universe, and thus they are 30–100 times denser (van Dokkum et al., 2008). To reconcile these observations, a two-phase formation scenario (Oser et al., 2010) has been proposed to explain the mass assembly and evolution across cosmic time of very massive galaxies. A first intense and fast dissipative series of processes form their central “bulk” mass (at z>2) generating, after star formation quenches, a mas-
z ≥ 3
ES
O
Sc
ie
nc
e
Ar
ch
iv
e
Fa
ci
li
ty
-
P
ha
se
3
D
at
a
Re
le
as
e
De
sc
ri
pt
io
n
ES
O p
rogr
amm
e IN
vest
igat
ing
Ste
llar
Pop
ulat
ions
and
IMF
in R
Elic
s -
1104
.B-0
370,
Dat
a R
elea
se D
R1
prov
ided
by
Chi
ara
Spi
niel
lo, p
ublis
hed
on 2
021-
03-2
4
2
sive, passive and very compact galaxy with size a factor of ~4 smaller than local mas-sive galaxies (the so-called “red nuggets”, Daddi et al. 2005). Then a second, more time-extended phase, dominated by mergers and gas inflows, is responsible for the dramatic structural evolution and size growth from z~1 to today (Buitrago et al., 2008). Unfortunately, this “accreted” material overlaps, along the line-of-sight, with the spatial and orbital distributions of the “in-situ” light, that encodes the information about high-z baryonic processes, irreversibly limiting our resolving power. Luckily, since merging is believed to be stochastic, a small fraction of red nuggets survives intact until the local Universe, without experiencing any further interaction: Relic Galaxies. Relics are the perfect local “laboratories” to study the processes that shaped the mass assembly of massive galaxies in the high-z Universe and disentangle between possible formation scenarios for massive galaxies. In the local Universe, only three relics have been confirmed and studied in great de-tails (Trujillo et al. 2014, Ferré-Mateu et al., 2017, hereafter F17). They have large rotation velocities (~200-300 km/s) and high central stellar velocity dispersions (>300 km/s). From a stellar population point of view, these three objects have a single stellar population with super-solar metallicities and old ages out to several effective radii. Their stars are also characterized by a large [Mg/Fe] over-abundance, which is con-sistent with early and short star formation episodes (within timescales < 1 Gyr, Thomas et al. 2005). Finally, the three relics also have a bottom-heavy stellar initial mass function (IMF), with the fraction of low-mass stars being at least a factor of 2 larger than that found in the Milky Way (F17). The goal of INSPIRE is to build the first catalogue of spectroscopically confirmed relics at 0.1<z<0.5, bridging the gap between the three local confirmed relics and the high-z red nuggets, to understand the discrepancy between the observational results and to put a stringent constraint on the predictions from simulations. A more detailed descriptions of the scientific aims and goal of INSPIRE is provided in S21a and S21b, where we also present results obtained using data released here. According to the definition given in Tortora et al. (2016), a galaxy is defined as UCMG if it has an effective radius Reff < 1.5 kpc and a stellar mass M*>8 x 10¹⁰ Msun. However, since different studies have adopted different thresholds for size and mass-es, and since we aim at finding a large number of relics, we slightly relax these crite-ria and consider as confirmed UCMGs all objects with Reff < 2kpc and stellar masses M*>6 x 10¹⁰ Msun. . Overview on INSPIRE INSPIRE is based on data obtained as part of the ESO Large Programme ID: 1104.B-0370, PI: C. Spiniello, which has been awarded 154 hrs of observations on X-Shooter to spectroscopically follow up 52 UCMGs with redshift 0.1<z<0.5, which are part of a dedicated KiDS project (Tortora et al. 2018, Scognamiglio et al. 2020). Details on the target selections, observation strategy for the whole INSPIRE Programme, as well as information about the data released in this DR1 are described below. Selection of the targets We start from a catalogue of 117 confirmed Ultra Compat Massive Galaxies (UCMGs) with redshift 0.1<z<0.5, which have been found and confirmed thanks to a dedicated Kilo Degree Survey (KiDS) project (T16, Tortora et al. 2018, Scognamiglio et al. 2020, hereafter T18 and S20). Each galaxy has structural parameters computed from gri KiDS images (Roy et al. 2018) and stellar masses retrieved from T18/S20.

3
We then select only the objects with g-i broad band colour compatible with that of a stellar population with integrated age larger than 8 Gyrs, considering a solar, super-solar and a sub-solar metallicity (Fig. 1). To this purpose, we use single-burst stellar population models from Bruzual & Char-lot (2003, BC03), and the MAG_AUTO magnitudes from the KiDS DR3, after cor-recting them for extinction.
Observation Strategy and current status The observation strategy has been optimized to capitalize on relatively sub-standard observing conditions (seeing up to 1.2, CLR nights, grey lunar phase with Moon FLI<0.5), allowing for an easy schedulability of the objects into the observation queue. Moreover, the selected targets span a very wide range in right ascension (RA) and declination (DEC), as can be seen from the histograms below, with an optimum observing time spread over the full year. This makes service mode observations, un-der a LP highly efficient. We note also that we have many systems with declination <-30, perfect as "fillers" in nights with strong wind coming from the North.
For all the observations, we set the slit widths to 1.6 arcsec in the UVB and 1.5 in VIS and NIR to ensure minimal slit loss. We use a dithering scheme (NODDING MODE)
100 200 300
RA(deg)
0
5
10
15
Num
bero
fobje
cts
FinalSample
DR1
¡30 ¡20 ¡10 0
DEC(deg)
0
5
10
15
Num
bero
fobje
cts
0:1 0:2 0:3 0:4 0:5Redshift
0:5
1:0
1:5
2:0
2:5
3:0
g¡
i
BC03 8 Gyrs Z = 0.05Z = 0.02 (Z⊙)Z = 0.008
INSPIRE DR1 INSPIRE Final SampleYounger UCMGs in KiDS
Figure 1: The g-i colour as a function of redshift for the IN-SPIRE final sample (empty cir-cles) and for the objects re-leased as part of this DR1 (filled circles). Lines are sin-gle-burst stellar population models from BC03 with differ-ent metallicities and ages of 8 Gyrs. Crosses are the KiDS UCMGs compatible with younger ages.
4
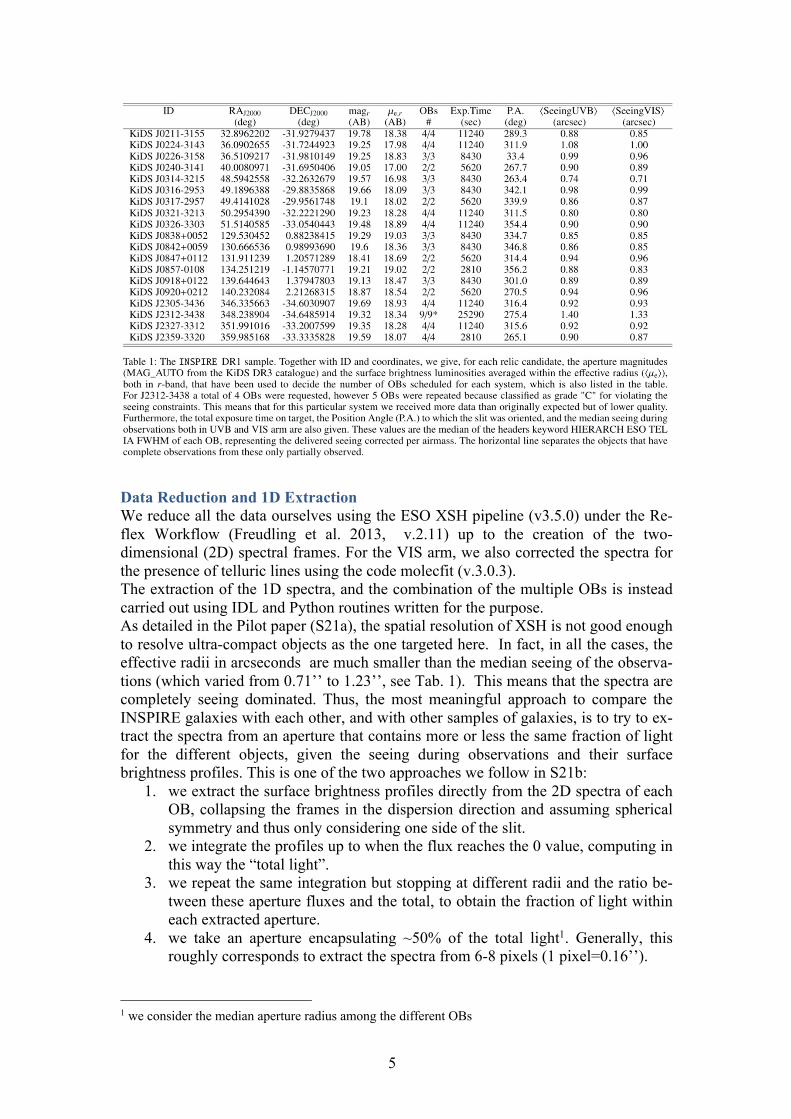
with multiple frames where the galaxy is offset by a small amount from the center of the slit to facilitate a proper sky subtraction. Finally, we also implement a sigma clip-ping routine to further clean the 2D spectra from cosmic ray and sky residuals. The final integration time on target has been driven by the high SNR ratio we need to reach in order to precisely constrain the stellar population parameters. In particular, being these systems generally red, the exposure times are set to reach a SNR in the blue part of the optical which is high enough to infer stellar ages and break the degen-eracies with other stellar population parameters. Based on our experience, an integrat-ed SNR >15 per Angstrom allows the recovery of the stellar population parameters through full spectral fitting with uncertainties smaller than 0.1 dex, and thus the con-firmation of the relic nature. We use the surface brightness luminosities (µe,r) and aperture magnitudes in r-band (from the KiDS catalogue) to divide the final sample of 52 objects in four groups, `bright' (r<18.0 mag and µe,r <=18.4 mag/arcsec2), `medium' (18.0< r <=19.3 mag and µe,r <=19.0 mag/arcsec2), `faint' (18.5< r <19.3 mag and µe,r > 19.0 mag/arcsec2 or r >19.25 mag and µe,r <= 19.0 mag/arcsec2) and `very faint' (r >= 19.3 mag and µe,r > 19.0 mag/arcsec2), scheduling from 1 to 4 Observation Blocks of 1 hour for the differ-ent groups. Roughly for each single 1hr OB, 47 minutes are spent on target. In addi-tion, we increment the final number of OBs in systems where the estimated total stel-lar mass from photometry was equal or greater than 1011Msun or where an estimate of the stellar velocity dispersion was already present from the literature (e.g., from the SDSS or GAMA catalogues) and this resulted to be larger than 250 km/s. INSPIRE Data Release 1 By the end of 2020, 66 out of 154 hours of observations have been carried out on 24 galaxies in total. Of these, the 19 galaxies with complete observations (including the 3 already published in the Pilot Paper, S21a) form the INSPIRE Data Release 1, pre-sented in this document and released to ESO as phase 3 collection. The targets, along with their coordinates, r-band magnitudes (MAG_AUTO) and sur-face brightness are listed in Table 1. We list in the same table also the number of OBs scheduled for that system, and the corresponding total exposure time, the Position Angle (P.A.) of the slit and the median seeing of the observations in UVB and VIS. We clarify here that we do not release the NIR spectra as part of this DR1 since the correction of telluric atmospheric absorption lines, severely affecting the NIR arm is a very difficult task which requires a longer, more careful treatment. This will be per-formed in the future and the data will be released as a successive data release. We stress that the NIR is not necessary to precisely estimate the line-of-sight velocity dis-tribution (LOSVD) nor to constrain the age, metallicity and [α/Fe] abundance of the stellar populations, which are the main scientific results presented in S20 and S21 and based on the data released in DR1. The NIR is crucial to correctly infer the Initial Mass Function, which will be the topic of a separate forthcoming data release, ac-companied by a scientific publication.
5
Data Reduction and 1D Extraction We reduce all the data ourselves using the ESO XSH pipeline (v3.5.0) under the Re-flex Workflow (Freudling et al. 2013, v.2.11) up to the creation of the two-dimensional (2D) spectral frames. For the VIS arm, we also corrected the spectra for the presence of telluric lines using the code molecfit (v.3.0.3). The extraction of the 1D spectra, and the combination of the multiple OBs is instead carried out using IDL and Python routines written for the purpose. As detailed in the Pilot paper (S21a), the spatial resolution of XSH is not good enough to resolve ultra-compact objects as the one targeted here. In fact, in all the cases, the effective radii in arcseconds are much smaller than the median seeing of the observa-tions (which varied from 0.71’’ to 1.23’’, see Tab. 1). This means that the spectra are completely seeing dominated. Thus, the most meaningful approach to compare the INSPIRE galaxies with each other, and with other samples of galaxies, is to try to ex-tract the spectra from an aperture that contains more or less the same fraction of light for the different objects, given the seeing during observations and their surface brightness profiles. This is one of the two approaches we follow in S21b:
1. we extract the surface brightness profiles directly from the 2D spectra of each OB, collapsing the frames in the dispersion direction and assuming spherical symmetry and thus only considering one side of the slit.
2. we integrate the profiles up to when the flux reaches the 0 value, computing in this way the “total light”.
3. we repeat the same integration but stopping at different radii and the ratio be-tween these aperture fluxes and the total, to obtain the fraction of light within each extracted aperture.
4. we take an aperture encapsulating ~50% of the total light1. Generally, this roughly corresponds to extract the spectra from 6-8 pixels (1 pixel=0.16’’).
1 we consider the median aperture radius among the different OBs

6
We obtain in this way an integrated 1D spectrum comparable to that extracted at ef-fective radius, Reff, but taking into account the spreading caused by the seeing. This will come in handy when comparing the INSPIRE sample with other galaxy samples from the literature. The aperture radii encapsulating 50% of the light (R50, hereafter) for the UVB and VIS spectra of each system are listed in the last two columns of Ta-ble 2 in S21b. On the other hand, in order to prove that the confirmed relics have assembled the great majority of stars through a single star formation burst, it would be advisable to collect light from a spatial region as large as possible, ideally from the whole galaxy. This, in turns, would cause a considerable decrease in the final SNR, making it harder to obtain precise estimates of the stellar population parameters. To overcome to this problem and further improve the quality of the extracted, final 1D spectrum, despite nominally collecting light from the whole galaxy, we follow here also the optimal extraction approach described in Naylor (1998). In conclusion, for each galaxy (and in each arm separately, given the different resolu-tion of the two), we obtain and release via the ESO Phase 3 Archive Science Portal two different 1D spectra, one extracted within an aperture that includes 50% of the light and one obtained with the optimal extraction (OptEx, hereafter). The format of the spectra is described in the next Section. Release Content We release in this INSPIRE DR1 a total of 76 spectra on 19 different galaxies origi-nally selected from the KiDS Survey, and then spectroscopically confirmed to be UCMGs in T18 and S20. In particular we have, for each galaxy, 4 spectra, two in the UVB and two in the VIS, two extracted with the R50 method and two extracted with the OptEx procedure. Each spectrum is the sum of different products at the Observation Block (OB) level (from 1 to 4 OBs per system) and is released as a binary table in the FITS standard data format. We do not join together the UVB and VIS spectra of the same system since these have different resolution (R~3200 in UVB and R~5000 in VIS). However, we note that the stellar population results presented in S21b are obtained from a joint spectrum which was brought to the final resolution of FWHM = 2.52 Å, that of the single stellar popu-lation models (MIUSCAT, Vazdekis et al. 2015) used to perform the full-spectral fit-ting and to derive the stellar population parameters. More details on the joining pro-cedure and the spectroscopic analysis are given in S21b. The combined and rest-framed version of the spectra are attached to each corresponding final science product as ancillary file, as explained
Data Format 1D Spectra The spectra are stored in a FITS table which is made of a primary header (NAXIS=0) and one single extension. They all have PRODCATG=SCIENCE.SPECTRUM and are phase3 and VO compliant, they are expressed in unit of wavelength in Angstrom and Flux in erg cm-2 s-1 Å-1. The wavelength is always measured in air for both the UVB and VIS case.

7
Naming convention The names of the files all follow the same convention. They are all in the format:
“INSPIRE_<id-galaxy>_<xsh-arm>_<extraction-method>.fits” where the id-galaxy is the one given in Table 1, but without the KiDS suffix, the xsh-arm is equal to UVB or VIS, depending on the spectrograph arm and the extraction-method is equal to R50 or OptExt for the two extractions respectively
1D Ancillary spectra To constrain the stellar population parameters with via full-spectral fitting it is desir-able to a wavelength range that is large enough to break the age-metallicity Worthey et al. 1994). Thus, in S21b, we first restframed and logarithmically rebinned the UVB and VIS spectra of each object and then combined them together, also degrading their final resolution to that of the SSP models that we use in the stellar population analy-sis (with fix full width half maximum, FWHM = 2.52 Å). To perform the convolu-tion, we use a Gaussian function with a variable sigma (following the prescription of Cappellari et al. 2017). More details on the procedure can be found in S21a. The naming convention of the ancillary data, very similar to that of the main science files: “INSPIRE_<id-galaxy>_<xsh-arm>_<resolution>_<extraction-method>.fits” Where the xsh-arm is equal to “UVB+VIS” and the resolution is “FWHM2.52”. The ancillary files are given as single FITS files. Each of them is connected to two main products, via the keyword “ASSON1” present in the primary header of each UVB and VIS spectrum.
Header Keywords In addition to all the standard ESO PHASE3 keywords, we append to each spectrum few useful keywords listing some of the spectral analysis results published in S21b. These keywords are:
- N_OBS : Number of Observation Blocks for this system - REDSHIFT : The redshift of the galaxy obtained from the 1D spectrum - SNR: The Signal to noise ratio per pixel - VDISP : The measured velocity dispersion - VDISP_ERR : The error associated with the measured velocity dispersion - SPEC_RES: The nominal resolving power of the corresponding XSH arm - AGE_UNR : The mass-weighted mean stellar age obtained in the unregular-
ized case (see S21b for more details, in short this can be considered ad an up-per limit on the age)
- AGE_REG : The mass-weighted mean stellar age obtained in the max_regul case (see S21b for more details, in short this can be considered ad a lower lim-it on the age)
- AGE_ERR : Standard deviation on the stellar age - MET_UNR : The mass-weighted mean stellar metallicity (in terms of [M/H]
obtained in the unregularized case - MET_REG : The mass-weighted mean stellar metallicity (in terms of [M/H]
obtained in the max_regul case - MET_ERR : Standard deviation on the stellar metallicity - MGFE : Light-weighted [Mg/Fe] obtained via line-index measurements - MGFE_ERR : Uncertainties on the Light-weighted [Mg/Fe]
8
Acknowledgements Users of INSPIRE spectra released as part of this DR1 should cite Spiniello et al. 2021b, arXiv:2103.12086. This research has made use of the services of the ESO Science Archive Facility. Science data products from the ESO archive may be distributed by third parties, and disseminated via other services, according to the terms of the Creative Commons At-tribution 4.0 International license. Credit to the ESO origin of the data must be acknowledged, and the file headers preserved. We thank the ESO Archive Science Group for the precious help they provided in or-der to make the data products presented here phase 3 compliant. Bibliography Bell et al., 2003, ApJS, 149, 289; Bruzual G. & Charlot S., 2003, MNRAS, 344, 1000; Buitrago et al., 2008, ApJ, 687, L61; Cappellari M., 2017, MNRAS, 466, 798; Daddi et al., 2005, ApJ, 626, 680; Ferré-Mateu et al., 2017, MNRAS, 467, 1929; Freudling, W., Romaniello, M., Bramich, D. M., et al. 2013, A&A, 559, A96; Guo et al., 2013, MNRAS, 428, 1351; Naylor, T. 1998, MNRAS, 296, 339; Oser et al., 2010, ApJ, 725, 2312; Roy et al., 2018, MNRAS, 480, 1057; Scognamiglio et al., 2020, ApJ, 893, 4; Thomas et al., 2005, ApJ, 621, 673; Tortora et al., 2018, MNRAS, 481, 4728; Tortora et al., 2016, MNRAS, 457, 2845; Trujillo et al., 2007, MNRAS, 382, 109; Trujillo et al., 2014, ApJL, 780, L20; van Dokkum et al., 2008, ApJ, 677, L5; Vazdekis et al. 2015, et al., 2015, MNRAS, 449.