insight validation - ctc - canadian test centre · · 2015-04-09insight validation david galati,...
TRANSCRIPT

Insight ValidationDavid Galati, Ed.D. and Zhimei Gu, Ph.D.
aPr 2015

i
TOC
Table of Contents
Introduction ....................................................................................................................................... 1
Theoretical Basis ............................................................................................................................... 2
Content .............................................................................................................................................. 3
Development ..................................................................................................................................... 4
Internal Structure .............................................................................................................................. 4
Relationships with Other Tests ......................................................................................................... 6Correlation between Insight gI and WISC-IV GaI 6
Score Discrimination ......................................................................................................................... 8Discrimination by age 8
Reliability ............................................................................................................................................ 8Split-Half reliability 8
Test-retest reliability 9
Classification accuracy 9
References ........................................................................................................................................ 11

ii
Appendices
Appendix A Expert Consensus Study of Insight,
Dr. A. Lynne Beal ................................................................................................................. A1The Experts a1
results a1
Appendix B Insight Development and Psychometric Report,
Richard Wolfe, Professor Emeritus, University of Toronto ...............................................B1
General description B2
Development steps B5
Calibration, equating, scaling B9
Norming and reporting B12
Statistical analyses B15
Item statistics B15
Scale statistics B16
Confidence bounds for the national percentile ranks B17
Validity analyses B19
Check on gender bias B19
Concurrent validity B20
Internal correlation structure B20
Connection to Canadian Achievement Tests (CAT·4) B21
Appendix B-A. Item locations and standard errors by subtest and level for norming forms B26
Appendix B-B. Smoothed distributions of theta and composite scores by age B33
Appendix B-C. Item-age regressions for Gc, Gv, and Gf B48
Appendix B-D. NPR lower and upper confidence bounds by subtest and summary score B62

iii
List of FiguresFigure 1: Student population score distribution 1
Figure 2: relationship between Insight gI and WISC-IV GaI standard scores 7
Figure B-1: Test levels and grade ranges B2
Figure B-2: Subtests and number of items by level B2
Figure B-3: Item overlaps for the Gc subtest B3
Figure B-4: Composite scores B3
Figure B-5: Discrepancy scores and reports B4
Figure B-6: ability/achievement discrepancy B4
Figure B-7: Subtests and number of items by level for the initial development forms B5
Figure B-8: Subtests and number of items by level for the later development forms B6
Figure B-9: Development/norming sample sizes B6
Figure B-10: Geographic distribution of norming samples B7
Figure B-11: regional anglophone populations, samples, and weights B7
Figure B-12: Illustration of rasch model for vertical scaling B10
Figure B-13: Glr regression by age and level B11
Figure B-14: Transformation of standard scores to NPr and stanine B13
Figure B-15: Example of an item regressed on age and level B15
Figure B-16: Distributions of standard scores for subtests and indices B16
Figure B-17: Correlation of age and subtest and summary standard scores B17
Figure B-18: Example of graph of NPr confidence bounds B18
Figure B-19: Differential item functioning in the final development items in Gc, Gv, and Gf B19
Figure B-20: Insight compared to WISC-IV and Woodcock-Johnson III standard scores B20
Figure B-21 Internal correlations for rasch thetas and standard subtest scores B21
Figure B-22: Correlations of Insight and CaT·4 and age B22
Figure B-23: Partial correlations of Insight and CaT·4 controlling age B22
Figure B-24: regression analyses of CaT·4 standard scores on Insight subtests B23
Figure B-25: Standard errors of measurement for CaT·4 scale scores by level B24

iv
List of TablesTable 1: relevance of Insight-measured abilities to school achievement 2
Table 2: Percent of expert agreement on the broad ability measured by each Insight subtest 3
Table 3: Disattenuated correlation coefficients for Insight subtests 5
Table 4: relationship between Insight gI and typical WISC-IV GaI subtests 6
Table 5: Split-half reliability coefficients 8
Table 6: Test-retest reliability coefficients and summary statistics 9
Table 7: Insight standard score classification accuracy 10
Table a-1: Percent of expert agreement on the broad ability measured by each Insight subtest a2
Table a-2: average ratings for how well tasks measured broad abilities a2

1
Introduction This report provides an update regarding the collection of validation data for the group-administered cognitive abilities test called Insight (Beal, 2011). Justifying a validation argument is an ongoing process:
To validate a proposed interpretation or use of test scores is to evaluate the rationale for this interpretation or use. The evidence
needed for validation necessarily depends on the claims being made. Therefore, validation requires a clear statement of the proposed
interpretations and uses. (Kane, 2006)
Scores from Insight are intended to be used to screen for cognitive exceptionalities in students who are in grades 2 through 7. The national norms are age-based and so provide a comparison of a child’s subtest and index scores to those of other same-age children. a child’s extreme scores on Insight may be used to develop valuable hypotheses about learning deficits and/or giftedness which may then be confirmed/disconfirmed with further assessment and/or additional information (see Figure 1).
LowestScoring
Learning Deficits?(further assessment)
HighestScoring
Gifted?(further assessment)
Figure 1: Student population score distribution
Insight scores can be used to make inferences about cognitive exceptionalities in children. This assertion is based on a number of testable premises:
• The cognitive abilities that are supposed to be measured by Insight are important for learning in school.
• Insight subtests provide measures of these cognitive abilities that are sufficient for screening students and for developing useful hypotheses about exceptionalities that can be confirmed/disconfirmed with further assessment and/or additional information.
• Insight scores have sufficient reliability to screen for exceptionalities, and the likelihood and nature of student misclassification presents minimal adverse consequences to students.

2
Theoretical Basis Insight is based on the Cattell-Horn-Carroll (CHC) theory of cognitive abilities (Carroll, 1993; Flanagan, Mascolo and Genshaft, 2000).
Cattell-Horn-Carroll theory represents the culmination of more than 60 years of factor-analysis research in the psychometric tradition.
However, in addition to structural evidence, there are other sources of validity evidence, some quite substantial, that support CHC
theory. (Flanagan, Ortiz, Alfonso and Mascolo, 2006, p. 23)
Even more important for educators, there is convincing evidence that a student’s reading, writing and math achievements are related to CHC-defined cognitive abilities (Flanagan, Ortiz, alfonso and Moscolo, 2006). Table 1 shows the broad and narrow abilities measured by each Insight subtest and the relevance of the narrow abilities for learning reading, writing and math, with stronger and more consistent relevance indicated with “XX.”
Table 1: Relevance of Insight-measured abilities to school achievement
CHC Theory Broad Ability
Insight Subtest
CHC Theory Narrow Abilities measured by Insight
Relevance to School Achievement
MathematicsWritingReading
Crystallized Intelligence (Gc)Crystallized Knowledge Language Development (LD) XXXXXX
Visual Processing (Gv)Visual Processing Visualization (Vz) geometry
Fluid Reasoning (Gf)Fluid Reasoning Induction (I) XXXX
Short-Term Memory (Gsm)Short-Term Memory Working Memory (MW) XXXXXX
Long-Term Memory Retrieval (Glr)Long-Term Memory Retrieval Associative Memory (MA) X
Processing Speed (Gs)Processing Speed Perceptual Speed (P) XXXXXX
Auditory Processing (Ga)Auditory ProcessingPhonetic Coding: Analysis (PC:A) Phonetic Coding: Synthesis (PC:S) Speech Sound Discrimination (US)
XXX

3
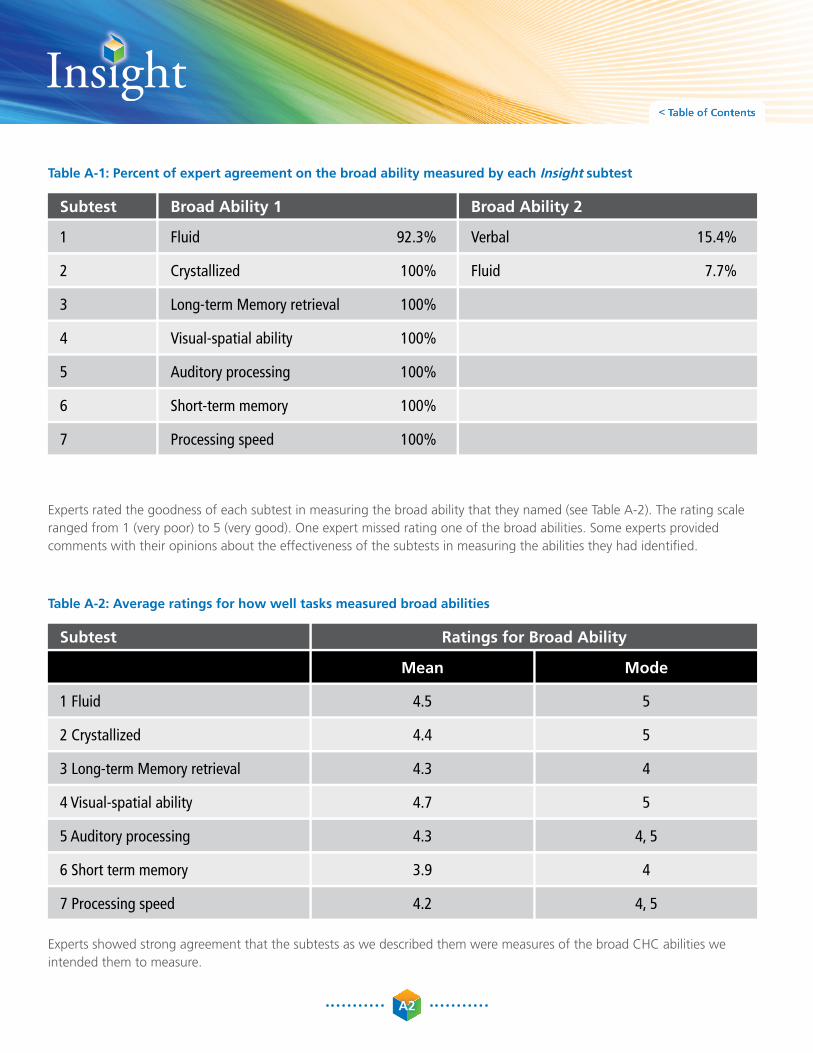
Content Beal (2011, appendix a) describes an expert consensus study designed to verify that the types of tasks selected for each Insight subtest are measures of the CHC broad ability that the subtest was intended to measure. Table 2 below shows the results.
Table 2: Percent of expert agreement on the broad ability measured by each Insight subtest
Subtest Broad Ability 1 Broad Ability 2
1 Fluid 92.3% Verbal 15.4%
2 Crystallized 100% Fluid 7.7%
3 Long-term Memory retrieval 100%
4 Visual-spatial ability 100%
5 Auditory processing 100%
6 Short-term memory 100%
7 Processing speed 100%
The results of the study involving 13 experts are as follows:
• For 6 of the 7 subtests, there was 100% agreement among experts that the tasks measured the broad abilities they were intended to measure.
• For the Fluid reasoning tasks (Subtest 1), there was agreement among 92.3% of the 13 experts (i.e., one expert did not agree with the other 12 experts) that the tasks were measures of fluid reasoning, but two of the experts (15.4%) thought that the tasks were measures of “verbal ability” (one of these two experts thought that the tasks measured both fluid reasoning and “verbal ability”).
• One of the experts (7.7%) thought that the Crystallized Knowledge tasks (Subtest 2) were measures of fluid reasoning as well as crystallized intelligence.
The very high degree of agreement among experts in this study provided confidence that the tasks selected to measure each broad ability were valid measures.

4
Development The details of Insight development and the collection of Canadian norms can be found in Wolfe (2011, appendix B). Insight is administered using a DVD, allowing for standardization in the presentation of the instructions and the visual and audio stimuli. The subtests went through various stages of piloting and field-testing, sampling students of various ethnicities, cultural backgrounds and socio-economic statuses. at every stage of development, teachers were asked to provide feedback regarding the potential for items to be unfair or biased against certain student sub-populations. This information was used to eliminate, as much as possible, bias in the subtests. a statistical analysis of gender bias was also conducted before the selection of items for the final forms (Wolfe, 2011, appendix B, pp. 18−19). The test items for the final forms of Insight subtests were selected in view of the intended purpose of Insight—to screen for exceptionalities. Very easy items were selected for all subtests in order to maximize precision in identifying students who are in the bottom 2% of the population. For the subtests used for gifted screening—Crystallized Knowledge, Visual Processing and Fluid reasoning—very difficult items were also selected in order to maximize precision in identifying students who are in the top 2% of the population.
In order to keep the time required to administer each subtest as short as possible, relatively few average-difficulty items were included in the subtests. Since the intended purpose of Insight is not to discriminate among the abilities of average-ability students, there was little concern for measurement precision for students of average ability. For example, even though Insight scores do reliably discriminate students who are in the top 2% of the population from students who are in the top 10% of the population, it may not always reliably discriminate students who are in the top 50% of the population from those who are in the top 30% of the population. This approach is by design, in order to minimize testing time, and it is considered of little consequence when screening for exceptionalities.
The intentional and targeted design of Insight has implications for the types of reliability and validity indices that are appropriate for evaluating the usefulness of Insight scores for screening for exceptionalities. The reliability and validity indices that are most appropriate for evaluating the usefulness of Insight are those that look at the precision and predictive utility of the classification of students in exceptionality categories (extremely low scoring, extremely high scoring, not extremely exceptional).
Internal Structure Since the different Insight subtests were intended to measure different broad abilities, inter-correlations should suggest that the different subtests measure clearly distinct, but correlated, constructs. Furthermore, the broad abilities defined in CHC theory and measured by Insight have shown certain types of correlational structures. For example, one would expect a relatively low correlation between Insight Gs subtest scores and scores from the other Insight subtests, and one would expect a relatively high correlation between the Gc and Gf subtests. a higher correlation would also be expected between Gf and Gv subtests, as the tasks for the Insight Gf subtest also require visualization.
The disattenuated correlation coefficients are estimates of what the subtest correlations would look like if the tests had perfect reliability; these correlations best reveal the degree to which the underlying constructs measured by the subtests are correlated (Lord and Novick, 1968). Table 3 shows the disattenuated correlation coefficients for Insight subtest number-correct scores. The data are all operational data collected during the annual screening of students for two different school districts. Level 2 data are from about 4500 grade 4 students in an Ontario school district and Level 3 data are from about 1300 grade 7 students in a Saskatchewan school division.

5
Table 3: Disattenuated correlation coefficients for Insight subtests
Gc GsmGv GlrGf GaLevel 2
0.58Gv
0.62 0.72Gf
0.47 0.42 0.49Gsm
0.48 0.480.45 0.49Glr
0.57 0.620.45 0.520.48Ga
0.22 0.300.33 0.280.25 0.31Gs
Gc GsmGv GlrGf GaLevel 3
0.59Gv
0.62 0.77Gf
0.54 0.42 0.54Gsm
0.50 0.450.43 0.46Glr
0.54 0.440.38 0.510.49Ga
0.10 0.200.25 0.150.19 0.20Gs
The correlations in Table 3 suggest that Insight subtests measure clearly distinct, but correlated, abilities, as none of the disattenuated coefficients are greater than 0.77. For both levels, the largest disattenuated coefficient is for the correlation between Gv and Gf (as the tasks for the Gf subtest also require visualization). However, even the Level 3 Gv-Gf coefficient 0.77 indicates that Gv and Gf measure clearly distinct constructs (as the coefficient has already been corrected for measurement errors). The higher correlations between Gc and Gf (0.62) and the lower correlations between Gs and the other subtests (0.10-0.33) were also expected.

6
Relationships with Other Tests
Wechsler Intelligence Scale for Children, Fourth Edition (WISC-IV)
Correlation between Insight gI and WISC-IV GAI
Both the Insight General ability Index (gI) and the WISC-IV General ability Index (GaI) are used to identify students who may be gifted. The observed correlation coefficient between Insight gI standard scores and WISC-IV GaI standard scores was calculated using data from 57 grade 4 students from a Saskatchewan school division who wrote Insight, Level 2. The subtests comprising the Insight gI are measures of the CHC broad abilities Gc, Gv and Gf, where each broad ability is given equal weight in the calculation of gI. The subtests comprising the WISC-IV GaI are also measures of the CHC broad abilities Gc, Gv and Gf, but more subtests are usually administered for Gc, so Gc is usually given more weight than Gv or Gf in the calculation (see Table 4). Nonetheless, one would expect Insight gI scores and WISC-IV GaI scores to be correlated, as they are measures of the same three broad abilities.
Table 4: Relationship between Insight gI and typical WISC-IV GAI subtests
weight weightInsight General Ability WISC-IV General Ability
1/3Gc 1/2Crystallized Knowledge
Similarities
Vocabulary
Comprehension
1/3Gv 1/6Visual Processing Block Design
1/3Gf 1/3Fluid ReasoningMatrix Reasoning
Picture Concepts

7
The scatterplot and best fitting line for the standard scores are shown in Figure 2. The observed correlation coefficient is 0.75. Since standard scores are norm-referenced scores, the coefficient is also influenced by the degree to which the norms for the two tests are linearly related. For both tests, Canadian norms were used.
WISC-IV GAI
Insi
ght
gl
40
40
60
80
100
120
140
160
60 80 100 120 140 160
Figure 2: Relationship between Insight gI and WISC-IV GAI standard scores
The disattenuated correlation coefficient is an estimate of what the correlation coefficient would look like if the two tests had perfect reliability; this correlation best reveals the degree to which the underlying constructs measured by the subtests are correlated (Lord and Novick, 1968). The disattenuated coefficient is 0.85. again, the coefficient is also influenced by the degree to which the norms for the two tests are linearly related.

8
Score Discrimination
Discrimination by Age
Wolfe (2011, appendix B, pages 34-44) produced plots showing the mean rasch scale score as a function of age for the different Insight subtests and indices. The data are from the Insight national norming study. The average scale score for each index score (IaS, gI, ITI, IMPI) increased with age, indicating the ability of the scales to discriminate students of different ages.
The average scale scores for the Crystallized Knowledge (Gc), Visual Processing (Gv), Fluid reasoning (Gf), Long-Term Memory retrieval (Glr) and Processing Speed (Gs) subtests increased from about age 6 to about age 13. The average scores for the Short Term Memory (Gsm) subtest increased steeply until about age 10 and then showed more gradual growth after age 10. The scores for the auditory Processing (Ga) subtest increased until about age 8 and then decreased slightly until about age 10 and then increased again for ages greater than 10. This last result warrants further investigation.
ReliabilityGlobal indices of reliability provide an overall indication of the reliability of scores. These are reported below for Insight index scores. Given the intended use of Insight scores, however, the most relevant reliability data and analyses are those revealing how reliably students are placed in three norm-referenced categories: top 2% of the population, bottom 2% of the population, and “not extremely exceptional.”
Split-Half Reliability
Table 5 shows the index score split-half reliability coefficients (odd-numbered items vs. even-numbered items across the index subtests) for two levels of Insight. Level 2 data are from about 1400 grade 4 students from a Saskatchewan school division and Level 3 data are from about 1300 grade 7 students from a Saskatchewan school division.
Table 5: Split-half reliability coefficients
Level 2 Level 3
IAS 0.94 0.96
gl 0.81 0.89
ITI 0.93 0.96
IMPI 0.85 0.90
Note that every reliability coefficient is greater than 0.80, more than adequate for a group screener.

9
Test-Retest Reliability
a test-retest reliability study was conducted for Insight General ability (gI) scores for Levels 2 and 3. Grade 4 students wrote Level 2 in October (pre-test) and then some of these students were randomly selected to write Level 2 again in December or January (post-test). Similarly, grade 8 students wrote Level 3 in October and then some of these students were randomly selected to write Level 3 again in December or January.
The random selection of students first involved grouping students using their pre-test scores into the following standard score intervals: ≤ 70, 71−129, ≥ 130. For the interval ≤ 70 and for the interval ≥ 130, thirty students were randomly selected at each of the two grades. For the interval 71−129, sixty students were randomly selected at each of the two grades.
as seen in Table 6, the test-retest correlation coefficient was 0.89 for grade 4 and 0.93 for grade 8. The actual number of students with matched pre-test and post-test scores and the summary statistics are also found in Table 6.
Table 6: Test-retest reliability coefficients and summary statistics
Level 2 Level 3
Pre-test Pre-testPost-test Post-test
Test-retest reliability 0.89 0.93
100 100104 106
26 2523 24
Number of students 107 110
Mean
Standard deviation
The percent of students classified consistently in the three standard score intervals ≤ 70, 71−129, ≥ 130 (using the gI scores for the two testing occasions) is 74% for Level 2 and 79% for Level 3. Both the test-retest correlation and the classification consistency are affected by the stability of a student’s performance from one testing occasion to the next.
Classification Accuracy
rogosa (1994) proposed estimating classification accuracy by first placing the measurement error distribution around each student’s observed score. (For Insight, standard score error distributions are conditional on age as well as on test score.) For the purposes of setting confidence intervals, the error distribution is centred on the observed score. If the error distribution falls on both sides of a cut score for exceptionality, the probability of the student’s “true score” falling on one side of the cut score is equal to the proportion of the error distribution falling on that side of the cut score. (For example, 70% of the error distribution could fall above the cut score for gifted identification and 30% of the error distribution could fall below the cut score.) These probabilities can be averaged across all students to produce an overall index of classification accuracy as well as an index of classification accuracy for each of the three norm-referenced categories.
Table 7 shows the results for two different levels of Insight. The data are all operational data collected during the annual screening of students in two different school jurisdictions. Level 2 data are from grade 4 students in an Ontario school district and Level 3 data are from grade 7 students in a Saskatchewan school division. The sample size (n) is the number who had valid scores for all seven Insight subtests, i.e., the number of students who had IaS scores. Sample sizes for specific indices and subtests may be larger.

10
Table 7: Insight standard score classification accuracy
IASglITI
IMPI
GcGvGf
GsmGlrGaGs
Level 2 Level 3
Overall ≤70 71-129 ≥130 Overall ≤70 71-129 ≥130
n=4537 n=263 n=4185 n=89 n=1349 n=78 n=1210 n=61
0.95 0.80 0.96 0.68 0.94 0.81 0.95 0.72
0.90 0.71 0.93 0.68 0.90 0.73 0.93 0.70
0.94 0.77 0.95 0.68 0.91 0.74 0.94 0.70
0.95 0.71 0.96 0.60 0.95 0.75 0.96 0.71
0.86 0.67 0.88 0.60 0.93 0.72 0.94 0.63
0.86 0.65 0.89 0.66 0.84 0.70 0.80 0.69
0.88 0.69 0.90 0.62 0.87 0.66 0.90 0.66
0.93 0.69 0.94 0.63 0.90 0.67 0.91 NA
0.96 0.83 0.97 0.54 0.97 0.77 0.97 NA
0.95 0.69 0.95 NA 0.91 0.73 0.91 NA
0.96 0.72 0.97 0.83 0.97 0.79 0.98 0.96
The overall classification accuracies for the index scores (IaS, gI, ITI and IMPI) range between 0.90 and 0.95. Those for the Insight General ability Index (gI) scores are 0.90, which means that, on average, a student would have a 10% probability of being misclassified for gI. Since the gI scores are intended to be used for screening for giftedness, the classification accuracy for students scoring in the top 2% for gI is of particular interest. The classification accuracies for these students are 0.68 and 0.70, indicating that students scoring in the top 2% would, on average, be misclassified 30-32% of the time. This 30-32% represents about 0.6% (30% x 2%) of the total student population. The gI scores allow one to adequately select the group of students who are most likely to be gifted and then use additional information and/or additional testing to confirm/disconfirm the “gifted” hypothesis.
at least as important is the observation that the degree of classification accuracy for students placed in neither of the two extremes for gI was 0.93 for both Levels, indicating that only 7% of students who scored in the “not extremely exceptional” range would have true scores that are exceptional (either gifted or in the lower extreme). Only about half (3.5%) of these students would have true scores in the gifted range, so the degree of under-identification of students who are truly in the top 2% would be about 3.5%. This is the extent to which one might expect to “miss” identifying a student who is in the top 2% of the population distribution when using Insight gI scores. The likelihood of these so called “false negatives“ could further be reduced by lowering the cut score from “top 2%” to, say, “top 5%.“ This assumes that the consequences of incorrectly not identifying a student as potentially gifted would be greater to the student than the consequences of incorrectly identifying a student as potentially gifted, as the latter could later be confirmed.
The overall classification accuracies for the subtests range between 0.84 and 0.97. The Insight Gsm, Glr and Ga subtests are intended to screen for cognitive deficits. Most of the Gsm, Glr and Ga subtests don’t have enough “ceiling” to allow for identification of students in the top 2%, but they do allow for identification of students in the bottom 2% of the population distribution. The classification accuracies for students who fall in the bottom 2% range between 0.67 and 0.83, meaning that 17%-33% of students scoring in the lower extreme will actually have true scores that are not in the bottom 2%.

11
This represents 0.34-0.66% (e.g., 17% x 2%) of the total population. The Gsm, Glr and Ga sub-test scores allow one to adequately select the group of students who are most likely to have cognitive deficits and then use additional information and/or additional testing to confirm/disconfirm the “deficit” hypothesis.
at least as important is the fact that the Gsm, Glr and Ga classification accuracies for students as “not extremely exceptional” range between 0.91 and 0.97. This indicates that the likelihood of “missing” a student who is truly in the bottom 2% of the distribution for Gsm, Glr or Ga is between only 3% and 9%. It is assumed that the consequences of incorrectly not identifying a student as potentially having a deficit would be greater to the student than the consequences of incorrectly identifying a student as potentially having a deficit. again, the cut score could be raised to identify more students with possible deficits and then confirm/disconfirm with further assessment.
The Gs subtest is also intended to screen for cognitive deficits, but it has enough ceiling to place students in the top 2% of the population. Overall classification accuracies are 0.96 and 0.97. The accuracies for the lower extreme are 0.72 and 0.79, indicating that between 21% and 28% of students placed in the category will not truly be in the bottom 2%. This represents 0.42-0.56% (e.g. 20% x 2%) of the population. The Gs subtest scores allow one to adequately select the group of students who are most likely to have cognitive deficits and then use additional information and/or additional testing to confirm/disconfirm the “deficit” hypothesis.
at least as important is the fact that the Gs classification accuracies for students as “not extremely exceptional” are 0.97 and 0.98. This indicates that the likelihood of “missing” a student who is truly in the bottom 2% of the distribution for Gs is less then 3%.
ReferencesBeal, a. L. (2011). Insight Test of Cognitive abilities. Markham, ON: Canadian Test Centre.
Campbell, D. T., & Kenny, D. a. (1999). A primer on regression artifacts. New York, NY: The Guildford Press.
Carroll, J. B. (1993). Human cognitive abilities: A survey of factor analytic studies. New York, NY: Cambridge University Press.
Flanagan, D. P., Mascolo, J., & Genshaft, J. L. (2000). a conceptual framework for interpreting preschool intelligence tests. In B. a. Bracken (ed.), The psychoeducational assessment of preschool children (pp. 428−472). Boston, Ma: allyn & Bacon.
Flanagan, D. P., Ortiz, S. O., alfonso, V. C., & Mascolo, J. T. (2006). The achievement test desk reference: A guide to learning disability identification. Hoboken, NJ: John Wiley & Sons.
Kane, M. T. (2006). Validation. In r. L. Brennan (Ed.), Educational measurement (4th ed., pp. 17−64.). Westport, CT: american Council on Education and Praeger.
Lord, F. M., & Novick, M. r. (1968). Statistical theories of mental test scores. reading, Ma: addison Wesley.
rogosa, D. r. (1994). Misclassification in student performance levels. 1994 CLAS Assessment Technical Report. Monterey, Ca: CTB/McGraw-Hill.

A1
Appendix A Expert Consensus Study of Insight, Dr. A. Lynne Beal
Insight was designed to measure seven of the broad abilities specified in the Cattell-Horn-Carroll (CHC) theory of cognitive abilities known to be important for learning in school. after drawing up the task specifications for each test, an expert consensus study was conducted to establish whether the tasks selected for each test would be valid measures of the broad ability it was intended to measure. This methodology was used for the Achievement Test Desk Reference (aTDr) (Flanagan, Ortiz, alfonso, & Mascolo, 2002).
The Experts
Experts were chosen for this study using the selection criteria used by the aTDr expert consensus study, provided on page 84 of the aTDr (2002). We sought individuals who possessed a thorough knowledge of CHC theory, including recent developments and refinements; the definitions of the broad and narrow abilities that comprise CHC theory (although a complete description of these definitions was provided with the validity study packet); and the empirical research in support of CHC theory, including the specific conjoined factor analyses that led to previous classifications of ability tests. In addition to this information, knowledge of the results of recent confirmatory factor analyses conducted with the WJ III tests of cognitive and academic ability, in particular was required.
We invited thirty-two experts to participate in the study of Insight. Fourteen of them had participated in the aTDr (2002) study (see page 547 for the list of participants). Thirteen experts completed the study and returned their evaluations.
The study followed the methodology used in the expert consensus study for the aTDr (Flanagan et al., 2002, pp. 84-89, 539-547). Experts were told that Insight is a group administered test under development to measure each of the seven broad cognitive abilities that are identified in CHC theory. They received descriptions of each of the seven subtests of Insight. Sample items were provided for each subtest. The names of the individual subtests were not provided. They were instructed to name the CHC Broad ability that a subtest most likely measures.
Experts were also asked to rate how good a measure of the Broad ability the subtest is. ratings used a Likert-type scale ranging from 1 (very poor) to 5 (very good). Space was available for the experts to write comments about their identification and rating of the most likely Broad ability.
as in the aTDr study, specific criteria were used to determine agreement among participants, relative to the broad ability classifications of tests. In general, when the percentage of agreement among participants for the broad ability test classifications was greater than or equal to 80%, then the test was classified as measuring a single broad ability corresponding to the consensus classification.
Results
Broad ability classifications yielded high agreement among the experts (see Table a-1). With agreement among experts at over 80% for each subtest, the Insight subtests could be classified as each measuring a single broad ability corresponding to consensus classification. On seven subtests all experts agreed as to the broad ability classification. On one subtest two experts (15.4%) rated the subtest to include verbal ability, one expert indicating this ability was predominant at Level 1 of Insight, but not involved at Level 2.
2011
A2
Table A-1: Percent of expert agreement on the broad ability measured by each Insight subtest
Subtest Broad Ability 1 Broad Ability 2
1 Fluid 92.3% Verbal 15.4%
2 Crystallized 100% Fluid 7.7%
3 Long-term Memory retrieval 100%
4 Visual-spatial ability 100%
5 Auditory processing 100%
6 Short-term memory 100%
7 Processing speed 100%
Experts rated the goodness of each subtest in measuring the broad ability that they named (see Table a-2). The rating scale ranged from 1 (very poor) to 5 (very good). One expert missed rating one of the broad abilities. Some experts provided comments with their opinions about the effectiveness of the subtests in measuring the abilities they had identified.
Table A-2: Average ratings for how well tasks measured broad abilities
Subtest Ratings for Broad Ability
Mean Mode
1 Fluid 4.5 5
2 Crystallized 4.4 5
3 Long-term Memory retrieval 4.3 4
4 Visual-spatial ability 4.7 5
5 Auditory processing 4.3 4, 5
6 Short term memory 3.9 4
7 Processing speed 4.2 4, 5
Experts showed strong agreement that the subtests as we described them were measures of the broad CHC abilities we intended them to measure.

A3
Reference
Flanagan, D. P., Ortiz, S. O., alfonso, V. C., & Mascolo, J. T. (2002.). The achievement test desk reference: Comprehensive assessment of learning disabilities. Boston: allyn & Bacon.

B1
Appendix B Insight Development and Psychometric Report, Richard Wolfe, Professor Emeritus, University of Toronto
2011

B2
General descriptionThe Canadian Test Centre, in conjunction with Dr. a. Lynne Beal, Psychologist, has created Insight (Beal, 2011), an innovative cognitive abilities assessment. Insight is based on the widely accepted Cattell-Horn-Carroll (CHC) theory of cognitive abilities and is designed to be used as a group-administered screening instrument. Insight is effective for assessing CHC-defined abilities critical to developing reading, written language, and mathematics skills.
Three levels of Insight are available, each appropriate for use with a particular grade span as shown in Figure B-1. The tests are normed depending on student age rather than grade, and the scale scores from the three levels are statistically linked (vertically equated) and thereby comparable across the full range of grades.
Grade spanTest Level
Grades 2 and 3Level 1
Grades 4 and 5Level 2
Grades 6 and 7Level 3
Figure B-1: Test levels and grade ranges
The Insight assessment is divided into seven subtests determined by the CHC theory. The number of items by subtest and level is given in Figure B-2.
Level 3Level 2Level 1
Number of items
303030Crystallized Knowledge (Gc)
303030Visual Processing (Gv)
303030Fluid Reasoning (Gf)
202320Short-Term Memory (Gsm)
724836Long-Term Memory Retrieval (Glr)
242219Auditory Processing (Ga)
494942Processing Speed (Gs)
Figure B-2: Subtests and number of items by level

B3
The test items used in a subtest overlap to some extent between levels. This allows vertical linkage of the test results and assures appropriate measurement across the ability range, within and between levels. The arrangement for one of the subtests (Gc) is shown in Figure B-3. a line between circles indicates the same item. For example, Item 30 in Level 1 is also Item 29 in Level 2. Notice that some items occur in all three levels, such as the item found as Item 29 in Level 1, Item 27 in Level 2, and Item 29 in Level 3.
Figure B-3: Item overlaps for the Gc subtest
Insight score reports provide the composite scores described in Figure B-4 to summarize a student’s cognitive abilities. In calculating each index score, equal weights are applied to the standardized subtest scores.
Subtest components
all subtestsInsight Ability Score (IAS)
Gv, Gf, Glr, GaInsight Thinking Index (ITI)
Gc, Gv, GfInsight General Ability Index (gI)
Gsm, GsInsight Memory/Processing Index (IMPI)
Figure B-4: Composite scores
B4
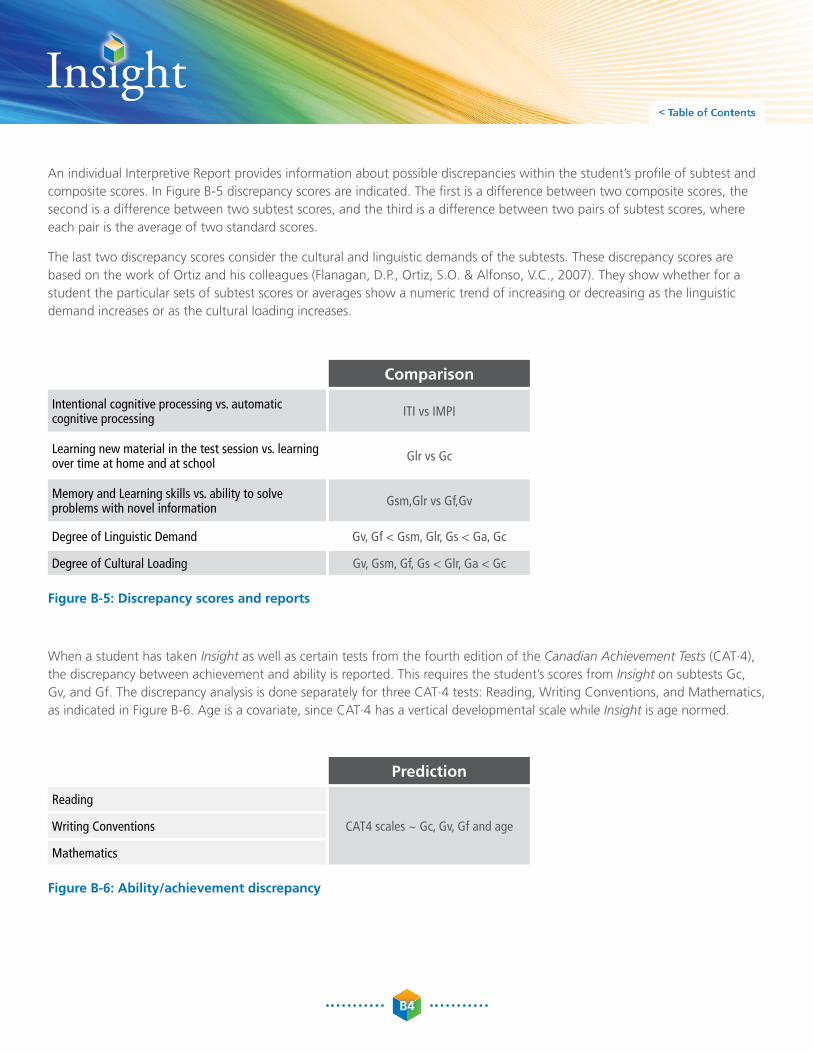
an individual Interpretive report provides information about possible discrepancies within the student’s profile of subtest and composite scores. In Figure B-5 discrepancy scores are indicated. The first is a difference between two composite scores, the second is a difference between two subtest scores, and the third is a difference between two pairs of subtest scores, where each pair is the average of two standard scores.
The last two discrepancy scores consider the cultural and linguistic demands of the subtests. These discrepancy scores are based on the work of Ortiz and his colleagues (Flanagan, D.P., Ortiz, S.O. & alfonso, V.C., 2007). They show whether for a student the particular sets of subtest scores or averages show a numeric trend of increasing or decreasing as the linguistic demand increases or as the cultural loading increases.
Comparison
ITI vs IMPIIntentional cognitive processing vs. automatic cognitive processing
Glr vs GcLearning new material in the test session vs. learning over time at home and at school
Gsm,Glr vs Gf,GvMemory and Learning skills vs. ability to solve problems with novel information
Gv, Gf < Gsm, Glr, Gs < Ga, GcDegree of Linguistic Demand
Gv, Gsm, Gf, Gs < Glr, Ga < GcDegree of Cultural Loading
Figure B-5: Discrepancy scores and reports
When a student has taken Insight as well as certain tests from the fourth edition of the Canadian Achievement Tests (CaT·4), the discrepancy between achievement and ability is reported. This requires the student’s scores from Insight on subtests Gc, Gv, and Gf. The discrepancy analysis is done separately for three CaT·4 tests: reading, Writing Conventions, and Mathematics, as indicated in Figure B-6. age is a covariate, since CaT·4 has a vertical developmental scale while Insight is age normed.
Prediction
CAT4 scales ~ Gc, Gv, Gf and age
Reading
Writing Conventions
Mathematics
Figure B-6: Ability/achievement discrepancy

B5
Development stepsThe items were written by Dr. a. Lynne Beal and Dr. rhia roberts. The items in each subtest pool were subsequently assigned to three different difficulty levels based on the apparent relative difficulties of the items. (after the first field test, items were assigned to levels based on empirically based difficulty estimates.) The distribution of items by level and subtest for the current (final) Insight test forms are given in Figure 2 above. During the development and norming stages of Insight, there were two earlier sets of forms. In the initial development forms, most subtests had substantially more items, as shown in Figure B-7, because an important goal was to gain information about many items and then use the information to construct more efficient smaller forms.
Level 3Level 2Level 1
Number of items
505050Crystallized Knowledge (Gc)
505050Visual Processing (Gv)
504030Fluid Reasoning (Gf)
505050Short-Term Memory (Gsm)
724836Long-Term Memory Retrieval (Glr)
505050Auditory Processing (Ga)
705649Processing Speed (Gs)
Figure B-7: Subtests and number of items by level for the initial development forms
In the next stage, a careful selection of items was made, keeping those that had the best statistical properties (e.g., high discrimination). This led to a new set of development forms, with items by subtest and level as show in Figure B-8.

B6
Level 3Level 2Level 1
Number of items
404035Crystallized Knowledge (Gc)
303030Visual Processing (Gv)
474742Fluid Reasoning (Gf)
242420Short-Term Memory (Gsm)
724836Long-Term Memory Retrieval (Glr)
242420Auditory Processing (Ga)
494942Processing Speed (Gs)
Figure B-8: Subtests and number of items by level for the later development forms
The data for the initial and later development forms were collected in four waves: Fall 2009, Winter 2010, Spring 2010, and Fall 2010. The initial development forms were used in the first two waves and the later developmental forms were used in the last two waves. There were large Canadian samples in all cases, as indicated in Figure B-9.
Level 3Level 2Level 1
212115111371Fall 2009
415121513203Spring 2010
202316301752Winter 2010
86912561183Fall 2010
916465487509Total
Figure B-9: Development/norming sample sizes
The total set of item and test form development data was used for the norming of Insight. This was possible because there were common items between levels and between the initial development forms and the later development forms. as a result, all the items could be jointly calibrated and equated. The norming sample was national, with the division by provinces shown in Figure B-10. The total sample size was 23,221.

B7
LaterInitialSample location
25911765AB
5853683BC
92820MB
38169NB
1010NL
1111169NS
298303NT
50083778ON
938223QC
1215298SK
12 81310 408Total
Sample size in each development stage
Figure B-10: Geographic distribution of norming samples
To provide national representation in the Insight norming, as described below, the development sample data were re-weighted in the analysis. This was done by regions as shown in Figure B-11.
Insight sample sizes
Reweighting factors
Initial stage
Census population proportions Later
stageInitial stage
Later stage
338 1250 2.537 0.845Atlantic 0.0824
3778 5008 1.367 1.269Ontario 0.4961
223 938 1.377 0.403Quebec 0.0295
5766 5319 0.699 0.933West 0.3873
303 298 0.161 0.202Territories 0.0047
Figure B-11: Regional Anglophone populations, samples, and weights

B8
Information from the norming study data was used to select items for the final form at each of the three levels. For each subtest at each level, items were selected after considering a number of criteria. Some of the more important criteria are as follows:
1. It was desirable to select as many items as possible that would discriminate well among the abilities of students at the lowest part of the normal distribution and among the abilities of the students at the highest part of the normal distribution, as the scores would ultimately be used to screen students for exceptionalities. In other words, selecting as many items as possible that were either very easy or very difficult at a particular level was desirable.
2. Items were selected so as to avoid (or counterbalance) items that showed gender bias. When choosing an item that showed gender bias, an attempt was made to counterbalance the bias by selecting another item with similar difficulty that showed a similar amount of bias in the opposite direction (i.e., favouring the opposite gender).
3. Items that showed poor item discrimination of students’ overall ability (point-biserial correlations) were avoided.

B9
Calibration, equating, scalingThe rasch item response theory (IrT) model provided the basis for calibrating the Insight assessment battery. This model defines a scale that unifies the statistical properties of the test items with the statistical measurement of the examinees. Specifically, for each item i there is characteristic difficulty βi and for each examinee j a characteristic ability θj and these together determine πij , the probability of correct response of the examinee to the item in a log-linear fashion:
log( πij / (1 – πij) ) = θj – βi
The rasch model states that these probabilities are effectively independent for any set of items given to an examinee with a given ability. From the rasch model flows an important set of consequences that permit coherent calibration and scaling of complex tests such as Insight.
• The estimated ability of an examinee is a non-linear function of the number of items answered correctly; the function can be calculated from the difficulty parameters of the included items.
• The standard errors of measurement of the abilities can also be calculated from the number of items answered correctly, as a function of the difficulty parameters of the items.
• Examinee ability can be estimated consistently on the same scale regardless of the set of items that is used.
• Item difficulty can be estimated consistently on the same scale regardless of the set of examinees that is used in calibration.
The prospect of using different item sets for different examinee samples has been important to the development and implementation of Insight. From the early to the later development forms to the final form, there are common items in each subtest, so consistent scaling is obtained (horizontal equating). Similarly, within a subtest from Level 1 to 2 to 3 there are common items, so there is a consistent, equated scale across levels (vertical equating). This is illustrated in Figure B-12. The vertical dimension represents the rasch ability scale, with the examinee ability distribution shown on the right. For the three levels, the positions of items are shown on the same scale. Since students taking Level 1 will usually have lower ability, there is a greater concentration of items in the lower part of the scale, and conversely for Level 3, while Level 2 has more items in the middle of the scale.

B10
Figure B-12: Illustration of Rasch model for vertical scaling
The rasch score estimated for an individual examinee is not the true score of the individual but rather the true score plus measurement error. The true score would be obtained, in theory, from a very long test or from averaging many repeated testings. The measurement error results from specific knowledge and skill of the individual on specific items, from increased or decreased attention during testing, from guessing, etc. In theory, measurement errors are random, and therefore should average out to zero over the many items in a test, but they leave some residual variation, which is represented as the standard error of measurement (the standard deviation of the measurement errors). For the Insight final forms, the relationship of the examinee ability, the standard error of measurement, and the locations of the items are shown in appendix B-a for each subtest and level.
In the rasch model, the standard error is found to be a function of the location of the individual ability and it depends on the relative position of the item difficulties. If there are few items near the ability, the error will be high, but if there are many, the error will be low. Score accuracy is a matter of matching item difficulty to examinee ability. Practically this means that, when developing a test for screening for exceptionalities, subtests intended to focus on low-ability examinees will include relatively more easy items, and subtests intended to focus on high-ability examinees will include relatively more difficult items. Items were selected for the final forms so as to maximize the score accuracy for students within exceptionalities.
B11
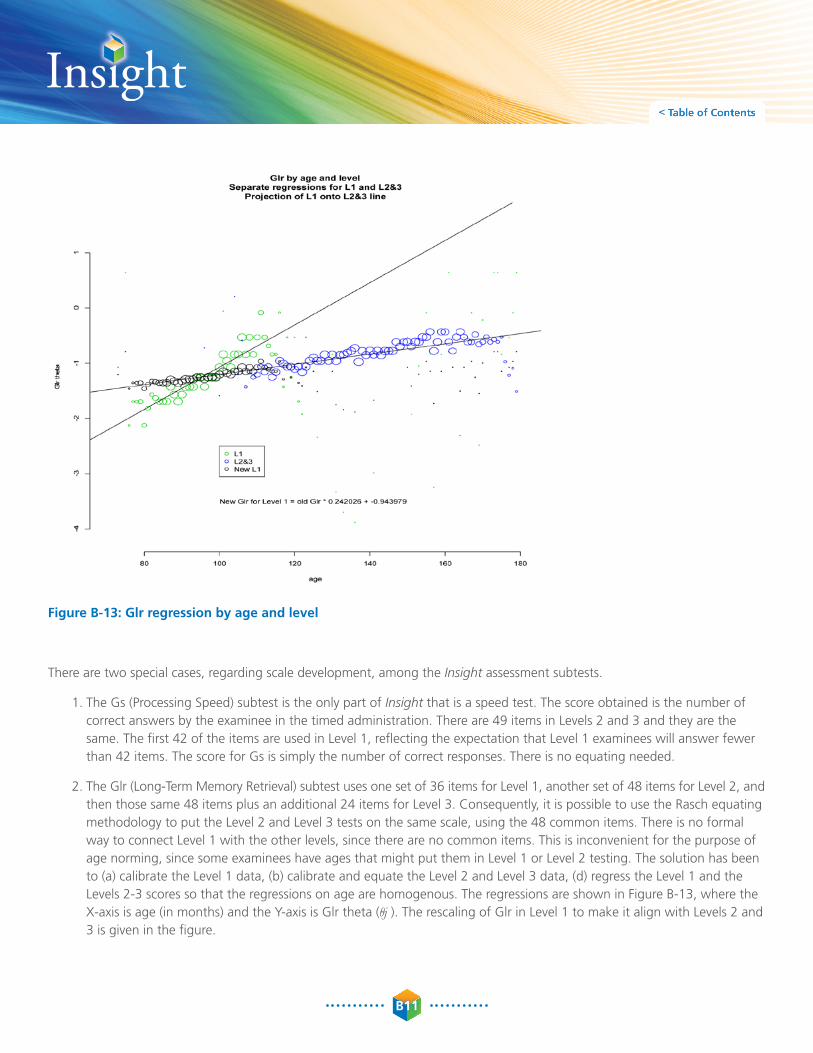
Figure B-13: Glr regression by age and level
There are two special cases, regarding scale development, among the Insight assessment subtests.
1. The Gs (Processing Speed) subtest is the only part of Insight that is a speed test. The score obtained is the number of correct answers by the examinee in the timed administration. There are 49 items in Levels 2 and 3 and they are the same. The first 42 of the items are used in Level 1, reflecting the expectation that Level 1 examinees will answer fewer than 42 items. The score for Gs is simply the number of correct responses. There is no equating needed.
2. The Glr (Long-Term Memory retrieval) subtest uses one set of 36 items for Level 1, another set of 48 items for Level 2, and then those same 48 items plus an additional 24 items for Level 3. Consequently, it is possible to use the rasch equating methodology to put the Level 2 and Level 3 tests on the same scale, using the 48 common items. There is no formal way to connect Level 1 with the other levels, since there are no common items. This is inconvenient for the purpose of age norming, since some examinees have ages that might put them in Level 1 or Level 2 testing. The solution has been to (a) calibrate the Level 1 data, (b) calibrate and equate the Level 2 and Level 3 data, (d) regress the Level 1 and the Levels 2-3 scores so that the regressions on age are homogenous. The regressions are shown in Figure B-13, where the X-axis is age (in months) and the Y-axis is Glr theta (θj ). The rescaling of Glr in Level 1 to make it align with Levels 2 and 3 is given in the figure.

B12
Norming and reportingThe rasch-based theta scores used in the development, calibration, and equating of Insight are not reported directly in Insight score reports. Instead, all the scores are normed with reference to examinee age in months. That is, each examinee score is referenced to the distribution of scores obtained by examinees of the same age, to the month. The norm referencing proceeds in these steps for each subtest:
1. Separate distributions of theta scores are calculated for each month.
2. For each month, the quantiles of the distribution are calculated by corresponding to the 15.9, 50, and 84.1 percentiles, which correspond in the normal distribution to –1, 0, and +1 standard deviations from the mean. The use of quantiles reduces the effects of outliers.
3. Each of three quantiles is plotted against the ages and a lowess (r=.4) regression is applied to obtain a smoothed value for each age. These are given in appendix C-B.
4. For a student at the given age, the theta score is compared to the smoothed middle quantile (i.e., at 50%). If theta is at the middle, it is converted to a standardized score of zero. If the theta is above the middle, the distance from the middle quantile to the upper (84.1%) quantile is taken as a standard deviation and, using that, theta is converted to a standard score. Similarly, if the theta is below the middle, the distance from the middle quantile to the lower (15.9%) quantile is taken as a standard deviation and theta is converted to a negative standard score.
5. at this point, the standardized scores are referenced to the normal distribution with a mean of zero and a standard deviation of one for examines at the age. These are reset to the final subtest scores by rescaling to a mean of 100 and standard deviation of 15 and rounded. If any scores are above 135, they are truncated to 135, and if any scores are below 65, they are truncated to 65. (a standard score of 135 is 2⅓ standard deviations above the mean, identifying the top 1% of the student population. Similarly, a standard score of 65 identifies the bottom 1% of the student population.)
6. From the final scores, national percentile ranks (NPr) and stanine ranks (Stn) are calculated by lookup from the normal distribution, as indicated in Figure C-14. The column “X” is the standard subtest score (mean 100, standard deviation 15) as calculated above. NPr is the estimated percentage of examinees in the age group (month) who are at that score and below. Stanine is a conventional simplified version of NPr.

B13
X NPR Stn X NPR Stn X NPR Stn X NPR Stn
65 1 1 81 10 2 101 53 5 121 92 8
66 1 1 82 12 3 102 55 5 122 93 8
67 1 1 83 13 3 103 58 5 123 94 8
68 2 1 84 14 3 104 61 6 124 95 8
69 2 1 85 16 3 105 63 6 125 95 8
70 2 1 86 18 3 106 66 6 126 96 8
71 3 1 87 19 3 107 68 6 127 96 9
72 3 1 88 21 3 108 70 6 128 97 9
73 4 1 89 23 4 109 73 6 129 97 9
74 4 2 90 25 4 110 75 6 130 98 9
75 5 2 91 27 4 111 77 6 131 98 9
76 5 2 92 30 4 112 79 7 132 98 9
77 6 2 93 32 4 113 81 7 133 99 9
78 7 2 94 34 4 114 82 7 134 99 9
79 8 2 95 37 4 115 84 7 135 99 9
80 9 2 96 39 4 116 86 7
97 42 5 117 87 7
98 45 5 118 88 7
99 47 5 119 90 8
100 50 5 120 91 8
Figure B-14: Transformation of standard scores to NPR and stanine

B14
The 95% confidence interval ranges for the subtest standard scores and the NPrs are calculated by repeating steps 4–6 above, using the individual theta value plus and minus 1.96 times the individual standard error from the rasch estimation.
a similar process is used for presenting results for the three discrepancy scores, ITI vs IMPI, Glr vs Gc, and Gsm,Glr vs Gf,Gv. The age-specific empirical distributions of the discrepancies are examined and smoothed estimates of the age-specific quantiles corresponding to normal quantiles of –1, 0, and 1 are calculated. (See the last pages of appendix C-B.) Then, when the discrepancy for an examinee is determined, its normal equivalent percentile is determined and this produces the frequency of occurrence and significance for reporting.
The indications of Degree of Linguistic Demand and Degree of Cultural Loading are simply based on the numeric values of the corresponding standard scores.

B15
Statistical analyses
Item statistics
During the developmental steps of the Insight assessment, careful selection was given to classical item statistics—difficulty, discrimination, distracter functioning. Items that showed problems were rewritten or discarded and replacement items were chosen. (as mentioned, the initial development pools were much larger than needed for the final tests.)
In the final construction of the subtests, the principal goal was to put items in each subtest at each level that would provide appropriate accuracy for students at the extremes of the ability distributions. The decisions about item selection were informed mainly by the item difficulty: the rasch beta parameter.
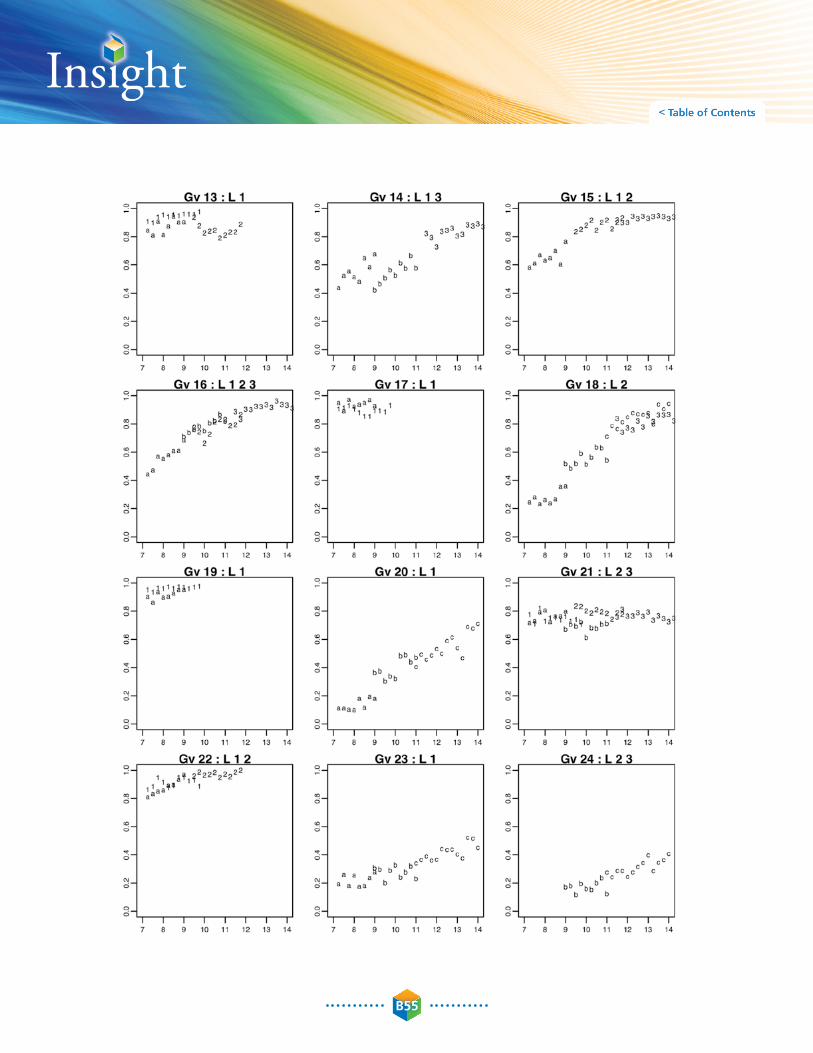
Further guidance was obtained from graphical regressions of the classical item difficulties (percent correct) on age, differentiated by level. a complete set of graphs for the Gc, Gv and Gf subtests is given in appendix B-C, with one graph for each item included in the final Insight assessment. an example of a graph is given in Figure B-15.
item
dif
ficu
lty
(p)
age
Figure B-15: Example of an item regressed on age and level

B16
This is the fifth item plotted for the Gc subtest (the numbering here is arbitrary). as indicated in the title, this item was used in the final assessment for Levels 1 and 2. The Y-axis shows the difficulty (proportion correct) observed for the item for examinees of different ages (in years). The plotting symbols indicate the test level, where 1, 2, and 3 are used for the later development data and a, b, and c are used for the initial development data. This item was used only in Level 1 for the initial development and in Levels 1 and 2 for the later development. It is an easy item and discriminates by age within Level 1 and discriminates generally between Level 1 and 2. For this reason, it was included in both the Level 1 and Level 2 final test forms.
Scale statistics
The reported subtest and index scores for Insight are standardized scores (SS) and are age-normed. This implies that they each have an overall distribution, within ages and across ages, with a mean of 100 and a standard deviation of 15, as seen in Figure B-16, which shows boxplots for each subtest and index.
Figure B-16: Distributions of standard scores for subtests and indices
Each subtest is administered independently of the others and consists of its own set of items, but the subtests are correlated because the underlying psychological constructs are correlated. The summary scores (composite index scores) are correlated highly with the subtests that compose them and correlated with one another because of the common subtests and also because of the correlations of the underlying constructs. Neither subtests nor index scores are correlated with age. This would be expected, given that standard scores are conditional upon age. Figure B-17 shows the correlation matrix of age and the standard scores for subtests and composites.

B17
Age Gc Gv Gsm Glr Gf Ga Gs IAS gl ITI IMPI
Age .00 –.01 .00 .02 –.01 –.01 .01 –.01 .00 .00 –.01
.00Gc .24 .22 .28 .26 .34 .12 .58 .66 .40 .22
–.01Gv .24 .18 .25 .29 .23 .16 .57 .73 .65 .22
.00Gsm .22 .18 .21 .19 .28 .20 .54 .25 .30 .80
.02Glr .28 .25 .21 .25 .32 .13 .57 .33 .64 .21
–.01Gf .26 .29 .19 .25 .25 .11 .57 .72 .64 .19
–.01Ga .34 .23 .28 .32 .25 .10 .61 .35 .67 .25
.01Gs .12 .16 .20 .13 .11 .10 .40 .16 .16 .72
–.01IAS .58 .57 .54 .57 .57 .61 .40 .81 .89 .61
.00gl .66 .73 .25 .33 .72 .35 .16 .81 .80 .27
.00ITI .40 .65 .30 .64 .64 .67 .16 .89 .80 .30
–.01IMPI .22 .22 .80 .21 .19 .25 .72 .61 .27 .30
Figure B-17: Correlation of age and subtest and summary standard scores
Confidence bounds for the national percentile ranks
all individual student scores for Insight are presented with confidence ranges showing the interval in which it can be assumed with 95% confidence that the true value falls. The calculation of ranges was described on page B12. a posteriori analysis was conducted to demonstrate the effective size of the national percentile rank ranges. This is given in appendix B-D and one of the graphs is given in Figure B-18.
Each graph refers to one of the subtests or index scores. The horizontal axis corresponds to the NPr (national percentile rank). Since these are age-normed results, the NPrs are compatible over student ages and over test levels, so all the data are merged for this analysis. (actually, this is based only on the data from the later development forms.) The diagonal black line is simply the NPr repeated. The curved line above the diagonal is the average upper bound for the NPr, and curved line below the diagonal is the average lower bound. For all subtests and indices, the bounds are wide in the middle of the distribution and converge to narrow at the lower and upper extremes. The tests with higher reliability have narrower bounds. These generally are the composite tests. For example, the Gc, Gv, and Gf each have 30 items and so the confidence bounds are relatively wide. But gI combines those and has 90 items and the confidence interval is relatively narrower.

B18
In interpreting this analysis, it should be kept in mind that the traits being evaluated are (approximately) normally distributed so that large differences in percentile consequently occur with small differences in tested measurements in the centre of the distribution. That is where the widest confidence intervals are found, but it is just a consequence of there being, in fact, little measurable difference between individuals who are at, say, the 40th and 50th percentiles. This is true for all group-administered and individually-administered assessments.
Figure B-18: Example of graph of NPR confidence bounds

B19
Validity analyses
Check on gender bias
In each of the stages of item and test development, statistical tests were carried out to identify any items that seemed to be biased according to gender; that is, any items that had particularly higher probabilities of correct responses for boys or for girls, controlling for ability.
The “differential item functioning” or DIF statistic is calculated for each item as the standardized difference in rasch difficulty comparing boys (positive) with girls (negative). Items that had DIF statistic values equal to or larger than 2 standard errors were omitted from the final forms whenever possible. Items showing this degree of bias that couldn’t be omitted were usually counterbalanced with an item of comparable difficulty and a comparable degree of bias in the other direction. For example, an item with DIF statistic around −2 was usually counterbalanced with an item of comparable difficulty and a DIF statistic around +2.
For the final development forms at each level for subtests Gc, Gv, and Gf, the distribution of DIF statistics is shown over all items in Figure B-19. Most items are in the normal range between +/– 2. There are some items that show significant DIF, but the fact that they are about evenly balanced between bias in favour of boys and bias in favour of girls suggests that there is little overall bias in the tests.
Figure B-19: Differential item functioning in the final development items in Gc, Gv, and Gf
B20
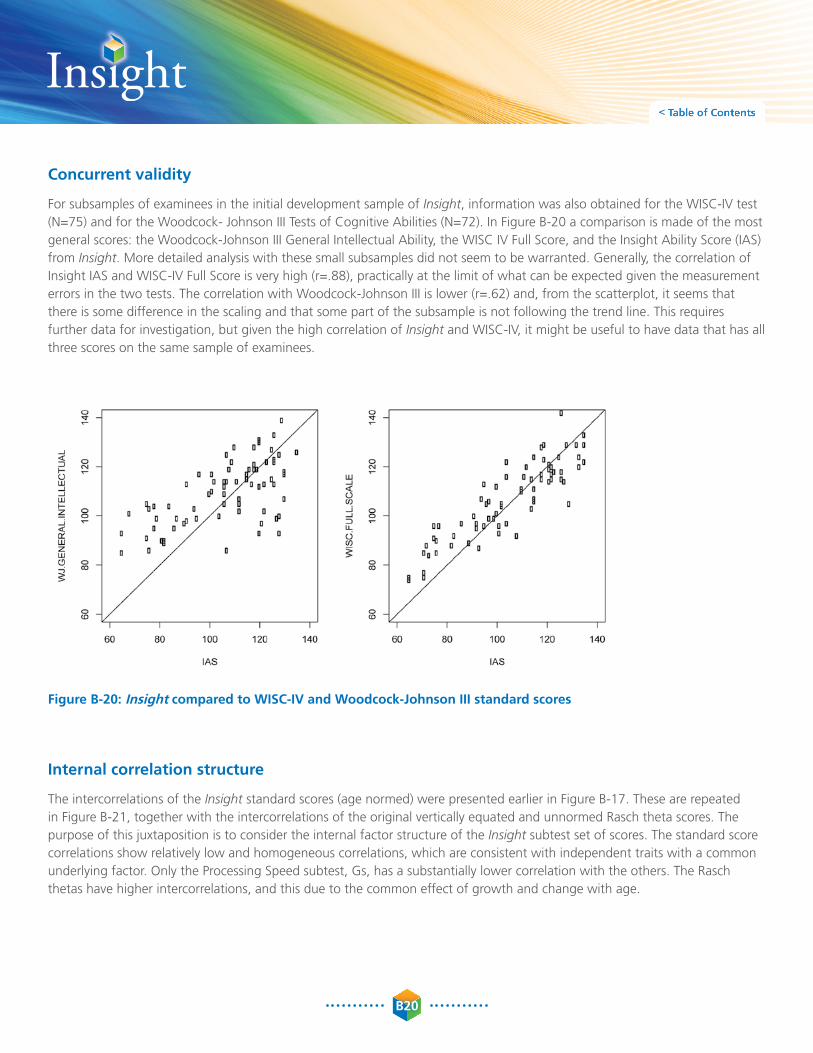
Concurrent validity
For subsamples of examinees in the initial development sample of Insight, information was also obtained for the WISC-IV test (N=75) and for the Woodcock- Johnson III Tests of Cognitive abilities (N=72). In Figure B-20 a comparison is made of the most general scores: the Woodcock-Johnson III General Intellectual ability, the WISC IV Full Score, and the Insight ability Score (IaS) from Insight. More detailed analysis with these small subsamples did not seem to be warranted. Generally, the correlation of Insight IaS and WISC-IV Full Score is very high (r=.88), practically at the limit of what can be expected given the measurement errors in the two tests. The correlation with Woodcock-Johnson III is lower (r=.62) and, from the scatterplot, it seems that there is some difference in the scaling and that some part of the subsample is not following the trend line. This requires further data for investigation, but given the high correlation of Insight and WISC-IV, it might be useful to have data that has all three scores on the same sample of examinees.
Figure B-20: Insight compared to WISC-IV and Woodcock-Johnson III standard scores
Internal correlation structure
The intercorrelations of the Insight standard scores (age normed) were presented earlier in Figure B-17. These are repeated in Figure B-21, together with the intercorrelations of the original vertically equated and unnormed rasch theta scores. The purpose of this juxtaposition is to consider the internal factor structure of the Insight subtest set of scores. The standard score correlations show relatively low and homogeneous correlations, which are consistent with independent traits with a common underlying factor. Only the Processing Speed subtest, Gs, has a substantially lower correlation with the others. The rasch thetas have higher intercorrelations, and this due to the common effect of growth and change with age.

B21
Rasch thetas Gc Gv Gsm Glr Gf Ga Gs
Standard scores Gc Gv Gsm Glr Gf Ga Gs
Gc .37 .43 .33 .37 .32 .33
Gc .24 .22 .28 .26 .34 .12
Gv .37 .32 .31 .35 .26 .27
Gv .24 .18 .25 .29 .23 .16
Gsm .43 .32 .29 .28 .30 .36
Gsm .22 .18 .21 .19 .28 .20
Glr .33 .31 .29 .28 .35 .18
Glr .28 .25 .21 .25 .32 .13
Gf .37 .35 .28 .28 .26 .21
Gf .26 .29 .19 .25 .25 .11
Ga .32 .26 .30 .35 .26 .12
Ga .34 .23 .28 .32 .25 .10
Gs .33 .27 .36 .18 .21 .12
Gs .12 .16 .20 .13 .11 .10
Figure B-21 Internal correlations for Rasch thetas and standard subtest scores
Connection to Canadian Achievement Tests (CAT·4)One optional result from Insight is an individual discrepancy analysis between CaT·4 scores and those scores predicted from Insight scores and age. This requires information on the three Insight subtests Gc, Gv, and Gf and a match between Insight and CaT·4 scores. The CaT·4 standard scores for reading, Writing Conventions, and Mathematics are used. The analysis is done separately, so results can be provided for any or all of them.
The prediction equations were developed from a sample of 4,329 cases with matching data for Insight and CaT·4 found across the four developmental samples (see Figure B-9). For this population, the correlations between and across Insight and CaT·4 and with age are shown in Figure B-22. all correlations are statistically significant, except for those between age and the Insight subtests, which are age-normed.

B22
Age CAT·4 Reading
CAT·4 W Conv
CAT·4 Math
Insight Gc
Insight Gv
Insight Gf
.61 .43 .63 .00 –.01 –.01Age
.61 .75 .78 .49 .28 .32Reading
.43 .75 .72 .49 .31 .40W Conv
.63 .78 .72 .42 .40 .40Math
.00 .49 .49 .42 .34 .37Gc
–.01 .28 .31 .40 .34 .42Gv
–.01 .32 .40 .40 .37 .42Gf
Figure B-22: Correlations of Insight and CAT·4 and age
Since CaT·4 is developmental with age and Insight is age-normed, a better indication of the cross-correlations is obtained by partialling by age, as shown in Figure B-23. all the partial correlations are higher than the simple correlations.
CAT·4 Reading
CAT·4 W Conv
CAT·4 Math
Insight Gc
Insight Gv
Insight Gf
.69 .64 .60 .35 .42Reading
.69 .64 .55 .36 .47W Conv
.64 .64 .51 .50 .52Math
.60 .55 .51 .34 .37Gc
.35 .36 .50 .34 .42Gv
.42 .47 .52 .37 .42Gf
Figure B-23: Partial correlations of Insight and CAT·4 controlling age
The correlations and partial correlations reported in the figures above are based on linear relationships with age in whole years.
To provide formulas to predict the three CaT·4 standard scores from the three Insight subtests, a separate multiple regression was calculated for each CaT·4 score using the Insight variables as predictors along with dummy variables for each of the ages 7 to 14 and no intercept. The multiple correlations were .81, .71, and .82 for reading, Writing Conventions, and Mathematics respectively. all Insight subtests were significant in each regression.
The regression prediction formulas and the standard errors of prediction separated by age are given in Figure B-24.

B23
Multiple regression
Standard errors of prediction
CAT·4 Writing
Conventions
CAT·4 Reading
CAT·4 Mathematics
Age 7 87.6218.2 183.9
Age 7 83.739.9 44.7
Age 8 100.3240.6 216.7
Age 8 51.833.7 39.1
Age 9 138.4275.4 249.0
Age 9 57.936.1 33.4
Age 10 174.2297.9 266.7
Age 10 48.631.7 27.8
Age 11 183.8308.4 274.9
Age 11 41.130.5 27.4
Age 12 198.1318.4 288.1
Age 12 42.426.2 26.4
Age 13 222.5325.5 305.6
Age 13 52.927.3 29.8
Age 14 209.7333.2 307.5
Age 14 60.529.7 31.0
Insight Gc 1.7201.376 .877
Insight Gv .196.156 .716
Insight Gf 1.137.543 .785
Figure B-24: Regression analyses of CAT·4 standard scores on Insight subtests
a further set of information needed for the CaT·4 discrepancy analysis was the standard errors of measurement of the CaT·4 standard scores. This was calculated from the published CaT·4 Technical Manual, which included the standard deviation and reliability by CaT·4 level. The results of the calculation are given in Figure B-25.

B24
LevelCAT·4
Writing Conventions
CAT·4 Reading
CAT·4 Mathematics
10 17.4 24.6
11 15.4 16.0
12 25.515.4 12.3
13 25.514.1 12.3
14 18.912.1 9.9
15 19.912.1 10.5
16 21.812.1 9.9
17 20.812.1 9.9
18 18.012.7 9.9
19 18.912.1 10.5
20 21.8
Figure B-25: Standard errors of measurement for CAT·4 scale scores by level
This information is used for reporting purposes as follows:
1. Upper and lower confidence bounds for the CaT·4 score are based on the normal distribution with the standard errors of measurement as given in Figure B-25.
2. The predicted CaT·4 score is calculated from age in years and the Insight subtests using the regression formulas given in the top part of Figure B-24.
3. Upper and lower confidence bounds for that prediction (assuming that the student received an actual CaT·4 score which is the same score as predicted when s/he wrote the same level of CaT·4) is based again on the standard error of measurement given in Figure B-25.
4. The percentile of the discrepancy between CaT·4 and the prediction, is based on the normal distribution and the standard error of regressions as given in the bottom part of Figure B-24.
5. The significance (.05) of the residual deviation of the CaT·4 prediction from the actual is tested, based on percentile discrepancy.

B25
References
Beal, a. Lynne (2011). Insight Test of Cognitive abilities. Markham, ON: Canadian Test Centre.
Flanagan, D.P., Ortiz, S.O. & alfonso, V.C. (2007). Essentials of Cross-Battery Assessment, Second Edition. Hoboken, New Jersey: John Wiley & Sons, Inc.

B26
Appendix B-A. Item locations and standard errors by subtest and level for norming forms

B27

B28

B29

B30

B31

B32

B33
Appendix B-B. Smoothed distributions of theta and composite scores by age

B34

B35

B36

B37

B38

B39

B40

B41

B42

B43

B44

B45

B46

B47

B48
Appendix B-C. Item-age regressions for Gc, Gv, and Gf

B49

B50

B51

B52

B53

B54
B55

B56

B57

B58

B59

B60

B61

B62
Appendix B-D. NPR lower and upper confidence bounds by subtest and summary score

B63

B64

B65
References
Beal, a. Lynne (2011). Insight Test of Cognitive abilities. Markham, ON: Canadian Test Centre.
Flanagan, D.P., Ortiz, S.O, & alfonso, V.C. (2007). Essentials of Cross-Battery assessment, Second Edition. New York: John Wiley & Sons, Inc.