information visualizationinformation visualization
TRANSCRIPT

1
Information VisualizationInformation Visualization
Ji Y
1
Jing YangSpring 2010
Visual PerceptionVisual Perception
2

2
SemioticsThe study of symbols and how they convey meaningSensory vs. Arbitrary symbolsy y ySensory representation
Understanding without trainingResistance to instructional biasSensory immediacyCross-cultural validity
Arbitrary representationHard to learn
3
Hard to learnEasy to forgetEmbedded in culture and applicationsFormally powerfulCapable of rapid change
Most visualizations are hybrids!
Related Disciplines
PsychophysicsA l i th d f h i t iApplying methods of physics to measuring human perceptual systems
How fast must light flicker until we perceive it asconstant?What change in brightness can we perceive?
Cognitive psychology
4
Cognitive psychologyUnderstanding how people think, here, how it relates to perception
- Dr. John Stasko, Slides of CS7500 at Gatech

3
Visual Perception
What is visual perception?f k i b i fprocess of knowing or being aware of
information through the eyes.process of acquiring, interpreting, selecting, and organizing sensory information.
http://en.wikipedia.org/wiki/Perception
5
One Simple Model of Perceptual Processing
Three stage processParallel extraction of low-level properties of sceneParallel extraction of low-level properties of scenePattern perceptionSequential goal-directed processing
Stage 1 Stage 3Stage 2
6
Early, parallel detection of color, texture, shape, spatial attributes
Holding objects in working memory by demands of active attention
Ware 2004
Dividing visual field into regions and simple patterns

4
Stage 1 - Low-level, Parallel
Neurons in eye & brain are responsible for different kinds of informationdifferent kinds of information
Orientation, color, texture, movement, etc.Arrays of neurons work in parallelOccurs “automatically”Rapid Information is transitory briefly held in iconic
7
Information is transitory, briefly held in iconic storeBottom-up, data-driven model of processingOften called “pre-attentive” processing
- Dr. John Stasko, Slides of CS7500 at Gatech
Stage 2 – Pattern Perception
Slow serial processingI l ki d l tInvolves working and long-term memoryA combination of bottom-up feature processing and top-down attentionalmechanismsDifferent pathways for object recognition and i ll id d ti
8
visually guided motion

5
Stage 3 – Sequential Goal-Directed
A few objects are constructed from the available patterns to provide answers toavailable patterns to provide answers to visual queries Top-down attention-driven model of processingSlow serial processing
9
Key Perceptual Properties
BrightnessC lColorTextureShape
10

6
Luminance/Brightness
LuminanceMeasured amount of light coming from some placeMeasured amount of light coming from some placeLuminance is a photometric measure of the density of luminous intensity in a given direction. It describes the amount of light that passes through or is emitted from a particular area, and falls within a given solid angle. -wikipedia
Brightness
11
gPerceived amount of light coming from sourceBrightness is the perception elicited by the luminance of a visual target. This is a subjective attribute/property of an object being observed. -wikipedia
Brightness
Perceived brightness is non-linear function of amount of light emitted by sourceamount of light emitted by sourceS = aIn
S – sensationI - intensity
12

7
Grayscale
A series of shades from white to black P b bl t b t t d d tProbably not best way to encode data because of contrast issues
Surface orientation and surroundings matter a great deal
13
Luminance channel of visual system is so fundamental to so much of perception
We can get by without color discrimination, but not luminance
Trichromacy Theory
Fact: we have 3 distinct color receptorscolor receptorsColor space: three dimensionalColor blindness: lack of the receptors for the long or medium wavelength
14
wavelengthCan’t distinguish green and red
http://www.handprint.com/HP/WCL/color1.html#receptors

8
RGB Color Space
C R G bBC ≡ rR + gG + bB
C: colorR, G, B: the primary light sources to be used to create a match
15
r, g, b: the amounts of each primary light≡ : perceptual match
HVS Color Space
HVS encapsulates information about a color in terms that are more familiar to humans:in terms that are more familiar to humans: What color is it? How vibrant is it? How light or dark is it?
Hue: the color type (such as red, blue, or yellow)
16
Value (brightness): light/dark of the colorSaturation: the "vibrancy" of the color
http://en.wikipedia.org/wiki/HSV_color_space

9
HSL Color Space
Hue: the color type (such as red blue or yellow)red, blue, or yellow)Saturation: the "vibrancy" of the color Luminance: measured amount of light coming from some place
17
some place
Luminance
What if the color space has only the luminance dimension?luminance dimension?
Grayscale We can get by 99% of time
Luminance channel of visual system is so
18
fundamental to so much of perception

10
Luminance
Important for foreground -background colors to differ in brightnessto differ in brightness
19Slide courtesy of John Stasko
Color Categories
Are there certain canonical colors?canonical colors?
Post & Greene ’86 had people name different colors on a monitorPictured are ones
20
with > 75 commonality
From Ware 04

11
Color for Categories
Can different colors be used for categorical variables?variables?
Yes (with care)Ware’s suggestion: 12 colors
red, green, yellow, blue, black, white, pink, cyan, gray, orange, brown, purple
21
ColorBrewer Qualitative Set
22
http://www.personal.psu.edu/cab38/ColorBrewer/ColorBrewer.html
12
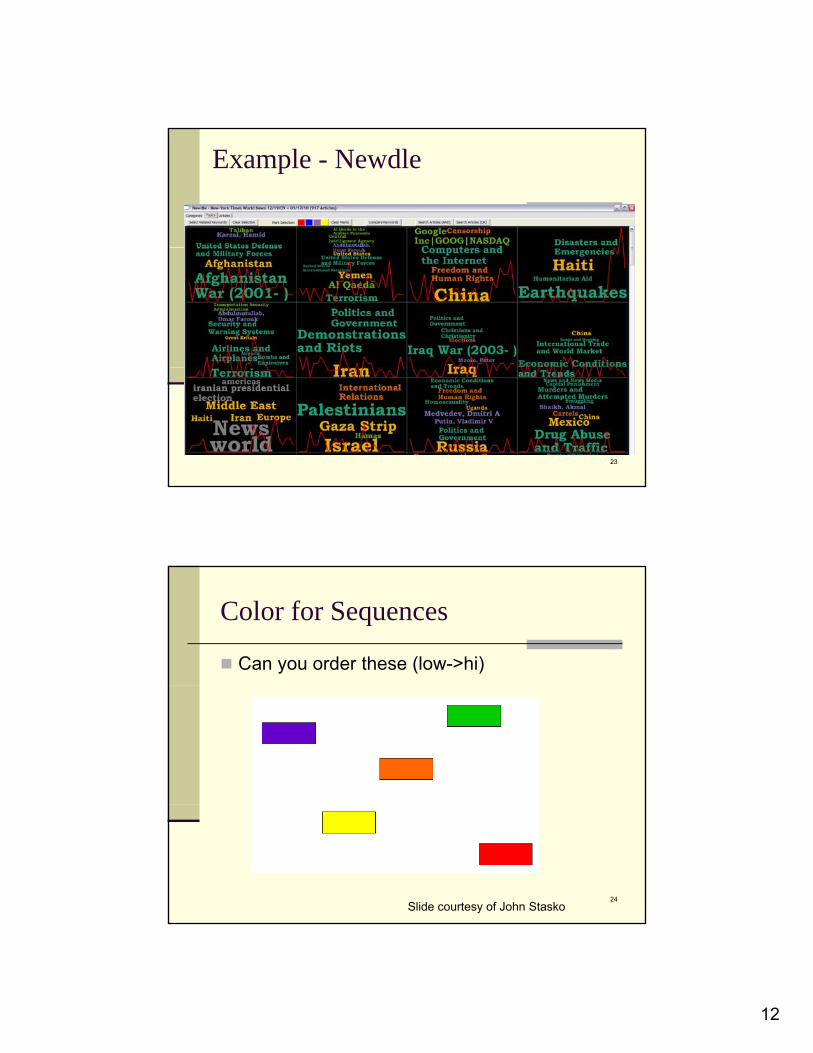
Example - Newdle
23
Color for Sequences
Can you order these (low->hi)
24Slide courtesy of John Stasko

13
Possible Color Sequences
25Slide courtesy of John Stasko
ColorBrewer Sequential Set
26
http://www.personal.psu.edu/cab38/ColorBrewer/ColorBrewer.html

14
Show Variations Above and Below Zero
Use a neutral value to represent zeroI i t ti (?) t d itIncrease in saturation (?) toward opposite colors to show positive and negative values
27
ColorBrewer Diverging Set
28
http://www.personal.psu.edu/cab38/ColorBrewer/ColorBrewer.html

15
Example
Record ocean depth and landdepth and land heightThe deeper or higher, the darker
29
General Bathymetric Chart of the Oceans
30

16
Contextual Effects
ANY color coding of quantity (whether based on variations on hue value or saturation) ison variations on hue, value, or saturation) is potentially sensitive to interactive contextual effects
31
Reduce Color Contrast Errors
Use borders to reduce contrast errorsTh li i t d fl ti d k hThey eliminate edge fluting and make each field a more coherent whole
32

17
Color Purposes
Call attention to specific dataI l bilitIncrease appeal, memorabilityIncrease number of dimensions for encoding data
33Slide courtesy of John Stasko
Using Color
Modesty! Less is moreU bl i l i t thi liUse blue in large regions, not thin linesUse red and green in the center of the field of view (edges of retina not sensitive to these)Use black, white, and yellow in peripheryUse adjacent colors that vary in hue & value
34Slide courtesy of John Stasko

18
Using Color
For large regions, don’t use highly saturated colorscolors Do not use adjacent colors that vary in amount of blueDon’t use high saturation, spectrally extreme colors together U l f i d h
35
Use color for grouping and searchBeware effects from adjacent color regions
Slide courtesy of John Stasko
Other Effects of Color
Physiological effects - the effect of color on health and behaviorhealth and behavior.Color symbolism - our responses to color are also influenced by color associations from our culture.Personal color preferences - our own color preferences are important to us
36
preferences are important to us.

19
Texture
Appears to be combination ofi t tiorientation
scalecontrast
Complex attribute to analyze
37
Shape, Symbol
Can you develop a set of unique symbols that can be placed on a display and be rapidlycan be placed on a display and be rapidly perceived and differentiated?
Application for maps, military, etc.Want to look at different preattentive aspects
38

20
Glyph Construction
Suppose that we use two different visual properties to encode two different variables inproperties to encode two different variables in a discrete data set
color, size, shape, lightnessWill the two different properties interact so that they are more/less difficult to untangle?
Integral two properties are viewed holistically
39
Integral - two properties are viewed holisticallySeparable - Judge each dimension independently
Integral-Separable
Not one or other, but along an axis
40

21
Pre-attentive Processing
The most important contribution of vision science to data visualization is that:science to data visualization is that:A limited set of visual properties can be detected
very rapidly and accurately by the low-level visual system
Tasks that can be performed on large multi-element displays in less than 200 to 250
41
element displays in less than 200 to 250 milliseconds (msec) are considered pre-attentive. (Eye movements: 200 msec)
http://www.csc.ncsu.edu/faculty/healey/PP/index.html
Count 3s
42- Dr. John Stasko, Slides of CS7500 at Gatech

22
Tasks
Target detectionI thi th ?Is something there?
Boundary detectionCan the elements be grouped?
CountingHow many elements of a certain type are
43
present?
Pre-attentive Features
Form Line orientation
ColorHueLine orientation
Line lengthLine widthLine collinearitySizeCurvatureS ti l i
HueIntensity
MotionFlickerDirection of motion
Spatial Position
44
Spatial groupingBlurAdded marksNumerosity
2D positionStereoscopic depthConvex/concave shape from shading

23
Example
Find the distinct one
45
Orientation
46Ware 2004

24
Curved/Straight
47Ware 2004
Shape
48Ware 2004

25
Shape
49Ware 2004
Size
50Ware 2004

26
Number
51Ware 2004
Hue
52Ware 2004

27
Gray/Value
53Ware 2004
Enclosure
54Ware 2004

28
Covexity/Concavity
55Ware 2004
Addition
56Ware 2004

29
Juncture
57Ware 2004 Not!
Parallelism
58Ware 2004 Not!

30
Multiple Symbol Types
Pre-attentive symbols become less distinct as the
59
yvariety of distracters increaseTwo factors
Degree of difference of target from nontargetsDegree of difference of nontargets from each other
Example
Determine if a red circle is present
60

31
Conjunction of Features
Cannot be done pre-attentively
61
p yMust perform a sequential searchConjunction of features (shape and hue) causes it
- Dr. John Stasko, Slides of CS7500 at Gatech
Example
Is there a boundary in the display?
62

32
Mixed Features
L ft b d tt ti l i h
63
Left can be done pre-attentively since each group contains one unique featureRight cannot (there is a boundary!) since the two features are mixed (fill and shape)
- Dr. John Stasko, Slides of CS7500 at Gatech
Example
Is there a boundary in the display?
64

33
Feature Hierarchy: Hue vs. Shape
Left: Boundary detected pre-attentively based on hue regardless f h
65
of shapeRight: a horizontal form boundary cannot be pre-attentively identified when hue varies randomly in the background Visual systems favor hue over shape
http://www.csc.ncsu.edu/faculty/healey/PP/index.html
Feature Hierarchy: Hue vs. Brightness
Left: Boundary detected pre-attentively based on hue regardless f b i ht
66
of brightnessRight: a horizontal form boundary cannot be pre-attentively identified when hue varies randomly in the background Visual systems favor hue over brightness
http://www.csc.ncsu.edu/faculty/healey/PP/index.html

34
Discussion
What can we do using pre-attentive features?
67
Stage 2
Missing!M b i th f tMaybe in the future
68

35
References
Dr. Colin Ware
69
References
Edward Tufte: Envisioning InformationAl l t f lid f J h St k ’ i f iAlso, lots of slides from John Stako’s infovisclass were used!
70