information visualization tables
TRANSCRIPT

https://www.students.cs.ubc.ca/~cs-436v/21Jan/
Information Visualization Tables
Tamara MunznerDepartment of Computer ScienceUniversity of British Columbia
Week 3 async video, Jan 2021

Tables
2
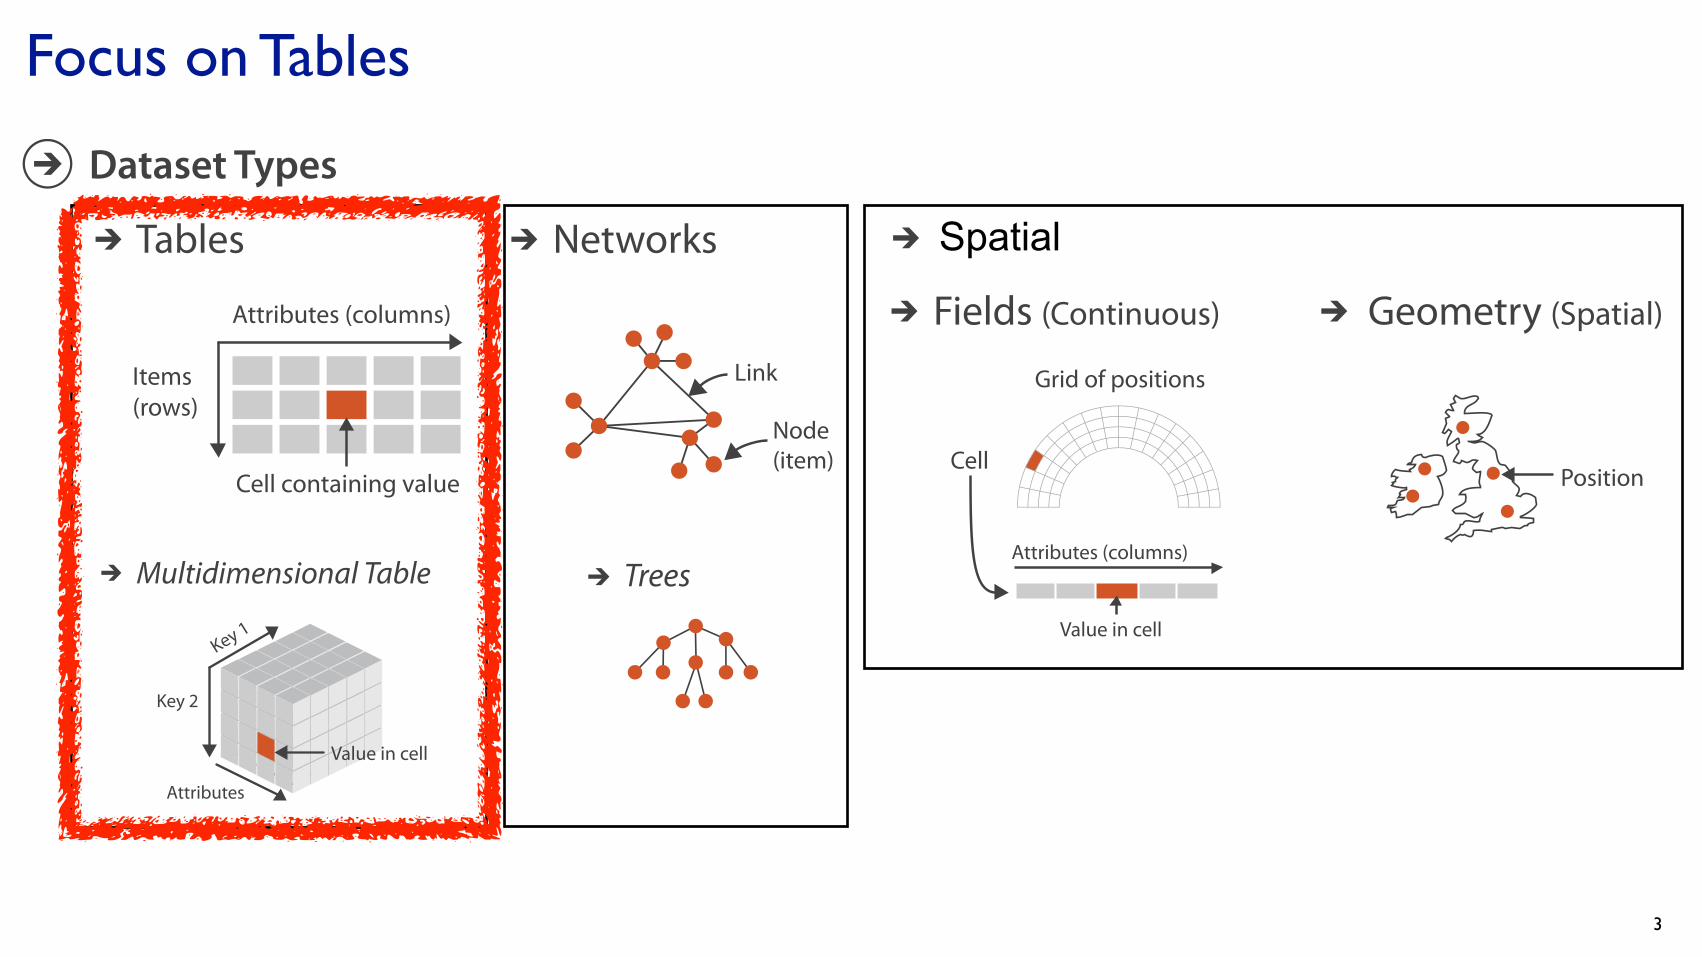
Focus on Tables
3
Tables
Attributes (columns)
Items (rows)
Cell containing value
Networks
Link
Node (item)
Trees
Fields (Continuous)
Attributes (columns)
Value in cell
Cell
Multidimensional Table
Value in cell
Grid of positions
Geometry (Spatial)
Position
Dataset Types SpatialTables
Attributes (columns)
Items (rows)
Cell containing value
Networks
Link
Node (item)
Trees
Fields (Continuous)
Attributes (columns)
Value in cell
Cell
Multidimensional Table
Value in cell
Grid of positions
Geometry (Spatial)
Position
Dataset Types
Tables
Attributes (columns)
Items (rows)
Cell containing value
Networks
Link
Node (item)
Trees
Fields (Continuous)
Attributes (columns)
Value in cell
Cell
Multidimensional Table
Value in cell
Grid of positions
Geometry (Spatial)
Position
Dataset Types
Tables
Attributes (columns)
Items (rows)
Cell containing value
Networks
Link
Node (item)
Trees
Fields (Continuous)
Attributes (columns)
Value in cell
Cell
Multidimensional Table
Value in cell
Grid of positions
Geometry (Spatial)
Position
Dataset Types
Tables
Attributes (columns)
Items (rows)
Cell containing value
Networks
Link
Node (item)
Trees
Fields (Continuous)
Attributes (columns)
Value in cell
Cell
Multidimensional Table
Value in cell
Grid of positions
Geometry (Spatial)
Position
Dataset TypesTables
Attributes (columns)
Items (rows)
Cell containing value
Networks
Link
Node (item)
Trees
Fields (Continuous)
Attributes (columns)
Value in cell
Cell
Multidimensional Table
Value in cell
Grid of positions
Geometry (Spatial)
Position
Dataset Types

4
Keys and values
• key–independent attribute–used as unique index to look up items–simple tables: 1 key–multidimensional tables: multiple keys
• value–dependent attribute, value of cell
Tables
Attributes (columns)
Items (rows)
Cell containing value
Networks
Link
Node (item)
Trees
Fields (Continuous)
Attributes (columns)
Value in cell
Cell
Multidimensional Table
Value in cell
Grid of positions
Geometry (Spatial)
Position
Dataset Types

ARRANGE TABLESEXPRESS VALUES
SEPARATE, ORDER, ALIGN REGIONS
AXIS ORIENTATION
LAYOUT DENSITY
Dense Space!lling
Separate Order Align
1 Key 2 Keys 3 Keys Many KeysList Recursive SubdivisionVolumeMatrix
Rectilinear Parallel Radial
5
Keys and values
• key–independent attribute–used as unique index to look up items–simple tables: 1 key–multidimensional tables: multiple keys
• value–dependent attribute, value of cell
• classify arrangements by key count–0, 1, 2, ...
ARRANGE TABLESEXPRESS VALUES
SEPARATE, ORDER, ALIGN REGIONS
AXIS ORIENTATION
LAYOUT DENSITY
Dense Space!lling
Separate Order Align
1 Key 2 Keys 3 Keys Many KeysList Recursive SubdivisionVolumeMatrix
Rectilinear Parallel Radial
Arrange Tables
Express Values
Separate, Order, Align Regions
Axis Orientation
Layout Density
Dense Space-Filling
Separate Order Align
1 Key 2 Keys 3 Keys Many KeysList Recursive SubdivisionVolumeMatrix
Rectilinear Parallel Radial
Tables
Attributes (columns)
Items (rows)
Cell containing value
Networks
Link
Node (item)
Trees
Fields (Continuous)
Attributes (columns)
Value in cell
Cell
Multidimensional Table
Value in cell
Grid of positions
Geometry (Spatial)
Position
Dataset Types
0

Idiom: scatterplot• express values (magnitudes)
–quantitative attributes
• no keys, only values
6[A layered grammar of graphics. Wickham. Journ. Computational and Graphical Statistics 19:1 (2010), 3–28.]
Arrange Tables
Express Values
Separate, Order, Align Regions
Axis Orientation
Layout Density
Dense Space-Filling
Separate Order Align
1 Key 2 Keys 3 Keys Many KeysList Recursive SubdivisionVolumeMatrix
Rectilinear Parallel Radial

Idiom: scatterplot• express values (magnitudes)
–quantitative attributes
• no keys, only values–data
• 2 quant attribs
–mark: points–channels
• horiz + vert position
7[A layered grammar of graphics. Wickham. Journ. Computational and Graphical Statistics 19:1 (2010), 3–28.]
Arrange Tables
Express Values
Separate, Order, Align Regions
Axis Orientation
Layout Density
Dense Space-Filling
Separate Order Align
1 Key 2 Keys 3 Keys Many KeysList Recursive SubdivisionVolumeMatrix
Rectilinear Parallel Radial

Idiom: scatterplot• express values (magnitudes)
–quantitative attributes
• no keys, only values–data
• 2 quant attribs
–mark: points–channels
• horiz + vert position
–tasks• find trends, outliers, distribution, correlation, clusters
–scalability• hundreds of items
8[A layered grammar of graphics. Wickham. Journ. Computational and Graphical Statistics 19:1 (2010), 3–28.]
Arrange Tables
Express Values
Separate, Order, Align Regions
Axis Orientation
Layout Density
Dense Space-Filling
Separate Order Align
1 Key 2 Keys 3 Keys Many KeysList Recursive SubdivisionVolumeMatrix
Rectilinear Parallel Radial

Scatterplots: Encoding more channels
• additional channels viable since using point marks– color– size (bubbleplots)
• radius is misleading, take square root since area grows quadratically
– shape
9https://observablehq.com/@d3/scatterplot-with-shapeshttps://www.d3-graph-gallery.com/graph/bubble_basic.html

Scatterplot tasks
10

Scatterplot tasks
• correlation
11
https://www.mathsisfun.com/data/scatter-xy-plots.html

Scatterplot tasks
• correlation
• clusters/groups, and clusters vs classes
12
https://www.mathsisfun.com/data/scatter-xy-plots.html
https://www.cs.ubc.ca/labs/imager/tr/2014/DRVisTasks/

13
Some keys
ARRANGE TABLESEXPRESS VALUES
SEPARATE, ORDER, ALIGN REGIONS
AXIS ORIENTATION
LAYOUT DENSITY
Dense Space!lling
Separate Order Align
1 Key 2 Keys 3 Keys Many KeysList Recursive SubdivisionVolumeMatrix
Rectilinear Parallel Radial
Arrange Tables
Express Values
Separate, Order, Align Regions
Axis Orientation
Layout Density
Dense Space-Filling
Separate Order Align
1 Key 2 Keys 3 Keys Many KeysList Recursive SubdivisionVolumeMatrix
Rectilinear Parallel Radial
ARRANGE TABLESEXPRESS VALUES
SEPARATE, ORDER, ALIGN REGIONS
AXIS ORIENTATION
LAYOUT DENSITY
Dense Space!lling
Separate Order Align
1 Key 2 Keys 3 Keys Many KeysList Recursive SubdivisionVolumeMatrix
Rectilinear Parallel Radial
0

Some keys: Categorical regions
14
Arrange Tables
Express Values
Separate, Order, Align Regions
Axis Orientation
Layout Density
Dense Space-Filling
Separate Order Align
1 Key 2 Keys 3 Keys Many KeysList Recursive SubdivisionVolumeMatrix
Rectilinear Parallel Radial

Some keys: Categorical regions
• regions: contiguous bounded areas distinct from each other–using space to separate (proximity)–following expressiveness principle for categorical attributes
• use ordered attribute to order and align regions
15
ARRANGE TABLESEXPRESS VALUES
SEPARATE, ORDER, ALIGN REGIONS
AXIS ORIENTATION
LAYOUT DENSITY
Dense Space!lling
Separate Order Align
1 Key 2 Keys 3 Keys Many KeysList Recursive SubdivisionVolumeMatrix
Rectilinear Parallel Radial
Arrange Tables
Express Values
Separate, Order, Align Regions
Axis Orientation
Layout Density
Dense Space-Filling
Separate Order Align
1 Key 2 Keys 3 Keys Many KeysList Recursive SubdivisionVolumeMatrix
Rectilinear Parallel Radial

Separated but not aligned or ordered
• limitation: hard to make comparisons with size (vs aligned position)
16

Separated and aligned but not ordered
• limitation: hard to know rank. what's 4th? what's 7th?
17

Separated and aligned and ordered
• best case
18

Idiom: bar chart• one key, one value
–data• 1 categ attrib, 1 quant attrib
–mark: lines–channels
• length to express quant value• spatial regions: one per mark
– separated horizontally, aligned vertically– ordered by quant attrib
» by label (alphabetical), by length attrib (data-driven)
–task• compare, lookup values
–scalability• dozens to hundreds of levels for key attrib
19
100
75
50
25
0
Animal Type
100
75
50
25
0
Animal Type
20
15
10
5
0
20
15
10
5
0
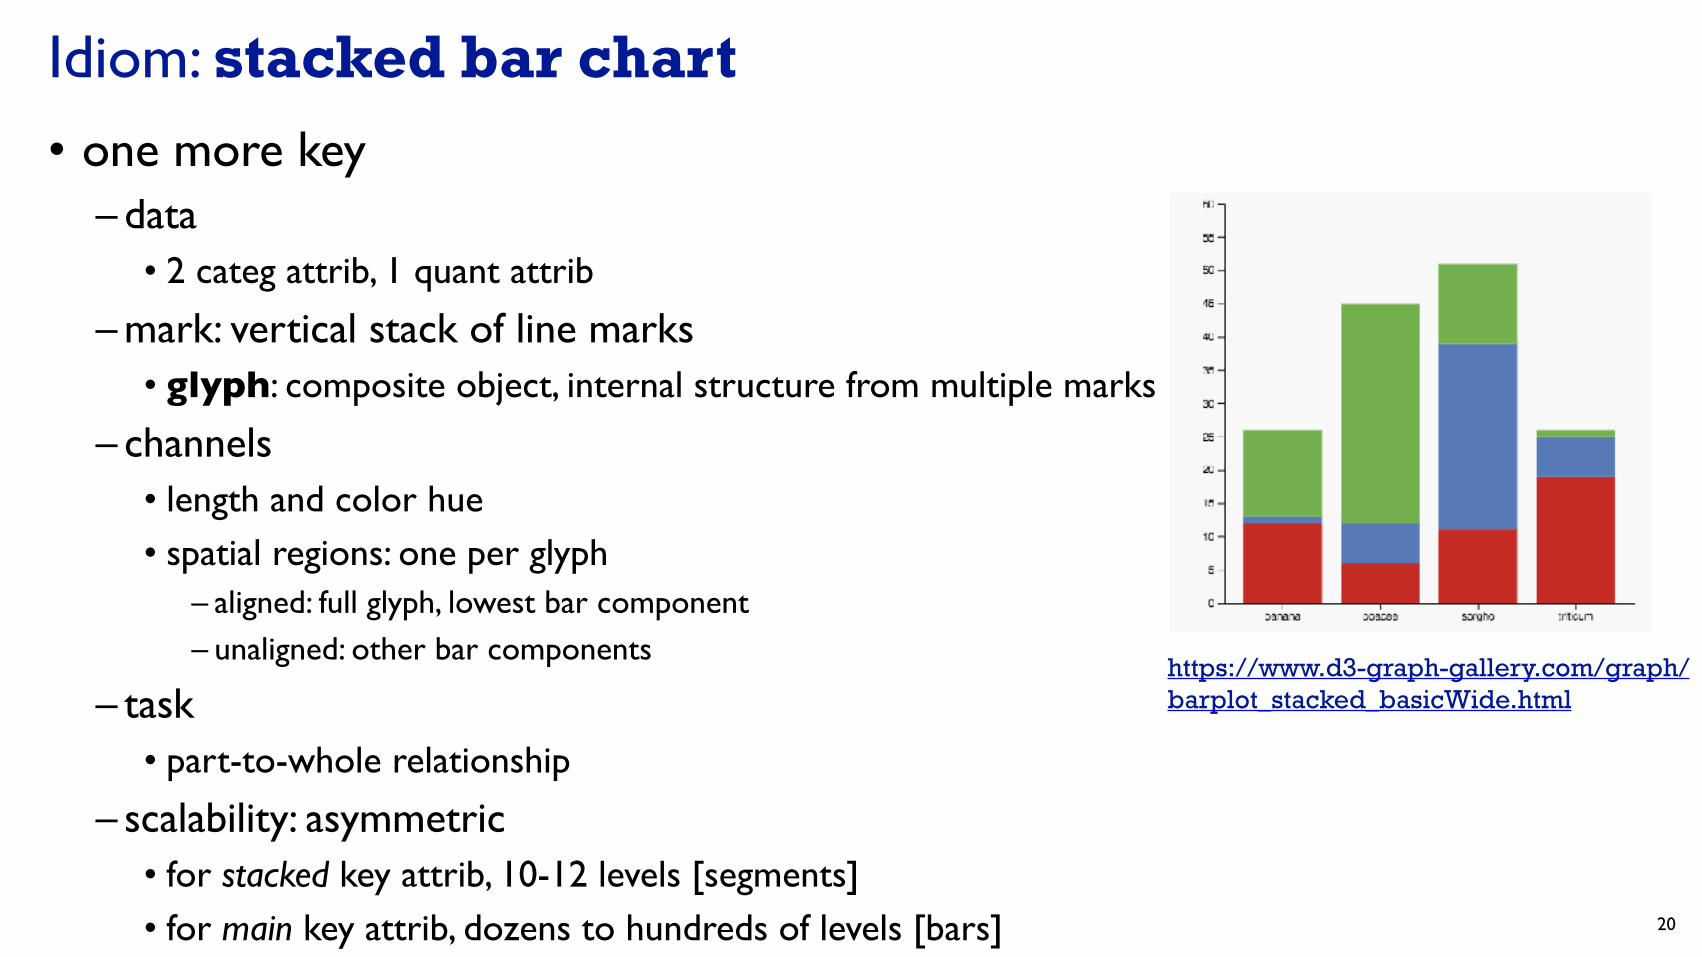
Idiom: stacked bar chart• one more key
– data• 2 categ attrib, 1 quant attrib
– mark: vertical stack of line marks• glyph: composite object, internal structure from multiple marks
– channels• length and color hue• spatial regions: one per glyph
– aligned: full glyph, lowest bar component– unaligned: other bar components
– task• part-to-whole relationship
– scalability: asymmetric• for stacked key attrib, 10-12 levels [segments]• for main key attrib, dozens to hundreds of levels [bars] 20
https://www.d3-graph-gallery.com/graph/barplot_stacked_basicWide.html
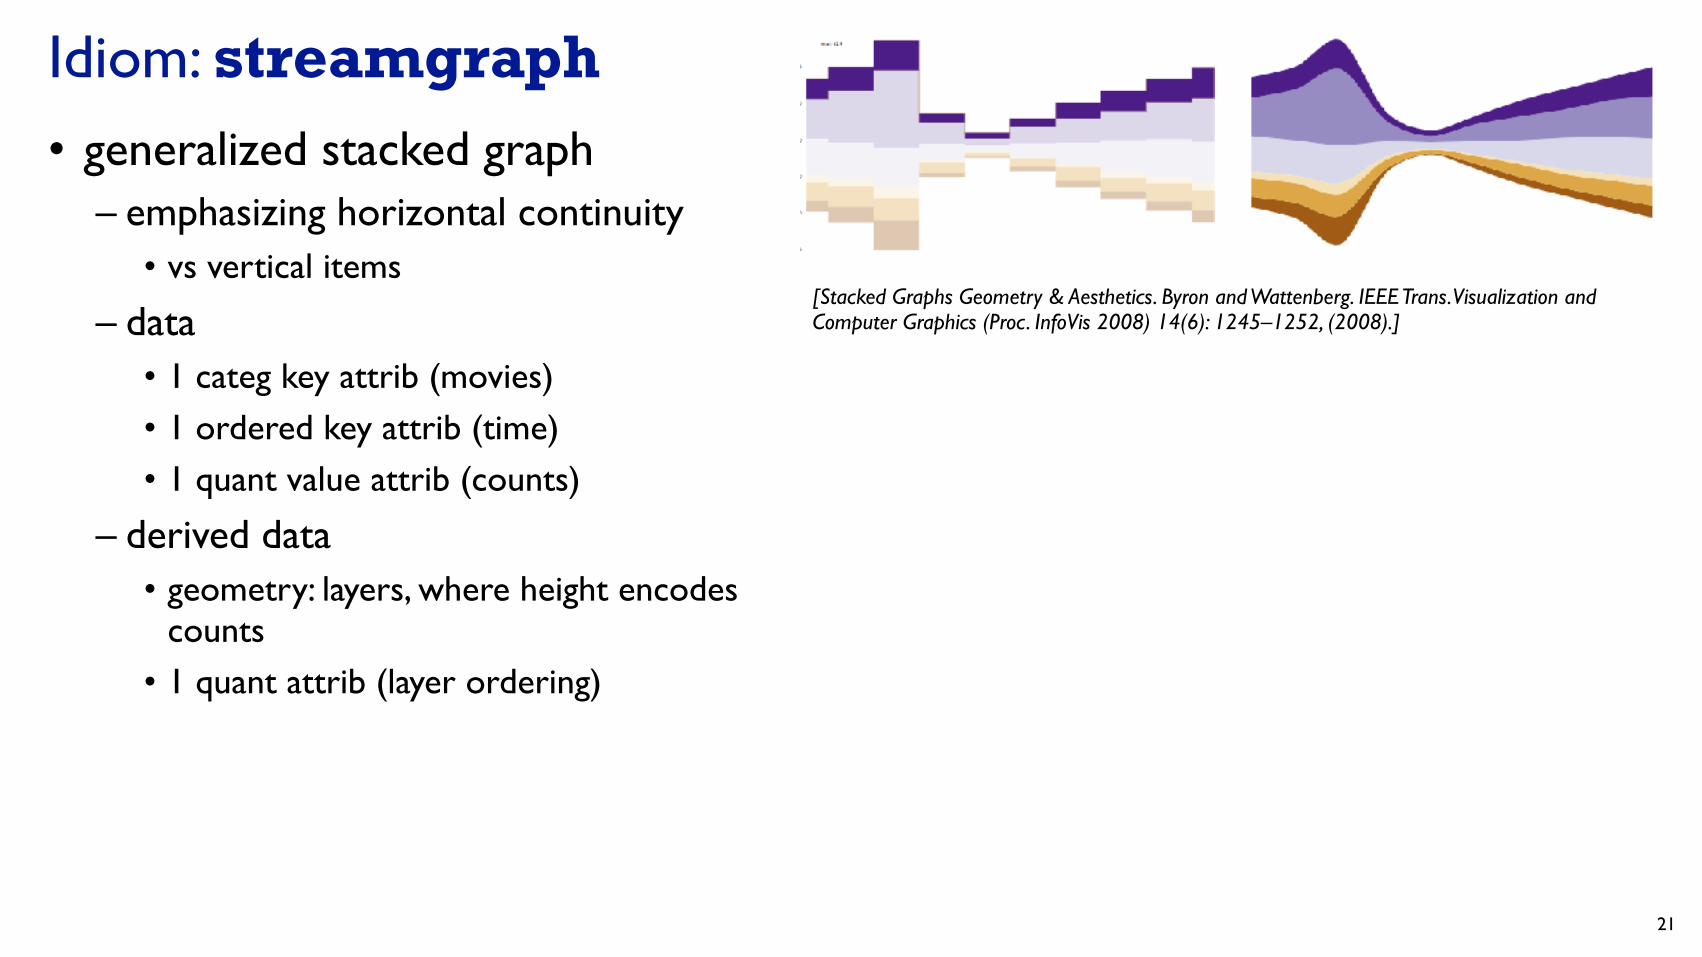
Idiom: streamgraph• generalized stacked graph
– emphasizing horizontal continuity• vs vertical items
– data• 1 categ key attrib (movies)• 1 ordered key attrib (time)• 1 quant value attrib (counts)
– derived data• geometry: layers, where height encodes
counts• 1 quant attrib (layer ordering)
21
[Stacked Graphs Geometry & Aesthetics. Byron and Wattenberg. IEEE Trans. Visualization and Computer Graphics (Proc. InfoVis 2008) 14(6): 1245–1252, (2008).]

Idiom: streamgraph• generalized stacked graph
– emphasizing horizontal continuity• vs vertical items
– data• 1 categ key attrib (movies)• 1 ordered key attrib (time)• 1 quant value attrib (counts)
– derived data• geometry: layers, where height encodes
counts• 1 quant attrib (layer ordering)
– scalability• hundreds of time keys• dozens to hundreds of movies keys
– more than stacked bars: most layers don’t extend across whole chart 22
[Stacked Graphs Geometry & Aesthetics. Byron and Wattenberg. IEEE Trans. Visualization and Computer Graphics (Proc. InfoVis 2008) 14(6): 1245–1252, (2008).]
https://flowingdata.com/2008/02/25/ebb-and-flow-of-box-office-receipts-over-past-20-years/

Idiom: dot / line chart• one key, one value
– data• 2 quant attribs
– mark: points AND line connection marks between them
– channels• aligned lengths to express quant value• separated and ordered by key attrib into
horizontal regions
– task• find trend
– connection marks emphasize ordering of items along key axis by explicitly showing relationship between one item and the next
– scalability• hundreds of key levels, hundreds of value levels 23
Animal Type Animal Type
20
15
10
5
0
Year
20
15
10
5
0
Year
20
15
10
5
0
Year

Idiom: dot / line chart• one key, one value
– data• 2 quant attribs
– mark: points AND line connection marks between them
– channels• aligned lengths to express quant value• separated and ordered by key attrib into
horizontal regions
– task• find trend
– connection marks emphasize ordering of items along key axis by explicitly showing relationship between one item and the next
– scalability• hundreds of key levels, hundreds of value levels 24
Animal Type Animal Type
20
15
10
5
0
Year
20
15
10
5
0
Year
20
15
10
5
0
Year

Choosing bar vs line charts
• depends on type of key attrib–bar charts if categorical– line charts if ordered
• do not use line charts for categorical key attribs–violates expressiveness
principle• implication of trend so strong
that it overrides semantics!– “The more male a person is, the
taller he/she is”
25
after [Bars and Lines: A Study of Graphic Communication. Zacks and Tversky. Memory and Cognition 27:6 (1999), 1073–1079.]
Female Male
60
50
40
30
20
10
0 Female Male
60
50
40
30
20
10
0
10-year-olds 12-year-olds
60
50
40
30
20
10
0
60
50
40
30
20
10
0 10-year-olds 12-year-olds

Chart axes: label them!
• best practice to label– few exceptions: individual small multiple views could share axis label
26
https://xkcd.com/833/

Chart axes: avoid cropping y axis• include 0 at bottom left or slope misleads
27
[Truncating the Y-Axis: Threat or Menace? Correll, Bertini, & Franconeri, CHI 2020.]

Chart axes: avoid cropping y axis• include 0 at bottom left or slope misleads
– some exceptions (arbitrary 0, small change matters)
28
[Truncating the Y-Axis: Threat or Menace? Correll, Bertini, & Franconeri, CHI 2020.]

Idiom: dual-axis line charts• controversial
– acceptable if commensurate– beware, very easy to mislead!
29

Dual axis charts: case study
30http://www.thefunctionalart.com/2015/10/if-you-see-bullshit-say-bullshit.html
misleading original
first redesign: commensurate axes
second redesign: additional data for context

Idiom: Indexed line charts• data: 2 quant attribs
– 1 key + 1 value
• derived data: new quant value attrib– index– plot instead of original value
• task: show change over time– principle: normalized, not absolute
• scalability– same as standard line chart
31https://public.tableau.com/profile/ben.jones#!/vizhome/CAStateRevenues/Revenues

Idiom: Gantt charts• one key, two (related) values
– data• 1 categ attrib, 2 quant attribs
– mark: line• length: duration
– channels• horiz position: start time
(+end from duration)
– task• emphasize temporal overlaps & start/end dependencies
between items
– scalability• dozens of key levels [bars]• hundreds of value levels [durations] 32
https://www.r-bloggers.com/gantt-charts-in-r-using-plotly/

Idiom: Slopegraphs• two values
– data• 2 quant value attribs• (1 derived attrib: change magnitude)
– mark: point + line• line connecting mark between pts
– channels• 2 vertical pos: express attrib value• (linewidth/size, color)
– task• emphasize changes in rank/value
– scalability• hundreds of value levels• dozens of items 33
https://public.tableau.com/profile/ben.jones#!/vizhome/Slopegraphs/Slopegraphs

34
2 Keys
ARRANGE TABLESEXPRESS VALUES
SEPARATE, ORDER, ALIGN REGIONS
AXIS ORIENTATION
LAYOUT DENSITY
Dense Space!lling
Separate Order Align
1 Key 2 Keys 3 Keys Many KeysList Recursive SubdivisionVolumeMatrix
Rectilinear Parallel Radial
Arrange Tables
Express Values
Separate, Order, Align Regions
Axis Orientation
Layout Density
Dense Space-Filling
Separate Order Align
1 Key 2 Keys 3 Keys Many KeysList Recursive SubdivisionVolumeMatrix
Rectilinear Parallel Radial
ARRANGE TABLESEXPRESS VALUES
SEPARATE, ORDER, ALIGN REGIONS
AXIS ORIENTATION
LAYOUT DENSITY
Dense Space!lling
Separate Order Align
1 Key 2 Keys 3 Keys Many KeysList Recursive SubdivisionVolumeMatrix
Rectilinear Parallel Radial
0

Idiom: heatmap• two keys, one value
– data• 2 categ attribs (gene, experimental condition)• 1 quant attrib (expression levels)
– marks: point• separate and align in 2D matrix
– indexed by 2 categorical attributes
– channels• color by quant attrib
– (ordered diverging colormap)
– task• find clusters, outliers
– scalability• 1M items, 100s of categ levels, ~10 quant attrib levels 35
ARRANGE TABLESEXPRESS VALUES
SEPARATE, ORDER, ALIGN REGIONS
AXIS ORIENTATION
LAYOUT DENSITY
Dense Space!lling
Separate Order Align
1 Key 2 Keys 3 Keys Many KeysList Recursive SubdivisionVolumeMatrix
Rectilinear Parallel Radial

Heatmap reordering
36https://blogs.sas.com/content/iml/2018/05/02/reorder-variables-correlation-heat-map.html

Idiom: cluster heatmap• in addition
–derived data• 2 cluster hierarchies
–dendrogram• parent-child relationships in tree with connection line marks• leaves aligned so interior branch heights easy to compare
–heatmap• marks (re-)ordered by cluster hierarchy traversal• task: assess quality of clusters found by automatic methods
37

38
Arrange Tables
Express Values
Separate, Order, Align Regions
Axis Orientation
Layout Density
Dense Space-Filling
Separate Order Align
1 Key 2 Keys 3 Keys Many KeysList Recursive SubdivisionVolumeMatrix
Rectilinear Parallel Radial

Idioms: radial bar chart, star plot• star plot
– line mark, radial axes meet at central point
• radial bar chart– line mark, radial axes meet at central ring– channels: length, angle/orientation
• bar chart– rectilinear axes, aligned vertically
• accuracy– length not aligned with radial layouts
• less accurately perceived than rectilinear aligned
39
[Vismon: Facilitating Risk Assessment and Decision Making In Fisheries Management. Booshehrian, Möller, Peterman, and Munzner. Technical Report TR 2011-04, Simon Fraser University, School of Computing Science, 2011.]
10-year-olds 12-year-olds
10-year-olds 12-year-olds

Idiom: radar plot• radial line chart
– point marks, radial layout– connecting line marks
• avoid unless data is cyclic
40

“Radar graphs: Avoid them (99.9% of the time)”
41http://www.thefunctionalart.com/2012/11/radar-graphs-avoid-them-999-of-time.html
original difficult to interpret
redesign for rectilinear

Idioms: pie chart, coxcomb chart• pie chart
– interlocking area marks with angle channel: 2D area varies• separated & ordered radially, uniform height
– accuracy: area less accurate than rectilinear aligned line length– task: part-to-whole judgements
• coxcomb chart– line marks with length channel: 1D length varies
• separated & ordered radially, uniform width
– direct analog to radial bar charts
• data– 1 categ key attrib, 1 quant value attrib
42[A layered grammar of graphics. Wickham. Journ. Computational and Graphical Statistics 19:1 (2010), 3–28.]

Coxcomb / nightingale rose / polar area chart
• invented by Florence Nightingale: Diagram of the Causes of Mortality in the Army in the East
43

Coxcomb: perception
• encode: 1D length• decode/perceive: 2D area
• nonuniform line/sector width as length increases– so area variation is nonlinear wrt
line mark length!
• bar chart safer: uniform width, so area is linear with line mark length– both radial & rectilinear cases
44
nonuniform width as length increases uniform width as length increases
10-year-olds 12-year-olds10-year-olds 12-year-olds
radial & rectilinear bars: uniform width as length increases

Pie charts: perception
• some empirical evidence that people respond to arc length– decode/perceive: not angles– maybe also areas?…
• donut charts no worse than pie charts
45https://eagereyes.org/blog/2016/an-illustrated-tour-of-the-pie-chart-study-results
[Arcs, Angles, or Areas: Individual Data Encodings in Pie and Donut Charts. Skau and Kosara. Proc. EuroVis 2016.]

Pie charts: best practices
• not so bad for two (or few) levels, for part-to-whole task
46https://eagereyes.org/pie-charts

Pie charts: best practices
• not so bad for two (or few) levels, for part-to-whole task• dubious for several levels if details matter
47https://eagereyes.org/pie-charts

Pie charts: best practices
• not so bad for two (or few) levels, for part-to-whole task• dubious for several levels if details matter• terrible for many levels
48https://eagereyes.org/pie-charts

Idioms: normalized stacked bar chart• task
– part-to-whole judgements
• normalized stacked bar chart– stacked bar chart, normalized to full vert height– single stacked bar equivalent to full pie
• high information density: requires narrow rectangle
• pie chart– information density: requires large circle
49
http://bl.ocks.org/mbostock/3886208,
http://bl.ocks.org/mbostock/3887235,
http://bl.ocks.org/mbostock/3886394.
3/21/2014 bl.ocks.org/mbostock/raw/3887235/
http://bl.ocks.org/mbostock/raw/3887235/ 1/1
<5
5-13
14-17
18-24
25-44
45-64
≥65
3/21/2014 bl.ocks.org/mbostock/raw/3886394/
http://bl.ocks.org/mbostock/raw/3886394/ 1/1
UT TX ID AZ NV GA AK MSNMNE CA OK SDCO KSWYNC AR LA IN IL MNDE HI SCMOVA IA TN KY AL WAMDNDOH WI OR NJ MT MI FL NY DC CT PA MAWV RI NHME VT0%
10%
20%
30%
40%
50%
60%
70%
80%
90%
100%
Under 5 Years
5 to 13 Years
14 to 17 Years
18 to 24 Years
25 to 44 Years
45 to 64 Years
65 Years and Over
3/21/2014 bl.ocks.org/mbostock/raw/3886208/
http://bl.ocks.org/mbostock/raw/3886208/ 1/1
CA TX NY FL IL PA OH MI GA NC NJ VA WA AZ MA IN TN MO MD WI MN CO AL SC LA KY OR OK CT IA MS AR KS UT NV NMWV NE ID ME NH HI RI MT DE SD AK ND VT DC WY0.0
5.0M
10M
15M
20M
25M
30M
35M
Popu
latio
n 65 Years and Over
45 to 64 Years
25 to 44 Years
18 to 24 Years
14 to 17 Years
5 to 13 Years
Under 5 Years
3/21/2014 bl.ocks.org/mbostock/raw/3886394/
http://bl.ocks.org/mbostock/raw/3886394/ 1/1
UT TX ID AZ NV GA AK MSNMNE CA OK SDCO KSWYNC AR LA IN IL MNDE HI SCMOVA IA TN KY AL WAMDNDOH WI OR NJ MT MI FL NY DC CT PA MAWV RI NHME VT0%
10%
20%
30%
40%
50%
60%
70%
80%
90%
100%
Under 5 Years
5 to 13 Years
14 to 17 Years
18 to 24 Years
25 to 44 Years
45 to 64 Years
65 Years and Over
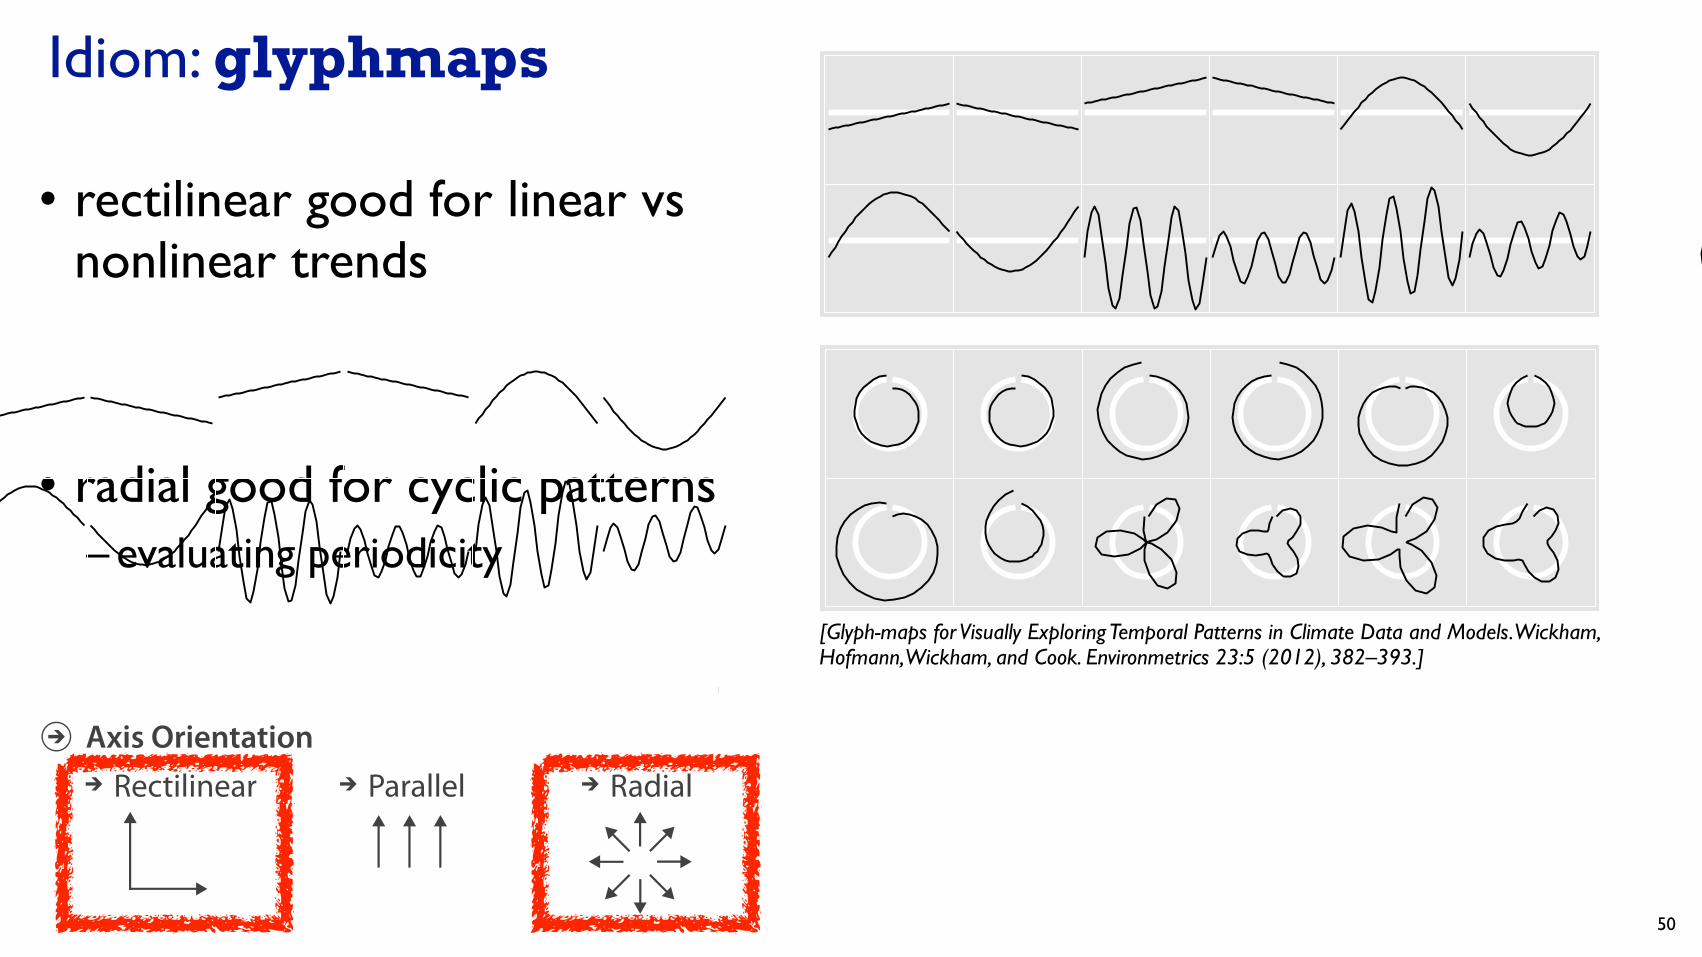
Idiom: glyphmaps
• rectilinear good for linear vs nonlinear trends
• radial good for cyclic patterns– evaluating periodicity
50
Two types of glyph – lines and stars – are especially useful for temporal displays. F igure 3displays 1 2
iconic time series shapes with line- and star- glyphs. The data underlying each glyph is measured at 36 time
points. The line- glyphs are time series plots. The star- glyphs are formed by considering the 36 axes radiating
from a common midpoint, and the data values for the row are plotted on each axis relative to the locations
of the minimum and maximum of the variable. This is a polar transformation of the line- glyph.
F igure 3: I con plots for 1 2 iconic time series shapes ( linear increasing, decreasing, shifted, single peak, single dip,combined linear and nonlinear, seasonal trends with different scales, and a combined linear and seasonal trend) inE uclidean coordinates, time series icons ( left) and polar coordinates, star plots ( right) .
The paper is structured as follows. S ection 2 describes the algorithm used to create glyphs- maps. S ec-
tion 3discusses their perceptual properties, including the importance of a visual reference grid, and of
carefully consideration of scale. L arge data and the interplay of models and data are discussed in S ection 4 .
M any spatiotemporal data sets have irregular spatial locations, and S ection 5 discusses how glyph- maps can
be adjusted for this type of data. Three datasets are used for examples:
data- expo The A S A 2 0 0 9 data expo data ( M urrell, 2 0 1 0 ) consists of monthly observations of sev-
eral atmospheric variables from the I nternational S atellite C loud C limatology P roject. The
dataset includes observations over 7 2 months ( 1 9 9 5 –2 0 0 0 ) on a 2 4 x 2 4 grid ( 5 7 6 locations)
stretching from 1 1 3 .7 5 �W to 5 6 .2 5 �W longitude and 2 1 .2 5 �S to 3 6 .2 5 �N latitude.
G I S TE M P surface temperature data provided on 2 � x 2 � grid over the entire globe, measured monthly
( E arth S ystem R esearch L aboratory, P hysical S ciences D ivision, N ational O ceanic and A tmo-
spheric A dministration, 2 0 1 1 ) . G round station data w as de- seasonalized, differenced from
from the 1 9 5 1 - 1 9 8 0 temperature averages, and spatially averaged to obtain gridded mea-
surements. F or the purposes of this paper, we extracted the locations corresponding to the
continental US A .
US H C N ( Version 2 ) ground station network of historical temperatures ( N ational O ceanic and A t-
mospheric A dministration, N ational C limatic D ata C enter, 2 0 1 1 ) . Temperatures from 1 2 1 9
stations on the contiguous United S tates, from 1 8 7 1 to present.
4
[Glyph-maps for Visually Exploring Temporal Patterns in Climate Data and Models. Wickham, Hofmann, Wickham, and Cook. Environmetrics 23:5 (2012), 382–393.]
Arrange Tables
Express Values
Separate, Order, Align Regions
Axis Orientation
Layout Density
Dense Space-Filling
Separate Order Align
1 Key 2 Keys 3 Keys Many KeysList Recursive SubdivisionVolumeMatrix
Rectilinear Parallel Radial

51
Arrange Tables
Express Values
Separate, Order, Align Regions
Axis Orientation
Layout Density
Dense Space-Filling
Separate Order Align
1 Key 2 Keys 3 Keys Many KeysList Recursive SubdivisionVolumeMatrix
Rectilinear Parallel Radial
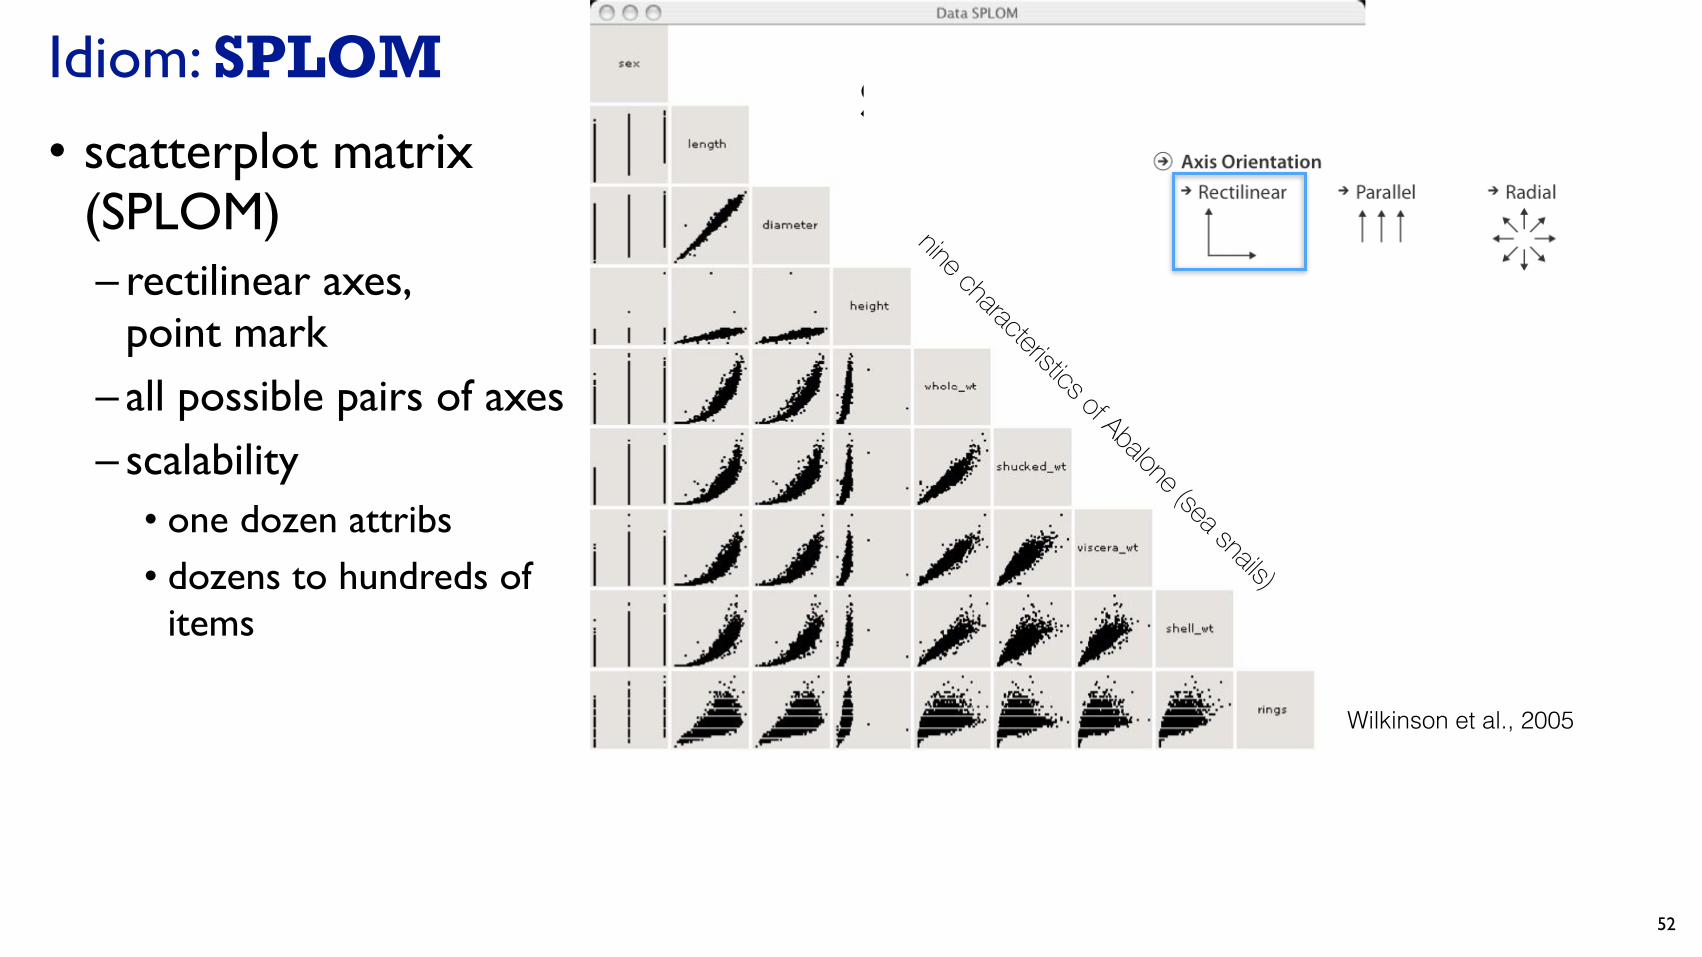
Idiom: SPLOM• scatterplot matrix
(SPLOM)– rectilinear axes,
point mark– all possible pairs of axes– scalability
• one dozen attribs• dozens to hundreds of
items
52
SPLOMs: scatterplot matrices
nine characteristics of Abalone (sea snails)
Wilkinson et al., 2005

Idioms: parallel coordinates• scatterplot limitation
– visual representation with orthogonal axes
– can show only two attributes with spatial position channel
53
after [Visualization Course Figures. McGuffin, 2014. http://www.michaelmcguffin.com/courses/vis/]
Math
Physics
Dance
Drama
Math Physics Dance Drama
Math Physics Dance Drama
1009080706050 40302010
0
Math Physics Dance Drama
8590655040
9580504060
7060909580
6550908090
Table Scatterplot Matrix Parallel Coordinates
Math
Physics
Dance
Drama
Math Physics Dance Drama
Math Physics Dance Drama
1009080706050 40302010
0
Math Physics Dance Drama
8590655040
9580504060
7060909580
6550908090
Table Scatterplot Matrix Parallel Coordinates

Idioms: parallel coordinates• scatterplot limitation
– visual representation with orthogonal axes– can show only two attributes with spatial
position channel
• alternative: line up axes in parallel to show many attributes with position– item encoded with a line with n segments– n is the number of attributes shown
• parallel coordinates– parallel axes, jagged line for item– rectilinear axes, item as point
• axis ordering is major challenge
– scalability• dozens of attribs• hundreds of items
54
after [Visualization Course Figures. McGuffin, 2014. http://www.michaelmcguffin.com/courses/vis/]
Math
Physics
Dance
Drama
Math Physics Dance Drama
Math Physics Dance Drama
1009080706050 40302010
0
Math Physics Dance Drama
8590655040
9580504060
7060909580
6550908090
Table Scatterplot Matrix Parallel Coordinates
Math
Physics
Dance
Drama
Math Physics Dance Drama
Math Physics Dance Drama
1009080706050 40302010
0
Math Physics Dance Drama
8590655040
9580504060
7060909580
6550908090
Table Scatterplot Matrix Parallel Coordinates
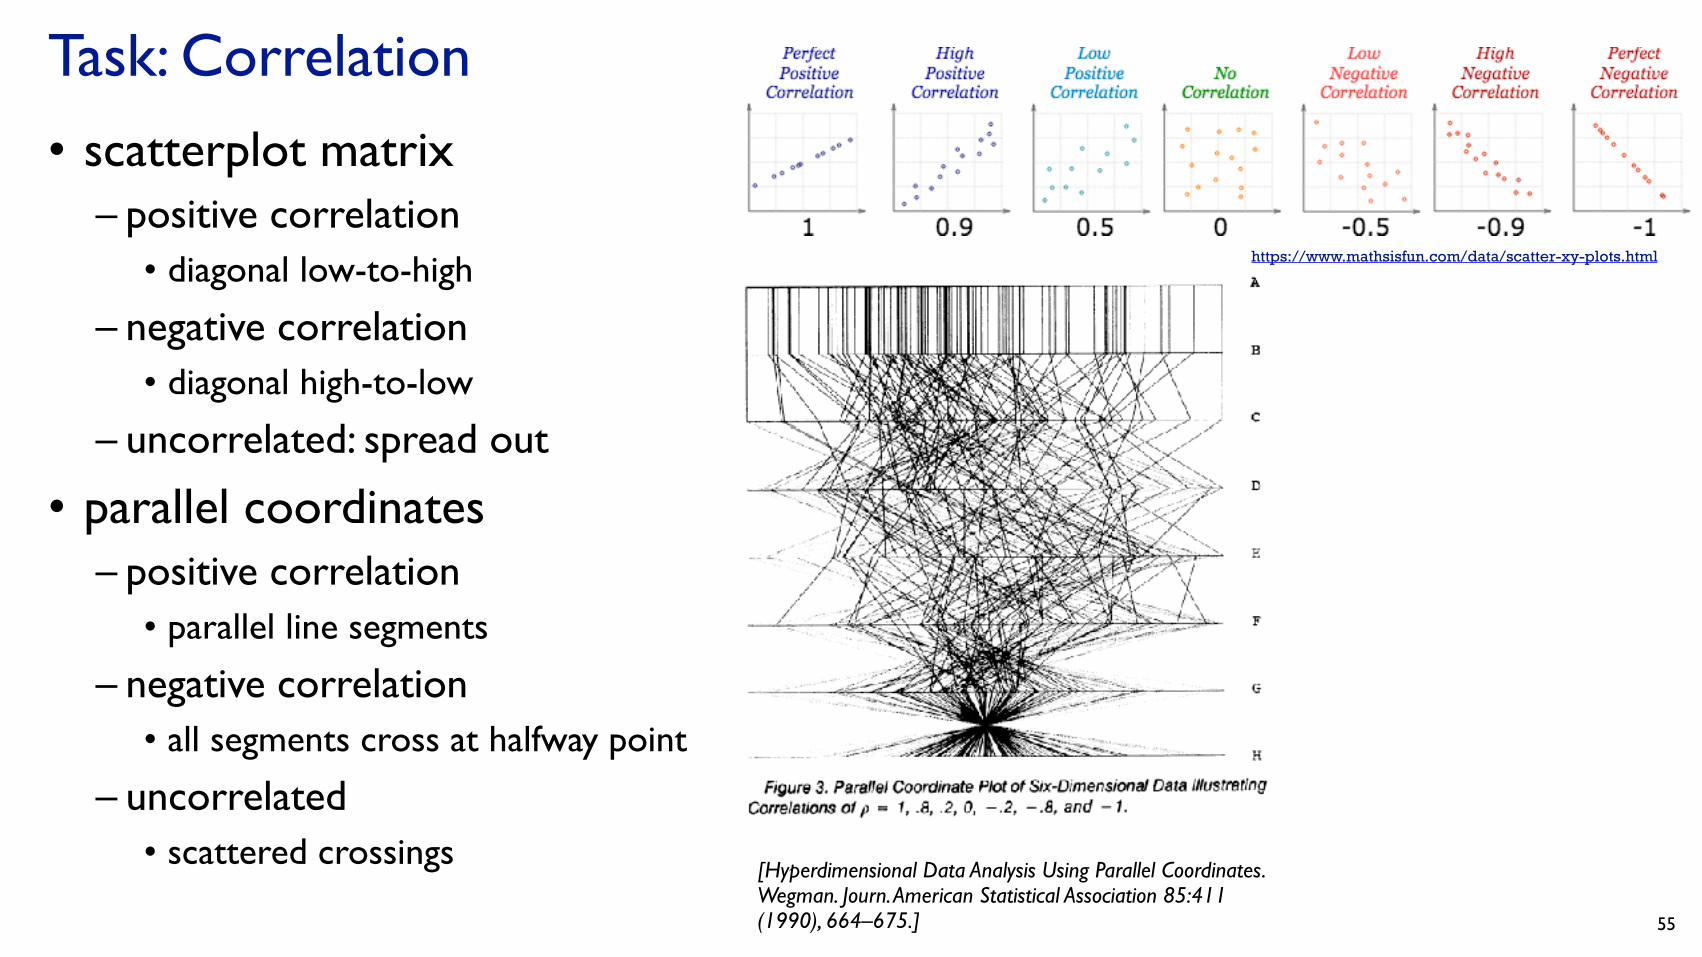
Task: Correlation
• scatterplot matrix– positive correlation
• diagonal low-to-high
– negative correlation• diagonal high-to-low
– uncorrelated: spread out
• parallel coordinates– positive correlation
• parallel line segments
– negative correlation• all segments cross at halfway point
– uncorrelated• scattered crossings
55
[Hyperdimensional Data Analysis Using Parallel Coordinates. Wegman. Journ. American Statistical Association 85:411 (1990), 664–675.]
https://www.mathsisfun.com/data/scatter-xy-plots.html

Parallel coordinates, limitations
• visible patterns only between neighboring axis pairs • how to pick axis order?
– usual solution: reorderable axes, interactive exploration– same weakness as many other techniques
• downside of interaction: human-powered search
– some algorithms proposed, none fully solve
56
47 Protovis
parallel coordinates

57
• rectilinear: scalability wrt #axes• 2 axes best, 3 problematic, 4+ impossible
Orientation limitations
Arrange Tables
Express Values
Separate, Order, Align Regions
Axis Orientation
Layout Density
Dense Space-Filling
Separate Order Align
1 Key 2 Keys 3 Keys Many KeysList Recursive SubdivisionVolumeMatrix
Rectilinear Parallel Radial

58
• rectilinear: scalability wrt #axes• 2 axes best, 3 problematic, 4+ impossible
• parallel: unfamiliarity, training time
Orientation limitations
Arrange Tables
Express Values
Separate, Order, Align Regions
Axis Orientation
Layout Density
Dense Space-Filling
Separate Order Align
1 Key 2 Keys 3 Keys Many KeysList Recursive SubdivisionVolumeMatrix
Rectilinear Parallel Radial

59
• rectilinear: scalability wrt #axes• 2 axes best, 3 problematic, 4+ impossible
• parallel: unfamiliarity, training time• radial: perceptual limits
– polar coordinate asymmetry• angles lower precision than length• nonuniform sector width/size depending on radial distance
– frequently problematic• but sometimes can be deliberately exploited!
– for 2 attribs of very unequal importance
Orientation limitations
[Uncovering Strengths and Weaknesses of Radial Visualizations - an Empirical Approach. Diehl, Beck and Burch. IEEE TVCG (Proc. InfoVis) 16(6):935--942, 2010.]
Arrange Tables
Express Values
Separate, Order, Align Regions
Axis Orientation
Layout Density
Dense Space-Filling
Separate Order Align
1 Key 2 Keys 3 Keys Many KeysList Recursive SubdivisionVolumeMatrix
Rectilinear Parallel Radial

Layout density
60
Arrange Tables
Express Values
Separate, Order, Align Regions
Axis Orientation
Layout Density
Dense Space-Filling
Separate Order Align
1 Key 2 Keys 3 Keys Many KeysList Recursive SubdivisionVolumeMatrix
Rectilinear Parallel Radial

Idiom: Dense software overviews• data: text
– text + 1 quant attrib per line
• derived data: – one pixel high line– length according to original
• color line by attrib• scalability
– 10K+ lines
61
Arrange Tables
Express Values
Separate, Order, Align Regions
Axis Orientation
Layout Density
Dense Space-Filling
Separate Order Align
1 Key 2 Keys 3 Keys Many KeysList Recursive SubdivisionVolumeMatrix
Rectilinear Parallel Radial
[Visualization of test information to assist fault localization. Jones, Harrold, Stasko. Proc. ICSE 2002, p 467-477.]
62
How?
Encode Manipulate Facet Reduce
Arrange
Map
Change
Select
Navigate
Express Separate
Order Align
Use
Juxtapose
Partition
Superimpose
Filter
Aggregate
Embed
Color
Motion
Size, Angle, Curvature, ...
Hue Saturation Luminance
Shape
Direction, Rate, Frequency, ...
from categorical and ordered attributes
Why?
How?
What?
Encode tables: Arrange space

Arrange tables
63
Arrange Tables
Express Values
Separate, Order, Align Regions
Axis Orientation
Layout Density
Dense Space-Filling
Separate Order Align
1 Key 2 Keys 3 Keys Many KeysList Recursive SubdivisionVolumeMatrix
Rectilinear Parallel Radial
Arrange Tables
Express Values
Separate, Order, Align Regions
Axis Orientation
Layout Density
Dense Space-Filling
Separate Order Align
1 Key 2 Keys 3 Keys Many KeysList Recursive SubdivisionVolumeMatrix
Rectilinear Parallel Radial
Arrange Tables
Express Values
Separate, Order, Align Regions
Axis Orientation
Layout Density
Dense Space-Filling
Separate Order Align
1 Key 2 Keys 3 Keys Many KeysList Recursive SubdivisionVolumeMatrix
Rectilinear Parallel Radial
Arrange Tables
Express Values
Separate, Order, Align Regions
Axis Orientation
Layout Density
Dense Space-Filling
Separate Order Align
1 Key 2 Keys 3 Keys Many KeysList Recursive SubdivisionVolumeMatrix
Rectilinear Parallel Radial

64
How?
Encode Manipulate Facet Reduce
Arrange
Map
Change
Select
Navigate
Express Separate
Order Align
Use
Juxtapose
Partition
Superimpose
Filter
Aggregate
Embed
Color
Motion
Size, Angle, Curvature, ...
Hue Saturation Luminance
Shape
Direction, Rate, Frequency, ...
from categorical and ordered attributes
Why?
How?
What?
How?
Encode Manipulate Facet Reduce
Arrange
Map
Change
Select
Navigate
Express Separate
Order Align
Use
Juxtapose
Partition
Superimpose
Filter
Aggregate
Embed
Color
Motion
Size, Angle, Curvature, ...
Hue Saturation Luminance
Shape
Direction, Rate, Frequency, ...
from categorical and ordered attributes
Why?
How?
What?

Credits
• Visualization Analysis and Design (Ch 7)• Alex Lex & Miriah Meyer, http://dataviscourse.net/• Ben Jones, UW/Tableau
65