james tam information visualization concepts covered what is information visualization? tufte's...
Post on 21-Dec-2015
232 views
TRANSCRIPT

James Tam
Information Visualization
Concepts covered
What is Information Visualization?
Tufte's Principles for Information Visualization.
Visual Variables.
These lecture notes are a chosen selection from the "Representations" lectures from CPSC 481

James Tam
What Is Information Visualization?
Visually representing representing abstract data on a computer in a way that makes it easier to acquire or use the information.
From www.bravenet.com

James Tam
Representations
Representation of numbers• Decimal: 123456• Binary: 010001• Roman Numerals: IV
Different representations have different strengths

James Tam
Which is the best flight?
depart arriveAC 117 Vancouver - Calgary 7:00 9:00Cdn 321 Vancouver - Calgary 9:00 12:00Cdn 355 Calgary - Montreal 13:30 19:30AC 123 Calgary - Toronto 12:30 16:30AC 123 Toronto - Montreal 16:45 17:30*time zone: +1 van-cal, +2 cal-tor, mtl
length, stop-overs, switches...
7 9 11 13 15 17
10 12 14 16 18 20
Vancouver
8 10 12 14 16 18
AC 117 Cdn 321
Cdn 355AC 123
Calgary
Toronto
Montreal

James Tam
Anscombe’s Quartet
N: 11.0mean X’s : 9.0mean Y’s : 7.5standard error of slope estimate: 0.1sum of squares: 110.0regression sum of squares: 27.5residual sum of squares of Y: 13.8correlation coefficient: 0.8r squared: 0.7regression line: Y=3+0.5X
Graphics Reveal the Data

James Tam
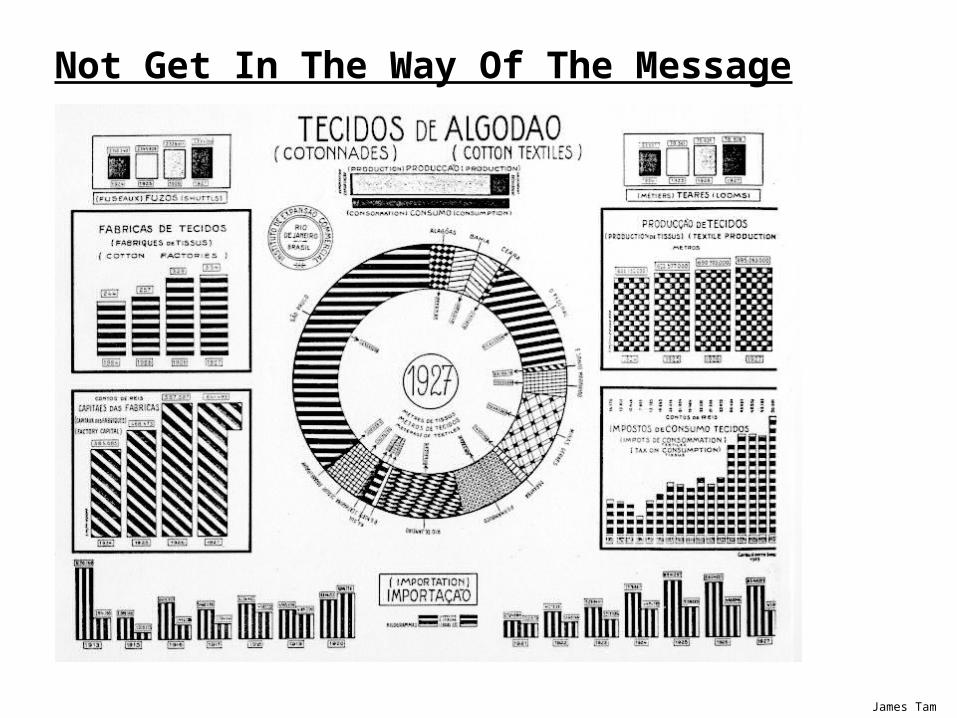
Principles for Information VisualizationGraphics should reveal the data• show the data*• not get in the way of the message*• avoid distortion*• present many numbers in a small space• make large data sets coherent• encourage comparison between data• supply both a broad overview and fine detail*• serve a clear purpose
note: many visual examples on the following slides are taken from Tufte’s books
E. Tufte Visual Display of Quantitative Information

James Tam
Show The Data
# Buffalo
# Adults # calves
# Buffalo
James Tam
Not Get In The Way Of The Message

James Tam
Avoid Distortion
Ford GM Pontiac Toyota58
59
60
61
62
63
64
65
66
Ford GM Pontiac Toyota
Maintenance cost / year
0
5
10
15
20
25
30
35
40
45
50
55
60
65
70
Ford GM Pontiac Toyota
Maintenance cost / year

James Tam
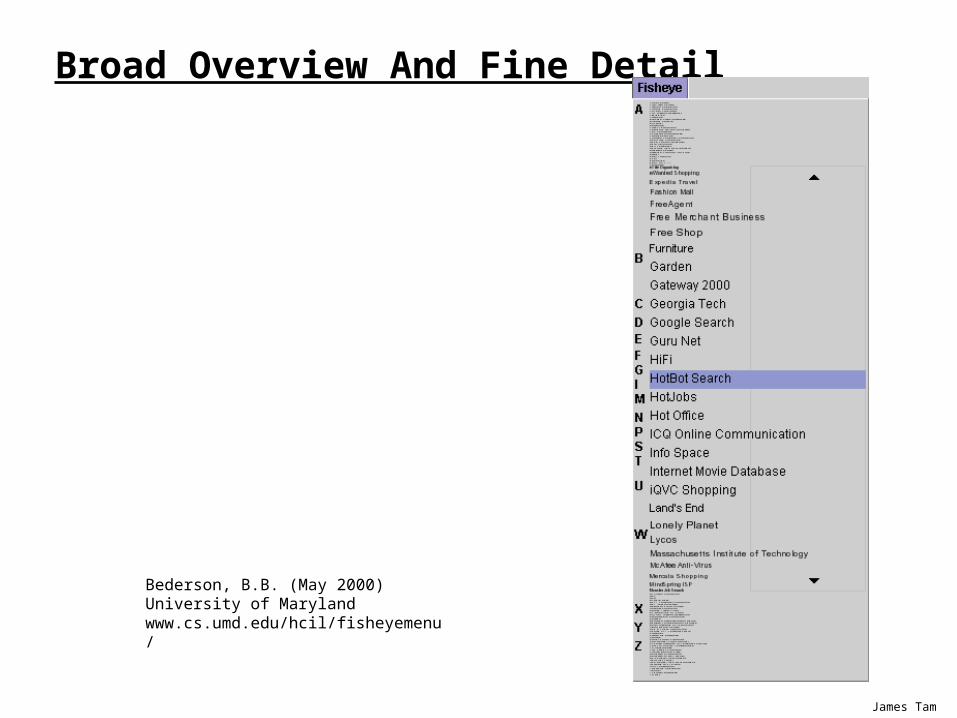
Broad Overview And Fine Detail
Mutually Exclusive Views
Icewind Dale (Black Isle)

James Tam
Broad Overview And Fine Detail
Overlay
Diablo (Blizzard)

James Tam
Broad Overview And Fine Detail
Separate Views
Defender (Williams Electronics)

James Tam
Broad Overview And Fine Detail
James Tam
Broad Overview And Fine Detail
Bederson, B.B. (May 2000) University of Maryland www.cs.umd.edu/hcil/fisheyemenu/
James Tam
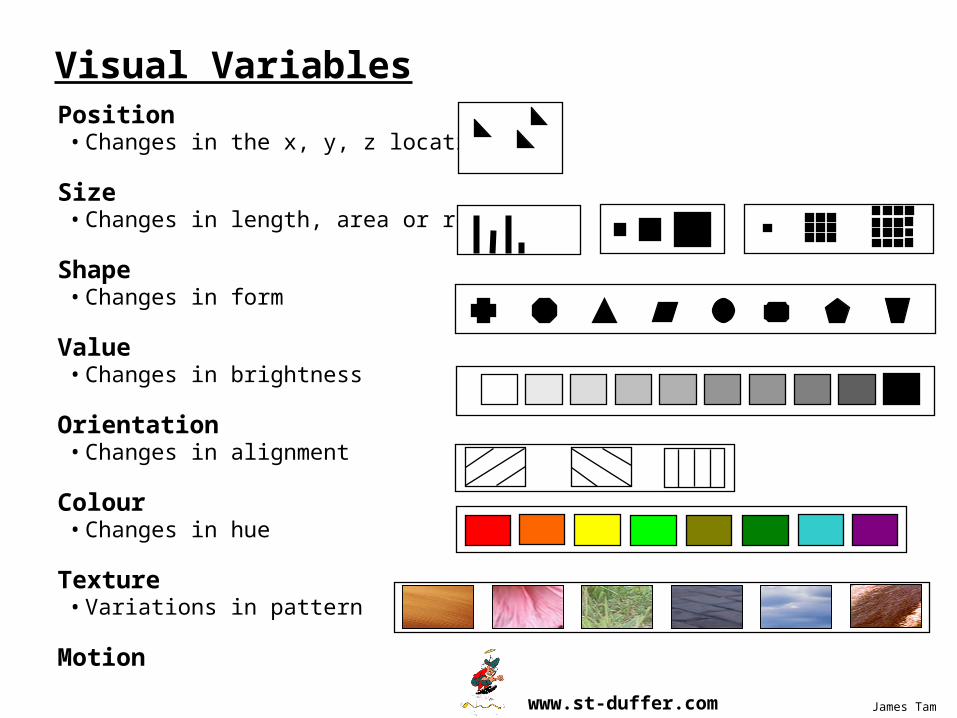
Visual VariablesPosition
• Changes in the x, y, z location
Size• Changes in length, area or repetition
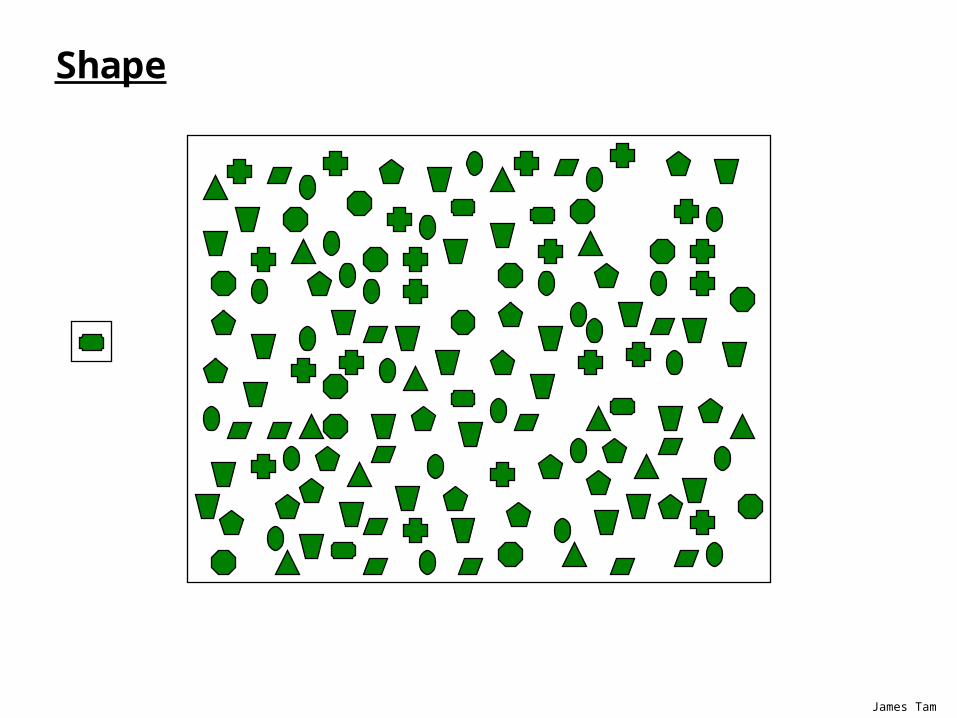
Shape• Changes in form
Value• Changes in brightness
Orientation• Changes in alignment
Colour• Changes in hue
Texture• Variations in pattern
Motionwww.st-duffer.com
James Tam
Visual Variables
Visual variables can affect how you interpret information
• selective is a change in this variable enough to allow us to select things from a group?
• associative is a change in this variable enough to allow us to perceive things as a group?
• quantitative is there a numerical reading obtainable from changes in this variable?
• orderare changes in this variable perceived as ordered?

James Tam
Visual Variable: Position
selective
associative
quantitative
order
100
0100

James Tam
selective
associative
quantitative
order
Visual Variable: Size
> >> > > >
=4 X

James Tam
Selective
associative
quantitative
order
Visual Variable: Shape
>> >> > > >
15 34 105
James Tam
Shape

James Tam
Visual Variable: Value
selective
associative
quantitative
order < < < < < <
15 34 105

James Tam
Visual Variable: Color
Selective
associative
quantitative
order > > > > > > >>
15 13 34 67

James Tam
Color

James Tam
Encoding
Common advice says use a rainbow scale- Marcus, Murch, Healey
- problems with rainbows

James Tam

James Tam

James Tam
Visual Variable: Orientation
selective
associative
quantitative
order ? < < <<< < <
15 17 95

James Tam
Visual Variable: Texture
Selective
associative
quantitative
order > > > >
45 15 33

James Tam
Texture: Vibratory Effects

James Tam
Visual Variable: Motion
selective - motion is one of our most powerful attention grabbers
associative – objects moving in unison groups them effectively
quantitative - subjective perception
order

James Tam
Motion

James Tam
Summary
How the representation of information can effect the ease to which information can be acquired or used?
What are some general guidelines for Information Visualization?
What are Visual Variables?
How can changes in Visual Variables affect how viewers can interpret information?
Which Visual Variables are more effective at different types of visual interpretation tasks?