information system success as impacted by risks and development strategies
TRANSCRIPT

46 IEEE TRANSACTIONS ON ENGINEERING MANAGEMENT, VOL. 48, NO. 1, FEBRUARY 2001
Information System Success as Impacted by Risksand Development Strategies
James J. Jiang, Gary Klein, Member, IEEE, and Richard Discenza
Abstract—The high failure rates long associated with informa-tion system (IS) projects, despite advances in techniques for infor-mation technology development, suggest that organizations needto improve their ability to identify and to manage associated risks.Until recently, studies of specific risks and successes were limitedby the lack of formal measures that were both comprehensive andmultifaceted. This paper proposes and tests a model based on lit-erature that relates sources of risk to strategies and success. Onehundred ninety-six project managers were surveyed to begin anexploration of the types of risks encountered, the impact they haveon different categories of success, and the types of strategies thatare deployed to mitigate known risks. Analysis of responses indi-cates that risk-reduction strategies influence success. Strategies in-volving behavioral aspects tend to be more influential in risk reduc-tion than are those aimed at technical risks. Suggestions for bothpractitioners and researchers are discussed.
Index Terms—Information system development, project man-agement, risk management, system success.
I. INTRODUCTION
FAILURE rates for large-scale systems developmentprojects are extremely high, with many organizations
either abandoning their efforts after allocating substantialresources or failing to achieve the anticipated outcomes fromtheir investments. Over the past three decades, there has beenconsiderable interest in determining why information systems(IS) applications typically developed at great cost are ignoredor require expensive overhauls before they achieve intendedobjectives [1], [13], [14], [17], [28], [31], [46].
Despite remarkable advances in information technology,many technology-based information systems still fall short oforganizational objectives. A recent survey of organizations,in which enterprise systems management solutions weredeployed, found that only 24% of the implementations wereconsidered successful, 64% of management had mixed feelingsabout the success of the projects, and the remainder felt theirprojects were failures [30]. A study conducted by the StandishGroup reported that 31% of new IS projects were canceledbefore completion at an estimated cost of $81 billion. Fur-thermore, 52.7% of the projects that proceeded to completionwere 189% over budget for an additional cost of $59 billion.The results led the researchers to characterize the software
Manuscript received January 15, 1999; revised August 1, 2000.J. J. Jiang is with the Department of Computer Information Systems and
Analysis, College of Administration and Business, Louisiana Tech University,Ruston, LA 71272 USA (e-mail: [email protected]).
G. Klein and R. Discenza are with the College of Business and Adminis-tration, the University of Colorado, Colorado Springs, CO 80933-7150 USA(e-mail: [email protected]; [email protected]).
Publisher Item Identifier S 0018-9391(01)01640-3.
industry as being in a state of crisis [50]. These data show thattheses cases are not isolated incidents but occur frequently inorganizations of all sizes. Other recent studies have shownsimilar results in which projects come in years behind schedule,exceed budgets by millions, and fail to meet users’ needs onceimplementation is complete [30].
According to McFarlan [47], failure to assess individualproject risk is a major source of the IS development problem.Many researchers, therefore, have attempted to identify thevarious risks associated with the IS development. Andersonand Narasimhan [5] found unwilling users, multiple users,technical problems, and lack of prior experience as criticalproject development risk variables that influence the outcomesof system development efforts. Others found personnel change,technological change, top management support, a team’s lackof general expertise, a team’s need for development expertise,and the novelty of applications significantly affect systemdevelopment [8], [37], [52].
The high failure rates associated with IS projects suggest thatorganizations need to improve not only their ability to identify,but also to manage the associated risks. Project management re-searchers argue that risks in system development are key fac-tors affecting system success. Alter [2] identified the followingfactors as influencing project success: nonexistent or unwillingusers, multiple users or implementers, turnover among all par-ties, the inability to specify purpose or usage, the inability tocushion the impact on others, the loss or lack of support, lackof experience, and technical or cost effectiveness problems. Mc-Farlan [47] pointed out three dimensions influencing the risk in-herent in a project: project size, experience with the technology,and project structure. Cafasso [15] identified user involvement,executive management support, proper planning, realistic ex-pectations, and a clear statement of requirements as the top fivefactors influencing project success.
Identification of the risk factors is only the first stage ofthe analysis. A second stage is to develop general approachesand specific strategies that bring more structure and formalismto reduce the complexity and risks associated with a project[2], [47], [55]. Some strategies have been proposed by ISresearchers including using prototype approaches [22], keepingthe system simple [18], avoiding change [45], providingtraining [41], obtaining management/user support [35], andselling the system [43]. Alter [2] classified the developmentstrategies into four basic categories: keeping the solutionsimple, obtaining management/users support, institutionalizingthe system, and meeting user needs.
Although many of the development strategies and their pur-poses have been identified, their impacts on system performance
0018–9391/01$10.00 © 2001 IEEE

JIANG et al.: INFORMATION SYSTEM SUCCESS 47
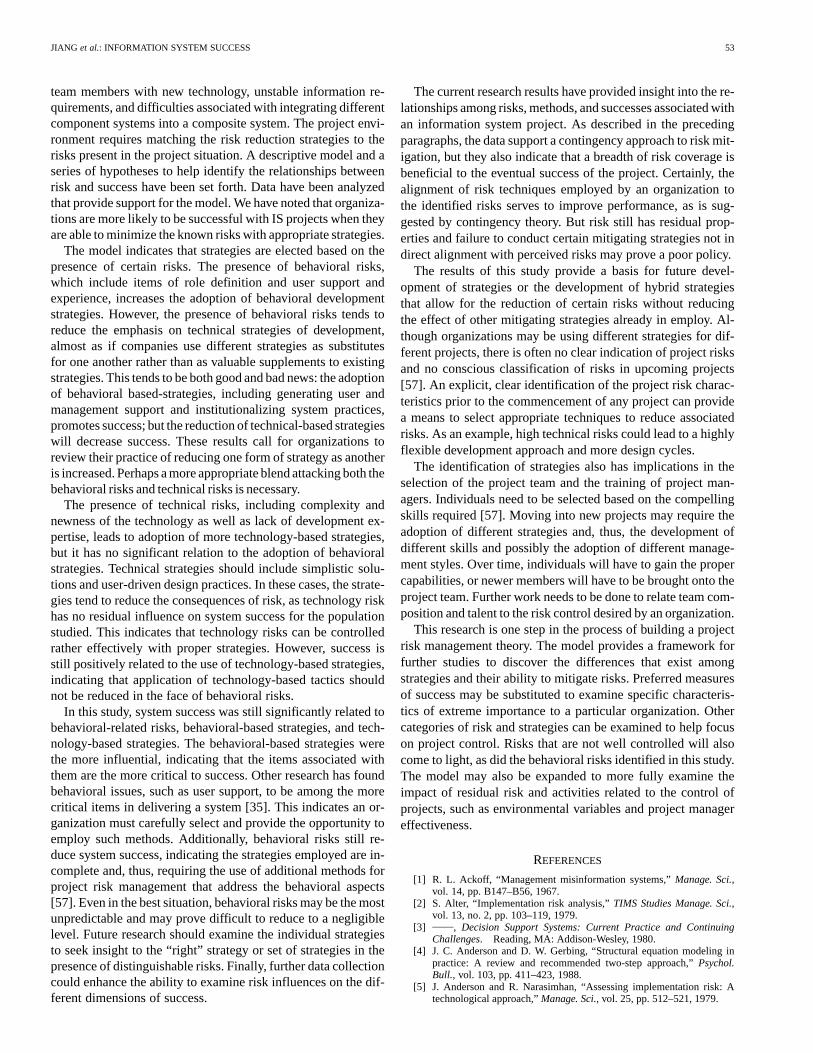
Fig. 1. Contingency-based model of strategies and risk.
have not been empirically tested. In fact, the current literature onproject risk management has largely been conceptual in nature,due in part to a lack of a formal measure of risk. In this paper, weexamine the alignment of risks and the strategies used to controlproject risks by employing recent measures of IS project risk, ISdevelopment strategies, and project success. We adopt the posi-tion that project managers should use project-specific risk-re-duction strategies. This stance is supported with structural con-tingency theory and developed into a testable model. Specifi-cally, we look at whether the alignment of behavioral-based andtechnical-based strategies are effective at improving project per-formance and whether there is any residual risk after the deploy-ment of strategies matching the behavioral and technology-re-lated risks.
II. RESEARCHMODEL
In the project management literature, researchers discusseffective and ineffective risk management methods [60].PMNetwork’sentire February 1998 issue encouraged the use ofteam-based strategies for risk management. Boehm describeddetailed approaches for several risk management strategies[12]. Wideman and Dawson provided practical advice formanaging project risks [59]. Techniques and practices arecontinually emerging to control risks associated with projects.Risks, however, may not be completely reduced by the strate-gies and methodologies employed [8], [12], [57]. The plethoraof risk reduction strategies and the limited research noted abovelead us to the following three expectations.
1) Development strategies are adopted for use in response toincreased system risks.
2) Employment of system development strategies increasesthe chances of success of the system.
3) Risks negatively impact the success of the system.In this study, we seek to go beyond the conceptual nature
of the expectations. Instead, we seek to explain how businessstrategies and performance variables are related and why cer-tain decision and performance patterns are found. The derivedmodel integrates these risk and strategy variables in a path ana-lytic framework. Fig. 1 illustrates the basic model from contin-gency theory and risk-based management theory. Contingency
theory holds that performance is determined by the match be-tween the uncertainty of the tasks and the ability to cope withthe uncertainty [29]. Risk-based management is a derivative thatdescribes why project risks have an adverse impact on perfor-mance [8], [20]. The model shows the project risks influencingthe development strategies employed, which in turn impact suc-cess. It also shows that the strategies will not eliminate risk, asrepresented by a direct link from risk to success. In order toexamine the expectations formally, the risks and developmentstrategies are divided into technical and behavioral categories,similar to those found in other IS studies [46], [17], [22]. Theadded dimensionality permits investigation of the varying im-pact of risk types on strategies and success.
Risk-based management dictates that approaches to mitigaterisks must be based on the risks present in the project [49]. Es-sentially, this leads us to expect that behavioral approaches tomanaging risks will be employed if the risks are perceived tobe behaviorally oriented. A similar expectation would apply tothe technical risks. Contingency theory relates the three con-cepts under study into a single framework, as indicated in Fig. 1.Under this approach, if the match between methods and un-certainties is good, then performance will be higher [29], [23].Thus, in the figure, behavioral-related risks are addressed byemploying behavioral-based strategies, whereas the technology-related risks are addressed by technical-based strategies. Thestrategies employed serve to reduce risk but will not neces-sarily eliminate risk. The hypotheses are based on these theo-ries, framed according to the above expectations, and indicatedin the figure.
H1a: Behavioral-related risks will be positively related tothe use of behavioral-based strategies.
H1b: Behavioral-related risks will not be positively relatedto the use of technical-based strategies.
H1c: Technology-related risks will be positively related tothe use of technical-based strategies.
H1d: Technology-related risks will not be positively relatedto the use of behavioral-based strategies.
H2a: Behavioral-based strategies will be positively relatedto system success.
H2b: Technical-based strategies will be positively related tosystem success.

48 IEEE TRANSACTIONS ON ENGINEERING MANAGEMENT, VOL. 48, NO. 1, FEBRUARY 2001
H3a: Behavioral-related risks will be negatively related tosystem success.
H3b: Technology-related risks will be negatively related tosystem success.
III. RESEARCHMETHODS
The purposes of this study were, first, to confirm the effects ofproject risk on system success and, second, to examine the de-velopment strategies used by IS managers and their effects onsystem success. In particular, we looked at the ability of tech-nical strategies to reduce technical risk and behavioral strate-gies to reduce risks related to user attributes. To obtain data forthis study, questionnaires were mailed to 1000 IS project man-agers throughout the United States. The sample characteristicsand the three constructs (project risks, development strategies,and system success) used are described below.
A. Sample
Questionnaires were mailed in two separate mailings,each to 500 randomly selected Project Management Institute(PMI) members in the United States. PMI is the professionalassociation for practitioners of project management with over53 000 members worldwide. The sample was chosen becausemembers of PMI represent a cross section of managerial posi-tions extensively involved with project management [42], [37].Postage-paid envelopes for each questionnaire were enclosed.All of the respondents were assured that their responses wouldbe kept confidential.
In the first set of 500 mailed in the fall of 1998, a total of86 questionnaires were returned for a response rate of 17%. Inorder to increase the sample size, a second mailing of 500 wasconducted in the fall of 1999. The responses from both samplestotaled 194, for an overall response rate of 19.4%. Various t-testson the means of key demographics (work experience, gender,recent project duration, and team sizes) and on the independentand dependent variables described below showed no statisticallysignificant differences between the two samples. The two sam-ples were then combined for further analysis.
A summary of the demographic characteristics of the sampleis presented in Table I. About 74% of the respondents wereeither IS project managers or IS executives within their firms.Over 90% of them had work experience in IS of 12 years ormore. About 91% worked in companies that had 100 employeesor more, whereas the others worked in smaller companies. Inaddition, these subjects had a wide experience in different kindsand sizes of IS applications. Overall, respondents appearedvaried and well qualified to judge the issues related to risks andsuccess of IS development.
B. Risk Construct
The instrument used to measure the project development riskswas from previous studies [8], [38]. The original instrument in-cluded a number of items in a Likert-type scale format (spe-cific items may be found in the original source [8]). Subse-quent research using the original questions found the presenceof risk categories similar to those categories described in the
TABLE ISAMPLE DEMOGRAPHICS
original work [38]. The items most related to the behavioraland technical aspects required in this study were selected forthe questionnaire, which asked respondents the extent of diffi-culties arising from each risk item in their most recently com-pleted IS project. Each scale was scored using a seven-pointscale ranging from “not at all” (1) to “extremely” (7). All items,shown in Table II, were constructed so that the greater the score,the greater the incidence of the particular item.
The risks identified represent major threats to the success ofa system. Technological acquisitions of hardware and softwarecontribute to the amount of uncertainty and changes in a project.The size of the application requires additional controls to avoidthe failures associated with an overwhelming system. An inex-perienced project team in terms of development expertise andbusiness knowledge presents obvious risks to the quality of theeventual system. A similar risk is inherent in a lack of userknowledge in both the aspects of the business and the devel-opment process. Unclear roles permit confusion and omissionof critical tasks, whereas insufficient support by the users canlead to a lack of acceptance and cooperation [35].
To derive the final construct and examine construct validity,we followed the procedures defined by Hatcher [34]. First, weconducted a principal component analysis (PCA) using all theitems listed in Table II. From the analysis, a six-factor solutionemerged that accounts for 72% of the variance, serving to vali-date the use of the factors in the study. Cronbach’s alpha was cal-culated to assess measurement internal reliability (see Table II).To achieve strong validity and reliability, a confirmatory factoranalysis (CFA) was conducted. When conducting a CFA, if themodel provides a reasonably good approximation to reality, itshould provide a good fit to the data. The CFA for the project

JIANG et al.: INFORMATION SYSTEM SUCCESS 49
TABLE IIPROJECTRISK CATEGORIES ANDITEMS
risk measure resulted in a chi-square/D.F. of 2.01 (is recom-mended), a comparative fit index (CFI) of 0.89 ( recom-mended), a non-normed fit index (NNFI) of 0.88 ( rec-ommended), and a normed fit index (NFI) of 0.90 ( rec-ommended). Thus, the measures represented a reasonably goodfit for the measurement model [10], [11].
Convergent validity is demonstrated when different instru-ments are used to measure the same construct, and scores fromthe different instruments are strongly correlated [16]. Empiri-cally, convergent validity can be assessed by-tests. If the factorloadings for the items in a dimension are statistically higher thantwice the standard error of the loadings, then convergent validityis supported [4]. In Table II, the significance of all parameter es-timates indicates the constructs demonstrate acceptable conver-gent validity. The results show that the construct demonstrateda high convergent validity because all-values are significant atthe 0.05 level.
Discriminant validity is inferred when measures of each con-struct converge on their respective true scores, which are uniquefrom the scores of other constructs [21]. Discriminant validity isassessed by the confidence interval test [26]. The confidence in-terval test to assess the discriminant validity between two factorsinvolves calculating a confidence interval of plus or minus twostandard errors around the correlation between the two factors,and determining whether this interval includes 1.0. If it does notinclude 1.0, discriminant validity is demonstrated [4]. Discrim-inant validity for project risks was supported because no rangeincluded the value 1.0 for each pair of factors.
TABLE IIIDEVELOPMENT STRATEGIES
TABLE IVMEASUREMENTMODEL PROPERTIES
C. Development Strategies Construct
The instrument used to gain a better understanding of thekey issues related to the success of decision support systemswas originally developed and tested by Alter [2], [3]. His de-velopment risk analysis instrument was modified only by re-moving references to specific system types. A total of 14 de-velopment strategies was examined. The questionnaire askedrespondents the extent to which each strategy was used in theirmost recently completed IS project. Each scale was scoredusing a seven-point Likert-type scale ranging from “not at all”(1) to “extremely” (7). All of the development strategies werescored so that the greater the score, the greater the extent ofthe use of the strategy. The items are in Table III. Table IVshows the properties of the PCA and CFA analyzes, indicatinga good measurement model. Discriminant and convergent va-lidity were demonstrated in a fashion identical to the risk con-struct. The strategies can be seen as directed at behavioralaspects, through the generation of support and the inculcationof system practices. Others were directed at the more technicalconsiderations, including design approaches and controlling thecomplexity of the system.
D. System Success Construct
Currently, the project management and IS literature are re-assessing what constitutes a successful IS project. Traditionalcriteria include cost, schedule, technical performance, as well asoverall results. The interrelationship among these criteria varies.Often projects are termed a technical success despite being be-hind schedule and over budget. In addition, because measuresof these factors as well as other objective indicators of perfor-mance that are comparable across different projects have yet to

50 IEEE TRANSACTIONS ON ENGINEERING MANAGEMENT, VOL. 48, NO. 1, FEBRUARY 2001
TABLE VSYSTEM SUCCESSMEASURES
be developed, measures based on system usage and user per-ceptions have become particularly prominent within the IS lit-erature. These include IS usage [25], [53], user information sat-isfaction (UIS) [9], [36], quality of decision making [19], [40],productivity from cost/benefit analysis [48], [51], and systemquality [28]. Some argue that the bottom-line indicator of suc-cess is whether the ultimate system users are satisfied with thesystem and, thus, have suggested that UIS is preferable to usageas a surrogate of system success [31], [36]. However, other re-searchers argue that IS effectiveness is a multidimensional con-cept [7], [24], [33], [48]. They note an arbitrarily chosen mea-sure limits the amount of variance explained and contributes tolow construct validity of the studies.
More recently, Saarinen [56] suggested that a measure ofproject success should cover the four dimensions of 1) the suc-cess of development process, 2) success of use, 3) quality of theIS product, and 4) impact of IS on the organization. Satisfac-tion included items that examine dedication to the developmentprocess and the conformance to specifications. Satisfaction withthe usage of the system considered the support and training as-pects of a new system. System quality measured the traditionalviews of relevance, accuracy, and timeliness, whereas impact tothe organization was concerned with bottom-line aspects. Thisstudy uses the Saarinen dimensionality because it covers a widerrange of system performance measures.
Table V shows all of the top five loading items in each factor.The questionnaire asked respondents’ satisfaction in their mostrecently completed IS projects. Each scale was scored usinga seven-point Likert-type scale ranging from “not satisfiedat all” (1) to “extremely satisfied” (7). All of the measureswere constructed so that the greater the score, the greater thesatisfaction of the particular item. Tests of the measurementmodel are shown in Table V. Both convergent and discriminantvalidity were demonstrated in a fashion identical to the riskconstruct.
TABLE VISECOND-ORDER ANALYSES
E. Reduction of Dimensionality
Further variable reduction for subsequent testing was re-quired for testing of the research model in Fig. 1. To obtain thedimensions of behavioral and technology-related risks requiresthe combination of the three behavioral dimensions of risk(lack of user support, lack of user experience, and lack of roledefinition) and the three technology dimensions of risk (techno-logical newness, application complexity, and absence of teamexpertise). Rather than conduct a simple averaging, weights aredetermined from the factor loadings of a secondary PCA [54].PCA was chosen because of the formative relationship betweenthe dimensions of the constructs, that is, an increased score forone dimension need not imply an increase for the other. Addi-tionally, the PCA served as a check on the appropriateness ofcombining the dimensions along predetermined lines. A similarreduction to two dimensions was made for the developmentstrategies, whereas the success measure was reduced to onedimension. The second-order analyzes results are presented inTable VI. PCA indicates that reduction for risks and strategiesfollowed the expected behavioral and technical pattern. Scoresto represent each measure were computed as the sum of themeasured risks items weighted by the factor scores, also inTable VI.
F. External Validity
External validity refers to the extent to which the findingscan be generalized across time, persons, and settings [16]. Theexternal validity of the findings is threatened if the sample issystematically biased, for example, if the responses were gen-erally from more successful projects or from low-risk projects.Table VII shows the descriptive statistics for the constructs. Theresponses had good distribution because the means and medianswere similar, skewness was less than 2, and kurtosis was lessthan 5 [32]. Likewise, project duration was well distributed,ranging from one to 60 months.

JIANG et al.: INFORMATION SYSTEM SUCCESS 51
TABLE VIIDESCRIPTIVESTATISTICS OFCONSTRUCTS
Additional threats to external validity could occur if thesamples showed other systematic biases in terms of demo-graphics, such as age, gender, and positions. An analysis ofvariance (ANOVA) was conducted by using system success(as the dependent variable) against each demographic category(independent variables). Results did not indicate any significantrelationships (that is, not one of the demographic variableswas significantly related to success). Likewise, no significantrelationships held for development strategies and risks as thedependent variables. A bias from sample selection, that of ISprofessionals instead of users, is possible in the evaluation ofthe success measures, but a comparison of the results of thisstudy to an earlier study found users and managers rated thesuccess measures at a similar level (specifically, SDP4.70,SU 4.74, SQ 5.03, and ORG 4.41) [56].
Nonresponse bias may threaten the external validity of astudy. Concern for nonresponse bias can be reduced if thesample characteristics are similar to those in other studies withthe same population, if random splitting of the sample finds noresponse differences, and if the response rate is appropriate forthe sampling technique employed [6], [27], [61]. Another studyused a PMI sample and found similar demographics [38]. Therandom splitting of the sample across the mailings showed nodifferences in any demographic or metric [27]. The responserate of around 20% is acceptable for this type of survey [61]. Insum, although the number of participating projects was limited,the tests conducted between these studies did not identify anysignificant threats to external validity.
Another important consideration is statistical power, theprobability that the statistical test will correctly reject a nullhypothesis. The most important factor in determining powerfor a test is sample size [58]. A general rule of thumb foradequate power in path analysis is to have at least five times the
number of variables in the sample size [10]. Consequently, ifactual effect sizes correspond to those found in MIS research ingeneral, this study’s single-respondent sample size ( )would be expected to generate adequate power, having a ratioof 39 : 1. This compares favorably to other IS research.
G. Control for Missing Variables
In an attempt to develop a parsimonious model that describesthe effects of interest, it is likely that a number of missingvariables may serve as potential confounding factors. Forexample, system success could be influenced by the projectsize. However, three primary considerations make the modeluseful for evaluation even without these variables. First, theintent of the model is not to explain system success, but toestablish whether the fit between project risks and developmentstrategies could be a significant indicator of system success.Second, by choosing variables that are linked by commontheory, contingency theory, and risk management theory, astronger causal chain between the variables may be established.Third, the effect of missing variables can be reduced somewhatby random selection of respondents, a technique well estab-lished in experimental research.
Even though this study used established constructs, signifi-cant effort was directed at assessing validity and reliability. Inparticular, construct validity, external validity, statistical conclu-sion validity, statistical power, and alpha reliabilities were eval-uated. Model and hypotheses testing was undertaken only after aset of valid and reliable measures was established for each vari-able in the model, as described in the construct section above.
IV. RESULTS
The research model and hypotheses were tested using pathanalysis, in which a single indicator measured each variable in

52 IEEE TRANSACTIONS ON ENGINEERING MANAGEMENT, VOL. 48, NO. 1, FEBRUARY 2001
the model. In this study, path analysis was undertaken usingstructural equation modeling (SEM) techniques. SEM-basedpath analysis assumes that the variance and covariance of theindependent variables are also to be estimated, in contrast todo traditional path analysis using multiple regression, whichassumes they are known numbers. Consequently, SEM-basedpath analysis provides better estimates of the path coefficientsthan traditional techniques. The specific SEM-based techniqueused in this study was SAS’s covariance analysis of linearstructural equations (CALIS) procedure. CALIS estimatesparameters and tests the appropriateness of linear structuralequation models using covariance structure analysis.
Some important assumptions associated with the path anal-ysis are as follows: 1) a multivariate normal distribution, 2) anabsence of multicollinearity, 3) a sufficient number of obser-vations, and 4) a maximum number of variables in the model.Although it has been argued that the maximum likelihood esti-mation procedures used in the CALIS appear to be fairly robustagainst moderate violations of the multivariate normal distribu-tion assumption, multivariate kurtosis ( ) and normalizedmultivariate kurtosis ( ) tests were conducted [39]. Noviolation was found. The sample size to parameter ratio for themodel was approximately 39 : 1, which conforms to recommen-dations of higher than 5 : 1 [10]. Although, there is no limit onthe total number of variables in structural equation modeling,the total number of variables in this model was five, which wasin the suggested range of four to six variables [11].
The theorized model fit the data appropriately (NFI0.94,CFI 0.95, GFI 0.97). The standardized path coefficientswere used to test the research hypotheses. The results are shownin Table VIII. The HypothesesH1a–H1c, regarding the pres-ence of appropriate strategies along with the associated risks,held. The use of both strategies was positively related to systemsuccess, supportingH2a andH2b.The behavioral-related riskswere negatively related to success, supporting hypothesisH3a.Not supported was a relationship between technical-based risksand success (H3b).
V. LIMITATIONS
These results, while encouraging, should be interpreted care-fully. The approach used here was to study management’s andanalysts’ attitudes related to project risks and strategies. It is as-sumed that the results are representative of the population fromwhich the sample was taken. Because the analysts chosen had awide variety of experiences and backgrounds, the results may befairly representative of project team members in general. How-ever, these results should be verified with randomly selectedsubjects. The study does not attempt to determine how teammembers’ feelings about risk change over time nor what causeschanges in these feelings. The study did provide evidence thatthere are important differences in risks and that these differencesaffect project sources.
It should also be noted that the survey consisted of single re-spondents selected from PMI members. It should be assumedthat the variables investigated have complex interrelationshipsand relationships in context with the project teams. Additionally,the responses were from IS professionals and not users or man-
TABLE VIIIRESULTS OFHYPOTHESESTESTS
agers. There could be a bias resulting from self-evaluation ofsuccess by this population. However, multisource feedback hasbeen shown to be a reliable indicator for many aspects of evalu-ation [44]. Also, the distribution of the variables measured wasnot skewed nor centered near the top of the range (Table VII),which would be indicative of bias. Still, these potential biasesare recognized as a qualification of the study.
In a general sense, it is easy to see some directions for ad-ditional research because the results presented here were col-lected in one sample and retrospectively. The data collection in-strument did not yield information related to whether projectteam members had access to expertise in areas such as orga-nizational development and change, job and process redesign,and ergonomics. Further research is needed to determine whatinvolvement is appropriate and what mechanisms should be putinto play. Furthermore, some pertinent risk factors and strategieshave certainly been omitted, whereas others might have beenconceptualized ineffectively. Additional work could consist ofrefining, expanding, and carefully articulating the risk factorsand strategies queried in this study. Data collection could be fo-cused on specific issues or situations that dictate specialized de-velopment strategies to assess the effects on project success.
Although the results presented give practitioners some guidesto development, rarely do decision makers act entirely on thebasis of numbers. IS project team members typically deal withcomplex situations. Although it is useful to know that strategyA is successful in 68% of the sample, what is also beneficialis to know specific examples of when strategy A is successfulor unsuccessful. This could be done by providing brief sum-maries of the environment that appeared to favor or oppose suc-cess. Providing data summaries and drawing inferences shouldbe expanded to suggest policies and procedures for distinct as-signments.
VI. CONCLUSIONS
IS project risk is a multidimensional and multifaceted issuewith different interacting parts. The risks include the size of theproject, the complexity of the problem domain, unfamiliarity by
JIANG et al.: INFORMATION SYSTEM SUCCESS 53
team members with new technology, unstable information re-quirements, and difficulties associated with integrating differentcomponent systems into a composite system. The project envi-ronment requires matching the risk reduction strategies to therisks present in the project situation. A descriptive model and aseries of hypotheses to help identify the relationships betweenrisk and success have been set forth. Data have been analyzedthat provide support for the model. We have noted that organiza-tions are more likely to be successful with IS projects when theyare able to minimize the known risks with appropriate strategies.
The model indicates that strategies are elected based on thepresence of certain risks. The presence of behavioral risks,which include items of role definition and user support andexperience, increases the adoption of behavioral developmentstrategies. However, the presence of behavioral risks tends toreduce the emphasis on technical strategies of development,almost as if companies use different strategies as substitutesfor one another rather than as valuable supplements to existingstrategies. This tends to be both good and bad news: the adoptionof behavioral based-strategies, including generating user andmanagement support and institutionalizing system practices,promotes success; but the reduction of technical-based strategieswill decrease success. These results call for organizations toreview their practice of reducing one form of strategy as anotheris increased. Perhaps a more appropriate blend attacking both thebehavioral risks and technical risks is necessary.
The presence of technical risks, including complexity andnewness of the technology as well as lack of development ex-pertise, leads to adoption of more technology-based strategies,but it has no significant relation to the adoption of behavioralstrategies. Technical strategies should include simplistic solu-tions and user-driven design practices. In these cases, the strate-gies tend to reduce the consequences of risk, as technology riskhas no residual influence on system success for the populationstudied. This indicates that technology risks can be controlledrather effectively with proper strategies. However, success isstill positively related to the use of technology-based strategies,indicating that application of technology-based tactics shouldnot be reduced in the face of behavioral risks.
In this study, system success was still significantly related tobehavioral-related risks, behavioral-based strategies, and tech-nology-based strategies. The behavioral-based strategies werethe more influential, indicating that the items associated withthem are the more critical to success. Other research has foundbehavioral issues, such as user support, to be among the morecritical items in delivering a system [35]. This indicates an or-ganization must carefully select and provide the opportunity toemploy such methods. Additionally, behavioral risks still re-duce system success, indicating the strategies employed are in-complete and, thus, requiring the use of additional methods forproject risk management that address the behavioral aspects[57]. Even in the best situation, behavioral risks may be the mostunpredictable and may prove difficult to reduce to a negligiblelevel. Future research should examine the individual strategiesto seek insight to the “right” strategy or set of strategies in thepresence of distinguishable risks. Finally, further data collectioncould enhance the ability to examine risk influences on the dif-ferent dimensions of success.
The current research results have provided insight into the re-lationships among risks, methods, and successes associated withan information system project. As described in the precedingparagraphs, the data support a contingency approach to risk mit-igation, but they also indicate that a breadth of risk coverage isbeneficial to the eventual success of the project. Certainly, thealignment of risk techniques employed by an organization tothe identified risks serves to improve performance, as is sug-gested by contingency theory. But risk still has residual prop-erties and failure to conduct certain mitigating strategies not indirect alignment with perceived risks may prove a poor policy.
The results of this study provide a basis for future devel-opment of strategies or the development of hybrid strategiesthat allow for the reduction of certain risks without reducingthe effect of other mitigating strategies already in employ. Al-though organizations may be using different strategies for dif-ferent projects, there is often no clear indication of project risksand no conscious classification of risks in upcoming projects[57]. An explicit, clear identification of the project risk charac-teristics prior to the commencement of any project can providea means to select appropriate techniques to reduce associatedrisks. As an example, high technical risks could lead to a highlyflexible development approach and more design cycles.
The identification of strategies also has implications in theselection of the project team and the training of project man-agers. Individuals need to be selected based on the compellingskills required [57]. Moving into new projects may require theadoption of different strategies and, thus, the development ofdifferent skills and possibly the adoption of different manage-ment styles. Over time, individuals will have to gain the propercapabilities, or newer members will have to be brought onto theproject team. Further work needs to be done to relate team com-position and talent to the risk control desired by an organization.
This research is one step in the process of building a projectrisk management theory. The model provides a framework forfurther studies to discover the differences that exist amongstrategies and their ability to mitigate risks. Preferred measuresof success may be substituted to examine specific characteris-tics of extreme importance to a particular organization. Othercategories of risk and strategies can be examined to help focuson project control. Risks that are not well controlled will alsocome to light, as did the behavioral risks identified in this study.The model may also be expanded to more fully examine theimpact of residual risk and activities related to the control ofprojects, such as environmental variables and project managereffectiveness.
REFERENCES
[1] R. L. Ackoff, “Management misinformation systems,”Manage. Sci.,vol. 14, pp. B147–B56, 1967.
[2] S. Alter, “Implementation risk analysis,”TIMS Studies Manage. Sci.,vol. 13, no. 2, pp. 103–119, 1979.
[3] , Decision Support Systems: Current Practice and ContinuingChallenges. Reading, MA: Addison-Wesley, 1980.
[4] J. C. Anderson and D. W. Gerbing, “Structural equation modeling inpractice: A review and recommended two-step approach,”Psychol.Bull., vol. 103, pp. 411–423, 1988.
[5] J. Anderson and R. Narasimhan, “Assessing implementation risk: Atechnological approach,”Manage. Sci., vol. 25, pp. 512–521, 1979.

54 IEEE TRANSACTIONS ON ENGINEERING MANAGEMENT, VOL. 48, NO. 1, FEBRUARY 2001
[6] J. S. Armstrong and T. S. Overton, “Estimating nonresponse bias in mailsurveys,”J. Marketing Res., vol. 41, pp. 396–402, 1977.
[7] J. W. Bailey and J. Pearson, “Development of a tool for measuringand analyzing computer user satisfaction,”Manage. Sci., vol. 29, pp.530–545, 1983.
[8] H. Barki, S. Rivard, and J. Talbot, “Toward an assessment of softwaredevelopment risk,”J. Manage. Inform. Systems, vol. 10, pp. 203–225,Fall 1993.
[9] J. J. Baroudi and W. J. Orlikowski, “A short form measure of user in-formation satisfaction: A psychometric evaluation and notes on use,”J.Manage. Inform. Syst., vol. 4, pp. 45–59, 1988.
[10] P. M. Bentler,EOS: Structural Equations Program and Manual. LosAngeles, CA: BDMP Statistical Software, 1989.
[11] P. M. Bentler and C. P. Chou, “Practical issues in structural modeling,”Sociol. Methods Res., vol. 16, pp. 78–117, 1987.
[12] B. W. Boehm, “Software risk management: Principles and practices,”IEEE Software, pp. 32–41, Jan. 1991.
[13] R. P. Bostrom and J. S. Heinen, “MIS problems and failures: Asocio-technical perspective—Part I: The causes,”MIS Quart., vol. 1,pp. 17–32, 1977.
[14] , “MIS problems and failures: A socio-technical perspective—PartII: The application of socio-technical theory,”MIS Quart., vol. 1, pp.11–28, 1977.
[15] R. Cafasso, “Few IS projects come in on time, on budget,”Computer-world, vol. 28, pp. 20–21, Dec. 12, 1994.
[16] D. T. Campbell and D. W. Fiske, “Convergent and discriminant vali-dation by multitrait-multimethod matrix,”Psychol. Bull., vol. 56, pp.81–105, 1959.
[17] E. K. Clemons, M. E. Thatcher, and M. C. Row, “Identifying sources ofreengineering failures: A study of the behavioral factors contributing toreengineering risks,”J. Manage. Inform. Syst., vol. 12, pp. 9–36, 1995.
[18] J. D. Casher, “How to control risk and effectively reduce the chance offailure,” Manage. Rev., vol. 73, pp. 50–54, 1984.
[19] W. L. Cats-Baril and G. P. Huber, “Decision support systems for Ill-structured problems: An empirical study,”Decision Sci., vol. 18, pp.350–372, 1987.
[20] R. N. Charette,Software Engineering Risk Analysis and Manage-ment. New York: McGraw-Hill, 1989.
[21] G. A. Churchill, “A paradigm for developing better measures of mar-keting constructs,”J. Marketing Res., vol. 16, pp. 64–73, 1979.
[22] J. Cooprider and J. Henderson, “Technology-process fit: Perspectives onachieving prototyping effectiveness,”J. Manage. Inform. Syst., Winter1990-1991.
[23] R. L. Daft and N. B. Macintosh, “A tentative exploration into theamount and equivocality of information processing in organizationalwork units,”Administrative Sci. Quart., vol. 26, pp. 207–224, 1981.
[24] W. H. DeLone and E. R. McLean, “Information systems success: Thequest for dependent variable,”Inform. Syst. Res., vol. 3, pp. 60–95, 1992.
[25] P. Ein-Dor and E. Segev, “Organizational context and the success ofMIS,” Manage. Sci., vol. 24, pp. 1064–1077, 1978.
[26] C. Fornell and D. F. Larcker, “Evaluating structural equation modelswith unobservable variables and measurement error,”J. Marketing Res.,vol. 18, pp. 39–50, 1981.
[27] F. J. Fowler,Survey Res. Methods, 2nd ed. Newbury Park, CA: Sage,1993.
[28] C. R. Franz and D. Robey, “Organizational context, user involvement,and the usefulness of information systems,”Decision Sci., vol. 17, pp.329–356, 1986.
[29] J. R. Galbraith, Designing Organizations. Reading, MA: Ad-dison-Wesley, 1977.
[30] S. Gallagher, “Beat the systems management odds,”Information Week,vol. 675, pp. 61–76, Mar. 30, 1998.
[31] D. F. Galletta and A. L. Lederer, “Some cautions on the measurementof user information satisfaction,”Decision Sci., vol. 20, pp. 419–438,1989.
[32] E. E. Ghiselli, J. P. Campbell, and J. P. Zedeck,Measurement Theory forthe Behavioral Sciences. San Francisco, CA: Freeman, 1981.
[33] V. Grover, S. R. Jeong, and A. H. Segars, “Information systems effective-ness: The construct space and patterns of application,”Inform. Manage.,vol. 31, pp. 177–191, 1996.
[34] L. Hatcher,A Step-by-Step Approach to Using the SAS System for FactorAnalysis and Structural Equation Modeling. Cary, NC: SAS Institute,1994.
[35] B. Ives and M. Olson, “User involvement and MIS success: A review ofresearch,”Manage. Sci., vol. 30, pp. 586–603, 1984.
[36] B. Ives, M. Olson, and J. J. Baroudi, “The measurement of user infor-mation satisfaction,”Commun. ACM, vol. 26, pp. 785–793, 1983.
[37] J. J. Jiang, G. Klein, and J. Balloun, “Ranking of system implementationsuccess factors,”Project Manage. J., vol. 27, pp. 50–55, 1996.
[38] J. J. Jiang and G. Klein, “Software development risks to project effec-tiveness,”J. Syst. Softw., vol. 52, pp. 3–10, 2000.
[39] K. G. Joreskog and D. Sorbam,LISREL 7: A Guide to the Program andApplications, 2nd ed. Chicago, IL: SPSS, 1989.
[40] W. R. King and J. I. Rodriguez, “Evaluating management informationsystems,”MIS Quart., vol. 2, pp. 43–51, 1978.
[41] K. J. Klein, R. J. Hall, and M. Laliberte, “Training and the orga-nizational consequences of technological change: A case study ofcomputer-aided design and drafting,” inTechnological Innovation andHuman Resources: End-User Training, U. E. Gattiker and L. Larwoods,Eds. New York: de Gruyter, 1990, pp. 7–36.
[42] E. W. Larson and D. H. Gobeli, “Significance of project managementstructure on development success,”IEEE Trans. Eng. Manage., vol. 44,pp. 188–195, 1989.
[43] T. L. Legare, “Minimizing resistance to technological change: A powerand politics approach,”Inform. Syst. Manage., pp. 59–61, Fall 1995.
[44] M. London and J. W. Smither, “Can multi-source feedback change per-ceptions of goal accomplishment, self-evaluation and performance-re-lated outcomes? Theory-based applications and directions for research,”Personal Psychol., vol. 48, pp. 803–839, 1995.
[45] M. L. Markus, “Power, politics and MIS implementation,”Commun.ACM, vol. 16, pp. 430–444, 1983.
[46] , Systems in Organizations: Bugs and Features. Boston: Pitman,1984.
[47] F. W. McFarlan, “Portfolio approach to information systems,”HarvardBusiness Rev., vol. 59, pp. 142–150, 1981.
[48] N. P. Melone, “A theoretical assessment of the user satisfaction constructin information research,”Manage. Sci., vol. 36, pp. 76–91, 1990.
[49] S. Nidumolu, “The effect of coordination and uncertainty on softwareproject performance: Residual performance risk as an intervening vari-able,” Inform. Syst. Res., vol. 6, pp. 191–219, 1995.
[50] PC Week, Jan. 1995, vol. 16, p. 68.[51] D. R. Pieptea and E. Anderson, “Price and value of decision support
systems,”MIS Quart., vol. 11, pp. 515–527, 1987.[52] R. S. Pressman,Software Engineering: A Practitioner’s Approach, 3rd
ed. New York: McGraw-Hill, 1992.[53] L. Raymond, “Organizational characteristics and MIS success in the
context of small business,”MIS Quart., vol. 9, pp. 37–52, 1985.[54] R. J. Rummel,Applied Factor Analysis. Evanston, IL: Northwestern
Univ. Press, 1970.[55] T. Saarinen, “System development methodology and project success:
An assessment of situational approaches,”Inform. Manage., vol. 19, pp.183–193, 1990.
[56] , “An expanded instrument for evaluating information system suc-cess,”Inform. Manage., vol. 31, pp. 103–118, 1996.
[57] K. Schwalbe, Information Technology Project Manage-ment. Cambridge, MA: Course Technology, 2000.
[58] S. Sharma,Applied Multivariate Techniques. New York: Wiley, 1996.[59] R. M. Wideman and R. J. Dawson, “Project and Program Risk Manage-
ment: A Guide to Managing Project Risks and Opportunities,” ProjectManagement Institute, Sylva, NC, 1998.
[60] R. C. Williams, J. A. Walker, and A. J. Dorofee, “Putting risk manage-ment into practice,”IEEE Soft., vol. 14, pp. 75–82, 1997.
[61] J. Yu and H. Cooper, “A qualitative review of research design effects onresponse rates to questionnaires,”J. Marketing Res., vol. 36, pp. 36–44,1983.
James J. Jiang is the Max Watson Professor ofComputer Information Systems at Louisiana TechUniversity. His Ph.D. in computer information sys-tems was awarded by the University of Cincinnati, in1992. His current research interests include projectmanagement, decision modeling, information systempersonnel, and the development of consonant ex-pectations among information system stakeholders.He has written more than 70 academic articles forjournals as, IEEE TRANSACTIONS ON SYSTEMS,MAN, AND CYBERNETICS, IEEE TRANSACTIONS ON
ENGINEERINGMANAGEMENT, Communications of the ACM, Decision SupportSystems, Decision Sciences, and the Project Management Journal. He is anactive Member of IEEE, ACM, and DSI.

JIANG et al.: INFORMATION SYSTEM SUCCESS 55
Gary Klein (M’98) is the Couger Professor of Infor-mation Systems at the University of Colorado in Col-orado Springs. He obtained his Ph.D. in managementscience at Purdue University (Go Boilers!). He previ-ously served as Dean of the School of Business at theUniversity of Texas of the Permian Basin. Before thattime, he served with Arthur Andersen & Company inKansas City and was Director of the Information Sys-tems Department for a regional financial institution.His interests include project management, knowledgemanagement, system development and mathematical
modeling with over 75 academic publications in these areas. In addition to beingan active participant in international conferences, he has made professional pre-sentations on Decision Support Systems in the US and Japan where he onceserved as a Guest Professor to Kwansei Gakuin University. He is a Member ofIEEE, ACM, INFORMS, SCIP, DSI, and the Project Management Institute.
Richard Discenzais a Professor of production management and informationsystems in the College of Business and Administration of Colorado at ColoradoSprings. He received his B.S.F. in forestry from Northern Arizona University, anM.B.A. from Syracuse University, and a Ph.D. in management from the Univer-sity of Oklahoma. Dr. Discenza was formerly Dean of the college. His currentresearch focuses on business process reengineering, distance education, projectmanagement, and supply chain management. He has published numerous ar-ticles in professional and academic journals and is a member of APICS, theAcademy of Management, and PMI.