information meeting - sbsホールディング … the year ended december 31, 2015 information...
TRANSCRIPT

For the Year Ended December 31, 2015Information Meeting
February 29, 2016SBS Holdings, Inc.

Copyright SBS Holdings, Inc. All rights reserved. FY2015 Information Meeting
Message from the President
SBS Holdings, Inc.President
Masahiko Kamata
11

Copyright SBS Holdings, Inc. All rights reserved. FY2015 Information Meeting
Actual % of Total Planned % of Total YOY Change (amount)
YOY Change (%)
Net Sales 157.9 100% 145.0 100% -12.9 -8.2%
Operating Income 5.3 3.4% 6.2 4.3% 0.8 16.0%
Ordinary Income 5.7 3.7% 6.2 4.3% 0.4 7.4%
Net Income -3.8 - 3.6 2.5% 7.4 -
FY2015 FY2016
Results of FY2015 and Plan for FY2016 2
(Billions of yen)

Copyright SBS Holdings, Inc. All rights reserved. FY2015 Information Meeting
Dividends
FY2015Year end dividend of 16 yen ⇒ No dividend
due to current term net loss
FY2016Quarterly dividend
Base date: March 31, 2016Amount of dividend per share: 16 yen
Year end dividendBase date: December 31, 2016Amount of dividend per share: 16 yen
3

Copyright SBS Holdings, Inc. All rights reserved. FY2015 Information Meeting
Extraordinary Losses Related to Transpole and
Transfer of the Company's Stocks
SBS Holdings, Inc.Managing Director
Kenichi Iriyama
14

Copyright SBS Holdings, Inc. All rights reserved. FY2015 Information Meeting
Concerns about recovery of claims regarding large amount transactions
Announcement of financial statements is postponed and survey is continued
Recovery of claims is estimated as highly difficult
Total amount of investment balance is charged off
Recovery of claims is impossible
One-time amortization of goodwill
Recovery of loan is estimated as difficult
Other
Extraordinary Losses Related to Transpole 5
Amount of extraordinary loss posted:
11,966 million yen
Amount of impact on current term net
profit and loss: -7,716 million yen

Copyright SBS Holdings, Inc. All rights reserved. FY2015 Information Meeting
Transfer of Transpole's Stocks
Reason for Stock Transfer Difficulties with recovery of claims ⇒ Damage to shareholders' equity,
deteriorating cash flows Mortal wound to the forwarder business, which needs funds With aggravation of the situation in the world economy, market environment
gets even more severe Taking into consideration possibility of expansion of loss with additional
support Deemed the power of our company alone not sufficient for reconstruction
Complete Withdrawal from Management of Transpole Total amount of the money invested into the company is charged off All shares of the company are offered for sale to a third party Occurrence of additional loss prevented
6

Copyright SBS Holdings, Inc. All rights reserved. FY2015 Information Meeting
【Memo】

Copyright SBS Holdings, Inc. All rights reserved. FY2015 Information Meeting
Business Results for FY2015 and Forecasts
for FY2016
SBS Holdings, Inc.Executive Officer, Director of Finance Division
Koki Kakehashi
17

Copyright SBS Holdings, Inc. All rights reserved. FY2015 Information Meeting
Actual % of Total Planned % of Total YOY Change (amount)
YOY Change (%)
Net Sales 141,535 100% 157,996 100% 16,460 11.6%
Operating Income 4,098 2.9% 5,347 3.4% 1,249 30.5%
Ordinary Income 3,648 2.6% 5,772 3.7% 2,123 58.2%
Net Income 2,725 1.9% -3,815 - -6,541 -
FY2015 FY2016
Consolidated Performance (YOY Comparison)
(Millions of yen)
8

Copyright SBS Holdings, Inc. All rights reserved. FY2015 Information Meeting
Planned % of Total Actual % of Total Difference AchievementRatio
Net Sales 165,000 100% 157,996 100% -7,004 95.8%
OperatingIncome 5,500 3.3% 5,347 3.4% -153 97.2%
OrdinaryIncome 4,900 3.0% 5,772 3.7% 872 117.8%
NetIncome 3,800 2.3% -3,815 - -7,615 -
FY2015
Consolidated Performance (Actual vs. Planned) 39
(Millions of yen)

Copyright SBS Holdings, Inc. All rights reserved. FY2015 Information Meeting
Logistics Property Management Other Adjusted Total
Net Sales 143,391 8,641 5,963 157,996YOY Change (%) 10.4% 69.3% -8.9% 11.6%
Operating Income (Loss) 2,072 3,292 238 5,347
YOY Change (%) 27.6% 39.6% -30.8% 30.5%Operating Margin 1.4% 38.1% 4.0% 3.4%
FY2015 (For the year ended December 31, 2015)
Reference: FY2014 (For the year ended December 31, 2014)
10
(Millions of yen)
Segment Performance Topics
※Net sales indicated on this page are figures after elimination.
Logistics PropertyManagement Other Adjusted Total
Net Sales 129,884 5,103 6,548 141,535YOY Change (%) 7.5% -8.1% 11.6% 7.1%
OperatingIncome (Loss) 1,624 2,359 344 4,098
YOY Change (%) 33.2% -7.5% 70.4% -0.4%Operating Margin 1.3% 46.2% 5.3% 2.9%

Copyright SBS Holdings, Inc. All rights reserved. FY2015 Information Meeting
Logistics Business: Full Fiscal Year Results (Domestic/Overseas)
※Goodwill amortization expense also includes PPA.
11
(Millions of yen)
FY2014
Actual Actual % of Total YOY Change
(amount)YOY Change (%)
129,884 143,391 100.0% 13,507 10.4%
Japan 122,335 125,409 87.5% 3,074 2.5%Abroad 7,549 17,982 12.5% 10,433 138.2%
1,914 2,780Operating income
margin 1.5% 1.9%
Japan 1,700 2,417Operating income
margin 1.4% 1.9%
Abroad 214 363Operating income
margin 2.8% 2.0%
290 708
1,624 2,0721.3% 1.4%
Japan 1,700 2,417 ここに海外個社業績Operating income
margin 1.4% 1.9% を拡張メタファイルで
Abroad -76 -345 貼り付けるOperating income
margin - -
LogisticsBusiness
FY2015
Net Sales
OperatingIncome 100.0% 866 45.2%
Operating incomemargin
42.2%
13.1% 149 69.6%
Amortization of goodwill(abroad)
OperatingIncome
86.9% 717
After amortization of
goodwill
Company nameAccounting term
Net Sales OperatingIncome
Operatingincomemargin
Amortiza-tionof goodw ill
Operatingprofit after
amortizationof goodw ill
TranspoleDec. 2014 - Sep. 2015
13,787 386 2.8% 569 -183
AtlasDec. 2014 - Sep 2015
3,299 -57 -1.7% 127 -184
SLHS/SLSGJan. 2015 - Dec. 2015
896 34 3.8% 12 22
Total 17,982 363 2.0% 708 -345

Copyright SBS Holdings, Inc. All rights reserved. FY2015 Information Meeting
Primary Causes of Increases and Decreases of Operating Incomein Logistics as Compared with the Previous Term
0.67
0.06
-0.51
As of December 31, 2014
1.62
2.07
0.57
-0.35
As of December 31, 2015
Increase of sales
Decline of fuel costs
Effects of price increase
Loss making
businessesOverseas
businesses +0.45
12
(Billions of yen)

Copyright SBS Holdings, Inc. All rights reserved. FY2015 Information Meeting
As of December 31, 2014
Total Assets 131.1
As of December 31, 2015
Total Assets 124.8
Current Assets
51.6
Non-Current Assets
73.2
Current Liabilities
52.9
Net Assets29.9
Non-Current Liabilities
41.8
-1.9-2.2
-4.0
+0.8
-5.1
-6.3
Current Assets
53.8
Non-Current Assets
77.2
Current Liabilities
54.9
Net Assets35.0
Non-Current Liabilities
41.0
13
(Billions of yen)
Trends of Consolidated Balance Sheets

Copyright SBS Holdings, Inc. All rights reserved. FY2015 Information Meeting
14
(Billions of yen) Total AssetsShareholders’ EquityEquity Ratio
Trends in the Financial Base
160
120
80
40

Copyright SBS Holdings, Inc. All rights reserved. FY2015 Information Meeting
Outline of Cash Flows (Consolidated)
1.8
1.6
1.4
1.2
1.0
0.8
0.6
0.4
0.2
0Final balance of cash, etc.
11.0
Cash flows from
investing activities
-7.0Cash flows from
financing activities
-2.6
Final balance of cash, etc.
-2.0
8.9
Cash flows from
operating activities
+7.7
15
(Billions of yen)
As of December 31, 2014
As of December 31, 2015

Copyright SBS Holdings, Inc. All rights reserved. FY2015 Information Meeting
Actual % of Total Planned % of Total YOY Change(amount)
YOY Change(%)
Net Sales 157,996 100% 145,000 100% -12,996 -8.2%
OperatingIncome 5,347 3.4% 6,200 4.3% 853 16.0%
OrdinaryIncome 5,772 3.7% 6,200 4.3% 428 7.4%
NetIncome -3,815 - 3,600 2.5% 7,415 -
FY2015 FY2016
16
(Millions of yen)
FY2016 Forecasts

Copyright SBS Holdings, Inc. All rights reserved. FY2015 Information Meeting
Logistics PropertyManagement Other Adjusted Total
Net Sales 143,391 8,641 5,963 157,996YOY Change (%) 10.4% 69.3% -8.9% 11.6%
OperatingIncome (Loss) 2,072 3,292 238 5,347
YOY Change (%) 27.6% 39.6% -30.8% 30.5%Operating Margin 1.4% 38.1% 4.0% 3.4%
FY2016 Forecast (For the year ending December 31, 2016)
17
(Millions of yen)
FY2016 Forecast by Segment
Reference: FY2015 Actual (For the year ended December 31, 2015)
※Net sales indicated on this page are figures after elimination.
Logistics PropertyManagement Other Adjusted Total
Net Sales 128,200 10,500 6,300 145,000YOY Change (%) -10.6% 21.5% 5.7% -8.2%
OperatingIncome (Loss) 1,200 4,700 300 6,200
YOY Change (%) -42.1% 42.8% 26.1% 16.0%Operating Margin 0.9% 44.8% 4.8% 4.3%

Copyright SBS Holdings, Inc. All rights reserved. FY2015 Information Meeting

Copyright SBS Holdings, Inc. All rights reserved. FY2015 Information Meeting
Reference Data1. Business Results of and Plan
for the 3PL Business 192. Outline of Opening of Logistics
Centers Totaling 165,000m2 203. Business Results of and Plan
for the Property Management Business 214. Business Results of and Plan
for the Leasing Business 225. Business Results of and Plan for the
Development Business (Liquidation) 236. Business Results of and Plan
for the Other Business 247. Current State of the Solar Power
Generation Business 25
18

Copyright SBS Holdings, Inc. All rights reserved. FY2015 Information Meeting
FY2013 FY2014 FY2015 FY2016 Plan
117.5 122.8 125.4 128.2Among these,3PL net sales 46.1 48.5 51.2 54.5
YOY Change (%) 4.1% 5.2% 5.6% 6.4%% of Total 39.2% 39.5% 40.8% 42.5%
Net sales (domesticlogistics)
Business Results of and Plan for the 3PL Business
Results of Main Operations Drugstore chain (operation of logistics center in Tottori and Tokushima) Major supermarket chain (operation of a 30,000m2 scale logistics
center) Food manufacturer (operation of a 16,500m2 logistics center) Wine logistics (operation of a joint center for premium wines) CD/DVD wholesale business (operation of a logistics center)
Trends of Sales in the 3PL Business
19
(Billions of yen)

Copyright SBS Holdings, Inc. All rights reserved. FY2015 Information Meeting
Location Floor space Type of industry/work handled
Sugita/Yokohama 39,600m2 Wine, Internet-order sales of apparel, etc.
Tokorozawa/Saitama 30,360m2 Department stores, etc.
Sakura/Chiba 17,820m2 Supermarkets, wholesale of foodstuffs
Inzai/Chiba 29,700m2 Internet-order sales, etc.
Ichikawa/Chiba 14,520m2 Supplies
Sanda/Hyogo 33,000m2 Drugstores
Ginza/Tokyo 49,500m2 On-site logistics for business complexes
Outline of Opening of Logistics Centers Totaling 165,000m2
Main Centers Opened (First Half of the FY2016)
20
※Total floor space excluding on-site logistics is 165,000m2.

Copyright SBS Holdings, Inc. All rights reserved. FY2015 Information Meeting
FY2013 FY2014 FY2015 FY2016 Plan
5,554 5,103 8,641 10,500YOY Change (%) 121.8% -8.1% 69.3% 21.5%
Leasing Business 2,672 2,285 2,685 3,200Development
Business 2,881 2,818 5,956 7,300
2,550 2,359 3,292 4,700YOY Change (%) 111.4% -7.5% 39.6% 42.8%
Leasing Business 1,358 1,119 1,378 1,600Development
Business 1,191 1,240 1,914 3,100
Real EstateBusinessNet Sales
OperatingIncome
Business Results of and Plan for the Property Management Business
※Leasing Business: renting out logistics facilities, office complexes, residences, etc. owned
※Development Business: developing logistics facilities and selling (liquidating) them to funds and institutional
investors
21
(Millions of yen)

Copyright SBS Holdings, Inc. All rights reserved. FY2015 Information Meeting
Business Results of and Plan for the Leasing Business 22
(Millions of yen)
2,672 2,285 2,685 3,200YOY Change (%) 6.7% -14.5% 17.5% 19.2%
1,358 1,119 1,378 1,600YOY Change (%) 12.6% -17.6% 23.1% 16.1%
Noda YoshiharuLogistics Center
Nagatsuta LogisticsCenter
Sinsugita LogisticsCenterTokorozawa LogisticsCenter
West Japan LogisticsCenter (51%)
West Japan LogisticsCenter (49%)
Noda YoshiharuLogistics CenterTokorozawa LogisticsCenter
Kawagoe LogisticsCenter
FY2016 Plan
Sold facilities
Net Sales
OperatingIncome
LeasingBusiness FY2013 FY2014 FY2015
Completedfacilities

Copyright SBS Holdings, Inc. All rights reserved. FY2015 Information Meeting
2,881 2,818 5,956 7,300
1,191 1,240 1,914 3,100West Japan Logistics
CenterWest Japan Logistics
Center
(1) Tokorozawa Warehouse(2) Noda Yoshiharu LogisticsCenter
Kawagoe LogisticsCenter
Buyer SBS Logifund No.1(Private placement fund)
SBS Logifund No.1(Private placement fund)
(1) General enterprise(2) GLP J-REIT To be determined
Notes Sold 51% interest of ourtrust beneficiary right
Sold 49% interest of ourtrust beneficiary right
(1) Sold through regular marketchannels(2) Sold our trust beneficiary rightthrough Central Compass Co., Ltd.
Our trust beneficiaryright to be sold
FY2015 FY2016 Plan
Property
DevelopmentBusiness FY2013 FY2014
Net SalesOperating
Income
Business Results of and Plan for the Development Business (Liquidation) 23
Noda Yoshiharu Logistics Center
(Millions of yen)
Copyright SBS Holdings, Inc. All rights reserved. FY2015 Information Meeting
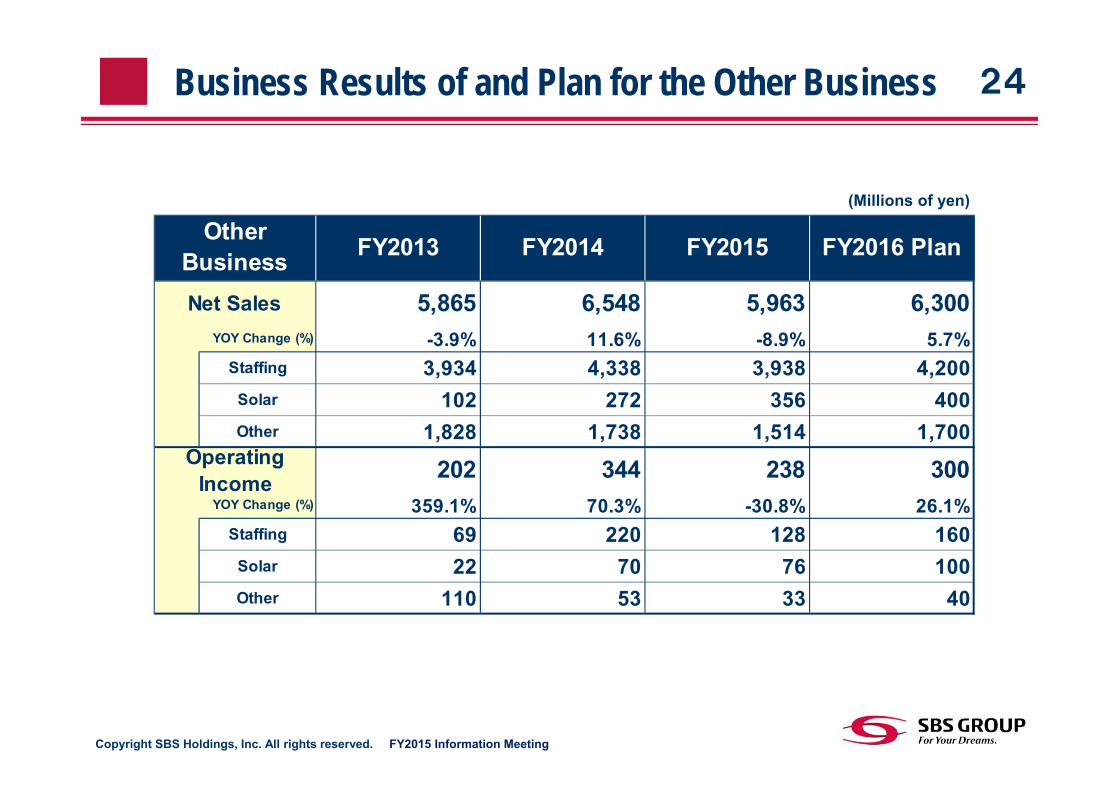
Business Results of and Plan for the Other Business 24
(Millions of yen)
FY2013 FY2014 FY2015 FY2016 Plan
5,865 6,548 5,963 6,300YOY Change (%) -3.9% 11.6% -8.9% 5.7%
Staffing 3,934 4,338 3,938 4,200Solar 102 272 356 400Other 1,828 1,738 1,514 1,700
202 344 238 300YOY Change (%) 359.1% 70.3% -30.8% 26.1%
Staffing 69 220 128 160Solar 22 70 76 100Other 110 53 33 40
OtherBusinessNet Sales
OperatingIncome

Copyright SBS Holdings, Inc. All rights reserved. FY2015 Information Meeting
Current State of the Solar Power Generation Business
Number of facilities operated reached 13 In 2016, the Group will increase the number further to 14 and total power generation
capacity will reach 10MW
25
Solar power generation equipment installed on the roof of the Sinsugita
Logistics Center of SBS Logicom(completed February, 2016)
(Millions of yen)
Launchdate
Pow er generationcapacity
(kW)
1 Noda Yoshiharu Logistics Center Mar. 2013 5142 Chikuma Logistics Center Jul. 2013 6043 Shibayama Solar Power Plant Aug. 2013 2,8264 Kawagoe Logistics Center Aug. 2013 8305 West Japan Logistics Center Mar. 2014 6176 Shibayama No. 2 Solar Power Plant Sep. 2014 7107 Kimitsu Branch, SBS Logicom Oct. 2014 2688 Yoshikawa Branch, SBS Logicom Oct. 2014 2239 Takasaki Office, SBS Logicom Oct. 2014 161
10 Odawara Branch, SBS Freight Service Dec. 2014 21011 Nagatsuta Logistics Center Feb. 2015 93512 Toyohashi Logistics Center Sep. 2015 22113 Sinsugita Logistics Center Feb. 2016 1,000
Already operating: 9,11914 Tokorozawa Center (under construction) Jul. 2016 970
Total 10,089
Facility name
FY2015 FY2016 Plan
356 400YOY Change (%) 130.9% 112.4%
76 100YOY Change (%) 108.6% 131.6%
OperatingIncome
Solar PowerGenerationBusiness
Net Sales

Copyright SBS Holdings, Inc. All rights reserved. FY2015 Information Meeting
【Memo】