influence of lean green practices on organizational
TRANSCRIPT

Influence of lean–green practiceson organizational
sustainable performanceManori Pathmalatha Kovilage
Faculty of Management Studies, Department of Tourism Management,Sabaragamuwa University of Sri Lanka, Belihuloya, Sri Lanka
Abstract
Purpose – The key objectives of this study were to investigate the interactions among the lean,greenmanagement practices and organizational sustainable performancemeasures and explore the possibilityof simultaneous implementation of these concepts for improving the organizational sustainable performance.Design/methodology/approach – Using the interpretive structural modeling (ISM) technique, theinteractions among the lean, green practices and organizational sustainable performance measures wereestablished. A focus group which consisted of purposively selected 15 experts was utilized in the primary datacollection.Findings – In Sri Lankan context, water and material consumption reduction, energy efficiency, waterpollution and greenhouse gas reduction were identified as the dominant green practices, while pull production,lot size reduction, continuous improvement, preventive maintenance, employee involvement and cycle timereduction were the dominant lean practices. Inventory level, profitability, quality, cost, employee satisfaction,customer satisfaction, lead time, resources consumption (material, water, energy) and waste generation weredetermined as the dominant sustainable performance measures. The resulting ISM-based structural modelwhich consisted of eight levels concluded that firstly lean practices influence the green practices and afterwardgreen practices affect the sustainable performance measures.Research limitations/implications –The aim of this study was to develop a hypothetical structural modelto explain the interactions among the lean, green management practices and organizational sustainableperformance measures. But this hypothetical model was not empirically tested in the current study. So furtherstudy is required to empirically test the proposed model.Practical implications – Currently organizations who practice for sustainable performance engages, leanand green practices separately without understanding on which practices are stared when and how. So,through the findings of this study, organization who desire to improve the sustainable performance arerecommended to begin the journeywith lean practices and subsequentlymove in to green and handle both leanand green initiatives through one functional unit.Originality/value – The existing literature does not possess a model for explaining the lean–green synergyand organizational sustainable performance and this study successfully fills this gap. Also the study proposesfor the practitioners, when and how the lean and green practices should be initiated and implemented for risingthe sustainable performance of an organization.
Keywords Lean management, Green management, Sustainable performance measures, Interpretive
structural modeling, Sustainability, Management
Paper type Research paper
1. IntroductionAt the end of 20th century, getting a start from the report “Our Common Future” (Brundtland,1987) the sustainability thinking and sustainable development was started to integrate in to
Influence oflean–greenpractices
121
JEL Classification — O13, P18, Q56© Manori Pathmalatha Kovilage. Published in Journal of Asian Business and Economic Studies.
Published by Emerald Publishing Limited. This article is published under the Creative CommonsAttribution (CCBY4.0) licence. Anyonemay reproduce, distribute, translate and create derivativeworksof this article (for both commercial and non-commercial purposes), subject to full attribution to theoriginal publication and authors. The full terms of this licence may be seen at http://creativecommons.org/licences/by/4.0/legalcode
The current issue and full text archive of this journal is available on Emerald Insight at:
https://www.emerald.com/insight/2515-964X.htm
Received 22 November 2019Revised 4 March 2020Accepted 29 May 2020
Journal of Asian Business andEconomic StudiesVol. 28 No. 2, 2021
pp. 121-142Emerald Publishing Limited
2515-964XDOI 10.1108/JABES-11-2019-0115

the organizational strategy (Enquist et al., 2007). The sustainable development refers to the“development that meets the needs of the present without compromising the ability of futuregenerations to meet their own needs” (Brundtland, 1987) and organizational sustainableperformance is the key path of the sustainable development in a country, region or whole theworld. As a consequence, sustainability measures were initiated to incorporate in theorganizational performance evaluation models. With this startup organizations whichperceive the organizational performance in a financial facet accepted the sustainableperformance which combine the economic, social and environmental (triple) bottom lines(Elkington, 1998) as their performance target (Sebhatu, 2008).
In achieving the corporate sustainable performance, organizations are applying differentkind of efforts today. Lean and green are several cutting-edge paradigms which are oftenapplied in ensuring the organizational sustainable performance by the corporate sector(Azevedo et al., 2016). The concept, lean signifies a system which utilize less inputs to createthe same output as those created by a traditional mass production systemwhile contributingincreased varieties for the end customer and it aims to reduce or eliminate non–value-addedactivities throughout a product value stream (Womack and Jones, 1994). Meanwhile theconcept greenmanagement limits or reduces the potential negative impacts of the productionand consumption of goods and services on the natural environment, while improving thecompany’s environmental footprint (Galeazzo et al., 2014; Verrier et al., 2014). As emphasizedby the scholars, there are some synergies among these concepts (Wu et al., 2015). But most ofthe organizations have forgotten about these synergies and these concepts are implementedseparately by different units and departments. Then the consequence is overlapping effortsand extra expenses (Weise et al., 2015) which increase the distance to the destinationsustainable performance.
As a solution for these inefficiencies, scholars have started to research on the possibilityfor synergetic or simultaneous implementation of these philosophies and its impact on theorganizational performance. In this research context, the existing research efforts can begrouped around the following key research areas such as lean and green synergies ( Hallamand Contreras, 2016; Bergmiller and McCright, 2009; Cabral et al., 2012; D€ues et al., 2013;Galeazzo et al., 2014), lean–green synergy and organizational performance (Farias et al., 2019;Thanki et al., 2016), lean–green synergy and sustainable performance (Khalili et al., 2016),lean and sustainable manufacturing on performance (Hartini and Ciptomulyono, 2015), leanmanufacturing and sustainable performance (Henao et al., 2019), lean–green-socialmanagement and sustainable performance (Wu et al., 2015), integration of lean, green andbest practice business principles (Weise et al., 2015), synergies among lean–green-agile –resilient practices(Azevedo et al., 2016) and lean management, supply chain managementand sustainability (Jurado et al., 2014).
In the case of lean–green synergy and sustainable performance, most of the previousstudies have focused the supply chain perspective and individual organizationalperspective has been neglected (Garza-Reyes, 2015; Govindan et al., 2015). Then, Khaliliet al. (2016), who researched on lean–green synergy and organizational sustainableperformance has proposed a model to explain the interaction among lean, green andorganizational sustainable performance measures in the manufacturing-orientedorganizations. In this model lean approach has been explained through 4 Ps: problem-solving, process, philosophy and people. Then green approach has been explained throughISO 14001 Environmental Management System Standards. This model has been developedtheoretically and not been empirically tested. Further, this paper has been addressed theinteraction of the lean–green management and organizational performance in themanufacturing sector only. So, it denotes that existing studies are not enough tocomprehensively understand the interactions of lean and green management practices andorganizational sustainable performance.
JABES28,2
122

So also, in the Sri Lankan context, no research was found which addressed this researcharea. But most of industrial organizations in Sri Lanka are implementing both conceptsseparately and they are ignorant on the possibility of synergetic implementation of lean andgreen concepts. Further they are uninformed on the interactions among lean–green andorganizational sustainable performance measures. There for, the main aim of this study wasto investigate the interactions of the lean management, green management and sustainableperformance measures and explore the possibility of simultaneous implementation of theseconcepts for improving the organizational sustainable performance in Sri Lanka. In achievingthese research objectives, the study does not limit for a particular industry or sector and it is aholistic study which covers all the industrial categories. Further, the research aimed toexplain the interactions of the lean–green practices and the organizational sustainableperformance measures through a hypothetical structural model because existing literaturedoes not possess such a model for explain the lean–green synergy and organizationalsustainable performance. So, it establishes the empirical gap of the study. Here the researcherexpects to develop the structural model base on the interpretive structural modelingapproach, proposed by the Warfield (1974).
2. Literature review2.1 Existing studies on “strategy integration for sustainable performance”As a strategy for achieving the sustainable performance, nowadays organizations arefocusing the strategy integration. Under this integration, lean–green integration, lean, greenand social management integration, lean, green, agile and resilience practices integration areprominent among the current scholars. Table 1 demonstrate the research areas which weredone under the strategy integration.
In the context of strategy integration for sustainable performance, the researcheridentified the existing research gap in the research area of “lean–green synergy andsustainable performance” or integration of lean and green strategies (paradigms) to achievethe sustainable performance. Here, the identified research gap is, unavailability of acomprehensive model to explain the interaction among lean–green paradigms (strategies/practices) and the organizational sustainable performance.
2.2 Organizational sustainable performanceThe term organizational performance is defined as “a measure of organizational efforts todetermine, implement and adapt organizational strategies successfully” (David, 2011).Historically, the concept of organizational performance is too often approximated to thefinancial performance. In consequence, the organizational performance was often measuredwith the financial preferable indicators such as return on investments, sales, profit per share(Morin, 1995).
Then, gradually organizations’ focus tuned toward the sustainable business performancebeyond the financial performance (Lee and Saen, 2011). The sustainable performance of acompany is judged according to its economic, environmental and social performance (Lee andSaen, 2011). Global Reporting Initiative (GRI), Composite Sustainable Development Index andSustainability BSC (SBSC) are several existing sustainable performance measures.
The GRI offers a voluntary reporting frame-work that comprises goals andoperationalized indicators with regard to environmental, economic and social performance(Global Reporting Initiative, 2017). Here the environmental dimension of sustainabilityconcerns the organization’s impact on living and nonliving natural systems, including land,air, water and ecosystems. The social dimension of sustainability concerns the impacts, theorganization has on the social systems within which it operates. The social category includes
Influence oflean–greenpractices
123

the subcategories: labor practices and decent work, human rights, society and productresponsibility (Global Reporting Initiative, 2017). The economic dimension of sustainabilityconcerns the organization’s impacts on the economic conditions of its stakeholders, and oneconomic systems at local, national and global levels (Global Reporting Initiative, 2017).
“GRI is also the case for the Composite Sustainable Development Index (ICSD) which iscomposed of the economic sub-index, the environmental sub-index and the social sub-index”(Krajnc and Glavic, 2005). These subindices are in turn composed of correspondingly“normalized economic, environmental and social indicators extracted from other frameworksincluding GRI” (Krajnc andGlavic, 2005). The Balanced Score Card (BSC) contains four aspectsas financial, customer, internal processes, learning and growth for which performanceindicators ensure alignment between strategies and operations (Kaplan and Norton, 1996). TheBSC is an open system which means that all stakeholder interests can be included if they areimportant for the success of a strategy.Therefore, integrating the environmental goals, BSC canbe expanded as the Sustainability BSC (SBSC) (Moller and Schaltegger, 2005). To derive theSBSC two ways can be followed. The first way is integrating the environmental goals into theexisting four performance perspectives of the BSC. The second way is adding a separateperspective for the environmental concern (Krajnc and Glavic, 2005).
2.3 Lean paradigmLean, originally developed on the shop floors of Japanese car manufacturers, is stillsometimes understood as a synonym for Toyota Production System (TPS). Eiji Toyoda and
The research area Author
Lean–green synergy (synergies between lean and greenmanagement): These authors have discussed the synergies anddifferences between the lean and green paradigms
Hallam and Contreras (2016);Bergmiller andMcCright (2009); Cabral et al. (2012);D€ues et al. (2013); Galeazzo et al. (2014)
Lean–green and organizational performance: These authors havediscussed the impact of lean and green strategies/practices on theorganizational financial performance. They have focused theindividual impact of lean and green practices on the organizationalperformance, but not tested the possibility of implementation of leanand green simultaneously for improving the organizationalperformance
Farias et al. (2019); Thanki et al. (2016)
Lean–green synergy and sustainable performance: The author hasfocused on the relationships of lean, green manufacturing andsustainable performance. In this model lean approach has beenexplained through: problem-solving, process, philosophy and people.Then green approach has been explained through ISO 14001EnvironmentalManagement SystemStandards. Thismodel has beendeveloped theoretically concerning only the manufacturing sectorand not been empirically tested
Khalili et al. (2016)
Lean – green- social management and sustainable performance: Theimpact of integrated practices of lean, green, and social managementsystems on firm sustainability performance has been observed,getting evidence from Chinese Fashion Auto-Parts Suppliers
Wu et al. (2015)
The integration of lean, green and best practice business principles:The integration possibility of lean, green and best practice businessprinciples has been studied in this paper
Weise et al. (2015)
Lean–green-agile-resilient practices – LARG index: This is anattempt to develop a benchmarking tool for improving the leanness,agility, resilience and greenness of the automotive supply chain
Azevedo et al. (2016)Table 1.Research areas andauthors in strategyintegration
JABES28,2
124

Taiichi Ohno at the Toyota Motor Company in Japan pioneered the concept of the “ToyotaProduction System” or which is named as the “Lean Production or Lean Manufacturing” inthe American manufacturing system (Bhasin, 2015). Gradually the lean concept which wasoriginally spread in the manufacturing industries, was begun to spread in the serviceindustries too.
The basic idea behind the “lean” is eliminating waste which is defined as anything thatdoes not add value to the end product from the customer’s perspective. For an organizationthe waste may be material, inventory, overproduction, unwanted movements of labor,complexity, energy, space, defects, transportation, setup time, etc. (Womack and Jones, 1994).Lean philosophy has introduced some tools to eliminate these wastes and ensure thecontinues improvement. Those tools includes: 5 S, Value Stream mapping, Kanban,Standardized work, PDCA Problem-solving, Total Quality Management, Total ProductiveMaintenance, Single Minute Exchange of Die(SMED), Five Why, Gemba (The Real Place),Jidoka (Autonomation), Visual Factory, Just in Time and Kizen (Bhasin, 2015).
The lean concept has built on five key principles as value, value stream, flow, pull andperfection (Womack and Jones, 1996). Here the first principle value refers to the customerperceived value and lean thinking start with a conscious attempt to precisely define valuethrough a dialog with a specific customer, since only they can define what is valuable to them(Womack and Jones, 1996). The second principle value stream is a series of actions producedby an organization to create value for the customer. Analyzing the value stream aims toidentify value-adding activities that are necessary for producing and delivering a product orservice to the customer and nonvalue adding activities that prevents the flow of valuethrough the process (Womack and Jones, 1996). Third lean principle flow refers to an idealvalue stream in which the product or services never stops and move from start to finishcontinuously (Womack and Jones, 1996). The objective is to move material and work inprocess (WIP) from one value-adding step directly to the next value-adding step, and then tothe customer without waiting, downtime or waste within or between the steps (Womack andJones, 1996). The fourth principle, pull means that nothing should be produced upstream untilthe downstream customer asks for it. In an ideal “one-by-one flow, the product flowscontinually to the customer only after the signal from the requesting customer” (Womack andJones, 1996). The objective is thus to produce only what the customer wants just when thecustomer wants it (Womack and Jones, 1996). The fifth principle perfection can be realizedthrough proper implementation of the first four principles. For achieving the perfection, thereis no end to the continuous process improvements (Womack and Jones, 1996).
2.4 Green managementThe concept green management which was started to discuss in last few decades is a keystrategy for the sustainable development (Banerjee, 2002). In the broader aspect, greenmanagement involves the integration of the environment in organizational decision-making.It refers to the “practices that produce environmentally-friendly products and minimize theimpact on the environment through green production, green research and development, andgreen marketing” (Peng and Lin, 2008). A business organization that adopt with the greenmanagement principles, policies and practices refers as a green business. A green businesscan be derived from two perspectives related to the output in the form of green products(goods and services) as well as the production process (Loknath and Azeem, 2017). Reductionof regulatory risk, decreasing the customers’ exposure to unhealthy substances, increasingthe reuse and recycling of materials used in the production process, improving the energyefficiency, resource productivity, waste reduction, pollution prevention, collecting anddisseminating more information about the firm’s environmental impacts and performancethan the law requires, providing more opportunities for stakeholder input into corporate
Influence oflean–greenpractices
125

environmental decision-making than the law requires and financing and investing in greenproducts and business models are the green practices adapts by green businesses toaccomplish the green management (Loknath and Azeem, 2017).
2.5 Green, lean practices and sustainable performance measuresTable 2 summarizes the lean, green management practices and organizational sustainableperformance measures which were identified through surveying existing literature.
3. MethodologyThe purpose of this study was to investigate the interactions of the lean, green managementpractices and organizational sustainable performancemeasures and explore the possibility ofsimultaneous implementation of these concepts for improving the organizational sustainableperformance and finally to develop a structural model that explain these interactions. Inachieving the research purpose, the study followed the constructivist research philosophy.“Constructivism or social constructivism (often combined with interpretivism) is such aperspective, and it is typically seen as an approach to qualitative research” (Creswell, 2014,p. 37). Thus, the research followed the qualitative research approach with qualitative datacollection methods: unstructured interviews and focus group interviews. Here, in developingthe structural model, the “Interpretive Structural Modeling (ISM) Technique” was followed.
ISM technique was introduced by Warfield in 1973 for studying the multifacetedsocioeconomic systems. “ISM is found to be a well-proven and widely accepted systemmodelling approach for analyzing the interrelationships between the variables influencinga system” (Warfield, 1974). Further the ISM approach is more applicable when the studyrequires a “multilevel research design involvement” and the outcome of the research cannotbe predicted based on available research studies (Klein and Kozlowski, 2000 cited inGovindan et al., 2015). The ISM follows a process which comprises eight stages indeveloping the structural model for a particular research problem. Correspondingly, thosestages comprise: identification of elements, establishing a contextual relationship betweenelements, developing a structural self-interaction matrix (SSIM) of elements, developing areachabilitymatrix from the SSIM, partitioning of a reachability matrix into different levels,draw a directed graph (DIGRAPH) to remove transitive links, conversion of the resultantdigraph into an ISM and review of the ISM model to check for conceptual inconsistency(Warfield, 1974). Figure 1 demonstrate the flow of the studywhich followed the ISM processexplained by the Warfield (1974).
Aligning with the ISM methodology, at start, lean, green management practices andorganizational sustainable performance measures which were widely applied in the SriLankan business organizations were identified through surveying existing literature andengaging unstructured interviewswith 10 industry experts and five academics who possess asound knowledge in this particular research area. Here, these experts were selectedpurposively, concerning their expertise on lean and green paradigms, because the qualitativeapproach propose the nonprobabilistic sampling techniques like purposive sampling(Creswell, 2014). Then, the focus group interview technique was utilized to determine thekey lean, green management practices and organizational sustainable performance measuresand relationships among the key lean, green management practices and organizationalsustainable performance measures. Because the ISM approach often recommends the focusgroup interviews, nominal group technique and brainstorming sessions for identifying theinteractions among the research variables (Warfield, 1974). Here, the focus group consisted of15 experts (they are separate from previous interviewees) who also represented the industryand academia and were expertise on green and lean management approaches. These experts
JABES28,2
126

Green practices Description Source
Water consumptionreduction
“Efforts for reduction of water consumption in the businessoperations”
Farias et al.(2019)
Water pollutionreduction
“Reduction of contamination of water bodies as a result ofbusiness operations”
Farias et al.(2019)
Energy efficiency “Usage of less energy to perform the same operations in thebusiness organization, through eliminating waste”
Farias et al.(2019)
Material efficiency “Usage of less material resources to perform the same operationsin the business organization, through eliminating waste”
Farias et al.(2019)
GHG emission reduction “Reduction of quantity of greenhouse gasses released to theatmosphere through the business operations”
Farias et al.(2019)
Lean practices Description SourcePull production/flow “An approach to produce only what the customer wants just
when the customer wants it, thereby the production systems areflexible enough to accommodate shifting demand immediately”
Farias et al.(2019)
Lot size reduction “Lot size refers to the quantity of an item ordered for delivery ona specific date or manufactured in a single production run. Asmall, lot size causes reduction in inventory level, variability inthe system and ensures smooth production”
Wu et al.(2015)
Continuousimprovement/Kaizen
“Activities that continuously improve all functions and involveall employees from the CEO to the assembly line workers”
Farias et al.(2019)
Preventive maintenance “Preventive maintenance (or preventative maintenance) ismaintenance that is regularly performed on a piece of equipmentto lessen the likelihood of it failing. It is performed while theequipment is still working so that it does not break downunexpectedly”
Kovilage(2018)
Employee involvement “A situation where employees participate directly to help anorganization to fulfill its mission and meet its objectives byapplying their ideas, expertise, and efforts towards problemsolving and decision making”
Kovilage(2018)
Cycle time reduction “Cycle time, also called throughput time, is the amount of timerequired to produce a product or service. Cycle time reduction isachieved by reducing the time spent on non-value-addedactivities and simplification and streamlining of the process”
Wu et al.(2015)
Sustainable performancemeasures
Description Source
Inventory level “Inventory refers to the items that are kept in stock to process orresell. Keeping a high level of inventory adds a cost to thebusiness as inventory handling, holding, obsoleteness, etc.”
Farias et al.(2019)
Profitability “The degree to which a business or activity yields profit orfinancial gain”
Farias et al.(2019)
Waste generation “Amount of total waste generates through all the processes in abusiness”
Farias et al.(2019)
Quality “It refers to the fitness for use or conformance to the standard” Farias et al.(2019)
Cost “It refers the value of money that has been used up to producesomething or deliver a service, and hence is not available for useanymore”
Farias et al.(2019)
Employee satisfaction “Employee satisfaction is the term used to describe whetheremployees are happy and fulfilling their desires and needs atwork”
Wu et al.(2015)
Customer satisfaction “It refers howproducts and services supplied by a companymeetor surpass customer expectation”
Wu et al.(2015)
Lead time “The time elapse between order receiving from the customer todelivering the order to the customer”
Kovilage(2018)
Resources consumption “Amount of material, energy and water usage for the operationsin a business organization”
Kovilage(2018)
Table 2.Green, lean practices
and sustainableperformance measures
Influence oflean–greenpractices
127

also were selected purposively, concerning their expertise. As Figure 1 (flow of the study),demonstrates, a Structural Self-InteractionMatrix (SSIM) (seeMatrix 1 in the results) was usedto document the experts’ opinions on the interactions among the key lean, green managementpractices and organizational sustainable performance measures. Afterward, based on therelationships emphasized in the SSIM, the Initial Reachability Matrix (IRM) was developed.
Reviewing literatureList of lean & green management
practices and organizational
sustainable performance
Prioritizing the factors
Key lean & green management practices and
organizational sustainable performance measures
Establish contextual relationships among lean & green
management practices and organizational sustainable
performance measures
Expert opinions
Construct a structural
self-interaction matrix
(SSIM)
Obtain initial
reachability
matrix
Incorporating
transitivity, obtain final
reachability matrix
Partitioning the final
reachability matrix into
different levels
Develop
DiagraphRemove transitivity
from this diagraph
Replace variable nodes with
relationship statements
Is there any
conceptual
inconsistency?
Represent relationship statement into model that explain the
interactions among lean & green management practices and
organizational sustainable performance measures
Necessary
modification
Figure 1.Flow of the studybased on the ISMprocess explained byWarfield (1974)
JABES28,2
128

Then concerning the transitivity of each relationship (e.g. Variable “A” affects to Variable“B” and variable “B” affects to Variable “C”, so variable “A” affects to Variable “C” also), theFinal Reachability Matrix (FRM) was developed. Then, through the FRM, the drivingpower, dependence power and levels (levels in the structural model) of each lean, greenmanagement practices and organizational sustainable performance measures weredetermined. Here an algorithm-based process was followed (see Tables 3–10). Afterward,the final reachability matrix was decomposed to create the structural model, that is, adirected graph. Subsequently, the transitive links were removed from the directed graphand ISM-based model of the lean, green management practices and organizationalsustainable performance measures were developed based on the relationships, emphasizedin the SSIM, and levels, determined through the algorithm-based process. Further each lean,green management practices and organizational sustainable performance measures wereclassified as independent, dependent, autonomous and linkage variables with the help ofMICMAC analysis. Matrice d’impacts croises-multiplication appliq�ue an classment (cross-impact matrix multiplication applied to classification) is abbreviated as MICMAC. Thepurpose of MICMAC analysis is to analyze the drive power and dependence power offactors. MICMAC principle is based on multiplication properties of matrix.
Further, ensuring the construct validity, internal validity, external validity and reliabilityare essential requirements for receiving an enough acceptance for the research findings (Vosset al., 2002). If the operational measures of the particular construct are only measuring theparticular construct, the construct validity is satisfied. The two subsets of the constructvalidity involve convergent validity (multiple items of a construct are corelated) anddiscriminant validity (individual items of a construct are unique and only measure theparticular constructs) (Carmines and Zeller, 1979). To ensure the construct validity, the twoparadigms (lean and green) and “sustainable performance” were defined, using multipleitems that explain only the construct and are not explain other constructs . Internal validityimplies that the study really measures what it is intended. Here, internal validity was ensuredthrough explaining the objectives of this study and simplifying the constructs and items forrespondents. External validity implies that the results are valid in similar settings outside thestudied objects. This study satisfies the external validity also, because the researcher selecteditems of each construct as represent both service and manufacturing sectors in Sri Lanka.Meanwhile, the reliability of this studywas ensured through selecting respondents from bothacademia and industry.
4. Results4.1 Lean, green practices and sustainable performance measuresAs per the opinions of the experts who participated in the focus group, water (1) andmaterial (2) consumption reduction, water pollution (3) and GHG reduction (4) and energyefficiency (5) were determined as the dominant green practices. While, pull production/flow(6), lot size reduction (7), continuous improvement (8), preventivemaintenance (9), employeeinvolvement (10) and cycle time reduction (11) were decided as the dominant lean practices.Then as the dominant sustainable performance measures: inventory level (12), profitability(13), quality (14), cost (15), employee satisfaction (16), customer satisfaction (17), lead time(18), resources consumption (19) (material, water, energy) and waste generation (20) weredetermined.
4.2 Structured Self-Interaction MatrixThe Matrix 1 illustrates the interrelationships among the dominant lean, green practices andsustainable performance measures which were determined by the experts who participated
Influence oflean–greenpractices
129

ij
Factor
12
34
56
78
910
1112
1314
1516
1718
1920
1Water
consumption
reduction
*A
XV
VA
AA
AA
AV
VV
VV
VV
VV
2Materialconsumption
reduction
**
XV
VA
AA
AA
AV
VV
VV
VV
VV
3Energyefficiency
**
*A
VA
AA
AA
AV
VV
VV
VV
VV
4Water
pollution
reduction
**
**
VA
AA
AA
AV
VV
VV
VV
VV
5GHGreduction
**
**
*A
AA
AA
AV
VV
VV
VV
VV
6Pullproduction/flow
**
**
**
VA
AA
VV
VV
VV
VV
VV
7Lot
size
reduction
**
**
**
*A
VA
VV
VV
VV
VV
VV
8Continuousim
provem
ent
**
**
**
**
VA
VV
VV
VV
VV
VV
9Preventivemaintenance
**
**
**
**
*A
VV
VV
VV
VV
VV
10Employee
involvem
ent
**
**
**
**
**
VV
VV
VV
VV
VV
11Cycletimereduction
**
**
**
**
**
*X
VV
VX
VV
VV
12Inventory
level
**
**
**
**
**
**
VV
VX
VV
VV
13Profitability
**
**
**
**
**
**
*A
AA
AA
AA
14Quality
**
**
**
**
**
**
**
XX
VV
VV
15Cost
**
**
**
**
**
**
**
AV
AA
A16
Employee
satisfaction
**
**
**
**
**
**
**
**
VV
VV
17Custom
ersatisfaction
**
**
**
**
**
**
**
**
*A
AA
18Leadtime
**
**
**
**
**
**
**
**
**
AA
19Resources
consumption
**
**
**
**
**
**
**
**
**
*V
20Wastegeneration
**
**
**
**
**
**
**
**
**
**
Matrix 1.Structured Self-Interaction Matrix oflean, green practicesand sustainableperformance measures
JABES28,2
130

in the focus group. Here four symbols, V, A, X and O are used to denote the direction of therelationship between criterions (i and j): V – Criterion i will help to achieve criterion j, A –Criterion i will be achieved by criterion j, X – Criterion i and j will help to achieve each otherandO – Criterion i and j are unrelated. The following would explain the use of the symbolsV,A, X and O in SSIM (Matrix 1).
Variable 3 (energy efficiency) helps achieve variable 13 (profitability). Thus, therelationship between variable 3 and 13 is denoted by “V.” Afterward, variable 3 will beachieved by variable 9 (preventive maintenance). Thus, the relationship between variable 3and 9 is denoted by “A”. Then variable 11 (cycle time reduction) and variable 16 (employeesatisfaction) will help to achieve each other. Thus, the relationship between variable 11 and 16is denoted by “X”.
4.3 Initial reachability matrix (IRM)Matrix 2 demonstrate the IRM which was developed through SSIM. The IRM is derivedthrough transforming the SSIM into a binary matrix substitutingV,A,X,O by 1 and 0 as perthe case.
The rules for the substitution of 1s and 0s is as followings.
If the (i, j) entry in the SSIM is V, then the (i, j) entry in the reachability matrix becomes 1and the (j, i) entry becomes 0.
If the (i, j) entry in the SSIM is A, then the (i, j) entry in the reachability matrix becomes0 and the (j, i) entry becomes 1.
If the (i, j) entry in the SSIM is X, then the (i, j) entry in the reachability matrix becomes 1and the (j, i) entry also becomes 1.
If the (i, j) entry in the SSIM is O, then the (i, j) entry in the reachability matrix becomes0 and the (j, i) entry also becomes 0.
i j 1 2 3 4 5 6 7 8 9 10 11 12 13 14 15 16 17 18 19 20
1 1 0 1 1 1 0 0 0 0 0 0 1 1 1 1 1 1 1 1 12 1 1 1 1 1 0 0 0 0 0 0 1 1 1 1 1 1 1 1 13 1 1 1 0 1 0 0 0 0 0 0 1 1 1 1 1 1 1 1 14 0 0 1 1 1 0 0 0 0 0 0 1 1 1 1 1 1 1 1 15 0 0 0 0 1 0 0 0 0 0 0 1 1 1 1 1 1 1 1 16 1 1 1 1 1 1 1 0 0 0 1 1 1 1 1 1 1 1 1 17 1 1 1 1 1 0 1 0 1 0 1 1 1 1 1 1 1 1 1 18 1 1 1 1 1 1 1 1 1 0 1 1 1 1 1 1 1 1 1 19 1 1 1 1 1 1 0 0 1 0 1 1 1 1 1 1 1 1 1 110 1 1 1 1 1 1 1 1 1 1 1 1 1 1 1 1 1 1 1 111 1 1 1 1 1 0 0 0 0 0 1 1 1 1 1 1 1 1 1 112 0 0 0 0 0 0 0 0 0 0 1 1 1 1 1 1 1 1 1 113 0 0 0 0 0 0 0 0 0 0 0 0 1 0 0 0 0 0 0 014 0 0 0 0 0 0 0 0 0 0 0 0 1 1 1 1 1 1 1 115 0 0 0 0 0 0 0 0 0 0 0 0 1 1 1 0 1 0 0 016 0 0 0 0 0 0 0 0 0 0 1 1 1 1 1 1 1 1 1 117 0 0 0 0 0 0 0 0 0 0 0 0 1 0 0 0 1 0 0 018 0 0 0 0 1 0 0 0 0 0 0 0 1 0 1 0 1 1 0 019 0 0 0 0 1 0 0 0 0 0 0 0 1 0 1 0 1 1 1 120 0 0 0 0 1 0 0 0 0 0 0 0 1 0 1 0 1 1 0 1
Matrix 2.Initial Reachability
Matrix (IRM)
Influence oflean–greenpractices
131

The IRM for the SSIM (Matrix 1) is shown in Matrix 2.
4.4 Final reachability matrix (FRM)Matrix 3 exhibit the FRMwhich was derived through IRM. Integrating the transitivity of thefactors in to the IRM, the final reachabilitymatrix is derived. As per the rule of transitivity, if avariable A leads to a variable B and if B leads to another variable C, then A leads to C.Following this rule, the FRM was developed. Then through the FRM the driving power anddependence of each factor were computed. Driving power means the total number of “1” s inthe corresponding rows and dependence is the total number of “1”s in the correspondingcolumns of FRM. Here, the driving power of a particular variable is the total number ofvariables (including itself) which it may help to achieve other variables. The dependence isthe total number of variables which may help in achieving it.
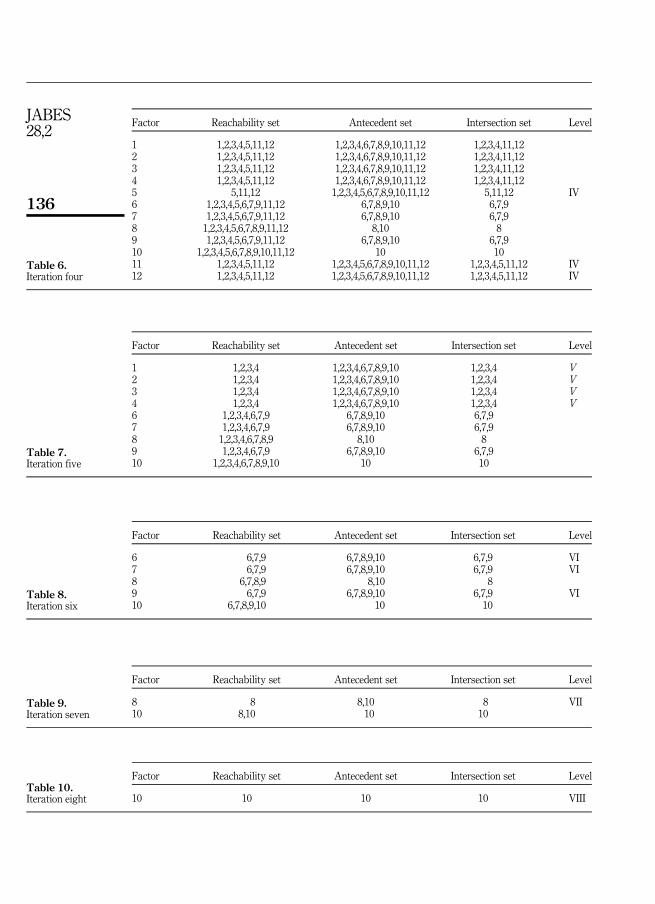
4.5 Level partitionTables 3–10 demonstrate the reachability set, antecedent set, intersection set and levelpartition of the 20 factors (lean, green practices and sustainable performance measures)which are used to develop the ISM model. As the tables demonstrate, these 20 factors situatein eight levels. Here the reachability and antecedents set of each factor were developedthrough the FRM. The process of level partition will help to categorize the equally valuedelements/factors of prospects.
The reachability set consists of the element itself and other elements, which it mayachieve, whereas the antecedent set consists of the element itself and the other elements,which help in achieving it. The elements which are common in reachability sets andantecedent sets are assigned at the intersection set. The reachability sets, the intersection setsand antecedent sets help to pinpoint the level of each element/factor. Within a particular
i,j 1 2 3 4 5 6 7 8 9 10 11 12 13 14 15 16 17 18 19 20Drivingpower
1 1 1 1 1 1 0 0 0 0 0 1 1 1 1 1 1 1 1 1 1 152 1 1 1 1 1 0 0 0 0 0 1 1 1 1 1 1 1 1 1 1 153 1 1 1 1 1 0 0 0 0 0 1 1 1 1 1 1 1 1 1 1 154 1 1 1 1 1 0 0 0 0 0 1 1 1 1 1 1 1 1 1 1 155 0 0 0 0 1 0 0 0 0 0 1 1 1 1 1 1 1 1 1 1 116 1 1 1 1 1 1 1 0 1 0 1 1 1 1 1 1 1 1 1 1 187 1 1 1 1 1 1 1 0 1 0 1 1 1 1 1 1 1 1 1 1 188 1 1 1 1 1 1 1 1 1 0 1 1 1 1 1 1 1 1 1 1 199 1 1 1 1 1 1 1 0 1 0 1 1 1 1 1 1 1 1 1 1 1810 1 1 1 1 1 1 1 1 1 1 1 1 1 1 1 1 1 1 1 1 2011 1 1 1 1 1 0 0 0 0 0 1 1 1 1 1 1 1 1 1 1 1512 1 1 1 1 1 0 0 0 0 0 1 1 1 1 1 1 1 1 1 1 1513 0 0 0 0 0 0 0 0 0 0 0 0 1 0 0 0 0 0 0 0 0114 0 0 0 0 1 0 0 0 0 0 1 1 1 1 1 1 1 1 1 1 1115 0 0 0 0 0 0 0 0 0 0 0 0 1 1 1 1 1 1 1 1 0816 1 1 1 1 1 0 0 0 0 0 1 1 1 1 1 1 1 1 1 1 1517 0 0 0 0 0 0 0 0 0 0 0 0 1 0 0 0 1 0 0 0 0218 0 0 0 0 1 0 0 0 0 0 0 1 1 1 1 1 1 1 1 1 1019 0 0 0 0 1 0 0 0 0 0 0 1 1 1 1 1 1 1 1 1 1020 0 0 0 0 1 0 0 0 0 0 0 1 1 1 1 1 1 1 1 1 10DependencePower
12 12 12 12 17 05 05 02 05 01 14 17 20 18 18 18 19 18 18 18P
5 261Matrix 3.Final ReachabilityMatrix
JABES28,2
132

Factor
Reachabilityset
Antecedentset
Intersection
set
Level
11,2,3,4,5,11,12,13,14,15,16,17,18,19,20
1,2,3,4,6,7,8,9,10,11,12,16
1,2,3,4,11,12,16
21,2,3,4,5,11,12,13,14,15,16,17,18,19,20
1,2,3,4,6,7,8,9,10,11,12,16
1,2,3,4,11,12,16
31,2,3,4,5,11,12,13,14,15,16,17,18,19,20
1,2,3,4,6,7,8,9,10,11,12,16
1,2,3,4,11,12,16
41,2,3,4,5,11,12,13,14,15,16,17,18,19,20
1,2,3,4,6,7,8,9,10,11,12,16
1,2,3,4,11,12,16
55,11,12,13,14,15,16,17,18,19,20
1,2,3,4,5,6,7,8,9,10,11,12,14,16,18,19,20
5,11,12,14,16,18,19,20
61,2,3,4,5,6,7,9,11,12,13,14,15,16,17,18,19,20
6,7,8,9,10
6,7,9
71,2,3,4,5,6,7,9,11,12,13,14,15,16,17,18,19,20
6,7,8,9,10
6,7,9
81,2,3,4,5,6,7,8,9,11,12,13,14,15,16,17,18,19,20
8,10
89
1,2,3,4,5,6,7,9,11,12,13,14,15,16,17,18,19,20
6,7,8,9,10
6,7,9
101,2,3,4,5,6,7,8,9,10,11,12,13,14,15,16,17,18,19,20
1010
111,2,3,4,5,11,12,13,14,15,16,17,18,19,20
1,2,3,4,5,6,7,8,9,10,11,12,14,16
1,2,3,4,5,11,12,14,16
121,2,3,4,5,11,12,13,14,15,16,17,18,19,20
1,2,3,4,5,6,7,8,9,10,11,12,14,16,18,19,20
1,2,3,4,5,11,12,14,16,18,19,20
1313
1,2,3,4,5,6,7,8,9,10,11,12,13,14,15,16,17,18,19,20
13I
145,11,12,13,14,15,16,17,18,19,20
1,2,3,4,5,6,7,8,9,10,11,12,14,15,16,18,19,20
5,11,12,14,15,16,18,19,20
1513,14,15,16,17,18,19,20
1,2,3,4,5,6,7,8,9,10,11,12,14,15,16,18,19,20
14,15,16,18,19,20
161,2,3,4,5,11,12,13,14,15,16,17,18,19,20
1,2,3,4,5,6,7,8,9,10,11,12,14,15,16,18,19,20
1,2,3,4,5,11,12,14,15,16,18,19,20
1713,17
1,2,3,4,5,6,7,8,9,10,11,12,14,15,16,17,18,19,20
1718
5,12,13,14,15,16,17,18,19,20
1,2,3,4,5,6,7,8,9,10,11,12,14,15,16,18,19,20
5,12,14,15,16,18,19,20
195,12,13,14,15,16,17,18,19,20
1,2,3,4,5,6,7,8,9,10,11,12,14,15,16,18,19,20
5,12,14,15,16,18,19,20
205,12,13,14,15,16,17,18,19,20
1,2,3,4,5,6,7,8,9,10,11,12,14,15,16,18,19,20
5,12,14,15,16,18,19,20
Table 3.Iteration one
Influence oflean–greenpractices
133

Factor
Reachabilityset
Antecedentset
Intersection
set
Level
11,2,3,4,5,11,12,14,15,16,17,18,19,20
1,2,3,4,6,7,8,9,10,11,12,16
1,2,3,4,11,12,16
21,2,3,4,5,11,12,14,15,16,17,18,19,20
1,2,3,4,6,7,8,9,10,11,12,16
1,2,3,4,11,12,16
31,2,3,4,5,11,12,14,15,16,17,18,19,20
1,2,3,4,6,7,8,9,10,11,12,16
1,2,3,4,11,12,16
41,2,3,4,5,11,12,14,15,16,17,18,19,20
1,2,3,4,6,7,8,9,10,11,12,16
1,2,3,4,11,12,16
55,11,12,14,15,16,17,18,19,20
1,2,3,4,5,6,7,8,9,10,11,12,14,16,18,19,20
5,11,12,14,16,18,19,20
61,2,3,4,5,6,7,9,11,12,14,15,16,17,18,19,20
6,7,8,9,10
6,7,9
71,2,3,4,5,6,7,9,11,12,14,15,16,17,18,19,20
6,7,8,9,10
6,7,9
81,2,3,4,5,6,7,8,9,11,12,14,15,16,17,18,19,20
8,10
89
1,2,3,4,5,6,7,9,11,12,14,15,16,17,18,19,20
6,7,8,9,10
6,7,9
101,2,3,4,5,6,7,8,9,10,11,12,14,15,16,17,18,19,20
1010
111,2,3,4,5,11,12,14,15,16,17,18,19,20
1,2,3,4,5,6,7,8,9,10,11,12,14,16
1,2,3,4,5,11,12,14,16
121,2,3,4,5,11,12,14,15,16,17,18,19,20
1,2,3,4,5,6,7,8,9,10,11,12,14,16,18,19,20
1,2,3,4,5,11,12,14,16,18,19,20
145,11,12,14,15,16,17,18,19,20
1,2,3,4,5,6,7,8,9,10,11,12,14,15,16,18,19,20
5,11,12,14,15,16,18,19,20
1514,15,16,17,18,19,20
1,2,3,4,5,6,7,8,9,10,11,12,14,15,16,18,19,20
14,15,16,18,19,20
161,2,3,4,5,11,12,14,15,16,17,18,19,20
1,2,3,4,5,6,7,8,9,10,11,12,14,15,16,18,19,20
1,2,3,4,5,11,12,14,15,16,18,19,20
1717
1,2,3,4,5,6,7,8,9,10,11,12,14,15,16,17,18,19,20
17II
185,12,14,15,16,17,18,19,20
1,2,3,4,5,6,7,8,9,10,11,12,14,15,16,18,19,20
5,12,14,15,16,18,19,20
195,12,14,15,16,17,18,19,20
1,2,3,4,5,6,7,8,9,10,11,12,14,15,16,18,19,20
5,12,14,15,16,18,19,20
205,12,14,15,16,17,18,19,20
1,2,3,4,5,6,7,8,9,10,11,12,14,15,16,18,19,20
5,12,14,15,16,18,19,20
Table 4.Iteration two
JABES28,2
134

Factor
Reachabilityset
Antecedentset
Intersection
set
Level
11,2,3,4,5,11,12,14,15,16,18,19,20
1,2,3,4,6,7,8,9,10,11,12,16
1,2,3,4,11,12,16
21,2,3,4,5,11,12,14,15,16,18,19,20
1,2,3,4,6,7,8,9,10,11,12,16
1,2,3,4,11,12,16
31,2,3,4,5,11,12,14,15,16,18,19,20
1,2,3,4,6,7,8,9,10,11,12,16
1,2,3,4,11,12,16
41,2,3,4,5,11,12,14,15,16,18,19,20
1,2,3,4,6,7,8,9,10,11,12,16
1,2,3,4,11,12,16
55,11,12,14,15,16,18,19,20
1,2,3,4,5,6,7,8,9,10,11,12,14,16,18,19,20
5,11,12,14,16,18,19,20
61,2,3,4,5,6,7,9,11,12,14,15,16,18,19,20
6,7,8,9,10
6,7,9
71,2,3,4,5,6,7,9,11,12,14,15,16,18,19,20
6,7,8,9,10
6,7,9
81,2,3,4,5,6,7,8,9,11,12,14,15,16,18,19,20
8,10
89
1,2,3,4,5,6,7,9,11,12,14,15,16,18,19,20
6,7,8,9,10
6,7,9
101,2,3,4,5,6,7,8,9,10,11,12,14,15,16,18,19,20
1010
111,2,3,4,5,11,12,14,15,16,18,19,20
1,2,3,4,5,6,7,8,9,10,11,12,14,16
1,2,3,4,5,11,12,14,16
121,2,3,4,5,11,12,14,15,16,18,19,20
1,2,3,4,5,6,7,8,9,10,11,12,14,16,18,19,20
1,2,3,4,5,11,12,14,16,18,19,20
145,11,12,14,15,16,18,19,20
1,2,3,4,5,6,7,8,9,10,11,12,14,15,16,18,19,20
5,11,12,14,15,16,18,19,20
III
1514,15,16,18,19,20
1,2,3,4,5,6,7,8,9,10,11,12,14,15,16,18,19,20
14,15,16,18,19,20
III
161,2,3,4,5,11,12,14,15,16,18,19,20
1,2,3,4,5,6,7,8,9,10,11,12,14,15,16,18,19,20
1,2,3,4,5,11,12,14,15,16,18,19,20
III
185,12,14,15,16,18,19,20
1,2,3,4,5,6,7,8,9,10,11,12,14,15,16,18,19,20
5,12,14,15,16,18,19,20
III
195,12,14,15,16,18,19,20
1,2,3,4,5,6,7,8,9,10,11,12,14,15,16,18,19,20
5,12,14,15,16,18,19,20
III
205,12,14,15,16,18,19,20
1,2,3,4,5,6,7,8,9,10,11,12,14,15,16,18,19,20
5,12,14,15,16,18,19,20
III
Table 5.Iteration three
Influence oflean–greenpractices
135
Factor Reachability set Antecedent set Intersection set Level
1 1,2,3,4,5,11,12 1,2,3,4,6,7,8,9,10,11,12 1,2,3,4,11,122 1,2,3,4,5,11,12 1,2,3,4,6,7,8,9,10,11,12 1,2,3,4,11,123 1,2,3,4,5,11,12 1,2,3,4,6,7,8,9,10,11,12 1,2,3,4,11,124 1,2,3,4,5,11,12 1,2,3,4,6,7,8,9,10,11,12 1,2,3,4,11,125 5,11,12 1,2,3,4,5,6,7,8,9,10,11,12 5,11,12 IV6 1,2,3,4,5,6,7,9,11,12 6,7,8,9,10 6,7,97 1,2,3,4,5,6,7,9,11,12 6,7,8,9,10 6,7,98 1,2,3,4,5,6,7,8,9,11,12 8,10 89 1,2,3,4,5,6,7,9,11,12 6,7,8,9,10 6,7,910 1,2,3,4,5,6,7,8,9,10,11,12 10 1011 1,2,3,4,5,11,12 1,2,3,4,5,6,7,8,9,10,11,12 1,2,3,4,5,11,12 IV12 1,2,3,4,5,11,12 1,2,3,4,5,6,7,8,9,10,11,12 1,2,3,4,5,11,12 IV
Factor Reachability set Antecedent set Intersection set Level
1 1,2,3,4 1,2,3,4,6,7,8,9,10 1,2,3,4 V2 1,2,3,4 1,2,3,4,6,7,8,9,10 1,2,3,4 V3 1,2,3,4 1,2,3,4,6,7,8,9,10 1,2,3,4 V4 1,2,3,4 1,2,3,4,6,7,8,9,10 1,2,3,4 V6 1,2,3,4,6,7,9 6,7,8,9,10 6,7,97 1,2,3,4,6,7,9 6,7,8,9,10 6,7,98 1,2,3,4,6,7,8,9 8,10 89 1,2,3,4,6,7,9 6,7,8,9,10 6,7,910 1,2,3,4,6,7,8,9,10 10 10
Factor Reachability set Antecedent set Intersection set Level
6 6,7,9 6,7,8,9,10 6,7,9 VI7 6,7,9 6,7,8,9,10 6,7,9 VI8 6,7,8,9 8,10 89 6,7,9 6,7,8,9,10 6,7,9 VI10 6,7,8,9,10 10 10
Factor Reachability set Antecedent set Intersection set Level
8 8 8,10 8 VII10 8,10 10 10
Factor Reachability set Antecedent set Intersection set Level
10 10 10 10 VIII
Table 6.Iteration four
Table 7.Iteration five
Table 8.Iteration six
Table 9.Iteration seven
Table 10.Iteration eight
JABES28,2
136
iteration, when all the elements of the intersection set and reachability sets of a particularfactor are rare same, then that factor is assigned a level (i.e. level 1). Then in the next iteration(i.e. Level 2), the factors which was assigned a level is removed. This process is repeated tillthe levels of each factor are found. These levels recognized by this procedure are exploited forthe formation of diagraph.
As iteration tables exhibit, profitability (13) was the level one variable and customersatisfaction (17) was the level two variable. Meanwhile, quality (14), cost (15), employeesatisfaction (16), lead time (18), resources consumption (19) andwaste generation (20) situatedin the level three. Then GHG reduction (5), cycle time reduction (11) and inventory level (12)received the fourth level and water consumption reduction (1), material consumptionreduction (2), energy efficiency (3) and water pollution reduction (4) received the fifth level.Further pull production, lot size reduction and preventive maintenance represented the levelsix and continuous improvement represented the level seven. Ultimately employeeinvolvement received the level eight.
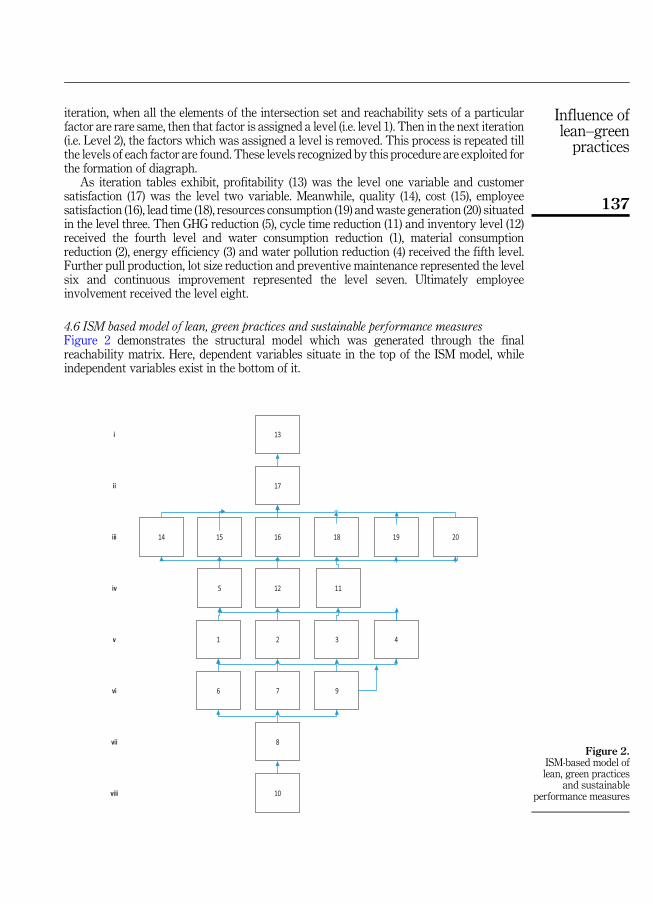
4.6 ISM based model of lean, green practices and sustainable performance measuresFigure 2 demonstrates the structural model which was generated through the finalreachability matrix. Here, dependent variables situate in the top of the ISM model, whileindependent variables exist in the bottom of it.
13
17
16
12
2
7
8
10
1514 18 19 20
115
31 4
96
i
ii
iii
iv
v
vi
vii
viii
Figure 2.ISM-based model oflean, green practices
and sustainableperformance measures
Influence oflean–greenpractices
137

4.7 MICMAC analysisMICMAC principle is based on multiplication properties of matrix. This analysis is done toidentify the key factors that drive the system. Here, based on the driving power anddependence, which is found in the final reachability metrics, a graph is plotted as shown inthe Figure 3, classifying the factors into four clusters as (1) Autonomous, (2) Dependent,(3) Linkage and (4) Independent factors. Autonomous group has low driving power and lowdependence. They can be eliminated from the system. Dependent group has low drivingpower and high dependence. Linkage group has high driving power and high dependence.They are the most important elements. Any action on this will affect the entire system. Then,independent group has high driving power and low dependence.
The followingwould explain theway of plotting each variable under these four categories.e.g. Variable 15 (cost) has been plotted in the dependence category. In this variable the
dependence power is 18 and independence/driving power is eight (Matrix 3). Thus, thecoordinates of the variable are “18,8”. Further borders of the four sections are derived throughdividing the total number of variables (n) by two (n/2). Here the number of variables is 20, thusthe border is built in coordinate “10,10” (see Figure 3).
5. ConclusionThe primary objective of the studywas to develop a structural model of the green, lean practicesand sustainable performancemeasureswith reference tobusiness organizations inSri Lanka. Forachieving this research objective, at first the researcherwanted to select the dominant green, leanpractices and sustainable performancemeasures used by the Sri Lankan business organizations.
Water consumption reduction, material consumption reduction, energy efficiency, waterpollution reduction andGHG reductionwere identified as the dominant green practices, while
10
20 8
19 9 6
18 7
17
16 2 1 11 12 16
15 4 3
14
13
12 5 14
11
10
9 15
8
7
6
5
4
3 17
2 20 19
1 18 13
0
1 2 3 4 5 6 7 8 9 10
11
12
13
14
15
16
17
18
19
20
Dri
vin
g P
ow
er
i Autonomous ii -Dependence
iv- Independent
iii- linkage
Dependence Power
Figure 3.MICMAC analysis
JABES28,2
138

pull production, lot size reduction, continuous improvement, preventive maintenance,employee involvement and cycle time reduction were the dominant lean practices. Theninventory level, profitability, quality, cost, employee satisfaction, customer satisfaction, leadtime, resources consumption (material, water, energy) and waste generation were determinedas the dominant sustainable performance measures.
Subsequently the researcher determined the interrelationships among these dominantfactors base on the opinions of the experts. Finally, the researcher categorized the lean, greenpractices and sustainable performance measures in to four categories of autonomous,dependent, linkage and independent variables through the MICMAC analysis. Hereprofitability, cost, customer satisfaction, lead time, resources consumption (material, water,energy) and waste generation situates in the dependent category. Meanwhile independentcategory represents the pull production/flow, lot size reduction, continuous improvement,preventive maintenance and employee involvement. Then water consumption reduction,material consumption reduction, energy efficiency, water pollution reduction, GHG reduction,cycle time reduction, inventory level, quality and employee satisfaction are in the linkagecategory. Based on this categorization it can be concluded that sustainable performancemeasures: profitability, cost, customer satisfaction, lead time, resources consumption (material,water, energy) and waste generation depend on the lean practices: pull production/flow, lot sizereduction, continuous improvement, preventive maintenance and employee involvement.
Further the resulting ISM model (Figure 2) consisted of eight levels. As the ISMmethodology emphasizes, factors that represent the bottom of the model are rich in drivingpower and top of themodel consist of factorswhich are rich in dependence power. As Figure 1demonstrates, lean practices situate in the bottom of the model, while green practices stand inthe middle section of the model and sustainable performance measures exist in the top of themodel. So, through this ISM model it can be clearly concluded that lean practices influencegreen practices and green practices affect sustainable performance measures. Further it canbe concluded that green practices play as the moderating factors and lean practices as theindependent factors of the ISM model.
5.1 ImplicationsThe organizations who desire to improve the sustainable performance are suggested to initiatewith lean, and subsequentlymove in to green. Also, it is suggested to handle both lean and greenpractices through one functional unit. Here the initial efforts should concern the leanimprovement and subsequent effort should focus the green improvements. Then organizationscan reduce their overlapping efforts and cost of separately implementation of lean and green.Further this model will help to practitioners to identify the link between lean, green andperformance measure, in lean and green implementation through the same functional unit.
5.2 Future research directionsThe research contributed to the existing knowledge through developing an ISM-basedstructural model that explain the interactions among lean paradigm, green paradigm andsustainable performance measures. The research used expert opinions only, in building thisstructural model and it was not tested empirically. Thus, the research opens an opportunityfor future research studies to empirically test this model, through a quantitative study usingthe analytical methods like structural equation modeling.
References
Azevedo, S.G., Carvalho, H. and Cruz-Machado, V. (2016), “LARG index: a benchmarking tool forimproving the leanness, agility, resilience and greenness of the automotive supply chain”,Benchmark, Vol. 23 No. 6, pp. 1472-1499.
Influence oflean–greenpractices
139

Banerjee, S. (2002), “Corporate environmentalism: the construct and its measurement”, Journal ofBusiness Research, Vol. 55 No. 3, pp. 177-191.
Bergmiller, G.G. and McCright, P.R. (2009), “Parallel models for Lean and green operations”, paperpresented at the Industrial Engineering Research Conference, 2009, Miami, FL, p. 30, May-3 June,available at: https://pdfs.semanticscholar.org/0a67/c7f0f6d60ba0506e037aaf17cfe8b3a89e7d.pdf(accessed 10 February 2019).
Bhasin, S. (2015), Lean Management Beyond Manufacturing, A Holistic Approach, SpringerInternational Publishing, Switzerland.
Brundtland, G. (1987), Report of the World Commission on Environment and Development: OurCommon Future, United Nations General Assembly document A/42/427, United Nations.
Cabral, I., Grilo, A. and Cruz-Machado, V. (2012), “A decision-making model for Lean, Agile, Resilientand Green supply chain management”, International Journal of Production Research, Vol. 50No. 17, pp. 4830-4845.
Carmines, E.G. and Zeller, R.A. (1979), Reliability and Validity Assessment, Sage University Paper Serieson Quantitative Applications in the Social Sciences, Sage Publications, Newbury Park, pp. 7-17.
Creswell, J.W. (2014), Research Design: Qualitative, Quantitative, and Mixed Methods Approaches, 4thed., SAGE Publications, Thousand Oaks, California.
David, F.R. (2011), Strategic Management: Concepts and Cases, Global ed., 13th ed., Pearson Education,Upper Saddle River.
D€ues, C., Tan, K. and Lim, M. (2013), “Green as the new Lean: how to use Lean practices as a catalystto greening your supply chain”, Journal of Cleaner Production, Vol. 40, pp. 93-100.
Elkington, J. (1998), Cannibals with Forks: The Triple Bottom Line of 21st Century Business, NewSociety Publishers, Gabriola Island, Stony Creek.
Enquist, B., Edvardsson,B. andSebhatu, S.P. (2007), “Values-based service quality for sustainable business,managing service quality”, Journal of Service Theory and Practice, Vol. 17 No. 4, pp. 385-403.
Farias, L.M.S., Santos, L.S., Gohr, C.F. and Rocha, L.O. (2019), “An ANP-based approach for lean andgreen performance assessment”, Resources, Conservation and Recycling, Vol. 143, pp. 77-89.
Galeazzo, A., Furlan, A. and Vinelli, A. (2014), “Lean and green in action: interdependencies andperformance of pollution prevention projects”, Journal of Cleaner Production, Vol. 85, pp. 191-200.
Galeazzo, A., Furlan, A. and Vinelli, A. (2014), “Understanding environmental-operations integration:the case of pollution prevention projects”, International Journal of Production Economics,Vol. 153 No. c, pp. 149-160.
Garza-Reyes, J.A. (2015), “Lean and green: a systematic review of the state-of-the-art literature”,Journal of Cleaner Production, Vol. 102, pp. 18-29.
Global Reporting Initiative (2017), available at: https://www.globalreporting.org/standards/gri-standards-download-center (accessed 30 May 2019).
Govindan, K., Azevedo, S.G., Carvalho, H. and Cruz-Machado, V. (2015), “Lean, green and resilientpractices influence on supply chain performance: interpretive structural modeling approach”,International Journal of Environmental Science and Technology, Vol. 12 No. 1, pp. 5-34.
Hallam, C. and Contreras, C. (2016), “Integrating lean and green management”, Management Decision,Vol. 54 No. 9, pp. 2157-2187.
Hartini, S. and Ciptomulyono, U. (2015), “The relationship between lean and sustainablemanufacturing on performance: literature review”, Procedia Manufacturing, Vol. 4, pp. 38-45.
Henao, R., Sarache, W. and G�omez, I. (2019), “Lean manufacturing and sustainable performance:trends and future challenges”, Journal of Cleaner Production, Vol. 208, pp. 99-116.
Jurado, M., Jos�e, P. and Fuentes, J.M. (2014), “Lean management, supply chain management andsustainability: a literature review”, Journal of Cleaner Production, Vol. 85, pp. 134-150.
Kaplan, R.S. and Norton, D.P. (1996), The Balanced Scorecard: Translating Strategy into Action, Firsted., Harvard Business School Press, Boston.
JABES28,2
140

Khalili, A., Ismail, M.Y., Karim, A.N.M. and Daud, M.R.C. (2016), “relationships of lean, greenmanufacturing and sustainable performance: assessing the applicability of the proposedmodel”, paper presented at, International Conference on Industrial Engineering and OperationsManagement, 2016, Kuala Lumpur, Malaysia, 8-10 March, available at: http://ieomsociety.org/ieom_2016/pdfs/179.pdf (accessed 12 May 2019).
Kovilage, M.P. (2018), “Influence of lean and green paradigms on supply chain performance: aninterpretive structural modelling approach”, Paper presented at, International Conferenceon Multidisciplinary Researches, 2018, Maldives National University, Maldives, August,pp. 12-13.
Krajnc, D. and Glavic, P. (2005), “A model for integrated assessment of sustainable development”,Resources, Conservation and Recycling, Vol. 43, pp. 189-208.
Lee, K.H. and Saen, R.F. (2011), “Measuring corporate sustainability management: a dataenvelopment analysis approach”, International Journal of Production Economics, Vol. 140No. 1, pp. 219-226.
Loknath, B. and Azeem, A. (2017), “Green management –concept and strategies”, Paper Presented at,National Conference on Marketing and Sustainable Development, 2017, Rajampet, AndhraPradesh, 13-14 Octomber, available at: https://www.researchgate.net/publication/330089504_Green_Management-Concept_and_Strategies (accessed 12 May 2019).
M€oller, A. and Schaltegger, S. (2005), “The sustainability balanced scorecard as a framework for eco-efficiency analysis”, Journal of Industrial Ecology, Vol. 9 No. 4, pp. 73-83.
Morin, E.M. (1995), “Organizational effectiveness and the meaning of work”, in Pauchant, T.C. et al.(Ed.), Search of Meaning. Managing for the Health of Our Organizatons, Our Communities, andthe Natural World, Jossey-Bass, San Francisco, pp. 29-64.
Peng, Y. and Lin, S. (2008), “Local responsiveness pressure, subsidiary resources, green managementadoption, and subsidiaries performance: evidence from Taiwanese manufacturers”, Journal ofBusiness Ethics, Vol. 79 Nos 1-2, pp. 199-212.
Sebhatu, S.P. (2008), “Sustainability performance measurement for sustainable organizations: beyondcompliance and reporting”, 11th Quality Management and Organizational Development- QMODConference, 2008, Attaining Sustainability from Organizational Excellence to SustainableExcellence, Helsingborg, Sweden, 20-22 August, available at: http://www.ep.liu.se/ecp/033/005/ecp0803305.pdf (accessed 12 May 2019).
Thanki, S.J. and Thakkar, J.J. (2016), “Value-value load diagram: a graphical tool for lean-greenperformance assessment”, Production Planning and Control, Vol. 27, pp. 1280-1297.
Verrier, B., Rose, B., Caillaud, E. and Remita, H. (2014), “Combining organizational performance withsustainable development issues: the lean and green project benchmarking Repository”, Journalof Cleaner Production, Vol. 85, pp. 83-93.
Voss, C., Tsikriktsis, N. and Frohlich, M. (2002), “Case research in operations management”,International Journal of Operations and Production Management, Vol. 22 No. 2, pp. 95-219.
Warfield, J.N. (1974), “Towards Interpretation of complex structural models. IEEE transactions”,System, Man and Cybernetics- SMC, Vol. 4 No. 5, pp. 405-417.
Wiese, A., Luke, R., Heyns, G.J. and Pisa, N.M. (2015), “The integration of lean, green and best practicebusiness principles”, Journal of Transport and Supply Chain Management, Vol. 9 No. 1, pp. 192-202.
Womack, J.P. and Jones, D.T. (1994), “From lean production to the lean enterprise”, Harvard BusinessReview, March-April, pp. 93-103.
Womack, J.P. and Jones, D.T. (1996), Lean Thinking: Banish Waste and Create Wealth in YourCorporation, Simon and Schuster, New York.
Wu, L., Subramanian, N., Abdulrahman, M.D., Liu, C., Lai, K. and Pawar, K.S. (2015), “The impact ofintegrated practices of lean, green, and social management systems on firm sustainabilityperformance-evidence from Chinese fashion auto-parts suppliers”, Sustainability, Vol. 7 No. 4,pp. 3838-3858.
Influence oflean–greenpractices
141

Further reading
Figge, F., Hahn, T., Schaltegger, S. and Wagner, M. (2002), “The sustainability balanced scorecard –theory and application of a tool for value-based sustainability management”, Paper presented at,The Greening of Industry Network Conference, 2002, Gothenburg, 23-26 June, available at: https://www.academia.edu/553663/The_Sustainability_Balanced_Scorecard_Theory_and_Application_of_a_Tool_for_Value-Based_Sustainability_Management (accessed 11 June 2019).
Fleisher, C.S. (2003), “Managing the grassroots and assessing its performance”, Journal of PublicAffairs, Vol. 3 No. 4, pp. 371-382.
Corresponding authorManori Pathmalatha Kovilage can be contacted at: [email protected]
For instructions on how to order reprints of this article, please visit our website:www.emeraldgrouppublishing.com/licensing/reprints.htmOr contact us for further details: [email protected]
JABES28,2
142