industrial foundations as long-term owners
TRANSCRIPT

Electronic copy available at: https://ssrn.com/abstract=2725462
1
INDUSTRIAL FOUNDATIONS AS LONG-TERM OWNERS
Christa Børsting, Johan Kuhn, Thomas Poulsen,1 and Steen Thomsen
Copenhagen Business School, Department of International Economics and Management,
Center for Corporate Governance.
ABSTRACT
Manuscript Type: Empirical
Research Question/Issue: Does foundation ownership lead to long-term corporate
governance and business behaviour in foundation-owned companies?
Research Findings/Insights: Short-termism has become a serious concern for corporate
governance, and this has inspired a search for institutional arrangements to promote long-
term decision-making. In this paper, we call attention to long-term ownership by industrial
foundations, which is common in Northern Europe but little known in the rest of the world.
We use a unique Danish data set to document that industrial foundations are long-term
owners that practice long-term governance. We show that foundation ownership is highly
stable compared to other ownership structures. Foundation-owned companies replace
managers less frequently. They have conservative capital structures with low financial
leverage. They score higher on an index of long-termism in finance, investment, and
employment. They survive longer. Overall, our paper supports the hypothesis that corporate
time horizons are influenced by ownership structures and particularly that industrial
foundations possess characteristics that promote long-termism. Policymakers, business
owners and managers interested in promoting long-term governance models should therefore
reconsider the role of ownership structure.
Theoretical/Academic Implications: This paper supports the hypothesis that time horizons
are influenced by ownership commitment and particularly that industrial foundations promote
long-termism.
Practitioner/Policy Implications: Policymakers interested in promoting long-termism
should encourage long-term ownership, for example by industrial foundations. Practitioners
should consider the importance of ownership commitment in ensuring long-term corporate
governance.
Keywords: Corporate governance, industrial foundations, long-termism.
1 Corresponding author. Email: [email protected]. Phone: +45 38153458. Address: Porcelaenshaven 24, 2000
Frederiksberg, Denmark.
Electronic copy available at: https://ssrn.com/abstract=2725462
2
INTRODUCTION
Concerns about short-termism have been mounting in recent years (Phelps, 2010; Bair, 2011;
Roe, 2013; Mayer, 2013; McKinsey, 2015) and have influenced the proposed EU shareholder
directive (European Council, 2016), the US presidential debate (Reuters, 2015), and the
French Florange Act (Solomon, 2015). Larry Fink, CEO of Blackrock, the largest investor in
the world, is worried (Fink, 2016). Scholars, politicians, and executives argue that companies
pursue short-run profitability (McKinsey, 2015) at the expense of long-run investments
(Sampson and Shi, 2016) and sustainability (Stiglitz, 2016). The perceived trends are blamed
on corporate governance related issues like incentive pay (Bolton, Scheinkman, and Xiong,
2006; Bhagat and Bolton, 2014; Ladika and Sautner, 2014), quarterly reports (Kim, Su, and
Zhu, 2016), share analysts (Desjardine, 2015), takeover threats (Stein, 1988, 1989; Asker et
al., 2011, 2015; Wang, Zhao, and He, 2015), managerial turnover (Kaplan and Minton,
2012), or speculative stock market fluctuations (Cremers, Pareek, and Sautner, 2013). Several
remedies have been suggested including loyalty shares (extra voting rights or dividends for
long-term shareholders; Johnson, 2015; Solomon 2015), abolishing quarterly reports and
earnings guidance (Kay, 2012), bonus caps (the EU Capital Requirements Directive), or
limiting hostile takeovers (Milliband, 2012).
In this paper, we focus on the pivotal role of long-term ownership as a remedy
to short-termism. Previous research has pointed to long time horizons in family businesses
(Chua, Chrisman, and Bergiel, 2009; Asker et al., 2011, 2015; Kachaner, Stalk, and Bloch,
2012; Kappes and Schmid, 2013) and short time horizons in companies owned by transient
financial investors (Bushee, 1998; Croce, Stewart, and Yermo, 2011; Thanassoulis and
Somekh, 2016; Zhang and Gimeno, 2016). Following Mayer (2013), we argue that
committed long-term shareholders have the power and the incentives to take into account the
long-run effects of their behaviour, including their choice of governance structures, because
Electronic copy available at: https://ssrn.com/abstract=2725462
3
they are more likely to be around to face the consequences of their decisions. Thus, if we can
fix ownership structure, we may be able to fix (part of) the problem of short-termism.
Building on previous work by Schelling (1960, 1985), Kreps (1990), and Mayer
(2013), we propose that a credible long-term ownership commitment enables companies to
avoid the performance loss due to short-termism and to engage in mutually beneficial implicit
contracts with stakeholders (see also Uhlaner, Floren, and Geerling, 2007; Cremers,
Masconale, and Sepe, 2016). Companies and their stakeholders may benefit from a
commitment not to breach such implicit contracts, even when doing so would maximize
profits ex post. For example, employees are more likely to be loyal if they trust that they will
be rewarded by stable employment, even if the company could increase its immediate
profitability by laying-off employees (Kreps, 1990).
We test these ideas on corporate ownership by “industrial foundations”, which
are independent non-profit institutions, whose most important goal is the preservation of a
business company (Thomsen, 2017). Our research question is whether foundation ownership
leads to long-term corporate governance of foundation-owned companies. We argue that
industrial foundations are, by design, long-term owners, even compared to family ownership,
because their charters oblige them to long-run ownership and company survival. Thus, they
provide an ideal setting in which to study the impact of long-term ownership. Moreover, as
we argue below, long-term ownership commitments are particularly credible in the case of
foundation ownership, where the personal profit motive is eliminated or at least curtailed
(Hansmann, 1980).
We use a unique Danish data set to test whether foundation ownership is
associated with long-term governance indicators like ownership and management, capital
structure, and investments, employment, and corporate survival. Foundation ownership is
4
observed around the world in companies like Bosch (Germany), Bertelsmann (Germany),
Hershey (US), Tata (India), or Rolex (Switzerland), but it is most common in Northern
Europe and particularly in Denmark, which makes it feasible to do statistical studies on
Danish data. Foundation-owned firms account for about 70 percent of the Danish stock
market capitalization, 50 percent of R&D, 10 percent of the value added, and 5 percent of
employment (Thomsen, 2017).
The paper fills a gap in the sparse research literature on industrial foundations,
which has hitherto focused mainly on the consequences of foundation ownership for financial
performance (Thomsen, 1996, 1999; Hermann and Franke, 2002; Thomsen and Rose, 2004;
Dzansi, 2012). At the same time, we contribute to the growing literature on long-termism and
short-termism in corporate governance. Using data on a uniquely long-term ownership type,
we provide new evidence of the impact of ownership on corporate time horizons. Our study is
important because a growing body of academic research has shown that increasingly short
time horizons among corporations and investors have led companies to focus excessively on
current earnings and underinvest in the future to the detriment of shareholders and society at
large (Sampson and Shi, 2016; Souder, Reilly, Bromiley, and Mitchell, 2016; Reilly, Souder,
and Ranucci, 2016). It is therefore important to find remedies for short-termism.
We show that industrial foundations are, in fact, highly stable owners compared
to other owner types. Moreover, as expected, foundation-owned companies are characterized
by long-term governance, including stable management, low financial leverage, long-run
investments, and higher survival rates. Overall, we find that foundation-owned companies are
more long-term than firms with other ownership structures.
The rest of the paper is organized as follows. In the next section, we provide a
theoretical discussion and develop our hypotheses. In subsequent sections, we provide a
5
description of our sample and variables, discuss the empirical results, and highlight the
conclusions and implications of our study.
THEORETICAL DISCUSSION AND HYPOTHESIS DEVELOPMENT
Long-termism and short-termism can be conceived as extremes on a continuous scale,
temporal orientation, which measures “the relative cognitive dominance of the near versus
distant future” (Das, 1987: 203; Reilly et al., 2016). The concept was originally developed to
measure variation in the future orientation of individuals and subsequently applied to the firm
level (Marginson and McAulay, 2008; Souder and Bromiley, 2012; Reilly et al., 2016). The
idea is that temporal orientation influences the (subjective) weight that corporate decision-
makers attach to present and future time periods. In allocating effort, capital, or other
resources over time, the discount factor, 1/(1+d)t, measures the relative weight attached to
future outcomes (at time t). Intuitively, the higher the discount rate, d, the less weight or
importance corporate decision makers attach to future outcomes and the shorter their time
horizons. “Firms that routinely select short horizon projects can be described as having a
short investment horizon and vice versa for firms that routinely select longer horizon project
alternatives” (Reilly et al., 2016: 1173).
Short-termism can be defined by high subjective discount rates that lead
managers to forego good long-term opportunities (Marginson and McAulay, 2008; Reilly et
al., 2016), i.e. discount rates that exceed the costs of capital and therefore, when applied to
corporate decision-making, lead to sub-optimal value creation from the viewpoint of outside
investors (Sauder et al., 2016). Empirical evidence indicates that US managers, on average,
use discount rates of around double the weighted average costs of capital (Poterba and
Summers, 1995; Jagannathan, Matsa, Meier, and Tarhan, 2014), which implies that their

6
companies would be financially better off with longer time horizons (Souder et al., 2016). In
contrast, long-termism may be defined as decision-making by means of discount rates that are
closer to the market-determined cost of capital. In principle, discount rates could be set below
the costs of capital, which would lead to overinvestment and sub-optimal value creation
(Levinthal and March, 1993), but such excessive long-termism can be regarded as a self-
contradiction, since it compromises the long-term financial viability of a company.
We identify two theoretically distinct distortions that interact to produce
inefficient short-termism.
First, short-termism may arise as a consequence of information asymmetries
between rational and self-interested agents. This is the case in the models developed by Stein
(1988, 1989), where fear of a takeover induces managers to cut down on unobservable
investments in order to increase short-term profits. The same applies to the “limits to
arbitrage” model of Shleifer and Vishny (1990), who argue that higher costs of arbitrage in
long-term goods lead managers to underinvest in them. An excessive focus on short-term
results may also be caused by career motives (Thakor, 1990), short-term bonus systems (Hill
et al., 1992), stock options compensation (Souder and Shaver, 2010; Ladika and Sautner,
2014), residual pay (Thanassoulis, 2013), debt pressure (Desyllas and Hughes, 2010), or high
management turnover (Palley, 1997; Kaplan and Minton, 2012).
Second, behavioural biases may lead individuals or organizations to focus
irrationally on short-term outcomes (Thaler, 1981; Thaler, Tversky, Kahneman, and
Schwartz, 1997; Souder et al., 2016). For example, Thaler (1981) observed implied discount
rates of 25 percent and up to 100 percent in experimental settings. This is consistent with
behavioural theories of the firm in which companies react to their immediate problems rather
than engage in rational, long-term planning (Cyert and March, 1963; Bromily, 2016). While

7
behavioural biases may reflect cognitive limitations (Levinthal and March, 1993), impatience
(Reuben, Sapienza, and Zingales, 2015), or other traits of human nature (Frederick,
Loewenstein, and O’Donoghue, 2002), they can at least to some extent be managed by self-
control and other mechanisms (Schelling, 1985). The psychologist Walter Mischel famously
asked children to delay eating a marshmallow, for which they were promised two future
marshmallows as a reward for delayed gratification (Mischel and Ebbesen, 1970; Mischel,
Shoda, and Rodriguez, 1989; Mischel and Ayduk, 2004; Mischel, 2014). Some children were
unable to withstand the temptation, but others developed coping strategies that allowed them
to prevail. Mischel discovered that a high level of trust was crucial for their patience, which
connects to the theory of social capital and trust in organizations (Scheling, 1985; Mayer and
Schoorman, 1995; LaPorta et al., 1997; Mayer, 2013; Mischel, 2014).
In this paper, we propose that long-term ownership may act as a commitment
mechanism in the sense of Schelling (1960) to counter short-termism. Similar notions of
ownership commitment have been applied to family business (Uhlaner, Floren, and
Geerlings, 2007), and to voluntary limitations on shareholder rights (Cremers, Masconale,
and Sepe, 2016). While most organizations will claim that they have the best interest of
stakeholders like customers or employees in mind, it is not clear whether the stakeholders can
trust them. In situations like this, Schelling (1960, 1985), Kreps (1990), and Mayer (2013)
argue that companies and their stakeholders may benefit from a credible commitment not to
breach such implicit contracts, even when doing so would maximize profits ex post. For
example, employees are presumably more likely to be loyal if they trust that they will be
rewarded by continuing future employment (Kreps, 1990). We propose that long-term owners
can make such commitments more credibly, since they are more likely to have to face the
future consequences of breaching them. Moreover, we argue below that this long-term
commitment is particularly credible in the case of foundation ownership, where the personal

8
profit motive is eliminated (Hansmann, 1980) – contrary even to family ownership, where
current family consumption needs may dominate the utility derived from considering the
well-being of future generations (Kappes and Schmid, 2013).
Ownership commitment may also be an advantage vis-à-vis competitors, who
will find it less attractive to compete with companies that have an enduring presence and are
willing to invest more. In so-called chicken games (Rapoport and Chammah, 1966),
companies that “burn their bridges” and commit to stay in the industry may scare off
competitors who prefer to avoid intense competition or (in extreme cases) mutual economic
destruction.
Ownership and long-termism
While it may seem from the above that there are many sources of short-
termism, we second Roe (2013: 985) in that the duration of ownership is a key driver: “the
core short-termist concept is that because securities traders hold their stock for such a short
duration, they look for strong corporate results during the period they hold the corporation’s
stock, so that they can sell profitably.” Institutional or behavioural biases may focus the
attention of decision-makers on one part of the time axis (the present) while the rest (the
future) is not taken into account (Slawinski and Bansal, 2012; Bansal and DesJardine, 2014).
Long-term owners, who hold on to their shares, cut across the divided time line; and as such
they have incentives to make decisions and set up governance structures that promote long-
term decision making, including stable management, sustainable debt levels, strategic
persistence, or investments in R&D. We therefore focus on ownership stability as a key
determinant of long-termism.
9
Empirical research has found that volatile ownership by financial investors is
associated with greater short-termism. For example, Bushee (1998) found that short-term
institutional investment was associated with lower R&D expenditure. Zhang and Gimeno
(2016) find that short-term earnings pressures harm competitiveness, but that long-term
shareholders are better able to maintain competitive strategies. Thanassoulis and Somekh
(2016) find that Germanic firms with more stable shareholders have lower cost of equity (i.e.
lower discount rates and thus a longer time horizon) than comparable US companies who
have more short-term shareholders.
Family-owned businesses are generally assumed to have longer time horizons
than investor-owned companies (Chua, Chrisman, and Bergiel, 2009; Reilly et al., 2016), and
in this respect they are sometimes regarded as role models for other companies (Kachaner,
Stalk, and Bloch, 2012). Their long time horizons follow from the concerns for the welfare of
future generations that motivates the present-generation owners to invest in the long term
(James, 1999; Zellweger, 2007). Empirically, Asker et al. (2011, 2015) find that private firms
outperform public firms financially, and they attribute the difference to greater long-termism.
Family businesses are also better able to avoid income-smoothing because they are less
accountable to outside investors (Prencipe, Bar-Yosef, Mazzola, and Pozza, 2011). In
general, their financing, investment, and employment policies tend to be more long-term
(Kappes and Schmid, 2013).1
Foundation ownership and long-termism
Positioning industrial foundations in the “ownership and long-termism”
literature, it seems clear that foundation ownership have more features in common with
family business than with investor ownership. Like family business, foundation ownership
10
involves concentrated ownership, and members of the founding family remain active on the
boards of many industrial foundations. However, some of the defining characteristics of
foundation ownership arguably make it even more long-term than family ownership.
First, a long-term ownership commitment is typically formalized in the
foundation charter, which makes ownership of the company the most important objective for
the foundations in question (Thomsen and Degn, 2014). Secondly, foundation ownership is
not subject to the travails of succession to new generations of the founding family.
Ownership remains with the foundation; it is not an option for new generations to cash in by
selling their shares. Even if a foundation were to sell, its capital investment would in most
cases not revert to the family, but would go to charity. This means that there is less of an
incentive to sell out. Thirdly, foundations are patient owners, since they have no residual
claimants who can demand dividends (Hansmann, 1980). The personal profit motive and the
incentive to maximize short-run profits is consequently absent or at least muted.
Several other factors appear to reinforce long-termism in foundation-owned
companies. For example, a conservative long-term orientation is arguably inherent in the
legal structure of industrial foundations, which, as perpetuities, have an obligation to preserve
their endowment. Unlike companies, foundations cannot (except in bankruptcy) be dissolved
as long as their purpose is still valid. Finally, like family businesses, foundation-owned
companies are relatively immune to short-termism biases imposed by takeover threats (Stein,
1988, 1989). Usually, their shares are not publicly listed, and even when they are, the
foundation, by definition, has a controlling share, which means that it can block a hostile
takeover attempt (Hansmann and Thomsen, 2013).
From a family business point of view, industrial foundations constitute a
commitment mechanism, by which the founding family commits to maintain its ownership
11
share. Alternative commitment mechanisms could be shareholder agreements, dual class
stocks, family holding companies, family councils, and succession planning (Caspar, Dias,
and Elstrodt, 2010). Shareholder agreements can prevent ownership dilution by regulating
voting and divestment of shares (Milston and Cohn 1967; Goergen, Renneboog, and
Khurshed, 2006; Chemla, Habib, and Ljungqvist, 2007). Dual class stocks – recently popular
with US tech companies like Google, Facebook and LinkedIn – make it easier for the family
to retain control (Villalonga and Amit, 2009; Howell, 2017). Family governance through
holding companies, coordination of family interests in family councils, and succession
planning of executive and non-executive directorships can serve the same function (White,
Krinke, and Geller, 2004; Gilding, 2005; Kotlar and De Massis, 2013; Gnan, Montemerlo,
and Huse, 2015; Zellweger and Kammerlander, 2015). Foundation ownership is distinguished
from these mechanisms by being more radical, since it involves an irrevocable transfer of
ownership and wealth to the foundation. It is also worth noting that foundation ownership is
not just used in family businesses but functions as an alternative arrangement when it is
difficult or impractical for the founding family to retain its governance role, for example
when there are no descendants or no descendants who are qualified or willing to take over.
Moreover, not all industrial foundations are established by the founding entrepreneurs.
Foundation ownership may therefore be an alternative to family business or a continuation of
family business depending on whether the founding family retains its governance role.
All told, foundation-owned companies have many features in common with
family businesses, but foundation ownership is distinguished by an additional and irrevocable
commitment to continuation of the company. We therefore propose that foundation-owned
companies will have longer time horizons than family firms, which again have longer time
horizons than investor-owned firms.
12
To be sure, many founding families have an equally strong commitment to the
continuation of the family business, but there are also examples of conflicts among
descendants (Levinson, 1971; Gordon and Nicholson, 2008) whose loyalty to the firm is
weakened over time in ways that may lead to myopic behaviour (Bianco, Bontempi,
Golinelli, and Parigi, 2013). In fact, avoiding such scenarios may have been a motive for
some founders to establish industrial foundations in the first place.
In sum, we propose:
Hypothesis 1. Foundation ownership will be more stable than ownership by
other controlling shareholders.
We regard long-term ownership commitment as pivotal in endowing the company with a
long-run perspective on corporate governance. This includes top management continuity,
capital structure, and long-term investments with the ultimate goal of corporate survival.
Although we examine these variables individually below, it is important to stress that we
regard them as part of a whole, i.e. a bundle of governance characteristics (García-Castro,
Aguilera, and Ariño, 2013) with complementary characteristics (Holstrøm and Milgrom,
1994), cf. Figure 1. We conjecture that the foundation governance bundle will be informed by
the long-term commitment of key decision-makers, starting with the entrepreneur or founder
who established the foundation to preserve the company. Complementarity implies that there
will be some level of consistency between the different parts of the bundle. For example, as
we argue below, foundation-ownership will be associated with both low leverage and high
survival rates, but it is also the case that low leverage has a positive effect on the probability
13
of survival. Likewise, low financial leverage will put less pressure on managers and thereby
increase management continuity. Both low leverage and management continuity will, in turn,
be associated with more long-term investments.
[Please insert Figure 1 here]
Management exits. Given the stability of foundation ownership (H1), we
hypothesize that management will also be more stable, and that we will observe lower
managerial turnover in foundation-owned companies. As patient long-term owners, industrial
foundations are expected to be less concerned with short-term financial results and more with
long-term development of the company. Because of their long time horizons, they also have
an interest in avoiding the short-termism and inefficiency of rapid management changes
(Palley, 1997; Kaplan and Minton, 2012). This is consistent with previous research, which
finds that changes in ownership and board structure tend to be correlated (Denis and Sarin,
1999). For example, management is often replaced after M&A (Martin and McConnell,
1991) and leveraged buyouts (Gong and Wu, 2011). We therefore propose:
Hypothesis 2. Foundation-owned companies will have greater continuity of
management (fewer exits) than other companies.
Equity share. Our hypothesis is that foundation-owned firms will be less
leveraged and have higher equity share ratios. This stems, at least partly, from their long-term
14
ownership commitment and their preference for company survival. Radner (1998), Dutta and
Radner (1999), and Dutta and Sundaram (2001) show that survival maximizing companies
tend to have more conservative capital structures, which lowers their return on investment
compared to profit maximizing firms, but at the same time makes them more resilient to
demand shocks, and therefore more likely to survive. Oprea (2014) recently found support for
these insights in an experimental setting. We therefore regard low leverage (high equity
share) as an indicator of long-termism. It is well understood that firms can raise short-term
profitability by leveraging up but that this increases financial risk; the financial crisis of
2008-9 was widely blamed on this kind of short-termism. Desyllas and Hughes (2010) find
that increasing financial leverage reduces R&D spending. Opler & Titman (1994) find that
financially distressed firms with high leverage lose market shares. Related research on family
business finds that family firms have lower financial leverage and greater risk aversion
(Ampenberger, Schmid, and Achleitner, 2013; Hiebl 2013; Belenzon, Patacconi, and
Zarutskie, 2016). We therefore propose that:
Hypothesis 3. Foundation-owned firms have less financial leverage and higher
equity ratios than other firms.
Long-term business behaviour. Because of their patient long-term ownership,
we also argue that foundation-owned companies are less likely to be concerned with short-
term profits and more likely to make long-term investments. They are also more likely to be
stable, long-term employers (Børsting and Thomsen, 2016). We follow Kappes and Schmid
(2013) in combining a set of accounting variables as indicators of long-termism, including
R&D expenditure, capital expenditure, asset maturity, sales growth, sales per employee, debt

15
maturity, and liquidity. Our hypothesis is that foundation-owned firms have more stable
business behaviour and therefore have higher realizations of these indicators.
While the case for foundation ownership and long-termism appears compelling,
we note that, as with family firms, there are potential counter arguments, which could make
foundation-owned firms less long-term oriented. For example, they are reliant on self-
financing, and unwillingness to dilute ownership by issuing stock on public equity markets
(when possible) could constrain their access to capital. Thus, the time preferences of
foundation-owned companies are contingent of the availability of internal funds. Patient
ownership will typically allow foundation-owned companies to retain earnings for promising
investments. However, beyond the capital invested by the foundation, the costs of outside
capital may be high and in some cases prohibitively high, since the foundations are reluctant
to dilute their ownership (at least below the simple majority threshold) and to risk financial
distress. The undiversified nature of foundation holdings and a higher degree of loss aversion
point in the same direction. However, we assume that foundation- and family-owned
companies will seek to plan their activities, including expansion and investment plans, so as
not to be capital-rationed. We therefore propose:
Hypothesis 4. Foundation-owned firms will display more long-term oriented
business behaviour than other firms.
Survival. We regard company survival as the ultimate measure of successful
long-termism (Collins and Porras, 1997; de Geus, 1997). While there are no previous studies
of foundation-owned companies’ survival, related research tends to find higher survival rates
16
for family businesses (Wilson et al., 2013; Belenzon, Patacconi, and Zarutskie, 2016). We
expect foundation-owned companies to survive longer than investor-owned companies for
several reasons. First, preservation of the company is an objective (explicitly or implicitly) in
most industrial foundations. Secondly, foundations are perpetuities with an obligation to
preserve their capital of which the ownership in the underlying company is a major part
(Thomsen, 2017). Third, an attenuated profit motive implies less strong incentives to sell out
(Hansmann, 1980). Fourth, financial conservatism and stability should generally make
foundation-owned firms more resilient to external shocks (Dutta and Radner, 1999). Fifth,
foundation-owned companies will not to the same extent as family-owned companies be
subject to the disruptions of ownership succession. In sum, we therefore propose that:
Hypothesis 5. Foundation-owned firms will survive longer than other firms.
SAMPLE SELECTION AND VARIABLE DESCRIPTION
Sample selection
The many dimensions of long-termism that we consider in this paper require a
composite sample selection. Our starting point is the Danish Business Authority’s register on
industrial foundations. There are about 1,400 registered industrial foundations in any given
year, and there is not much change in this group. As mentioned above, industrial foundations
have no owners to monitor if the board of directors comply with their fiduciary duties;
instead the Business Authority has a supervisory responsibility and registers all industrial
foundations as a part hereof. Since we are interested in how this particular type of ownership
affects business firms, we delete foundations without business activity outside the foundation,

17
and foundations with charitable and government-linked activities for which business concerns
are secondary. We then use ownership data from a commercial database (Experian) on this
adjusted register to identify the business firms controlled by foundations.2 There are about
1,600 such firms in any given year. We take stock in year 2003 and these firms are the
primary subjects of analysis in this paper. Firm characteristics together with income
statement data and balance sheet data are also obtained from Experian. Once we exclude all
financial firms, and add a firm size criterion of minimum 1 million DKK in total assets
(around 130,000 EUR), we end up with 394 firms owned by industrial foundations. We have
data for each year from 2003 to 2012.
These firms will be compared to other limited liability firms subject to the same
minimum size criterion. There are about 50,000 firms of this kind in our data in any given
year. However, many of the Danish foundation-owned firms are unique, not least in terms of
their size, making such a comparison less than straight forward. The average book value of
total assets of foundation-owned firms are two orders of magnitude higher than the
corresponding value in these other firms, and the average number of employees is much
higher (817) than among non-foundation-owned firms (38). Firm size therefore appears to be
an important and significant difference between the two groups, and in order to get efficient
estimates we have to prevent confounding the effect of foundation ownership with the effect
of firm size. To this end, we identify sub-samples of firms with 100 million DKK or more in
total assets (firms in this sub-sample have 450 employees on average). In our results section,
we report results with both benchmark groups.
Considering the theoretical discussion in the previous section, it seems obvious
to compare foundation-owned firms with the somewhat similar family-owned firms, although
the distinction between the two is not always clear-cut, as firms can have minority family
ownership combined with foundation ownership, in which case we categorize the firm as
18
foundation-owned if the foundation is in the Business Authority’s register on industrial
foundations. A comparison between foundation-owned firms and family-owned firms calls
for a definition of a family firm. We adopt the most inclusive definition and categorize firms
where a family has at least 5 percent ownership as family firms (Villalonga and Amit, 2006;
Anderson and Reeb, 2003). This low threshold is because differences in ownership levels do
not correctly represent the influence a family has in a firm; families have been found to
control firms even with very moderate equity stakes. By this definition, about 40 percent of
the non-foundation-owned firms are family firms.
Variable description
Dependent variables. As outlined in the development of our hypotheses, we
consider a number of dimensions of long-termism in this paper: ownership stability (H1),
firm transition (H1), managerial exits (H2), and equity share (H3); and we adopt the index
developed in Kappes and Schmid (2013) as a general measure of some other dimensions of
long-termism (H4). Table 1 gives an overview of the long-termism variables used in our
analyses, and Table 2 presents the descriptive statistics for the dependent variables as well as
the independent and control variables. Outside the regression framework, we estimate
survival functions for foundation-owned firms and other firms, respectively (H5).
[Please insert Table 1 here]
[Please insert Table 2 here]
19
In our first set of regressions, we examine Ownership stability as measured by
the standard deviation of the largest owner’s ownership stake over the sample period. We use
the ownership stake of the foundation for foundation-owned firms, as this is the controlling
owner according to the Business Authority, and the ownership stake of the largest
shareholder for other firms. A variant of this measure was introduced in Elyasiani and Jia
(2008) with the same motivation as here; namely that “it makes the second moment of the
[…] ownership distribution an important dimension of the ownership influence” (op. cit.:
1771). The ownership stake in itself is weak as a measure of commitment, since (in principle)
it tells us nothing about the intention to stay with the firm. The mean value of the ownership
stability variable is 11.55 for foundation-owned firms and 14.95 for other firms, and the
difference is statistically significant. If the direct subsidiary of an industrial foundation is a
holding company, and the business activity is in a subsidiary to this company, we drop the
holding company and keep its subsidiary (the operating company). In this case, we calculate
the foundation’s ownership stake as the product of ownership stakes along the chain.
The variable Firm transition is a dummy variable equal to 1 if the firm
disappears from our data in a given year and is subsequently registered as closed. De Maere,
Jorissen, and Uhlaner (2014) use a slightly different definition in their study of the
antecedents of bankruptcy. They take as their starting point the formal company status and
then add an activity requirement in order to clean out noisy and misleading observations.
With our approach, we seek to identify a firm transition, which is a broader notion than
bankruptcy, as precisely as possible by first looking at whether or not income statement data
and balance sheet data is submitted, and then subsequently tracking changes in the legal
status of the firm. This is because it can take substantial time before the firm is officially
closed. Instead of only using the information on formal company status, we use the first year
without financial data conditioned on a subsequent change in firm status from active to

20
inactive. Using these criteria, there is a transition from active to inactive in 1.5 percent of the
foundation-owned firms in our sample, and the corresponding number for other firms is 2.8
percent; the difference is statistically significant.
The variable Manager exits is a count variable with information about the
number of executive managers that have left the firm between year t-1 and year t. We do not
know whether a separation is voluntary (manager quits) or forced (manager is fired), which
could be important for the stability of management. There are many small firms in our data,
in particular among the non-foundation-owned firms, and, on average, these firms have fewer
managers and thus also, all else equal, fewer exits. The average number of managers in our
sample is 1.21, and the average number of manager exits is 0.13 for foundation-owned firms
and 0.07 for other firms. The difference is statistically significant and in the wrong direction
compared to hypothesis 2, but this turns out to be attributable to a higher number of managers
in foundation-owned firms.
Theoretically, firm commitment encompasses both the depth of capital
committed and the length of time for which it is committed (Mayer, 2013). Equity share is
simply the ratio between total equity and total assets. The rationale behind this variable is that
a higher equity share corresponds to a deeper capital commitment, meaning that more
activities are financed by the shareholders’ own money rather than being borrowed. Capital
structure theories tend to consider asset characteristics, but our primary focus here is on the
implication of owner characteristics. There are potential explanations for both larger and
smaller equity shares for foundation-owned firms. On the one hand, foundations are legally
obliged to preserve their capital, which in large part consist of stock in the companies they
own. This is essentially a lower boundary on equity. Moreover, their charters often mandate
that they aim for the survival of the companies. As debt increases the probability of default,
this is essentially an upper boundary on debt. These considerations point toward a financial

21
conservatism that aims for a relatively high equity share. On the other hand, debt financing
makes it possible for capital constrained owners to grow without diluting ownership, and the
potential agency problems stemming from not having owners may welcome the discipline
imposed by interest payments (Jensen, 1986). The average equity share is 0.52 in foundation-
owned firms, which is significantly higher than 0.42 in other firms.
Finally, the Long-termism index is the index developed by Kappes and Schmid
(2013). Our adapted index uses the same blueprint but has a few adjustments caused by data
availability. The index is constructed on the basis of nine accounting variables that are
important for long-term orientation.3 It was originally developed for the study of family
firms, which have governance structures that render them particularly apt to develop
capabilities that are durable and competitive over the long term, but – as we have argued –
similar conditions apply to foundation-owned firms. These governance conditions provide
incentives, discretion, resources, and information to implement a long-term orientation (Le
Breton-Miller and Miller, 2006), which influences the value chain and is manifested in the
accounting variables that comprise the index. By construction, the index in bound below by 0
and above by 1, where a higher value corresponds to more long-term orientation. The average
index value is 0.48 for foundation-owned firms and 0.46 in other firms. We follow Kappes
and Schmid (2013) in defining three sub-indices on mission-related investments (the firm’s
mission), people-related investments (knowledge creation and preservation), and external
stakeholder-related investments (long-term associations with stakeholders), respectively.
Independent variable. The independent variable in all our regressions is a
dummy variable for Foundation ownership that takes the value 1 if a company has an owner
that is listed in the Business Authority’s register on controlling industrial foundations and 0
otherwise.

22
Control variables. In the multivariate analyses, we use the same set of control
variables in all specifications. As we have seen, there are non-negligible size-differences
between the different groups of firms, which we have to take into account. We therefore
control for Total assets, the natural logarithm of total assets, and Number of employees, the
natural logarithm of the number of full-time employees. By having both total assets and the
number of employees as firm size approximations, we can take different aspects of size into
consideration when trying to efficiently estimate the effect of foundation ownership. Besides
controlling for the size of the firm, the combination of these two variables captures the labour
intensity of the assets, which is important to include, cf. the discussion of people-related
investments in Kappes and Schmid (2013) and Le Breton-Miller and Miller (2006). We also
control for Performance, the ratio of earnings before interest and taxes over total assets, and
in all but the first specification we even add an extra dimension to this by including Negative
earnings, a dummy variable equal to 1 if EBIT is negative and 0 otherwise. We include
performance information because low performance may, generally, be associated with low
realizations of long-termism (Kappes and Schmid, 2013). Kappes and Schmid (2013) also
find that family firms facing short-term pressures, i.e. negative earnings, tend to maintain
their focus on the long run. We conjecture that this will apply to an even greater extent to
foundation-owned firms. All of the above control variables enter the regressions with their
value lagged one year, and they are winsorized at the 1 percent level.
There are additional controls for some of the dependent variables: When we
analyse ownership stability, we want to control for mean Ownership concentration, and when
we analyse manager exits, we want to control for the Number of managers that potentially
can exit the firm. Finally, we always add industry dummies based on the primary 2-digit
NACE industry in year t as well as year dummies.
23
EMPIRICAL RESULTS
With data across firms and over time, one of the main econometric concerns is that estimates
may be biased by unobserved heterogeneity, rendering the OLS estimator inconsistent.
Estimating with fixed effects (or first differencing) will eliminate such unobserved effects,
but the problem with this solution is that observed, time-invariant variables such as
foundation-ownership drop out. We would lose almost all firms for the statistical analysis, as
only very few firms change their status from foundation-ownership to non-foundation-
ownership (and the other way round). Also, to use the fixed effects estimator, we need
significant within variation to estimate coefficients consistently, i.e. it works best on a
balanced sample with relatively many years in the time dimension, where we have more
reason to believe that the within correlation is significant. If there are many year-to-year
changes in the sample (drawn from the same population), as it is the case here, pooled OLS is
the more efficient estimator. With the pooled OLS estimator, we can also get rid of some of
the concerns about unobserved heterogeneity by clustering the standard errors at the firm
level, something that Petersen (2009) finds to be very effective. In sum, the analyses of
ownership stability, manager exits, and the long-termism index will be by pooled OLS with
standard errors corrected for heteroscedasticity and clustered at the firm level. The analysis of
firm transitions is by logistic regression. Table 3 summarizes our findings.
[Please insert Table 3 here]
Ownership stability. In measuring this variable, we focus on the stability of the
largest owner’s ownership stake, as this person or company typically is the controlling entity.
24
However, it should be acknowledged that in some firms, control is shared among multiple
block holders (e.g. Edmans and Manso, 2011). In foundation-owned firms, the largest
shareholder is an industrial foundation; in family-owned firms it is an individual or group of
individuals, etc. We operationalize stability of ownership by calculating the standard
deviation of the largest owner’s ownership stake over the sample period, which means that
our data collapses to one observation per firm on which we use the OLS estimator to examine
the effect of foundation ownership. We have deliberately abstained from scaling the standard
deviation by the mean ownership stake. The consequence of this is that a variation of say 10
percent results in a higher standard deviation when the ownership stake is lower. We wish to
allow for this since such instability means more for the control or lack hereof when stakes are
smaller. Instead, we include the mean ownership stake as a control variable. Table 4 present
our results.
[Please insert Table 4 here]
Our first observation in Model 1 in Table 4 is that the standard deviation is 3.5
percentage points lower in foundation-owned firms when compared to all other firms,
suggesting more stable ownership in foundation-owned firms. However, variability does not
imply unstable control per se; it is primarily a concern when it results from reductions in
ownership stakes. Further analysis (not reported here) found that non-foundation-owned
firms are more likely to experience reductions in the largest owner’s stake. By implication,
the higher standard deviation in these firms comes from “downside” variability, increasing
uncertainty about the direction of the firm. When we look at the relationship between
ownership stability and the largest shareholder’s ownership stake, it differs between owners

25
owning 100 percent of the firm and owners that have to share control with other owners.
There is a small positive effect of the latter and a large negative effect of the former, which is
unsurprising, since the standard deviation is equal to zero in these instances. Our data also
shows us that firms with only one owner are prone to maintain this structure. Looking at the
model’s other firm characteristics, we see that relatively large and labour-intensive firms
have lower variability. In Model 2, where only firms of similar size in terms of total assets
are included, the negative and statistically significant coefficient estimate of the foundation-
ownership dummy remains, although the standard deviation is only 2.7 percentage points
lower in this case.
As we would expect, firms that are more profitable have more stable ownership
structures. In fact, a non-foundation-owned firm with a one percentage point higher return on
assets has about the same stability as the average foundation-owned firm. However, this
effect is entirely driven by small firms, among which a good result allows for the status quo
to continue but a bad result may threaten the capitalization of the firm and push the existing
ownership to raise new equity or sell of (parts of) the firm. In Model 2, the performance
effect disappears. Family firms are in many ways the closest cousins to foundation-owned
firms, cf. Section 2. Model 3 therefore reduces our sample to those two ownership types in
order to see if the foundation-effect is robust to this change in control group. A statistically
significant point estimate of -2.6 tells us that this is indeed the case.
Firm transition. Firm transitions can be different things of which two of the
most common are either closure following bankruptcy or mergers and acquisitions. The latter
is closely related to the stability of ownership, which decrease in case of M&A. Neither of the
two are conducive for long-termism. Obviously, bankruptcy is a failure to keep the firm
going; in a later subsection, we will look at this in a less dichotomous way by estimating
survival functions. Mergers and acquisitions can be considered a failure of long-termism by
26
way of lack of commitment (to unique firm values worth preserving) that opens up for either
submitting these values to another controlling owner or blending (diluting) them with others
in a more equal and friendly merger (Mayer, 2013). Table 5 presents our results.
[Please insert Table 5 here]
Model 1 in Table 5 provides the first estimates. This table reports results from a
logistic regression, where the independent variable is defined as described in the previous
section. As expected, foundation ownership has a negative and statistically significant effect
on the likelihood of firm transition compared to other firms. This is the result when compared
to all other firms (Model 1) and size-similar firms (Model 2). Among the large firms,
foundation ownership means even more; in fact, the coefficient estimate doubles. This effect
disappears when foundation ownership is compared to family ownership (Model 3).
Comparing Tables 4 and 5 along the family firm dimension, we can say that family firms
have less stable ownership structures compared to foundation-owned firms, but that this does
not translate to a higher likelihood of transition. In all specifications except Model 2, there is
a negative relation between transition and firm size, when approximated by the value of all
the assets, and between transition and firm performance. It is in line with standard empirical
findings that larger firms are less likely to default (e.g. Shumway, 2000), and when it comes
to mergers and acquisitions, it is also more likely that larger firms are the continuing entities,
in which case the firm identification number remains and we do not register a transition.
As we would expect, better performing firms are less likely to either close down
or sell out. This holds for all sub-samples except the large firms, where the coefficient is

27
positive and marginally significant; success makes for attraction. However, for a given size
and profitability, transition likelihood is reduced by foundation ownership. When significant,
firm size, measured by the number of employees, has a positive effect, but – as mentioned –
this effect should be evaluated jointly with total assets, and F-tests show that the joint effect
is negative and significant. Table 5 includes a variable indicating whether last year’s earnings
were negative. This variable is of course related to the performance variable (there is a
negative correlation between the two by construction) but its dichotomous nature allows us to
explicitly assess the response to negative earnings, assuming there is a separate effect of “red
numbers” irrespective of the firm’s cost of capital, which would otherwise rationally serve as
the appropriate demarcation of good and bad performance. This variable is identical to the
loss variable in Kappes and Schmid (2013), where it serves as a proxy for the pressure on a
firm’s bottom line in a given year. Throughout, negative earnings increase the likelihood of
transition. When we examine whether foundation ownership moderates this relationship, we
find that this is not the case.
Manager exits. The dependent variable here is the number of managers that
have left the firm from year t-1 to year t, and the estimator used in the regression is pooled
OLS. There is an observable firm characteristic that is relevant to include in the specifications
for this particular dependent variable; namely the number of managers in the firm. We have
to control for the simple fact that more managers can leave the firm when there are more
managers employed in the firm. We can see in our data that there are more managers, on
average, in foundation-owned firms, so failing to control directly for the number of managers
would bias the estimated effect of foundation ownership. Table 6 presents our results.
[Please insert Table 6 here]
28
In Model 1, there is a negative and statistically significant relationship between
foundation ownership and the number of manager exits. In other words, managers in firms
owned by an industrial foundation are less likely to leave their firms. This is the result in all
three specifications. In Model 3, where the control group is family firms, the foundation
effect is still negative but less when compared to other firms with different owner
characteristics; in fact, it is less than half. This again underlines the similarities between
foundation-owned firms and family-owned firms. As expected, more managers exit when
there are more managers in the firm. The other control variables also come out as expected:
managers in larger firms are more likely to stay in their position; if not because of their skills
and performance or an entrenched position, then simply because larger firms are less likely to
experience a transition, cf. the previous sub-section. In firms with better performance, there
are also fewer managers that exit. The performance sensitivity is especially high in larger
firms as the coefficient estimate in Model 2 shows, and it is relatively low for foundation-
owned and family-owned firms. Disregarding the level of profitability and only focusing on
whether it is positive or negative, we see that negative earnings in year t-1 makes it more
likely that one or more managers are not around by the end of year t. Looking at the
interaction term, we see that the reaction to negative earnings is more severe when the
controlling owner is an industrial foundation. This is not the case compared to large firms,
but compared to other firms and especially family-owned firms, the foundation board, which
is responsible to the company charter, appears to react swiftly to negative performance. One
explanation may be that owner-managers find it particularly difficult to replace themselves or
their family members (Sponholtz, 2006), while this may be easier in foundation-owned firms.
Equity share. The hypothesis is that foundation-owned firms operate with less
debt and more equity. Holding equity can serve as a long-term commitment to the firm,
29
where the commitment according to Mayer (2013) can be measured from the depth of the
committed capital, i.e. how much equity there is, and the length of time for which it is
committed, i.e. how durable the commitment is in the face of adversity, or, in other words,
how likely it is that the firm will be sold off. We know from above that firm transition is less
likely for foundation-owned firms. If there is also more equity in these firms, there is a strong
commitment. Our approximation of the depth of the committed capital is the equity share.
The equity share reflects s how much the shareholders have invested in the firm plus how
much have been added by retained earnings. A high equity share includes any profits
accumulated for the purpose of reducing financial vulnerability. Table 7 shows our results.
[Please insert Table 7 here]
In Model 1, the coefficient estimate for the dummy variable for foundation
ownership is 0.11, meaning that on average, and after controlling for observable firm
characteristics, foundation-owned firms hold 11 percentage points more equity – relative to
assets – than other firms. The average equity share in the sample is 0.42, which implies that
for an average equity share the share of equity to assets would increase by 0.11 / 0.42 = 26
percent if the controlling owner changed from not being an industrial foundation to being an
industrial foundation. The effect is smaller (0.08) when comparing among large firms and
smallest (0.06) when compared to family firms. In Model 1, where the comparison is to all
other firms, which is predominantly smaller firms, it is unsurprising that the difference is so
large. In the classical empirical capital structure paper by Rajan and Zingales (1995), firm
size has a strong positive effect on leverage, which is in line with our result of a smaller
impact of foundation ownership in larger firms. However, the positive effect of foundation
30
ownership remains significant in Model 2. In this specification, firm assets have a significant,
positive effect, although moderated by the number of employees. In line with existing
literature there is a positive relationship between profitability and equity share. The Myers
and Majluf (1984) explanation would be that firms prefer to self-finance with internal funds
rather than to issue debt or borrow. Relatedly, the dummy variable for negative earnings
always comes out negative. The reaction to negative earnings by industrial foundations, as
measured by the interaction term, is insignificant in all specifications except for Model 3. The
positive and significant coefficient estimate suggests that foundations may be better than
families at compensating for the write-down of equity that follows from negative earnings.
Long-termism index. The dependent variable in these regressions is the long-
termism index developed in Kappes and Schmid (2013), which “categorized firms […]
according to their relative degrees of long-term orientation” (op. cit.: 552). The index ranges
from 0.1 to 1, where firms scoring closer to 0 are less long-term oriented than those scoring
closer to 1. The interesting innovation with this index is that it provides a broader and multi-
faceted assessment of corporate time horizons which goes beyond commonly used indicators
such as R&D expenditures, and at the same time allows for substitution effects between the
different dimensions of long-termism. There are nine dimensions in the index covering
investments, employees, and financing, where only the latter has a (weak) relation to the
dimensions that we have already covered. In other words, this index adds perspectives to the
long-termism measures that we have considered so far. More specifically, it provides an
assessment of the long-term orientation that is much closer to business operations than the
structural variables already covered. One way to think about the contribution of this index to
our work is that it covers governance issues largely dealt with by management, whereas the
other dimensions cover issues largely dealt with by either owners or the board. In Kappes and
Schmid (2013), the average index value is 0.56 for all firms and 0.59 and 0.54 for family-
31
owned firms and other firms, respectively. In our data, the index has an average value of 0.48
for foundation-owned firms compared to 0.46 for other firms. Although small, the difference
is significantly different from zero.
[Please insert Table 8 here]
Our hypothesis is that foundation ownership has a positive effect on the long-
termism index, and this is indeed what we find across all specifications, although the effect is
generally small. The fact that this result lines up nicely with our other results could suggest
that the intention of the index fits well with another but related type of owner than a family.
In Model 1 in Table 8, the coefficient estimate of foundation ownership is 0.01. With an
overall average of 0.46, this is a small effect but not far from what Kappes and Schmid
(2013) find for German family firms, where the family business coefficient estimate is 0.03
or 0.02 depending on the definition of a family firm, and where the overall mean of the index
is 0.56. The effect is lower when foundation ownership is compared to other large firms
(Model 2), and it is in-between in Model 3 when foundation-owned firms are compared to
family firms. In all specifications, there is a positive and statistically significant effect of
foundation ownership. Still comparing with family firms, there is a much stronger reaction to
negative earnings in foundation-owned firms. According to this index, negative earnings
reduce the long-term orientation more in foundation-owned firms than in family firms, or in
any other firm in our sample, except for the large firms in Model 2, where the coefficient
estimate is insignificant. Firm size has a positive effect on the index as does profitability,
supporting the Myers and Majluf (1984) explanation that high profitability creates financial
slack for (long-term) investments. Somehow contradictory to this, the negative earnings
32
dummy comes out positive. To the extent that this variable approximates a crisis that puts
pressure on the long-term orientation of the firm, we would expect it to come out negative,
which is only the case for the interaction term with the foundation-ownership dummy.
However, the joint effect is negative and significant.
As briefly mentioned above, the long-term index is comprised of three
categories, each covered by three variables specific to that category. This allows for
calculating sub-indices for investment-related, employee-related, and financing-related
variables, respectively, and for examining in more detail whether foundation-ownership is
perhaps orientated towards particular elements of long-termism. The sub-indices are
constructed so that the interpretation is similar to that of the aggregate index, i.e. firms
scoring closer to 1 are more long-term oriented. In our data, there is relatively much variation
between sub-indices but not between foundation-owned and other firms within sub-indices,
although the differences are statistically significant in all instances with foundation-owned
firms scoring highest. The investment sub-index has the lowest average value (standard
deviation) of 0.34 (0.14). This low value is partly attributable to relatively poor coverage of
the R&D expenditure variable among unlisted firms in our data, which biases our
measurement towards 0. The overall average (standard deviation) for the employee sub-index
is 0.47 (0.11), and for the financing sub-index 0.55 (0.17). Panels A-C in Table 9 present the
multivariate results. The foundation-ownership dummy is found to increase the long-term
orientation along the financing dimension and the investment dimension, but only when
compared to all other firms and never when compared to family firms. For the financing
dimension, we also note that foundations mitigate adverse effects of financial pressure as
approximated by the negative earnings dummy, even when compared to family firms, who
have previously been found to maintain their long-run focus when facing short-term pressure
(Kappes and Schmid, 2013).
33
[Please insert Table 9 here]
Longevity. The best indicator of long-termism may be survival of long-term
oriented firms vis-à-vis other firms. In fact, this may be the ultimate evaluation of the
viability of this approach, at least to the extent that ownership is about more than profit
maximization.
To this end, we estimate Kaplan-Meier survival functions. Our data is subject to
right-censoring, i.e. for some firms we only know at least how many years they survived. In
the analysis of firm survival, we thus estimate the probability of survival up to time t, using
the Kaplan-Meier survival function estimator. This gives us an estimate of the unconditional
probability of survival beyond year t as a function of firm age. Estimation is carried out by
letting each type of ownership (foundation-owned firms and other firms) define a stratum and
setting the event equal to firm transition. We follow Chancharat et al. (2012) in treating firm
transitions as non-survivors. In Figure 2, we plot the survival curves for both foundation-
owned firms and other firms; it can be seen, for example, that the probability of surviving
beyond age 40 is 30 percent for foundation-owned firms and 10 percent for other firms. The
survival probability is always higher for foundation-owned firms.
[Please insert Figure 2 here]
34
The differences are partly attributable to the life history of industrial
foundations. Typically, a foundation is established when a founder donates equity in an
existing company to it. In other words, business companies are not established with
foundation ownership. The foundation structure may, for example, arise as a solution to
succession problems when both the founder and the company have reached a mature age. In
other cases, the foundation is established by bequest in the founder’s will. For a typical
entrepreneur, this could be some 30 years after the company was founded. The survival
curves for foundation-owned firms therefore omit unsuccessful companies that were closed
down or acquired before they could become foundation-owned. However, examination of the
survival curves shows that foundation-owned firms have higher survival rates even after the
first 30 years. Among the non-foundation-owned firms, 80 percent of the remaining
population at age 30 is gone at age 60, while only 30 percent of the foundation-owned
population at age 30 is gone at age 60.
DISCUSSION AND CONCLUSIONS
In this paper, we have proposed and found support for the hypothesis that long-term
ownership commitment will influence corporate governance towards a longer time horizon.
Long-term owners will rationally internalize a greater part of the corporate time axis and so
have an obvious incentive to avoid wasteful short-termism. Since shareholders top the chain
of command to the directors and executives, they also have the power to influence corporate
governance. To test our hypotheses, we have used a unique Danish data set on a long-term
ownership type, the industrial foundation, which is created by wealthy entrepreneurs to
preserve their companies for posterity. We have shown empirically that foundation-owned
companies are in fact more long-term than other companies in several respects: Their

35
ownership structure is more stable, there are fewer firm transitions (M&A or bankruptcy),
management turnover is lower, their capital structures are more conservative, business
(especially financial) decisions appear to be more long-term, and survival rates are higher
than among firms in general. In other words, we have found support for all our hypotheses,
although there are some instances where the difference to family firms is insignificant. More
specifically, this is the case when we look at firm transitions and the long-termism sub-index
for investments in R&D. The consistency of our results seems to indicate that long-termism
reflects a general concept, a corporate governance model, which is manifested over a range of
behaviours. We speculate that long-termism may reflect a business orientation laid down by
the founding entrepreneurs, which emphasizes financial sustainability over short-term
earnings. This is similar to what we find in the literature on the long-termism of family firms,
and foundation ownership may indeed be seen as an alternative succession model in which
family members often continue to play a role as directors or executives.
Our results contribute to the research on industrial foundations. Given our
contribution in this paper, it now seems clearer that competitive advantages related to patient
long-run ownership may be one reason why foundation-owned are able to compete
successfully with other ownership structures (Thomsen, 1996, 1999; Hermann and Franke,
2002; Thomsen and Rose, 2004; Dzansi, 2012). This important not just for the Nordic
countries, but also to the regulation and governance of global foundation-owned companies
like Robert Bosch, Mahle, Hershey, Tata or Rolex.
Our findings also have implications that are relevant for long-term ownership
more generally. To be sure, industrial foundations may be regarded as an element of the
Nordic corporate governance model (Thomsen 2016a, 2016b, 2016c). They grew out of a set
of specific historical conditions, which cannot necessarily be replicated elsewhere, including
high taxation of private wealth and strong social governance (e.g. low levels of corruption)
36
(Thomsen 2016b). However, their charter-bound ownership commitment provides a natural
experiment by which we can study the consequences of long-term ownership. For example,
stable long-term ownership may be an important determinant of the long-termism observed in
family businesses. Family businesses that do not make such a commitment may not display
the same long-term governance as has been observed for family businesses in general. It is
conceivable that founding families may strengthen their ownership commitment by
shareholder agreements, bylaws, dual class shares, family offices, holding companies and
family councils, in ways which parallel foundation ownership (Caspar, Dias, and Elstrodt,
2010).
Our results are relevant for the growing literature on short-termism (Asker et
al., 2011, 2015; Kaplan and Minton, 2012; Bhagat and Bolton, 2014; Ladika and Saunter,
2014; Reilly et al., 2016; Sampson and Sin, 2016; Souder et al., 2016) by pointing to long-
term ownership as a possible remedy. Theoretically, short-termism reflects a market failure,
in which decision-makers fail to internalize the future costs and benefits of their present
decisions. Short-term owners, security traders in the words of Roe (2013), are unlikely to take
the long run into account, except to the extent that it is manifested in current stock prices. In
contrast, controlling, long-term owners bridge the present and the future through their
continuous ownership and have both the incentives and the power to act to preserve their
long-term interests. Foundation ownership is only one way to ensure long-term ownership,
which could also be exercised by founding families, business groups, or financial block
holders. If our research is correct, what matters is not only owner identity and ownership
stake, but also the commitment, which the owners make to the company.
Although we stress the fundamental importance of ownership, some unresolved
questions regarding the direction of causality remain. The fact that foundation-ownership is a
choice, an alternative to family ownership or sale of the company, invites speculation about

37
selection effects. It seems very likely that there are indeed selection effects at work so that
founders choose the foundation structure because they believe that it matches the nature of
the company and their conception of corporate governance. In other words, the direction of
causality could in part go from long-termism to foundation ownership rather than vice versa.
Detecting causality would require a research design using instrumental methods, which
should be a topic for future research. Moreover, while this paper has not examined the
consequences for economic performance, a logical next step would be to further examine
whether foundation-owned companies benefit financially from long-termism.
These research limitations have direct implications for policy. It is not clear
what would happen if companies were forced to adopt foundation ownership or other long-
term oriented ownership structures rather than adopting it when they believe that it is the best
solution. Our best guess is that it would be problematic, since not all companies are suited to
foundation ownership, which, among other things, requires a capital structure (an equity
base) and a cash flow that can self-finance a large part of a firm’s expansion. Furthermore,
while we have found that foundation ownership is associated with long-termism, we have not
examined whether long-termism is in fact associated with better long-term performance.
Therefore, we do not conclude that foundation ownership or long-term ownership in general
should be mandated by law for all firms. Rather, we make the more modest claim that
companies and their shareholders should be allowed to self-select into foundation ownership
or other long-term ownership structures.
We therefore advocate a level playing field in which alternative governance
mechanisms can compete freely and fairly with the idea that more efficient governance
mechanisms out-compete less efficient alternatives. Since companies vary in terms of
business models and market conditions, we would expect a great deal of diversity in terms of
governance arrangements, including time horizons. Based on our findings in this paper, we
38
would expect foundation ownership, with its long-term characteristics, to be especially
amenable to industries with long time horizons, including R&D and asset intensive industries.
The current barriers against long-term ownership are formidable. US law deliberately
imposes heavy fines on foundations that have a controlling interest of 20 percent or more in a
business company (Fleishman, 2001). Policy makers should therefore reconsider whether to
remove barriers to foundation ownership. The same may apply to family firms, where
inheritance and capital gains taxes may imply a barrier to long-term family ownership. In
recent years, countries like Sweden and Norway have abolished inheritance taxes partly for
this reason. We recognize that there are other policy issues as work here, including wealth
and income distribution; our point is only that policy-makers should consider the role of long-
term owners if they are serious about combatting short-termism. We do not believe that
corporate ownership is currently on the agenda in any meaningful way.
39
1 To be sure, there are also counter arguments to long-termism of family ownership (Reilly et al., 2016).
Family-owned companies cannot to the same extent access stock markets and may therefore face higher costs of
capital (Fama and Jensen, 1983, 1985). For example, Anderson, Duru, and Reeb (2012) find that family firms
invest less in long-term projects and especially in R&D. This is an argument that we will elaborate on later in
relation to our hypothesis 4. 2 In Denmark, ownership is flagged for all owners with more than 5 percent of the votes or the capital. If there is
an ownership link between an industrial foundation and a business firm, the link between the two is maintained
irrespective of the ownership stake. This procedure is valid because the Business Authority only registers
foundations with controlling influence, which may be below 50 percent, as industrial foundations (otherwise it is
not under their supervision). 3 These nine variables are: R&D (a dummy variable for whether or not the firm reports R&D costs), CapEx (the
increase in total assets over value added between t-1 and t), Asset maturity (depreciations over value added.),
Burden (the change in the number of employees over value added between t-1 and t.), Salaries (the change in the
average wage cost per employee between t-1 and t), Downsizing (the percentage point change in the number of
employees if negative, zero otherwise), Cash (highly liquid assets over total assets.), Liquidity (current assets
over total assets), and Debt maturity (long-term debt over total debt). We refer to Kappes and Schmid (2013) for
more on the theoretical considerations behind the construction of the index. Our adaptation is due to data
availability. Specifically, we use value added instead of sales and use a dummy variable for R&D instead of a
continuous variable. The index is set to missing if there is missing information for more than seven out of the
nine variables. The three sub-indices (more about them later) are only calculated for firm-years where all
variables are available.
40
REFERENCES
Anderson, R.C. and D.M. Reeb. 2003. Founding-family ownership and firm performance:
Evidence from the S&P 500. The Journal of Finance, 58: 1301-1328.
Ampenberger, M., Schmid, T., Achleitner, A.K., Kaserer, C. 2013. Capital structure decisions
in family firms: Empirical evidence from a bank-based economy. Review of Management
Science, 7: 247-275.
Asker, J., Farre-Mensa, J., and Ljungqvist, A. 2011. Comparing the investment behavior of
public and private Firms. National Bureau of Economic Research, Working Paper No. 17394.
Asker, J., Farre-Mensa, J., and Ljungqvist, A. 2015. Corporate investment and stock market
listing: A Puzzle. Review of Financial Studies, 28: 342-390.
Atanassov, J. and Kim, E.H. 2009, Labor and corporate governance: International evidence
from restructuring. Journal of Finance, 64: 341-374.
Bair, S. 2011. Lessons of the financial crisis: The dangers of short-termism. Remarks to the
National Press Club, Washington, D.C., June 24.
Bansal, P. and DesJardine, M. 2014. Business sustainability: It is about time. Strategic
Organization, 12: 70-78.
Barry, K.D. and Katz, S.N. 1987. Foundations and ruling class elites. Daedalus, 116: 1-40.
Belenzon, S., Patacconi, A., and Zarutskie, R. 2016. Married to the firm? A large-scale
investigation of the social context of ownership. Strategic Management Journal, 37: 2611-
2638.

41
Bennedsen, M., Fan, J.P., Jian, M., and Yeh, Y.H. 2015. The family business map:
Framework, selective survey, and evidence from Chinese family firm succession. Journal of
Corporate Finance, 33: 212-226.
Bhagat, S. and Bolton, B. 2014. Financial crisis and bank executive incentive compensation.
Journal of Corporate Finance, 25: 313-341.
Bianco, M., Bontempi, M.E., Golinelli, R. and Parigi, G. 2013. Family firms’ investments,
uncertainty and opacity. Small Business Economics, 40: 1035-1058.
Bolton, P., Scheinkman, J., and Xiong, W. 2006. Executive compensation and short-termist
behaviour in speculative markets. Review of Economic Studies, 73: 577-610.
Bushee, B.J. 1998. The influence of institutional investors on myopic R&D investment
behavior. Accounting Review, 73: 305-333.
Børsting, C. and Thomsen, S. 2016. Foundation ownership and labour. Oxford Review of
Economic Policy. Forthcoming.
Caspar, C., Dias, A.K., and Elstrodt, H-P. 2010. The five attributes of enduring family
businesses. Mckinsey Quarterly, 1: 1-10.
Chancharat, N., Krishnamurti, C., and Tian, G. 2012. Board structure and survival of new
economy IPO firms. Corporate Governance: An International Review, 20: 144-163.
Chemla, G., Habib, M.A., and Ljungqvist, A. 2007. An analysis of shareholder agreements.
Journal of The European Economic Association, 5: 93-121.
Chen, X., Harford, J., and Li, K. 2007. Monitoring: Which institutions matter? Journal of
Financial Economics, 86: 279-305.

42
Chua, J.H., Chrisman, J.J., and Bergiel, E.B. 2009. An agency theoretic analysis of the
professionalized family firm. Entrepreneurship Theory and Practice, 33: 355-372.
Collins, J. and Porras, J. 1997. Built to Last. New York. Harperbusiness.
Cremers, M., Pareek, A., and Sautner, Z. 2013. Stock duration and misevaluation. Working
paper.
Cremers, M., Masconale, S., and Sepe, S.M. 2016. Commitment and entrenchment in
corporate governance. Northwestern Law & Econ Research Paper, No. 15-22.
Croce, R.D., Stewart, F., and Yermo, J. 2011. Promoting longer-term investment by
institutional investors. OECD Journal Financial Market Trends, 12: 145-164.
Cyert, R.M. and March, J.G. 1963. A behavioral theory of the firm. Malden, MA: Blackwell
1992.
Das, T.K. 1987. Strategic-planning and individual temporal orientation. Strategic
Management Journal, 8: 203-209.
de Geus, A. 1997. The living company: Growth, learning and longevity in business.
London: Nicholas Brealey.
De Maere, J., Jorissen, A., and Uhlaner, L.M. 2014. Board capital and the downward spiral:
Antecedents of bankruptcy in a sample of unlisted firms. Corporate Governance: An
International Review, 22: 387-407.
Denis, D.J. and Atulya, S. 1999. Ownership and board structures in publicly traded
corporations. Journal of Financial Economics, 52: 187-223.
DesJardine, M.R. 2015. Under pressure: The causal effect of financial analyst coverage on
long-term capital investments. Working Paper.
43
Desyllas, P. and Hughes, A. 2010. Do high technology acquirers become more innovative?
Research Policy, 39: 1105-1121.
Dutta, P.K. and Radner, R. 1999. Market selection and the profit-maximization hypothesis.
Review of Economic Studies, 66: 769-798.
Dutta, P.K. and Sundaram, R.K. 2001. Survival and the art of profit maximization. Review of
Economic Design, 6: 429-446.
Dzansi, J. 2011. Foundations and investment performance: The role of non-financial motives.
Global Economy and Finance Journal, 5: 58-78.
Edmans, A. and Manso, G. 2011. Governance through trading and intervention: A theory of
multiple blockholders. The Review of Financial Studies, 24: 2395-2428.
Elyasiani, E. and Jia, J.J. 2008. Institutional ownership stability and BHC performance.
Journal of Banking & Finance, 32: 1767-1781.
European Council. 2016. EU Shareholders' rights in EU companies: Presidency strikes deal
with Parliament. URL: http://www.consilium.europa.eu/en/press/press-releases/2016/12/16-
shareholders-rights-eu-companies/
Fleischmann, J. 2001. Public policy and philanthropic purpose – foundation ownership and
control of corporations in Germany and the United States. In A. Schlüter, V. Then, and P.
Walkenhorst (Bertelsmann Foundation) (Eds.), Foundations in Europe: Society,
Management and Law: 372-408. London: Directory for Social Change.
Frederick, S., Loewenstein, G., and O’Donoghue, T. 2002. Time discounting and time
preference: A critical review. Journal of Economic Literature, 40: 351-401.

44
Fink, L. 2016. URL: http://www.prisim.com/wp-content/uploads/2016/02/BlackRock-CEO-
Larry-Fink-letter-to-SandP-500-CEOs-Business-Insider.pdf.
García-Castro, R., Aguilera, R.V., and Ariño, M.A. 2013. Bundles of firm corporate
governance practices: A fuzzy set analysis. Corporate Governance: An International
Review, 21: 390-407.
Gnan, L., Montemerlo, D., and Huse, M. 2015. Governance systems in family SMEs: The
substitution effects between family councils and corporate governance mechanisms. Journal
of Small Business Management, 53: 355-381
Goergen, M., Renneboog, L., and Khurshed, A. 2006. Explaining the diversity in shareholder
lockup agreements. Journal of Financial Intermediation, 15: 254-280.
Gong, J.J. and Wu, S.Y. 2011. CEO turnover in private equity sponsored leveraged buyouts.
Corporate Governance: An International Review, 19: 195-209.
Gilding, M. 2005. Families and fortunes: Accumulation, management succession and
inheritance in wealthy families. Journal of Sociology, 41: 29-45.
Gordon, G. and Nicholson, N. 2008. Family wars: Stories and insights from famous
family business feuds. Kogan Page, London.
Hansmann, H.B. 1980. The role of nonprofit enterprise. The Yale Law Journal, 5: 835-901.
Hansmann, H.B. and Thomsen, S. 2013. Managerial Distance and Virtual Ownership: The
Governance of Industrial Foundations. Working Paper.
Hermann, M. and Franke, G. 2002. Performance and policy of foundation-owned firms in
Germany. European Financial Management, 8: 261-279.
45
Hiebl, M.R.W. 2013. Risk aversion in family firms: What do we really know? Journal of
Risk Finance, 14: 49-70.
Hill, C.W., Hitt, M.A., and Hoskisson, R.E. 1992. Cooperative versus competitive structures
in related and unrelated diversified firms. Organization Science, 3: 501-521.
Holmstrom, B. and Milgrom, P. 1994. The firm as an incentive system. The American
Economic Review, 84: 972-991.
Howell, J.W. 2017. The survival of the U.S. dual class share structure. Journal of Corporate
Finance, 44: 440-450.
Jagannathan, R., Matsa, D.A., Meier, I., and Tarhan, V. 2014. Why do firms use high
discount rates? Working Paper.
James, H.S. 1999. Owner as manager, extended horizons and the family firm. International
Journal of the Economics of Business, 6: 41-55.
Jensen, M.C. 1986. Agency costs of free cash flow, corporate Finance, and takeovers.
American Economic Review, 76: 323-329.
Johnson, S. 2015. Protectionist French law alarms investors. Financial Times, Feb. 22, 2015.
LaPorta, R., Lopez-de-Silanes, F., Shleifer, A., and Vishny, R.W. 1997. Trust in large
organizations. American Economic Review Papers and Proceedings, 87: 333-338.
Ladika, T. and Sautner, Z. 2014. The effect of managerial short‐termism on corporate
investment. Working Paper.
Le Breton-Miller, I. and Miller, D. 2006. Why do some family businesses out-compete?
Governance, long-term orientations, and sustainable capability. Entrepreneurship: Theory &
Practice, 30: 731-746.

46
Levinson, H. 1971. Conflicts that plague family businesses. Harvard Business Review.
Levinthal, D.A. and March, J.G. 1993. The Myopia of Learning, Strategic Management
Journal, 14: 95-112.
Kachaner, N., Stalk, G., and Bloch, A. 2012. What you can learn from family business.
Harvard Business Review, 90: 102-106.
Kaplan, S.N. and Minton, B.A. 2012. How has CEO turnover changed? International Review
of Finance, 2012: 57-87.
Kay, J. 2012. The Kay review of UK equity markets and long-term decision making. Final
Report. URL:
https://www.gov.uk/government/uploads/system/uploads/attachment_data/file/253454/bis-
12-917-kay-review-of-equity-markets-final-report.pdf
Kim, Y., Lixin, S., and Zhu, X. 2016. Does quarterly earnings guidance cessation reduce
investors’ short-termism? Review of Accounting Studies, Forthcoming.
Kotlar, J., and De Massis, A. 2013. Goal setting in family firms: Goal diversity, social
interactions, and collective commitment to family-centered goals. Entrepreneurship: Theory
& Practice, 37: 1263-1288.
Kreps, D.M. 1990. Corporate culture and economic theory. Mimeo. Graduate School of
Business, Stanford University. In J.E. Alt and K.A. Shepsle (Eds.), Perspectives on positive
political economy: 90-143. Cambridge University Press: New York.
Marginson, D. and McAulay, L. 2008. Exploring the debate on short-termism: A theoretical
and empirical analysis. Strategic Management Journal, 29: 273-292.

47
Martin, K. and McConnell, J. 1991. Corporate performance, corporate takeovers, and
management turnover. The Journal of Finance, 46: 671-687.
Mayer, C. 2013. Firm Commitment. Why the corporation is failing us and how to restore
trust in it. Oxford University Press. Oxford.
Mayer, R.C., Davis, J.R., and Schoorman, F.D. 1995. An integrative model of organizational
trust. Academy of Management Journal, 20: 709-737.
McKinsey & Co. 2015. Perspectives on the Long Term 2015 Building a Stronger Foundation
for Tomorrow.
Milliband, E. 2012. Our toxic blend of capitalism and short-termism. Financial Times
January 18.
Milston, M.J. and Cohn, T. 1967. Personal and business aspects of stockholder agreements.
Journal of Accountancy, 124: 41-45.
Mischel, W. 2014. The marshmallow test: Mastering self-sontrol. New York: Little, Brown
and Company.
Mischel, W. and Ebbesen, E.B. 1970. Attention in delay of gratification. Journal of
Personality and Social Psychology, 16: 329-337.
Mischel, W., Shoda, Y., and Rodriguez, M.L. 1989. Delay of gratification in children.
Science, 244: 933-938.
Mischel, W. and Ayduk, O. 2004. Willpower in a cognitive-affective processing system: The
dynamics of delay of gratification. In R.F. Baumeister and K.D. Vohs (Eds.), Handbook of
Self-Regulation: Research, Theory, and Applications: 99-129. New York: Guilford.
48
Myers, S.C. and Majluf, N.S. 1984. Corporate financing and investment decision when firms
have information that investors do not have. Journal of Financial Economics, 13: 187-221.
Opler, T.C. and Titman, S. 1994. Financial distress and corporate performance. Journal of
Finance, 49: 1015-1040.
Oprea, R. 2014. Survival versus profit maximization in a dynamic stochastic experiment.
Econometrica, 82: 2225-2255.
Palley, T.I. 1997. Managerial turnover and the theory of short-termism. Journal of Economic
Behavior & Organization, 32: 547-557.
Petersen, M.A. 2009. Estimating standard errors in finance panel data sets: Comparing
approaches. Review of Financial Studies, 22: 435–480.
Phelps, E.S. 2010, Shorttermism is undermining America. New Perspectives Quarterly, 27:
17-19.
Poterba, J.M. and Summers, L. 1995. A CEO survey of U.S. companies' time horizons and
hurdle rates. Sloan Management Review, 37: 43-53.
Prencipe, A., Bar-Yosef, S., Mazzola, P., and Pozza, L. 2011. Income smoothing in family-
controlled companies: Evidence from Italy. Corporate Governance: An International
Review, 19: 529-546.
Radner, R. 1998. Economic Survival. In D.P. Jacobs et al. (Eds.), Frontiers of Research in
Economic Theory: 183-209. Cambridge: Cambridge University Press.
Rajan, R.G. and Zingales, L. 1995. What do we know about capital structure? Some evidence
from international data. The Journal of Finance, 50: 1421-1460.

49
Reilly, G., Souder, D. and Ranucci. R. 2016. Time horizon of investments in the resource
allocation process: Review and framework for next steps. Journal of Management, 42:
1169-1194.
Reuben, E., Sapienza, P., and Zingales, L. 2015. Procrastination and impatience. Journal of
Behavioral and Experimental Economics, 58: 63-76.
Reuters. 2015. Clinton proposes tax, buyback changes to encourage long-term growth. July
24.
Roe, M.J. 2013. Corporate short-termism - In the boardroom and in the courtroom. Harvard
Public Law Working Paper No. 13-18.
Sampson, R.C. and Shi, Y. 2016. Evidence and implications of short-termism in US public
capital markets: 1980-2013. Working Paper.
Schelling, T.C. 1960. The Strategy of Conflict, Harvard University Press.
Schellling, T.C. 1985. Strategies of commitment and other essays. Harvard University Press.
Schleifer, A., and Vishny, R.W. 1990. Equilibrium short horizons of investors and firms.
American Economic Review, 80: 148-153.
Shumway, T. 2000. Forecasting bankruptcy more accurately: A simple hazard model. The
Journal of Business, 74: 101-124.
Slawinski, N. and Bansal, P. 2012. What’s time got to do with it? Understanding temporal
perspectives in organizational responses to climate change. Organization Studies, 33: 1537-
1563.
Solomon, S.D. 2015. France answers hostile bids with the two-vote Share. New York Times,
May 19.

50
Souder, D. and Bromiley, P. 2012. Explaining temporal orientation: Evidence from the
durability of firms’ capital investments. Strategic Management Journal, 33: 550-569.
Souder, D. and Shaver, J.M. 2010. Constraints and incentives for making long horizon
corporate investments. Strategic Management Journal, 31: 1316-1336.
Souder, D., Reilly, G., Bromiley, P., and Mitchell, S. 2016. A behavioral understanding of
investment horizon and firm performance. Organization Science, 27: 5-12
Sponholtz, C. 2006. Determinants of CEO turnover in public and private firms in Denmark -
CEO and firm characteristics. Working Paper.
Stein, J.C. 1988. Takeover threats and managerial myopia. Journal of Political Economy,
96: 61-80.
Stein, J.C. 1989. Efficient capital markets, inefficient firms: A model of myopic corporate
behavior. Quarterly Journal of Economics, 104: 655-669.
Stiglitz, J.E. 2016. An agenda for sustainable and inclusive growth for emerging markets,
Journal of Policy Modeling, 38: 693-710.
Tait, A.A. 2015. The secret economy of charitable giving. Boston University Law Review,
Vol. 95.
Taylor, L.A. 2010. Why are CEOs rarely fired? Evidence from structural estimation, Journal
of Finance, 65: 2051-2087.
Thakor, A.V. 1990. Investment “myopia” and the internal organization of capital allocation
decisions. Journal of Law, Economics, & Organization, 6: 129-154.
Thanassoulis, J.E. 2013. Industry structure, executive pay, and short-termism. Management
Science, 59: 402-419.
51
Thanassoulis, J.E. and Somekh, B. 2016. Real economy effects of short-term equity
ownership. Journal of International Business Studies, 47: 233-254.
Thaler, R.H. 1981. Some empirical evidence on dynamic inconsistency. Economics Letters,
8: 201-207.
Thaler, R.H., Tversky, A., Kahneman, D., and Schwartz, A. 1997. The effect of myopia and
loss aversion on risk taking: An experimental test. The Quarterly Journal of Economics,
112: 647-661.
Thomsen, S. 1996. Foundation ownership and economic performance. Corporate
Governance: An International Review, 4: 212-221.
Thomsen, S. 1999. Corporate ownership by industrial foundations. European Journal of
Law and Economics, 7: 117-136.
Thomsen, S. and Rose, C. 2004. Foundation ownership and financial performance. The
European Journal of Law and Economics, 18: 343-364.
Thomsen, S. and Degn, S.M. 2014. The charters of industrial foundations. Working Paper.
Thomsen, S. 2016a. Industrial foundations: The Danish model, in A. Simonyi and D. Cagan
(Eds.), Nordic Ways: 3-33. Brookings Institution Press, October 25, 2016.
Thomsen, S. 2016b. The Nordic corporate governance model. Management and
Organization Review, 12: 4-12.
Thomsen, S. 2016c. Nordic corporate governance revisited. The Nordic Journal of Business,
65: 189-204.

52
Thomsen, S. 2017. The Danish industrial foundations. Copenhagen: DJOEF Publishing
Company.
Uhlaner, L., Floren, R., and Geerlings, J. 2007. Owner commitment and relational
governance in the privately-held firm: An empirical study. Small Business Economics, 29:
275-293.
Villalonga, B. and Amit, R. 2006. How do family ownership, control and management affect
firm value? Journal of Financial Economics, 80: 385-417.
Wang, H.C., Zhao, S., and He, J. 2015. Increase in takeover protection and firm knowledge
accumulation strategy. Strategic Management Journal, Forthcoming.
White, W.S., Krinke, T.D., and Geller, D.L. 2004. Family business succession planning:
Devising an overall strategy. Journal of Financial Service Professionals, 58: 67-86.
Wilson, N., Wright, M., and Scholes, L. 2013. Family business survival and the role of
boards. Entrepreneurship: Theory & Practice, 37: 1369-1389.
Woidtke, T. 2002. Agents watching agents? Evidence from pension fund ownership and firm
value. Journal of Financial Economics, 63, 99-131.
Zellweger, T.M. 2007. Time horizon, costs of equity capital, and generic investment
strategies of firms. Family Business Review, 20: 1-15.
Zellweger, T., and Kammerlander, N. 2015. Family, wealth, and governance: An agency
account. Entrepreneurship: Theory & Practice, 39: 1281-1303.
53
Zhang, Y. and Gimeno, J. 2016. Earnings pressure and long-term corporate governance: Can
long-term-oriented investors and managers reduce the quarterly earnings obsession?
Organization Science, 27: 354-372.

54
Table 1. Long-termism variables
Variable Description Rationale
Ownership stability Standard deviation of the
largest owner’s ownership
stake over the sample period.
Low value indicates a stable
and more persistent owner
with long-term orientation.
Firm transition Dummy variable equal to one
if a firm leaves our financial
data in year t and its status
subsequently changes from
active to inactive.
Value equal to zero means that
a firm continues as an
independent entity that can
pursue the long-term interests
of the controlling owner.
Manager exit Count variable equal to the
number of officers that
separate from a firm between
year t-1 and year t.
Low value indicates stable
management aligned with the
long-term orientation of the
controlling owner.
Equity share Total equity relative to total
assets in year t.
High value indicates that more
of the owners’ capital is
committed to a firm’s long-
term interests.
Survival Estimated survival probability
by the end of our sample
period as a function of firm
age using the Kaplan-Meier
method.
High value indicates that a
firm’s strategy is robust to
changes over time in the
business environment.
Long-termism index (LTI)
- Overall A measure of the rank of a
firm in year t across the nine
long-termism variables
identified in Kappes and
Schmid (2013). Scaled to fit a
range between zero and one.
High value indicates long-
termism by way of relatively
generous investments in a
firm’s mission and
stakeholders.
- Investments Sub-index focusing on
variables related to the
activities and assets of the
firm in year t.
High value indicates long-
term focus on a firm’s
investments to realize the
mission of the firm.
- Employees Sub-index focusing on
variables related to the
employees of the firm in year
t.
High value indicates long-
term focus on a firm’s
investments in and relations to
employees.
- Financing Sub-index focusing on
variables related to the cash
flow and financing of the firm
in year t.
High value indicates long-
term focus on a firm’s
relationship to its suppliers as
well as the long-term aspects
of its financing.

55
Table 2. Descriptive statistics
Mean Std. dev. Median
Ownership stability 14.931 18.701 0.000
Firm transition 0.028 0.164 0.000
Managerial exits 0.067 0.284 0.000
Equity share 0.417 0.307 0.358
LTI 0.458 0.126 0.460
Total assets 72,110 1,960,228 5,421
Number of employees 44.836 880.314 6.000
Performance 0.044 0.165 0.035
Negative earnings 0.278 0.448 0.000
Largest ownership stake 42.958 46.455 5.000
Full ownership 0.156 0.363 0.000
Number of managers 1.211 0.528 1.000
Ownership stability is the standard deviation of the largest owner’s ownership stake over the
sample period. Firm transition is a dummy variable equal to 1 if the firm disappears from our
financial data in a given year and subsequently is registered as closed and 0 otherwise.
Managerial exits is a count variable equal to the number of C-suite managers that have left
the firm between year t-1 and year t. Equity share is the ratio between total equity and total
assets. Long-termism Index (LTI) is an adapted version of the long-termism index in Kappes
and Schmid (2013). Total assets is the book value of total assets in 1000 DKK. Number of
employees is the number of full-time employees. Performance is the ratio of earnings before
interest and taxes over total assets. Negative earnings is a dummy variable equal to 1 if EBIT
is negative and 0 otherwise. Largest ownership stake is the average ownership stake of the
largest owner over the sample period. Full ownership is a dummy variable equal to 1 if the
largest owner owns one hundred percent of the firm throughout the period. Number of
managers is the number of C-suite managers in the firm in year t.

56
Table 3. Summary of findings
Hypothesis Compared to:
All firms Large firms Family firms
H1 Foundation ownership will be more
stable than ownership by other
controlling shareholders
Not rejected
at the 1 %
level
Not rejected
at the 1 %
level
Not rejected
at the 5 %
level
Alternatively: There are fewer firm
transitions (closures) amongst
foundation-owned companies
Not rejected
at the 5 %
level
Not rejected
at the 5 %
level
Rejected at
the 10 %
level
H2 Foundation-owned companies will
have greater continuity of
management (fewer exits) than other
companies
Not rejected
at the 1 %
level
Not rejected
at the 1 %
level
Not rejected
at the 10 %
level
H3 Foundation-owned firms have less
financial leverage and higher equity
ratios than other firms
Not rejected
at the 1 %
level
Not rejected
at the 1 %
level
Not rejected
at the 1 %
level
H4 Foundation-owned firms will display
more long-term oriented business
behaviour than other firms
Not rejected
at the 1 %
level
Not rejected
at the 1 %
level
Not rejected
at the 1 %
level
H5 Foundation-owned firms will survive
longer than other firms
Not rejected Not rejected Not rejected
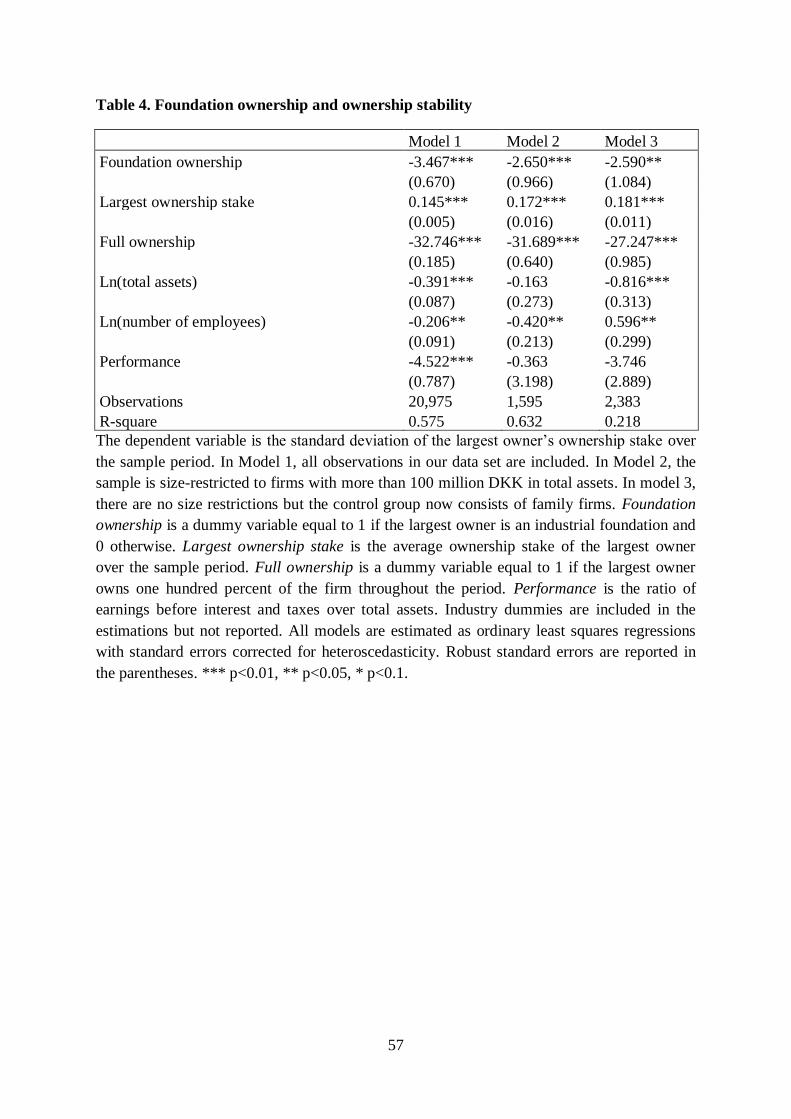
57
Table 4. Foundation ownership and ownership stability
Model 1 Model 2 Model 3
Foundation ownership -3.467*** -2.650*** -2.590**
(0.670) (0.966) (1.084)
Largest ownership stake 0.145*** 0.172*** 0.181***
(0.005) (0.016) (0.011)
Full ownership -32.746*** -31.689*** -27.247***
(0.185) (0.640) (0.985)
Ln(total assets) -0.391*** -0.163 -0.816***
(0.087) (0.273) (0.313)
Ln(number of employees) -0.206** -0.420** 0.596**
(0.091) (0.213) (0.299)
Performance -4.522*** -0.363 -3.746
(0.787) (3.198) (2.889)
Observations 20,975 1,595 2,383
R-square 0.575 0.632 0.218
The dependent variable is the standard deviation of the largest owner’s ownership stake over
the sample period. In Model 1, all observations in our data set are included. In Model 2, the
sample is size-restricted to firms with more than 100 million DKK in total assets. In model 3,
there are no size restrictions but the control group now consists of family firms. Foundation
ownership is a dummy variable equal to 1 if the largest owner is an industrial foundation and
0 otherwise. Largest ownership stake is the average ownership stake of the largest owner
over the sample period. Full ownership is a dummy variable equal to 1 if the largest owner
owns one hundred percent of the firm throughout the period. Performance is the ratio of
earnings before interest and taxes over total assets. Industry dummies are included in the
estimations but not reported. All models are estimated as ordinary least squares regressions
with standard errors corrected for heteroscedasticity. Robust standard errors are reported in
the parentheses. *** p<0.01, ** p<0.05, * p<0.1.
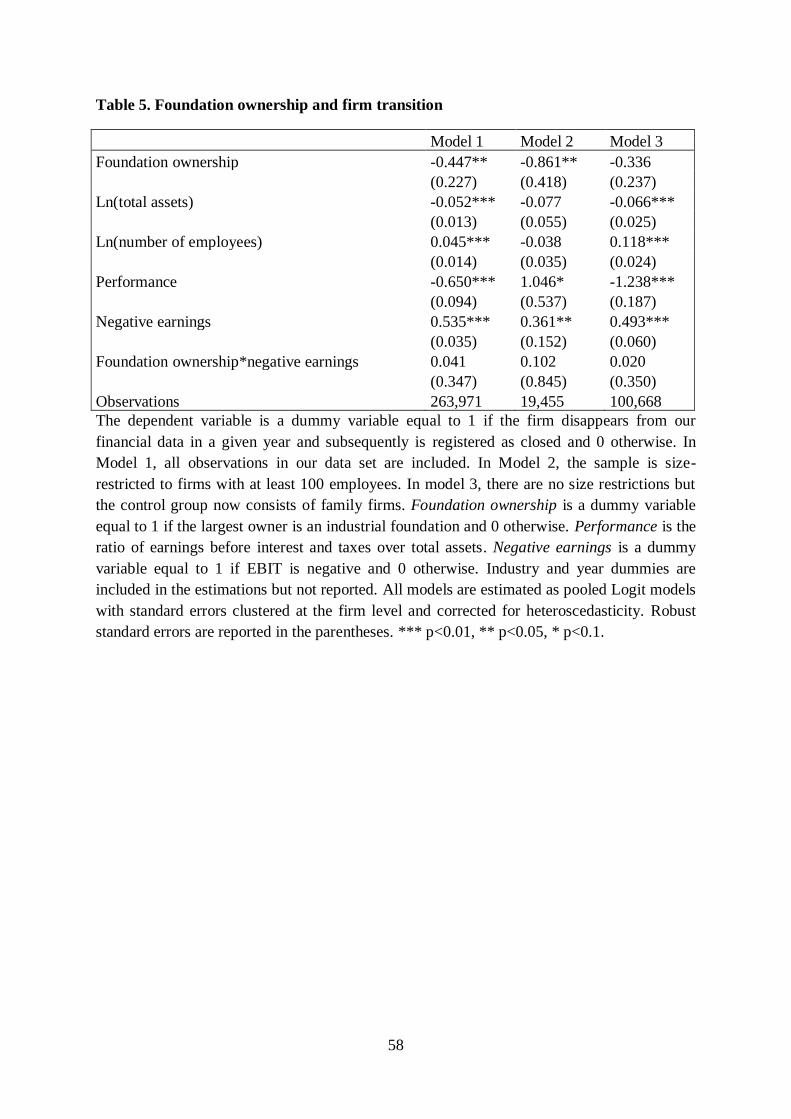
58
Table 5. Foundation ownership and firm transition
Model 1 Model 2 Model 3
Foundation ownership -0.447** -0.861** -0.336
(0.227) (0.418) (0.237)
Ln(total assets) -0.052*** -0.077 -0.066***
(0.013) (0.055) (0.025)
Ln(number of employees) 0.045*** -0.038 0.118***
(0.014) (0.035) (0.024)
Performance -0.650*** 1.046* -1.238***
(0.094) (0.537) (0.187)
Negative earnings 0.535*** 0.361** 0.493***
(0.035) (0.152) (0.060)
Foundation ownership*negative earnings 0.041 0.102 0.020
(0.347) (0.845) (0.350)
Observations 263,971 19,455 100,668
The dependent variable is a dummy variable equal to 1 if the firm disappears from our
financial data in a given year and subsequently is registered as closed and 0 otherwise. In
Model 1, all observations in our data set are included. In Model 2, the sample is size-
restricted to firms with at least 100 employees. In model 3, there are no size restrictions but
the control group now consists of family firms. Foundation ownership is a dummy variable
equal to 1 if the largest owner is an industrial foundation and 0 otherwise. Performance is the
ratio of earnings before interest and taxes over total assets. Negative earnings is a dummy
variable equal to 1 if EBIT is negative and 0 otherwise. Industry and year dummies are
included in the estimations but not reported. All models are estimated as pooled Logit models
with standard errors clustered at the firm level and corrected for heteroscedasticity. Robust
standard errors are reported in the parentheses. *** p<0.01, ** p<0.05, * p<0.1.
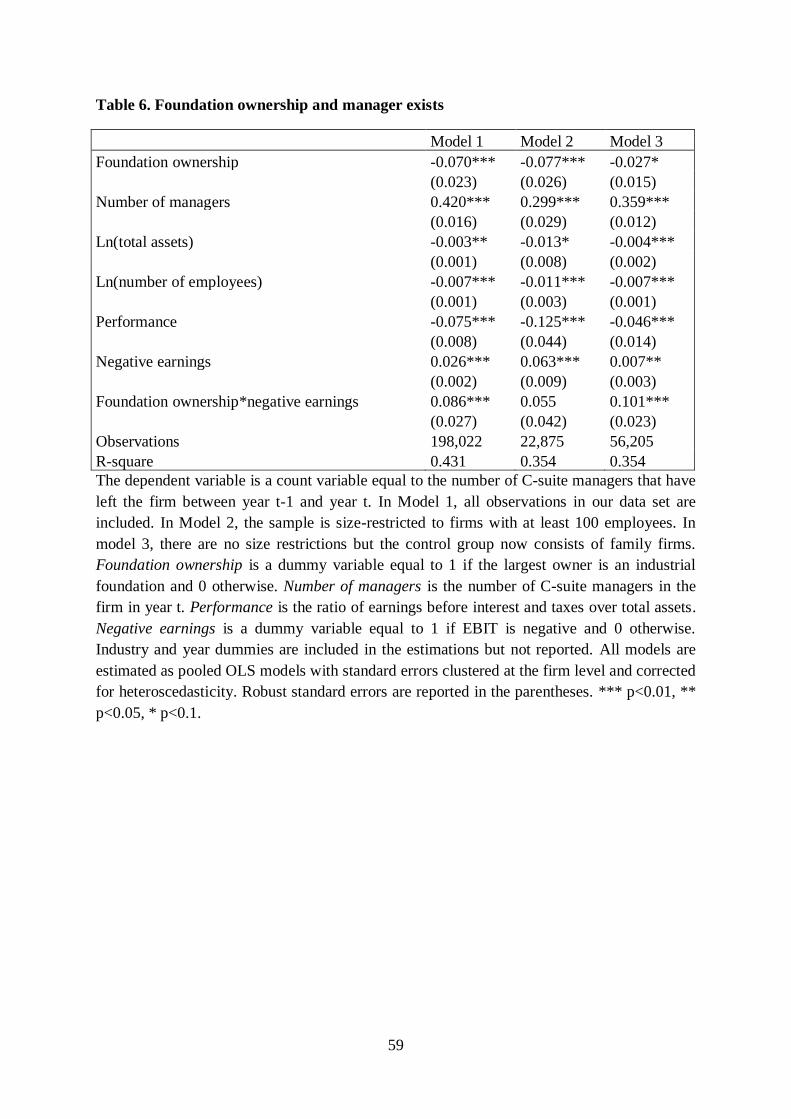
59
Table 6. Foundation ownership and manager exists
Model 1 Model 2 Model 3
Foundation ownership -0.070*** -0.077*** -0.027*
(0.023) (0.026) (0.015)
Number of managers 0.420*** 0.299*** 0.359***
(0.016) (0.029) (0.012)
Ln(total assets) -0.003** -0.013* -0.004***
(0.001) (0.008) (0.002)
Ln(number of employees) -0.007*** -0.011*** -0.007***
(0.001) (0.003) (0.001)
Performance -0.075*** -0.125*** -0.046***
(0.008) (0.044) (0.014)
Negative earnings 0.026*** 0.063*** 0.007**
(0.002) (0.009) (0.003)
Foundation ownership*negative earnings 0.086*** 0.055 0.101***
(0.027) (0.042) (0.023)
Observations 198,022 22,875 56,205
R-square 0.431 0.354 0.354
The dependent variable is a count variable equal to the number of C-suite managers that have
left the firm between year t-1 and year t. In Model 1, all observations in our data set are
included. In Model 2, the sample is size-restricted to firms with at least 100 employees. In
model 3, there are no size restrictions but the control group now consists of family firms.
Foundation ownership is a dummy variable equal to 1 if the largest owner is an industrial
foundation and 0 otherwise. Number of managers is the number of C-suite managers in the
firm in year t. Performance is the ratio of earnings before interest and taxes over total assets.
Negative earnings is a dummy variable equal to 1 if EBIT is negative and 0 otherwise.
Industry and year dummies are included in the estimations but not reported. All models are
estimated as pooled OLS models with standard errors clustered at the firm level and corrected
for heteroscedasticity. Robust standard errors are reported in the parentheses. *** p<0.01, **
p<0.05, * p<0.1.

60
Table 7. Foundation ownership and equity share
Model 1 Model 2 Model 3
Foundation ownership 0.107*** 0.080*** 0.064***
(0.013) (0.019) (0.014)
Ln(total assets) 0.041*** 0.024*** 0.062***
(0.001) (0.004) (0.002)
Ln(number of employees) -0.061*** -0.028*** -0.087***
(0.001) (0.003) (0.002)
Performance 0.336*** 0.452*** 0.458***
(0.006) (0.030) (0.009)
Negative earnings -0.055*** -0.055*** -0.044***
(0.002) (0.006) (0.003)
Foundation ownership*negative earnings 0.023 0.037 0.037**
(0.017) (0.024) (0.018)
Observations 336,532 24,894 130,039
R-square 0.154 0.178 0.215
The dependent variable is the ratio between total equity and total assets in year t. In Model 1,
all observations in our data set are included. In Model 2, the sample is size-restricted to firms
with at least 100 employees. In model 3, there are no size restrictions but the control group
now consists of family firms. Foundation ownership is a dummy variable equal to 1 if the
largest owner is an industrial foundation and 0 otherwise. Performance is the ratio of
earnings before interest and taxes over total assets. Negative earnings is a dummy variable
equal to 1 if EBIT is negative and 0 otherwise. Industry and year dummies are included in the
estimations but not reported. All models are estimated as pooled OLS models with standard
errors clustered at the firm level and corrected for heteroscedasticity. Robust standard errors
are reported in the parentheses. *** p<0.01, ** p<0.05, * p<0.1.

61
Table 8. Foundation ownership and the long-termism index
Model 1 Model 2 Model 3
Foundation ownership 0.012*** 0.007*** 0.010***
(0.002) (0.002) (0.002)
Ln(total assets) -0.001*** -0.014*** -0.001**
(0.000) (0.001) (0.000)
Ln(number of employees) 0.007** 0.003 0.016***
(0.003) (0.009) (0.005)
Performance 0.010*** 0.002 0.019***
(0.002) (0.007) (0.003)
Negative earnings 0.008*** -0.007 0.008**
(0.002) (0.009) (0.003)
Foundation ownership*negative earnings -0.019*** -0.009 -0.049***
(0.000) (0.000) (0.000)
Observations 336,419 24,888 129,999
R-square 0.162 0.153 0.166
The dependent variable is an adapted version of the long-termism index in Kappes and
Schmid (2013). In Model 1, all observations in our data set are included. In Model 2, the
sample is size-restricted to firms with at least 100 employees. In model 3, there are no size
restrictions but the control group now consists of family firms. Foundation ownership is a
dummy variable equal to 1 if the largest owner is an industrial foundation and 0 otherwise.
Performance is the ratio of earnings before interest and taxes over total assets. Negative
earnings is a dummy variable equal to 1 if EBIT is negative and 0 otherwise. Industry and
year dummies are included in the estimations but not reported. All models are estimated as
pooled OLS models with standard errors clustered at the firm level and corrected for
heteroscedasticity. Robust standard errors are reported in the parentheses. *** p<0.01, **
p<0.05, * p<0.1.
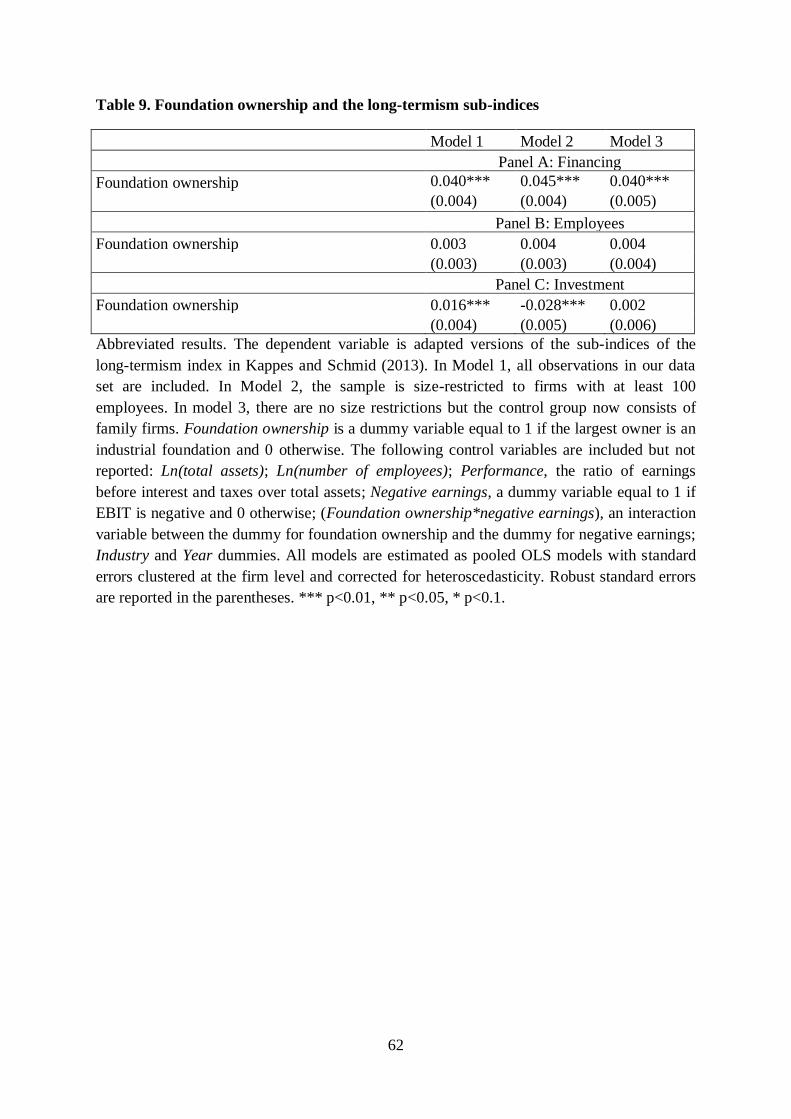
62
Table 9. Foundation ownership and the long-termism sub-indices
Model 1 Model 2 Model 3
Panel A: Financing
Foundation ownership 0.040*** 0.045*** 0.040***
(0.004) (0.004) (0.005)
Panel B: Employees
Foundation ownership 0.003 0.004 0.004
(0.003) (0.003) (0.004)
Panel C: Investment
Foundation ownership 0.016*** -0.028*** 0.002
(0.004) (0.005) (0.006)
Abbreviated results. The dependent variable is adapted versions of the sub-indices of the
long-termism index in Kappes and Schmid (2013). In Model 1, all observations in our data
set are included. In Model 2, the sample is size-restricted to firms with at least 100
employees. In model 3, there are no size restrictions but the control group now consists of
family firms. Foundation ownership is a dummy variable equal to 1 if the largest owner is an
industrial foundation and 0 otherwise. The following control variables are included but not
reported: Ln(total assets); Ln(number of employees); Performance, the ratio of earnings
before interest and taxes over total assets; Negative earnings, a dummy variable equal to 1 if
EBIT is negative and 0 otherwise; (Foundation ownership*negative earnings), an interaction
variable between the dummy for foundation ownership and the dummy for negative earnings;
Industry and Year dummies. All models are estimated as pooled OLS models with standard
errors clustered at the firm level and corrected for heteroscedasticity. Robust standard errors
are reported in the parentheses. *** p<0.01, ** p<0.05, * p<0.1.
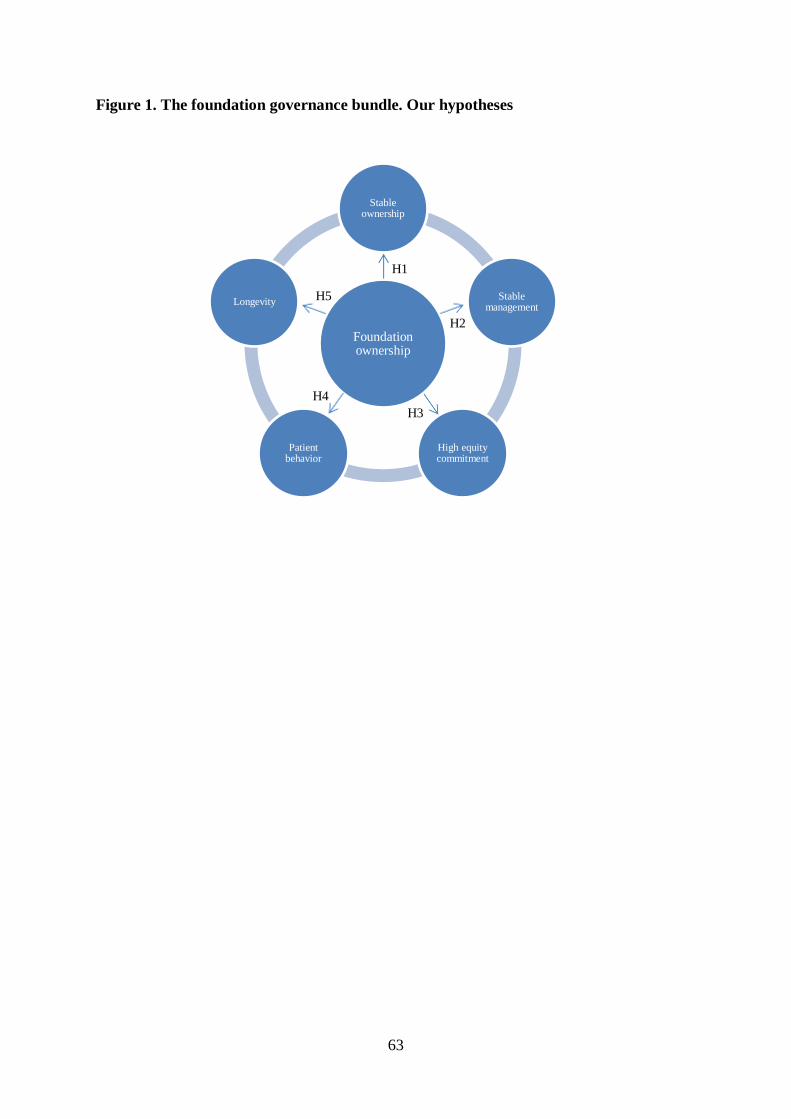
63
Figure 1. The foundation governance bundle. Our hypotheses
Foundation ownership
Stable ownership
Stable management
High equity commitment
Patient behavior
LongevityH5
H3
H2
H4
H1
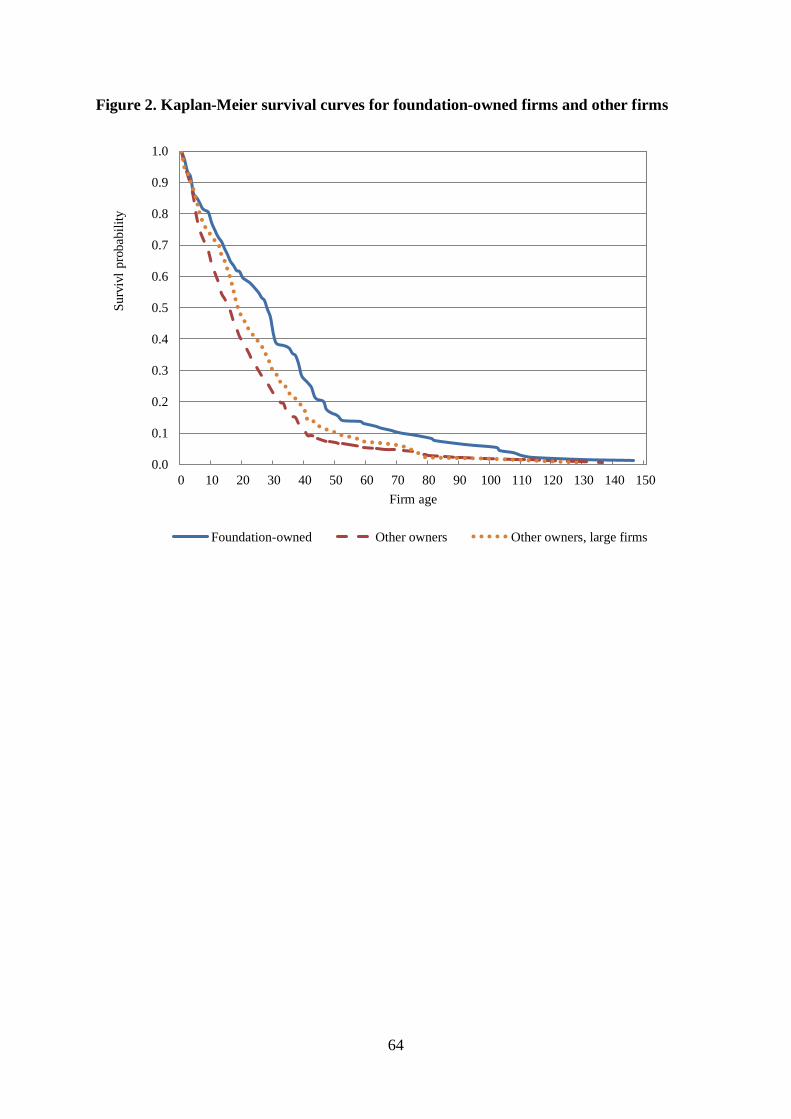
64
Figure 2. Kaplan-Meier survival curves for foundation-owned firms and other firms
0.0
0.1
0.2
0.3
0.4
0.5
0.6
0.7
0.8
0.9
1.0
0 10 20 30 40 50 60 70 80 90 100 110 120 130 140 150
Surv
ivl
pro
bab
ilit
y
Firm age
Foundation-owned Other owners Other owners, large firms