development of a long-term plan to help nys owners scale ... · a long-term plan to help nys owners...
TRANSCRIPT

Development of a Long-Term Plan to Help NYS Owners Scale
Up Deep Energy RetrofitsFinal Report
February 2017 Report Number 17-03

NYSERDA’s Promise to New Yorkers: NYSERDA provides resources, expertise, and objective information so New Yorkers can make confident, informed energy decisions.
Mission Statement:Advance innovative energy solutions in ways that improve New York’s economy and environment.
Vision Statement:Serve as a catalyst – advancing energy innovation, technology, and investment; transforming
New York’s economy; and empowering people to choose clean and efficient energy as part
of their everyday lives.

Development of a Long-Term Plan to Help NYS Owners Scale Up Deep Energy Retrofits
Prepared for:
New York State Energy Research and Development Authority
Albany, NY
Robert Carver Project Manager
Prepared by:
Steven Winter Associates
New York, NY
Heather Nolen Senior Energy Consultant
Bryan Simpson Mechanical Engineer
Jamie Kleinberg
Energy Engineer
NYSERDA Report 17-03 NYSERDA Contract 34935 February 2017

ii
Notice This report was prepared by Steven Winter Associates in the course of performing work contracted
for and sponsored by the New York State Energy Research and Development Authority (hereafter
“NYSERDA”). The opinions expressed in this report do not necessarily reflect those of NYSERDA
or the State of New York, and reference to any specific product, service, process, or method does not
constitute an implied or expressed recommendation or endorsement of it. Further, NYSERDA, the
State of New York, and the contractor make no warranties or representations, expressed or implied,
as to the fitness for particular purpose or merchantability of any product, apparatus, or service, or
the usefulness, completeness, or accuracy of any processes, methods, or other information contained,
described, disclosed, or referred to in this report. NYSERDA, the State of New York, and the contractor
make no representation that the use of any product, apparatus, process, method, or other information will
not infringe privately owned rights and will assume no liability for any loss, injury, or damage resulting
from, or occurring in connection with, the use of information contained, described, disclosed, or referred
to in this report.
NYSERDA makes every effort to provide accurate information about copyright owners and related
matters in the reports we publish. Contractors are responsible for determining and satisfying copyright
or other use restrictions regarding the content of reports that they write, in compliance with NYSERDA’s
policies and federal law. If you are the copyright owner and believe a NYSERDA report has not properly
attributed your work to you or has used it without permission, please email print @nyserda.ny.gov.
Information contained in this document, such as web page addresses, are current at the time of
publication.
Preferred Citation New York State Energy Research and Development Authority (NYSERDA). 2016. “Development of
a Long-Term Plan to Help NYS Owners Scale Up Deep Energy Retrofits” NYSERDA Report Number 17-03. Prepared by Steven Winter Associates, New York, NY. Nyserda.ny.gov/publications

iii
Table of Contents Notice ........................................................................................................................................ ii
Preferred Citation ..................................................................................................................... ii
List of Figures .......................................................................................................................... v
List of Tables ............................................................................................................................vi
Executive Summary ............................................................................................................ ES-1
1 Introduction ....................................................................................................................... 1
1.1 Background ................................................................................................................................... 2 1.1.1 Current Building Conditions and Capital Planning ................................................................ 2
1.2 2016–2020 Five Year Capital Plan ............................................................................................... 5 1.2.2 Highlights from the capital plan that relate to energy conservation ...................................... 5
1.2.2.1 Facade and Roof Work: ($319 Million) ................................................................................. 5 1.2.2.2 Comprehensive Renovation: ($301 million) .......................................................................... 5 1.2.2.3 Energy Performance Contracts ($100 Million) ...................................................................... 6 1.2.2.4 Lighting Security Measures: ($55.5 Million) .......................................................................... 6 1.2.2.5 Heating and Plumbing: ($13 million) ..................................................................................... 6 1.2.2.6 Superstorm Sandy Damage Remediation ($3 Billion) .......................................................... 7 1.2.2.7 Physical Needs Observed On Site ........................................................................................ 7
2 Methodology ..................................................................................................................... 8
2.1 Step 1: Utility Analysis ................................................................................................................... 8 2.2 Step 2: Typology Analysis ........................................................................................................... 10 2.3 Step 3: Site Visits ........................................................................................................................ 14 2.4 Step 4: Energy Measure Selection.............................................................................................. 15 2.5 Step 5: Energy Modeling ............................................................................................................. 17
3 Results Energy Conservation Measures ........................................................................21
3.1 Portfolio Wide Measure Descriptions .......................................................................................... 23 3.1.1 HVAC .................................................................................................................................. 23
3.1.1.1 Low Flow Water Fixtures..................................................................................................... 23 3.1.1.2 Pipe Insulation ..................................................................................................................... 24
3.1.2 Envelope ............................................................................................................................. 24 3.1.2.1 Air Sealing (including weather-stripping) ............................................................................ 24 3.1.2.2 Wall & Roof Insulation ......................................................................................................... 24 3.1.2.3 Window Replacement ......................................................................................................... 25
3.1.3 Electrical .............................................................................................................................. 25

iv
3.1.3.1 Lighting Fixtures & Controls ................................................................................................ 25 3.1.3.2 Sub-Metering ....................................................................................................................... 26 3.1.3.3 EnergyStar® Appliances ...................................................................................................... 26 3.1.3.4 Photovoltaics ....................................................................................................................... 27
3.2 Steam Specific Measure Descriptions ........................................................................................ 27 3.2.4 Mid- & High-Rise Two Pipe Steam Buildings: ..................................................................... 28
3.2.4.1 Distribution Upgrades: Orifice Plates, Thermostatic Radiator Valves (TRVs), Radiant Barriers .............................................................................................................................. 29 3.2.4.2 Boiler/Burner Upgrade & Controls ...................................................................................... 30 3.2.4.3 Elevator Vent Sealing.......................................................................................................... 31 3.2.4.4 Combined Heat and Power (CHP) ...................................................................................... 32
3.2.5 Low-Rise One Pipe Steam Buildings .................................................................................. 32 3.2.5.1 Steam to Hydronic Conversion ........................................................................................... 32
3.2.6 Hydronic Specific Measure Descriptions ............................................................................ 33 3.2.6.1 Boiler Upgrades—Condensing Boiler ................................................................................. 34 3.2.6.2 Thermostatic Radiator Valves ............................................................................................. 35 3.2.6.3 Variable Frequency Drives & Premium Motors ................................................................... 35 3.2.6.4 Elevator Vent Sealing.......................................................................................................... 36
4 Savings Projections .........................................................................................................37
4.1 Mid- and High-Rise Two Pipe Steam Buildings .......................................................................... 37 4.2 Low-Rise One Pipe Steam Buildings .......................................................................................... 40 4.3 Hydronic Buildings ...................................................................................................................... 42
5 Non-energy Benefits ........................................................................................................44
6 Projected Capital Costs and Energy Savings ................................................................46
7 2030 and Beyond .............................................................................................................47
8 Glossary of terms ............................................................................................................48
Appendix A: Typology distribution by development count and square footage for entire NYCHA portfolio ................................................................................................... A-1
Appendix B: Projected Savings by Measure ....................................................................... B-1
Appendix C: Full Cost and Savings ..................................................................................... C-1
Appendix D: Site Descriptions ............................................................................................. D-1

v
List of Figures Figure 1. NYCHA's existing and projected energy use compared to NYC goals ......................... 2 Figure 2. Impact of NextGen NYCHA on the total capital needs as of 2015 ............................... 4 Figure 3. The cost of NYCHA’s utilities has varied compared to usage ...................................... 6 Figure 4. Median heat slope over 10-year period ....................................................................... 8 Figure 5. Median domestic hot water intensity over ten-year period ........................................... 9 Figure 6. Median electric intensity over ten-year period ............................................................. 9 Figure 7. Total energy use breakdown by end use ....................................................................10 Figure 8. Electric energy use breakdown by end use ................................................................10 Figure 9. NYCHA portfolio sorted by building characteristic—boiler plant configuration ............12 Figure 10. NYCHA portfolio sorted by building characteristic—building height ..........................13 Figure 11. NYCHA portfolio sorted by building characteristic—space heating
distribution type .............................................................................................................13 Figure 12. NYCHA typologies sorted by quantity and size, used for final analysis with
3% of the portfolio (by square footage) removed due to undefined characteristics ........14 Figure 13: Higher surface to volume ratio at Farragut Houses ..................................................16 Figure 14. NYCHA Steam Mid/High-Rise heating usage compared to similar buildings ............18 Figure 15. NYCHA Steam Low-Rise heating usage compared to similar buildings ....................18 Figure 16. NYCHA Hydronic heating usage compared to similar buildings ................................19 Figure 17. NYCHA Steam electricity usage compared to similar buildings ................................19 Figure 18. NYCHA Hydronic electricity usage compared to similar buildings ............................20 Figure 19. Illustration of locations where portfolio-wide energy conservation measures
are implemented ............................................................................................................23 Figure 20. Example two-pipe steam radiator .............................................................................27 Figure 21. Example one-pipe steam convector .........................................................................28 Figure 22. Illustration of mid- & high-rise typology .....................................................................28 Figure 23. Illustration of low-rise steam typology .......................................................................31 Figure 24. Illustration of hydronic typology ................................................................................33 Figure 25. Potential energy savings by end use for mid- to high-rise steam typology ................39 Figure 26. Potential energy savings by energy conservation measure for mid- to
high-rise steam typology ...............................................................................................39 Figure 27. Potential energy savings by end use for low-rise steam typology .............................41 Figure 28. Potential energy savings by energy conservation measure for
low-rise steam typology .................................................................................................41 Figure 29. Potential energy savings by end use for hydronic typology ......................................43 Figure 30. Potential energy savings by energy conservation measure for the hydronic
typology .........................................................................................................................43

vi
List of Tables Table 1. NYCHA capital needs in billions of dollars, based on the 2011 Physical
Needs Assessment......................................................................................................... 2 Table 2. NYC annual cooling degree days (CDD) .....................................................................10 Table 3. NYCHA site visit classifications ...................................................................................15 Table 4. Evaluated energy conservation measures ...................................................................22 Table 5. Cost, savings, and simple paybacks ............................................................................46 Table 6. NYCHA's existing and projected energy use compared to NYC goals .........................47

ES-1
Executive Summary Steven Winter Associates, Inc. (SWA) proposed to develop a plan for multifamily building owners
to scale up deep energy retrofits (DERs) in as resource efficient a manner as possible by working in
partnership with New York City Housing Authority (NYCHA), the largest landlord in NYS. From a
technical standpoint, the NYCHA portfolio is arguably a very rational starting point for scaling up
DER’s in NYS. NYCHA is a long-term owner and is invested in maintaining the portfolio for years
to come. NYCHA has capital needs in excess of $29.9 billion, based on the 2011 Physical Needs
Assessment, and a particular desire for resiliency upgrades, which are recognized by many as a
potential catalyst for energy efficiency work. Now is the time to plan and address capital needs
alongside energy efficiency and resiliency goals. Many of the technical challenges and opportunities
relevant to NYCHA’s 2,600 building portfolio are also relevant to the broader market of large multifamily
buildings.
Portfolio-wide DERs examined in the full report analysis, is projected to cost $3.3 billion. This work
would result in $300 million in estimated annual savings, with a simple payback of 11 years. Some of
the work scopes currently planned or underway overlap with our recommendations, however, the full
recommended scope of work is not proposed at each site due to capital funding and higher priorities.
The amount of work that can be accomplished by 2020 and what funding is available for additional
energy work between 2020 and 2030 need to be assessed.
NYCHA buildings have long been held in a different category from other New York City multifamily
buildings. NYCHA buildings are beginning to comply with Local Law 84 (requiring annual reporting
of energy and water consumption) and Local Law 87 (requiring an energy audit and retro-commissioning
of base building system every 10 years). When examining the median energy use intensity of NYCHA
buildings compared to the city-wide median energy use intensity for multifamily buildings in 2014,
NYCHA consumes 46% more energy.

ES-2
Figure 1. NYCHA's existing and projected energy use compared to NYC goals
The City has set a target goal of a 30% reduction in energy use from buildings by 2030 and a
50-60% reduction by 2050. This translates to a 65-70% reduction goal by 2050 for NYCHA buildings
if they wanted to align their energy use with the NYC median buildings.
If all of the energy conservation measures analyzed in this report are implemented, NYCHA could reduce
its median energy usage by an estimated 42% by 2030. This will be difficult to achieve, and the NYCHA
median will still lag behind the projected 2030 NYC median by 20%. Reaching the deeper reduction goal
of 65-70% will require an even larger lift and possibly a shift in technology.
The path to reduction starts with addressing energy use at high-intensity users and will then need
to address nearly all of NYCHA properties. From an analysis of the entire NYCHA portfolio, three
typologies were found to be most representative: mid- and high-rise steam, low-rise steam, and hydronic.
Fourteen properties in the NYCHA portfolio that best represent the three typologies were selected for site
inspections. Post site visits, one property representing each type was selected to model existing conditions
and projected energy savings measures were applied to each typology and sorted into two overarching
categories: measures that are applicable to all typologies, referred to as portfolio-wide measures, and
measures that are applicable to specific typologies, referred to as typology-specific measures. The
projected cost and savings were calculated for each typology on a per unit basis, with simple

ES-3
paybacks found to be within the range of 9.4 to 15.6 years. When examining the weighted median
savings scaled up to the whole NYCHA portfolio, the median EUI after implementation of the projected
measures would reduce NYCHA’s EUI by 42%. This exceeds the city goal of a 30% reduction of EUI
by 2030, provided that NYCHA can implement the measures in the next 14 years. The difference
between NYCHA’s median EUI and the median NYC multifamily building would reduce from
46% to 20% in 2030 if NYCHA implements the measure identified and energy use in the median
City multifamily building is reduced by 30%.

1
1 Introduction The New York City Housing Authority (NYCHA) is the largest public housing authority in the nation,
serving 1 in 14 New York City residents. As a critical resource for some of New York City’s most
vulnerable populations, NYCHA is committed to a vision of healthy, safe, comfortable homes. Despite
this vision, NYCHA has suffered from systematic disinvestment from the federal government, combined
with an aging building stock as 60% of the properties are over 50 years old. In order to retain public
housing for NYCHA’s current population, including 77,000 seniors and 110,000 children, and preserve
the housing stock for future generations, NYCHA leadership must be strategic with limited capital.
A plan to revitalize NYCHA must touch upon many different facets of a resident’s needs. For a
comfortable, healthy home, improvements to the building envelope and ventilation system are
necessary to improve indoor air quality. Mold, a common problem in many NYCHA properties,
must be eradicated through the use of resistant construction techniques including wall materials
and ventilation systems. Addressing these areas contribute to integrated pest management, which
reduces the occurrence of pests instead of using toxic extermination materials. For a safe and durable
home, resiliency measures are crucial for residents to shelter in place or at local facilities. Many
buildings in the NYCHA portfolio are still damaged by Superstorm Sandy, which ravaged New
York in 2012. Finally, to ensure that rent remains affordable, energy conservation measures are
essential in reducing operating costs.
From a technical standpoint, the NYCHA portfolio is a rational starting point for scaling up Deep
Energy Retrofits (DERs) in New York State. NYCHA is a long-term property owner and is invested
in maintaining the portfolio for years to come. NYCHA has capital needs in excess of $29.9 billion,
based on the 2011 Physical Needs Assessment, and a particular desire for resiliency upgrades, which
are recognized by many as a potential catalyst for energy efficiency work. Now is the time to plan and
address capital needs alongside energy efficiency and resiliency goals. Many of the technical challenges
and opportunities relevant to NYCHA’s 2,600 building portfolio are also relevant to the broader market
of large multifamily buildings.

2
DERs are expensive to implement and in most cases not cost effective by the typical metrics used to
assess stand-alone energy retrofit projects. DERs can only be realistically implemented if coordinated
with other planned capital work and/or strategically targeted to the most underperforming buildings.
Scaling up DERs can only happen if a methodology for rationally analyzing opportunities across a
portfolio of buildings and over time is developed compliant with how owners normally approach
allocation of resources.
1.1 Background
1.1.1 Current Building Conditions and Capital Planning
One of NYCHA’s highest priorities is addressing bulk water leakage in buildings. Water leakage further
degrades the buildings envelop, disrupts residents, and can cause indoor air quality and pest issues. Next,
NYCHA wants to address overdue operational issues and capital needs in order to return properties to
top operational order. Reaching that goal is difficult due to unmet capital needs budgets, rising costs,
and growing repair lists.
A Capital/Physical Needs Assessment (PNA) is conducted every five years for the NYCHA portfolio, as
dictated by the U.S. Department of Housing and Urban Development (HUD), to determine portfolio-wide
capital needs. The last comprehensive PNA took place in 2006. In 2011, a small number of properties
were assessed in depth, and those results were extrapolated across the portfolio based on the previous
PNA. The 2011 PNA projected $16.6 billion in capital needs over the first five years, with an additional
$13.3 billion necessary beyond that timeframe. The overwhelming majority is associated with improving
apartment interiors and building exteriors, with the remainder related to mechanical, electrical, and
plumbing systems and other site concerns.1
Table 1. NYCHA capital needs in billions of dollars, based on the 2011 Physical Needs Assessment
First Year Years 2-5 Years 6-15 Beyond 15 Years
Total
$1.5 $15.1 $7.2 $6.1 $29.9
1 http://www1.nyc.gov/assets/nycha/downloads/pdf/transparency-pna-2011.pdf

3
Despite these needs, federal funding for NYCHA has fallen short by almost $2.5 billion in last 15 years.
Typical wear and tear, combined with the fact that more than 60 percent of NYCHA’s buildings are at
least 50 years old, has forced NYCHA to stretch resources sparsely across the portfolio. Capital funds
are spent only for selective upgrades at developments with the highest density of residents. Rebuilding
and repairs from Superstorm Sandy, which devastated many NYCHA developments, are the highest
priority for capital improvements. This is outlined in the latest capital plan for calendar years 2016–2020,
released in December 2015.2 These shortcomings have sometimes translated into lower quality of life for
residents.3
To address these deficiencies, NYCHA released a long-term strategic plan in May of 2015, known as
NextGeneration NYCHA, with a detailed roadmap to preserve public housing assets and improve the
resident experience.4 The Sustainability Agenda, an extension of NextGeneration NYCHA released in
April 2016 and covers sustainability initiatives in greater depth, proposes various strategies to reduce
the operating deficit and ensure healthy and comfortable homes.5 Major improvements in efficiencies
will be necessary, both administratively and in the way buildings are operated.
One example of an improvement in administrative efficiency relates to Local Law 87, which requires
energy audits and retro-commissioning for NYC buildings over 50,000 square feet. The work needed
to conform to several HUD programs, such as PNAs and Energy Performance Contracts (EPCs), will
be integrated with Local Law 87 compliance to reduce costs and staff resources. Energy audits that will
assess building systems and their energy consumption are needed to pursue EPCs with HUD and also
to comply with LL87. Retro-commissioning, which recommends ways to improve performance and
ensures equipment is operating as intended, will also be incorporated in the next PNA that is scheduled
to be completed in 2017. In addition, retro-commissioning becomes a regular part of inspection protocols
so that operational issues will be documented and corrected more frequently.6
2 https://www1.nyc.gov/assets/nycha/downloads/pdf/NYCHA-2016-2020-Capital-Plan-Narrative.pdf 3 https://www1.nyc.gov/site/nycha/about/sustainability.page 4 https://www1.nyc.gov/assets/nycha/downloads/pdf/nextgen-nycha-web.pdf 5 https://www1.nyc.gov/site/nycha/about/sustainability.page 6 Ibid.

4
A major goal of NextGeneration NYCHA and the Sustainability Agenda is to achieve short-term financial
stability and diversify long-term funding. From the $16.6 billion in current capital needs, the proposed
strategies will reduce that need by $6.1 billion, resulting in $10.5 billion in unmet capital needs. These
strategies include leveraging HUD programs for large-scale retrofits, federal funding, City capital, and
a comprehensive sustainability plan to reduce operating needs.
Figure 2. Impact of NextGen NYCHA on the total capital needs as of 2015
The capital planning strategy set forth in the Sustainability Agenda aims to ensure all capital
investment decisions are centered on data-driven, well-defined criteria based on four factors:
• Degree of building deterioration • Operational efficiency • Availability of underutilized, vacant land • Potential to leverage multiple funding sources
NYCHA analyzed each development in the portfolio according to these criteria to prioritize
improvements in drafting the 2016 five-year capital plan. The building improvement initiatives
address utilities cost, façade and roof repairs, heating, plumbing, security measures, and other
comprehensive capital renovations.7 This required alignment of all aspects of managing the
portfolio, including capital construction and daily maintenance and operation. Historically,
7 https://www1.nyc.gov/assets/nycha/downloads/pdf/NYCHA-2016-2020-Capital-Plan-Narrative.pdf
$16.58
$3.10 $1.70 $0.30 $0.98
$10.50
$- $2 $4 $6 $8
$10 $12 $14 $16 $18
Val
ue in
Bill
ions
($)
Capital Needs and Funding Sources

5
the capital planning and operations planning were handled separately at NYCHA. The new strategy
set forth in the Sustainability Agenda to more thoughtfully allocate funds based on well-defined
criteria intends to close that gap between capital planning and operations planning. These criteria
will also help to inform large-scale portfolio management and day-to-day decisions moving forward.8
1.2 2016–2020 Five Year Capital Plan
1.2.2 Highlights from the capital plan that relate to energy conservation
1.2.2.1 Facade and Roof Work: ($319 Million)
The plan proposes $319 million for exterior restoration and roof replacement, with a focus on remediating
Local Law 11 violations ($100 million) and mitigating the safety hazard of deteriorated brick façades.
The associated roof work will make the building envelopes weather tight to prevent future deterioration of
the brick facades. NYCHA will also seek capital support for a roof replacement program at developments
with the highest amount of leaks, mold, and painting requests. (Local Law 11 applies to buildings that are
six or more stories in height and addresses the dangers associated with deteriorating building facades.)
1.2.2.2 Comprehensive Renovation: ($301 million)
The proposed amount for comprehensive retrofits is $301 million and will include boiler replacement,
exterior restoration, roof replacement, exterior lighting, gas riser replacement, window replacement,
and water tank replacement. This funding is aimed to address critical conditions at the following
developments: Breukelen, Justice Sotomayor, Mitchel, Harlem River, and Dyckman.
• Breukelen – low-rise steam • Sotomayor Houses – mid-rise steam • Mitchel – high-rise steam (one of the developments analyzed as part of the study) • Harlem River – low-rise steam • Dyckman – mid-rise steam
8 https://www1.nyc.gov/assets/nycha/downloads/pdf/nextgen-nycha-web.pdf

6
1.2.2.3 Energy Performance Contracts ($100 Million)
Over the last 12 years NYCHA’s utility costs have more than doubled, even though usage has stayed
relatively the same. In 2014, NYCHA spent $577 million in utility costs, up from $268 million spent in
2002.9 Numerous energy efficiency and fuel conversion efforts were implemented to address these rising
costs, saving tens of millions of dollars, but much more is necessary. NYCHA has a plan to continue to
work with HUD’s EPC program to finance the upfront capital costs of improvements with the utility cost
savings they are projected to generate. In April 2015, HUD announced a series of NYCHA EPCs totaling
$100 million: the largest energy savings program of any public housing authority nationwide. By spring
of 2017, the project’s scope had tripled. One project underway includes $56 million for lighting, water
conservation and heating upgrades targeting nearly 20,000 apartments at 16 public housing developments
in Manhattan, Brooklyn, and the Bronx.
Figure 3. The cost of NYCHA’s utilities has varied compared to usage
1.2.2.4 Lighting Security Measures: ($55.5 Million)
In 2015, Mayor de Blasio allocated $55.5 million for exterior site lighting at 18 developments with
the highest crime rates.
1.2.2.5 Heating and Plumbing: ($13 million)
Boilers and ancillary heating systems are reaching and exceeding their useful lives. The plan
proposes $13 million for heating and plumbing work to reduce heating system failures.
9 Ibid.
Utilities Cost Utilities Usage
2002
2014

7
1.2.2.6 Superstorm Sandy Damage Remediation ($3 Billion)
Each of the 35 developments impacted by Superstorm Sandy will receive an average of $100 million in
funding, largely from the Federal Emergency Management Agency (FEMA). This funding is intended
not only to remediate damage from the storm, but for other necessary capital improvements. These
include replacing temporary oil boilers with higher-efficiency natural gas boilers and enhancing the
resiliency of the developments. This source of funding will allow NYCHA to invest its scarce capital
funds at other properties in need.10
1.2.2.7 Physical Needs Observed On Site
In the course of visiting NYCHA developments, failed equipment was commonly observed. In a few
of the campus developments the condensate return pumps were not working forcing the condensate to
be dumped, releasing clouds of steam. Due to the lack of condensate returned to the boiler room, large
quantities of fresh water were being fed into the boiler. Sufficient treatment was not confirmed during
our inspections. The lack of condensate return causing high use of fresh water serves as an example of
physical needs, waste, and the possibility for further equipment degradation. Without proper treatment,
fresh water can cause corrosion and damage to the boiler and lead to wet steam. Wet steam causes water
hammer, which increase resident complaints from clanging pipes. This serves as just one example of the
relationship between prolonged operational issues leading to additional needs.
10 Ibid.

8
2 Methodology Energy use data and building characteristics were analyzed for all 328 NYCHA housing developments.
Ten years of monthly energy use data was analyzed to determine heat slope (energy used for space
heating, BTU/SF/HDD); domestic hot water intensity (kBTU/SF); and electric intensity (kwh/SF).
Characteristics analyzed consisted of building size (square footage and height), location of the boiler
plant (to determine campus or stand-alone properties), and space heating distribution type. Using this
information, the main building typologies were identified, which guided the properties selected for
site visits.
2.1 Step 1: Utility Analysis
Trends in rolled up portfolio wide energy usage are depicted in Figures 4-6. A trend line for the
ten-year period has been added to visually show the energy use trend overtime.
Figure 4. Median heat slope over 10-year period
0
2
4
6
8
10
12
14
16
2004 2006 2008 2010 2012 2014 2016
Heat
Slo
pe (k
BTU
/SF/
HDD)
Space Heating Energy Usage

9
Figure 5. Median domestic hot water intensity over ten-year period
Figure 6. Median electric intensity over ten-year period
It should be noted that electric intensity was not weather-normalized, which could explain the fluctuation
in electric usage as whole building electric usage is represented here. However, energy used for space
cooling is only consumed in the units (when AC units are provided by the resident), common areas are
not cooled and cooling energy represents 14% of total electric usage (Table 2 shows cooling degree days
for the ten-year period, and Figure 7 shows the percentage of electric energy spend on cooling). Due to
the smaller percentage of properties with hydronic (hot water) space heating, only 8% of the NYCHA
portfolio based on square footage, the electric pumping energy used for space heating is not a factor.
0
1
2
3
4
5
6
7
8
2004 2006 2008 2010 2012 2014 2016
Elec
tric
Inte
nsity
(kw
h/SF
)
Electric Usage
0
5
10
15
20
25
30
35
40
2004 2006 2008 2010 2012 2014 2016
DHW
Inte
nsity
(kBT
U/S
F)
Domestic Hot Water Energy Usage

10
Table 2. NYC annual cooling degree days (CDD)
2005 2006 2007 2008 2009 2010 2011 2012 2013 2014 1474.4 1321.5 1469.7 1263.6 926.5 1617.2 1271.4 1383.5 1279.4 1087
Figure 7. Total energy use breakdown by end use
Figure 8. Electric energy use breakdown by end use
2.2 Step 2: Typology Analysis
In order to develop an energy retrofit program for the NYCHA portfolio, the properties needed to be
categorized. Certain measures only apply to specific types of buildings and systems, and it’s important
to concentrate on classifications which clearly separate these systems and allow strategic targeting of
large portions of the portfolio. Potential classifications can vary widely with such a large portfolio;
therefore several iterations were developed and analyzed before moving forward. SWA and NYCHA
came to an agreement that the best means of typifying properties were by the following characteristics:
Space Heating 54.8%
Domestic Hot Water 28.4%
Space Cooling 2.3%
Lighting 1.4%
Plug Loads/ Miscellaneous
13.1%
Energy Use Breakdown by End Use for a Mid/High-Rise Steam Development
Space Cooling 13.7%
Lighting 8.4%
Plug Loads/ Miscellaneous
77.9%
Electric Energy Use Breakdown by End Use for a Mid/High-Rise Steam Development

11
• Heating system distribution type
o Steam (two-pipe or one-pipe) o Hydronic (hot water) o Electric
• Building height
o Low-rise (<= 6 stories) o Mid-rise (> 6, =< 15 stories) o High-rise (> 15 stories)
• Campus configuration vs. individual stand-alone buildings (boiler serving more than one building is defined as a campus)
While building age is a common classification metric, the majority of the NYCHA portfolio (65% of
the units) were built within the same time frame, in the 1950s and 1960s. The majority, 85%, were
built prior to 1980, before the first energy code was developed. Building age was not considered as
an appropriate factor to distinguish typologies in the NYCHA portfolio. This is supported by a previous
analysis conducted for the NYCEEC Energy Savings Potential (ESP) tool, which revealed that for large
NYC multifamily buildings, age and energy use did not have strong correlations for the common building
age distinctions such as pre-war, post-war, and modern.
In an attempt to target typologies for analysis and site visits, SWA and NYCHA next evaluated the
portfolio based on the cumulative square footages of the various groups. This is contrary to the typical
approach of evaluating based on the number of properties within each typology, but the proceeding
figures illustrate why.
Figures 9-11 illustrate the difference between examining the portfolio based on property counts and
based on property size (using square footage). By using square footage, the significance of the
characteristic is shown. This weighted approach clearly shows how building size impacts the presence
of each type within the NYCHA portfolio. By weighing the types by square footage, the prominent
types stand out: a majority of NYCHA’s properties can be characterized as mid/high rise properties
with a central boiler plant that provides steam to the satellite buildings.

12
Based on this information, SWA prioritized the most prevalent typology mid- and high-rise properties
with steam heating for site visits and further analysis as it represents 70% of the portfolio. Analysis was
conducted on the three most prevent typologies: mid/high-rise steam; low-rise steam; and hydronic.
Appendix A provides an alternative graphical representation of the difference between sorting by
property count and square footage.
Figure 9. NYCHA portfolio sorted by building characteristic—boiler plant configuration
*Campus properties share a heating plant among multiple buildings, while single buildings each have their own heating plant.
59%
89%
38%
11%2%1%
0%
10%
20%
30%
40%
50%
60%
70%
80%
90%
100%
Property Count Square Footage
Portfolio Configuration Based on Heating Plants (Campus vs Single)
Not Defined
Equal Mix
Single Buildings
Campus Property

13
Figure 10. NYCHA portfolio sorted by building characteristic—building height
Figure 11. NYCHA portfolio sorted by building characteristic—space heating distribution type
53%
72%
43%
28%
4%
0%
10%
20%
30%
40%
50%
60%
70%
80%
90%
100%
Property Count Square Footage
Portfolio Configuration Based on Building Height
Equal Mix
Low-Rise
Mid- and High- Rise
68%
92%
23%
8%8% 1%
0%
10%
20%
30%
40%
50%
60%
70%
80%
90%
100%
Property Count Square Footage
Portfolio Configuration Based on Space Heating Distribution Type
Equal Mix
Undefined
Hydronic
Steam

14
Figure 12. NYCHA typologies sorted by quantity and size, used for final analysis with 3% of the portfolio (by square footage) removed due to undefined characteristics
2.3 Step 3: Site Visits
Using the identified typologies groups NYCHA was able to select properties for SWA auditors to visit.
Site visits consisted of inspections and interviews with building staff. Inspection areas included: the
roof, sample residential units, common areas, boiler rooms, and mechanical rooms. Interviews included
speaking with property managers, caretakers, and heating plant technician staff about normal operations
and energy use.
22% 22%
53%
70%
25%
8%
0%
10%
20%
30%
40%
50%
60%
70%
80%
90%
100%
Property Count Square Footage
Final Typology Configuration
Hydronic
Mid/High-Rise Steam
Low-Rise Steam

15
Table 3. NYCHA site visit classifications
NYCHA Development Heating Configuration Single/Campus Building Height
Armstrong II Hydronic Campus Low-Rise
Audubon Steam Single Mid- & High-Rise
Borinquen Electric Campus Mid- & High-Rise
Coney Island 4 & 5 Steam Single Mid- & High-Rise
Coney Island Site 8 Steam Single Mid- & High-Rise
Farragut Steam Campus Mid- & High-Rise
Gowanus Steam Campus Mid- & High-Rise
Marcy Steam Campus Low-Rise
O’Dwyer Gardens Steam Campus Mid- & High-Rise
Palmetto Hydronic Single Low-Rise
Pelham Parkway Steam Campus Low-Rise
Smith Steam Campus Mid- & High-Rise
Surfside Gardens Steam Campus Mid- & High-Rise
Washington Hydronic Single Low-Rise
2.4 Step 4: Energy Measure Selection
Energy conservation and efficiency measures were selected based on SWA experience auditing similar
properties and based on information gathered during the site inspection. 94% of NYCHA’s residents
do not pay separate utility bills, rather utility costs are included in their rent. In cases where residents
directly pay a utility bill there are two categories of measures—those that reduce the owners utility bills
(i.e., boiler improvements) and those that reduce the residents utility bills (i.e., in-unit lighting). Without
this barrier all applicable common area and in-unit measures were analyzed.
The distinction in the building typologies is mainly the space heating distribution type, which results
in different applicable measures based on the space heating type. This led to the distinction of two main
types of measures: those applicable to the whole NYCHA portfolio and those applicable to the individual
typologies based on the heating system type.

16
Across the NYCHA portfolio differences in building layouts were observed. Some properties have a
geometric layout others were planned to appear in an almost random fashion. Some have an “X” or
cross layout, Farragut has five wings which leads to a higher surface to volume ratio. Properties with
a higher ratio have higher projected energy savings.
Figure 13: Higher surface to volume ratio at Farragut Houses
Given that space heating is the largest energy end use for NYC multifamily buildings, as shown for
a sample NYCHA property in Figure 7 and reported in One City Built to Last: Technical Working
Group Report, a focus was placed on reducing heating usage.11 Reducing energy used for space heating
also improves comfort as NYCHA properties are known for rampant over-heating. Residents are used
to having warm units and commonly keep their windows open in the winter to alleviate the heat. If the
space heating temperature is reduced within the units, it will need to be gradually decreased and
accompanied by resident education and training.
Portfolio-wide measures can be scaled across the entire portfolio. For example, with stairwell
lighting, quantities of lighting fixtures vary based on building characteristics, however, the
common recommendation of upgrading to LED with occupancy controls is recommended.
11 http://www1.nyc.gov/assets/sustainability/downloads/pdf/publications/TWGreport_04212016.pdf

17
Scalability is also seen in the typology recommendations as there is a limited number of typologies
with one typology representing a significant portion of the portfolio; 92% of the portfolio has steam
distribution systems, made up of largely two-pipe steam systems (70%) and some one-pipe steam systems
(22%). Upgrades can be piloted in sample properties and scaled up to the entire applicable typology.
For analysis, it was projected that the measures would be installed by non-NYCHA staff. As reported
by NYCHA on-site building staff numbers have been declining over time. Central office staff, whose
functions support property management, decreased 26 percent from 2002 to 2010.12 Heating technicians,
whose functions are crucial in the operation and maintenance of heating equipment, have decreased in
numbers by 42% from 2000 to 2015.13 As evident during our inspections the current staff is busy and
not always looking for their loads to be increased.
The last measure criteria used was limiting the analysis to available technologies that are common in
the market-place or have been proven and technologies that would not be disruptive to residents. This
means that newer technologies such as energy storage batteries that are currently piloted in multifamily
buildings were not included in the analysis. An example of a less disruptive measure is exterior wall
insulation, in which wall insulation is applied to the building exterior as opposed to the interior in order
to avoid moving or disrupting residents. We did model savings from heating plant conversions and new
windows which would be disruptive to some extent, but would not require vacating the space for a
period of time.
2.5 Step 5: Energy Modeling
Both TREAT and SWA’s own proprietary excel calculations were used to determine energy savings per
measure. Interactivity between the various energy conservation measures was accounted for. Projected
capital costs are based on industry knowledge, past experience and publicly available data sources.
12 https://www1.nyc.gov/assets/nycha/downloads/pdf/nextgen-nycha-web.pdf 13 Presentation at BuildingEnergy NYC 2015 on October 15, 2015

18
To set the starting point for each typology, NYCHA data was analyzed to determine the pre-retrofit EUIs
for the mid/high-rise steam, low-rise steam, and hydronic typologies. The following figures compare the
ten-year average heating energy and electricity consumption for each typology against other New York
City buildings with similar characteristics. Heat slope is defined as the energy used to heat the building,
normalized by floor area and weather. Annual owner paid electricity is defined as the total electricity
consumption paid by NYCHA, normalized by building size. Figures 14 through 18 show that in terms
of both heating and electricity usage, NYCHA properties consume more energy for heating and electricity
than other similar buildings.
Figure 14. NYCHA Steam Mid/High-Rise heating usage compared to similar buildings
Figure 15. NYCHA Steam Low-Rise heating usage compared to similar buildings
0
5
10
15
20
25
NYCHA Steam Mid/High-RiseHeat
Slo
pe (B
tu/S
F/HD
D)
Heating: Average NYCHA Steam Mid/High-Rise Compared to Similar Buildings in NYC
0
5
10
15
20
Heat
Slo
pe (B
tu/S
F/HD
D)
Heating: Average NYCHA Steam Low-Rise Compared to Similar Buildings in NYC
NYCHA Steam Low-Rise

19
Figure 16. NYCHA Hydronic heating usage compared to similar buildings
Figure 17. NYCHA Steam electricity usage compared to similar buildings
0
5
10
15
20
25
Heat
Slo
pe (B
tu/S
F/HD
D)
Heating: Average NYCHA Hydronic Compared to Similar Buildings in NYC
NYCHA Hydronic
02468
10
Annu
al O
wne
r-Pa
id E
lect
ricity
(k
Wh/
SF)
Owner-Paid Electricity: NYCHA Steam Typologies Compared to Similar Buildings in NYC
NYCHA Steam Low-Rise
NYCHA Steam Mid/High-Rise

20
Figure 18. NYCHA Hydronic electricity usage compared to similar buildings
0
1
2
3
4
5
Annu
al O
wne
r-Pa
id E
lect
ricity
(k
Wh/
SF)
Owner-Paid Electricity: NYCHA Hydronic Compared to Similar Buildings in NYC

21
3 Results Energy Conservation Measures At the heart of DERs are the individual energy conservation measures (ECMs), which add up to the
target energy savings. The goal of this analysis is to identify ECMs for the various typologies that can
be applied across those groups to save significant energy (and improve the comfort and resiliency of the
properties in the process). SWA used their knowledge of applicable ECMs, alongside NYCHA property
visits and energy modeling analysis, to develop the list of measures by typology, as shown in Table 4. It
is important to note that some measures are applicable to every typology, and thus should be considered
at the portfolio scale. The subsequent sections of this report will expand upon the process of determining
which measures were applicable to each typology, the potential energy savings through each measure,
descriptions of what these measures are and how they are implemented, and the cost and savings
associated with each measure.

22
Table 4. Evaluated energy conservation measures
Applicable to all buildings within the category
Applicable to specific buildings with the category
(i.e., solar works best with low, wide buildings)
HydronicMeasures
Portfolio-Wide HVAC MeasuresLow Flow Plumbing FixturesPipe InsulationPortfolio-Wide Envelope MeasuresAir SealingExterior Wall insulationRoof Insulation Incremental
Window Replacement Incremental
Portfolio-Wide Electrical Measures
Lighting Upgrades (LEDs & Controls)Incremental for exterior lighting
Sub-meteringEnergyStar® Appliances Incremental
Solar PhotovoltaicsTypology-Specific Measures
Steam Boiler Upgrade with Balancing & ControlsIncremental for EUL boiler replacement
Hydronic Boiler Upgrade Incremental
Steam to Hydronic Boiler ConversionCHPVariable Flow Devices & Premium MotorsElevator Vent Sealing
Steam
Low-Rise Mid- and High-Rise
All Cost Noted if Incremental
<6 year simple payback6<10 year simple payback10+ year simple payback
* Campus vs. single property measures were not differentiated for the purposes of this study. The majority of measures are applicable to both types, and are more dependent on the heating type and building height.

23
3.1 Portfolio Wide Measure Descriptions
Figure 19. Illustration of locations where portfolio-wide energy conservation measures are implemented
The following measures can be applied to all NYCHA properties, regardless of typology. They apply to
equipment that all buildings share, such as lighting, envelope, water, and electric metering configuration.
Several of these upgrades are considered low-hanging fruit within the building science community, e.g.,
low-flow water fixtures, common area lighting, pipe insulation, and EnergyStar® appliances, since the
points of installation are easily accessible and maintenance staff can normally carry out the upgrade.
3.1.1 HVAC
3.1.1.1 Low Flow Water Fixtures
A commonly recommended energy efficiency upgrade is the installation of water-conserving sink,
shower, and toilet fixtures. These fixtures reduce the amount of water that comes out of the fixture
(typically one to two gallons per minute [GPM] or per flush), thus saving water as well as the heating
fuel used to heat hot water. The EPA’s WaterSense® program identifies water fixtures, which meet
such low flow guidelines. Models are also available in tamper-proof styles that are more difficult for
tenants to remove, should this be an issue.

24
3.1.1.2 Pipe Insulation
Pipe insulation is typically considered a low-hanging fruit for energy savings in buildings with pipes
moving hot fluids. Installation is straightforward, can be done by building staff, and will only need to
be carried out or maintained every two or three decades. This has become one of the mandates of energy
codes, as just a few inches of insulation on pipes can dramatically reduce the amount of energy lost.
3.1.2 Envelope
3.1.2.1 Air Sealing (including weather-stripping)
Air sealing is one of the largest targets for energy efficiency. Comprehensive air sealing shows a
reduction in heating costs by as much as 40% in old, leaky buildings.14 This measure would be taken
partly in conjunction with insulation (there are roofing and wall insulation practices, such as building
wraps or closed cell foams, which provide air sealing as well as thermal resistance), and partly as a
standalone measure. There are a myriad of air sealing opportunities at NYCHA properties, including
caulking cracks and service pipe penetrations within apartments, gasketing outlets and cover plates,
weather-stripping both interior and exterior doors, upgrading windows to more airtight designs, and so on.
Not only do these practices save energy, but there are co-benefits of improving resident comfort,
resiliency, and durability. Air sealing improves comfort by reducing draftiness and odor/pest migration
between apartments. In addition, sealing vents in low-lying flood areas, as well as sealing around gaps
in windows and air conditioning units, can reduce wind-driven rain. These measures also reduce air
infiltration and exfiltration, which stabilizes interior temperatures. This is particularly important in
the event of a power outage, and may allow residents to shelter in place for longer periods of time.15
3.1.2.2 Wall & Roof Insulation
The majority of the NYCHA portfolio was built during a time when insulation was not a primary concern
during construction (and certainly not required by building codes in the manner it is today). As such, most
buildings do not have adequate thermal resistance to prevent the loss of heat through conduction to the
outdoor environment. SWA analyzed the possibility of fully wrapping buildings with exterior insulation,
14 http://www.energystar.gov/ia/home_improvement/home_sealing/AirSealingFS_2005.pdf 15 http://urbangreencouncil.org/babyitscoldinside

25
as this would provide a continuous layer of insulation for each building. Interior insulation was also
evaluated, but issues arise with “thermal bridging” (areas where insulation cannot be installed, which
act as weak spots for heat to leak through) and occupant disruption making exterior insulation the
favorable option.
3.1.2.3 Window Replacement
A poorly designed window is a weak point for air tightness and thermal resistance. Old designs used
metal frames (without any thermal breaks or gasketing for air tightness) with one or two panes and
no special coatings. High-performance windows now include new materials (such as vinyl with
thermal breaks to greatly improve the insulation value of the window) with three panes and special
coatings to reduce the amount of heat lost to radiation. Although they are not the largest energy saver
when compared with other portfolio-wide measures, they are applicable to every building and a highly
sought after measure according to tenants interviewed during the site visits.
3.1.3 Electrical
3.1.3.1 Lighting Fixtures & Controls
A frequently cited low-hanging fruit in energy audits is upgrades to lighting. Recent advances in
technology, as well as the market acceptance of said technology, have made the procurement and
installation of new lighting affordable and easy to manage. SWA’s audit of the NYCHA portfolio
found prevalent use of fluorescent tube lighting, notably the older variety that uses larger lamps and
older ballasts (the electrical fixture which powers the lamp) which was on 24/7 in common areas.
Upgrading these lights to modern LED fixtures with controls to automatically switch them on/off
depending on need would save money and electricity. LED fixtures also typically have a longer
lifetime than fluorescent tubes, meaning the fixtures will be replaced less often, reducing the burden
on maintenance staff.
In terms of resiliency, it is recommended new lighting systems in common areas are installed with
fixtures that have battery backup. This feature is not common in current lighting schemes across the
NYCHA portfolio. It is particularly important in stairwells so residents can safely exit and enter the
building during a power outage.

26
3.1.3.2 Sub-Metering
Sub-metering is the practice of monitoring individual apartments for electricity usage, then charging
each apartment for said usage. The majority (94%) of NYCHA properties are currently master-metered,
which implies that the building pays for all electricity consumption. Tenants have no incentive for
using less electricity since their bill won’t change, and thus tend to use electricity excessively. Enterprise
Community Partners sampled 62 NYCHA developments in Brooklyn and found that master-metered
developments used four times the amount of electricity as direct-metered developments.16 (Direct-
metering is when the utility company bills tenants directly, while sub-metering is when the owner
receives a single bill from the utility company, and charges each apartment for their usage.) Other
recent studies show switching from master-metering to sub-metering can result in a 10% reduction in
tenant electricity usage.17 This measure will also encourage occupants to use energy-efficient lighting
and appliances, given the effect on electricity bills. In the case of NYCHA tenants, sub-metering will
encourage them to purchase energy-efficient lighting and window air conditioners and use them
efficiently.
Savings from sub-metering are not applied to the hydronic typology, as an analysis of the NYCHA
data found that 81% of hydronic developments are already direct-metered. However, sub-metering
may still be relevant to the hydronic developments that are master-metered.
3.1.3.3 EnergyStar® Appliances
The Environmental Protection Agency’s (EPAs) EnergyStar rating program gives high efficiency
appliances (i.e., refrigerators, air conditioners, etc.) a rating by which to recognize them over less
efficient alternatives. Converting in-unit appliances to products which meet these standards would
reduce electricity consumption and operational costs. SWA only considered refrigerators in this study,
but there are many other products such as air conditioners and washers that could also be considered.
16 https://www1.nyc.gov/assets/nycha/downloads/pdf/NGN-Sustainability.pdf, page 86 17 http://syracusecoe.org/gpe/images/allmedia/LivableNewYork/Sub-MeteringforElectricity.pdf

27
3.1.3.4 Photovoltaics
The last portfolio-wide measure considered was solar panels, as any property with available roof or
ground space can apply them. Solar panels offset electricity consumption by converting solar energy
to electricity. The effectiveness and applicability are property dependent, since exposure to sunlight
and ratio of available real estate to building size heavily affect the size of the system. Solar panels have
seen a meteoric rise in market penetration and affordability, and the future promises much the same.
3.2 Steam Specific Measure Descriptions
Certain heating specific measures are only applicable to buildings with steam heat. These are the
primary energy savers within the analysis performed due to steam heating’s prevalence within the
portfolio (90% of NYCHA square footage as per Figure 11) and the large savings potential associated
with heating upgrades (discussed further in the projected savings sections).
When discussing steam upgrades, a distinction must be made with regards to how the steam is distributed
in the building/property. Low-rise properties will tend to have a piping configuration known as one-pipe
steam, while taller properties will have a configuration known as two-pipe steam. These classifications
were a basis for the typology development that drove this analysis, therefore a more thorough definition
of these properties is necessary.
Figure 20. Example two-pipe steam radiator
Steam supply
Condensate return

28
Figure 21. Example one-pipe steam convector
3.2.4 Mid- & High-Rise Two Pipe Steam Buildings:
Typology characteristics:
• Building height: Greater than six stories • Boiler type: Steam • Heating distribution: Two pipe steam
Figure 22. Illustration of mid- & high-rise typology
Steam supply and condensate return
29
Two pipe steam systems use separate pipes for steam supply and condensate return, as shown in
Figure 20. This necessitates balancing between supply and return, normally through thermostatic
steam traps (though other options such as thermostatic radiator valves and orifice plates can do the
same while saving energy and reducing operations and maintenance). As such, this type of property
has a few measures that apply directly to it.
3.2.4.1 Distribution Upgrades: Orifice Plates, Thermostatic Radiator Valves (TRVs), Radiant Barriers
Steam heating systems are notoriously difficult to balance and maintain, and as such are prone to waste
energy and create comfort issues. Nowhere is this more prevalent than in New York City, where steam
heat is particularly established. Most two-pipe steam systems rely on steam traps at each radiator to
balance the system, but these traps fail much more frequently than they are inspected and/or replaced.
A trap that fails closed will result in a cold radiator, which is easily identified and fixed. A trap that
fails open is much more difficult to identify, and results in a loss of balance. These unbalanced systems
will overheat some apartments (and under heat others), and tenants in overheated apartments will
open windows in response to cool off. There are several methods for balancing these systems that
were evaluated and recommended as part of this study, the most promising is the installation of
orifice plates and thermostatic radiator valves (TRVs).
Orifice plates are small disks with a hole drilled in them that are installed at the inlet of the radiator
(in conjunction with the TRV in this case). The size of the hole is based on the heating capacity of the
radiator and is meant to condense all of the steam before it reaches the return piping. This form of static
balancing negates the need for radiator steam traps (though traps will still be needed in the boiler room)
and greatly lessens the inefficiency and maintenance of the system as a result.
The thermostatic radiator valve provides a means for tenants to control temperature by replacing the
radiator hand valve with an adjustable control. As temperature increases, the valve slowly closes to
further meter the amount of steam entering the radiator (past the baseline of the orifice plate). The
amount to which this valve closes is set by the tenant, giving them some autonomy in determining their
apartment temperature. Models are available which have a high limit setting to prevent tenants from
excessively heating their unit. The TRV provides the added benefit of closing radiators in mild weather,
thus reducing the time the boiler has to run.

30
Radiant barriers are also recommended for in-unit heat emitters to reduce heat loss to the outdoors.
When a radiator is filled with steam, some of the heat may be absorbed by the adjacent wall, reducing
heat output to the room. Radiant barriers are reflective materials installed between the heat-emitting
element and the wall, redirecting heat toward the room interior.
During site inspections, we noted that many distribution systems were in disrepair, specifically in vacuum
systems where the condensate was being sent to the sewer and replaced with new city water. This is an
egregious waste of water and energy and will lead to premature boiler failure, but this is outside the scope
of this report and will only be mentioned anecdotally. This was factored into the low efficiency of the
distribution system in the energy model, which will be discussed further in subsequent sections.
3.2.4.2 Boiler/Burner Upgrade & Controls
Many steam boilers/burners in pre- & post-war buildings are oversized and in need of replacement
with properly sized, modern alternatives. Oversized, antiquated boilers and burners house a plethora
of inefficiencies that waste considerable fuel, thus making boiler upgrades the largest energy saver
across the board in our analysis.
The expected lifetime of a boiler heating system (including controls, piping, insulation, exhaust,
condensate systems, etc.) ranges from 22 to 40 years depending on the configuration.18 In our
inspection of NYCHA properties, the boilers we inspected ranged from 20 to 37 years old, which
implies that many in the NYCHA portfolio are in need of inspection and replacement.
Key upgrades evaluated are:
• New boilers sized to appropriate heating load to improve efficiency and prevent short cycling. • Linkageless burners which adjust combustion components independently to maximize fuel
burning efficiency. • Burner modulation (in the case where it is not already installed) to vary heat output with
heating requirements. • Multi-sensor indoor heating controls to reduce heat when indoor temperature requirements
are satisfied.
18 https://www.fanniemae.com/content/guide_form/4099f.pdf

31
The target for boiler efficiency with a new steam boiler is annual fuel utilization efficiency (AFUE) of
85%. This number approximates how much energy is converted from fuel to heat, which is distributed to
the residences (discounting distribution losses) across the heating season. Old systems are approximated
to have an AFUE between 60% and 80%, depending on type. As a point of reference, upgrading a steam
system from an AFUE of 70% to 85% will result in ~17% energy and cost savings for that plant.19
Figure 23. Illustration of low-rise steam typology
3.2.4.3 Elevator Vent Sealing
In a recent SWA study it was found that the air leaking through uncapped holes at the tops of buildings
is a major source of heat, and energy, loss.20 In mid- and high-rise residential buildings and hotels, some
of the largest commonly found holes tend to be open vents at the top of elevator shafts and stairwells,
which are intended to vent smoke in the event of a fire. Code permissible options allow for the partial
or full closure of these vent openings, including the installation of smoke activated mechanical dampers
that open in the event of a fire.
19 http://energy.gov/energysaver/articles/furnaces-and-boilers 20 http://urbangreencouncil.org/spending

32
3.2.4.4 Combined Heat and Power (CHP)
Combined heat and power (CHP), also known as cogeneration, is the simultaneous production of
electricity and thermal energy (heat) in-house. CHP units are combustion appliances and require
sufficient gas service and venting. They also need thermal storage (i.e., water tanks) to act as a heat
battery. These space requirements and constraints can require discussion and an involved construction
process, but the benefits of CHP often outweigh these challenges.
3.2.5 Low-Rise One Pipe Steam Buildings
Typology characteristics:
• Building height: Less than or equal to six stories • Boiler type: Steam • Heating distribution: One pipe steam
One-pipe differs from two-pipe steam primarily in how the steam enters and leaves the radiators. The
supply steam and returning condensate both use the same pipe (with differing orientations depending
on the building age and construction practice). This is allowable in low buildings since the falling
condensate won’t gain too much speed (which can disrupt the rising steam) and the piping isn’t large
enough to be financially constraining. Each radiator also has an air vent to allow air out when steam
fills the system, and to allow air back in when the steam condenses. There are some comfort and noise
concerns with these systems, as a corroded air vent can lead to whistling sounds, and high velocity
steam colliding with pooling water can lead to loud banging, known as “water hammer.”
3.2.5.1 Steam to Hydronic Conversion
Steam heating is notoriously inefficient when compared to hot water heating, largely due to the
nuances of trying to control and balance steam. Issues that contribute to that inefficiency include
difficulty in locating steam pipe leaks (as compared to the obvious signs of water leaks).

33
This is why a conversion from steam to hydronic heating can lead to significant energy savings. All
of the above issues are redressed with hydronic heating. A 2010 study done by Taitem Engineering
for the ASHRAE Journal looked into the fuel savings predicted and realized by steam-to-steam and
steam-to-hydronic conversions and found that hydronic conversions could potentially save 30% to
40% of site energy. Steam-to-steam retrofits resulted in much more meager savings, from break
even to ~10%.21
The financial and logistical obstacles of converting must be considered, as well as the energy penalty
of installing pumps to distribute the water. Buildings with long pipe runs to the far rooms, such as in
tall buildings, will have more pipe friction to overcome and may not see as significant of savings after
taking the energy consumption of the pumps into effect.
3.2.6 Hydronic Specific Measure Descriptions
Typology characteristics:
• Building height: Any • Boiler type: Hot water • Heating distribution: Hydronic
Figure 24. Illustration of hydronic typology
21 https://www.ashrae.org/File%20Library/doclib/Journal%20Documents/2010%20May/20100426_014019_shapiro.pdf

34
Hydronic properties vary fundamentally from steam in the medium through which they heat units. These
buildings pump heated water (typically at 160°F, though lower temperatures are also common) around the
building as opposed to boiling steam. As discussed in the one-pipe steam section, this type of heating is
inherently more efficient and easier to control, but there are still large opportunities for efficiency gains.
Aside from the property-wide blanket measures, NYCHA properties do not utilize in-unit temperature
control and their pumping methods lack the sophistication necessary for optimum system performance.
3.2.6.1 Boiler Upgrades—Condensing Boiler
The same philosophy of upgrading boilers and burners for steam buildings can be applied to hydronic
heat buildings as well, but there is a contemporary option to consider as an alternative: condensing
boilers.
A condensing boiler captures the heat of the exhaust water vapor and uses it to pre-heat returning water,
thus reducing the required boiler output and increasing efficiency. While a highly functioning standard
boiler can have an efficiency of 85%, condensing boilers can operate in the 90% to 94% efficiency range.
Given that heating energy is one of the largest energy consumers for a multifamily property, this can
translate to considerable savings.
There are a multitude of considerations at play when evaluating condensing boilers. To properly
condense the exhaust water vapor and extract the heat, the return water will need to be cool enough
to initiate condensation (less than 130°F, though less than 120°F is preferable22,23). If the return water
temperature is higher, heat is wasted and the efficiency falls to that of a standard boiler. The low return
temperature is well below typical return water temperatures, including those we saw at NYCHA
properties. Condensing boilers should be considered in conjunction with heat load reduction measures,
such as insulation and air sealing, so that supply and return temperatures can be lowered enough to incite
condensation and warrant the higher efficiency boiler while maintaining comfort.
The exhaust flue will also need to be modified or replaced with a liner, which is resistant to the acids
formed when the combustion gases mix with water.
22 http://www.riversidehydronics.com/pdf%20documents/Tech%20Papers/condensing%20boiler%20operation %20and%20use.pdf
23 http://homeenergypros.lbl.gov/profiles/blogs/high-efficiency-should-be-a-drain-a-closer-look-at-condensing

35
3.2.6.2 Thermostatic Radiator Valves
In much the same way that TRVs can be applied to steam buildings, so can they be applied to hot water
buildings. There are some nuanced differences to pay attention to, though, when considering them. They
can be implemented in several ways depending on the orientation of the distribution piping.
In buildings where the heating distribution piping feeds individual rooms/apartments, two-way TRVs can
be used which shut off the water supply to the heat emitters. This reduces the heat load of the system and
allows the boilers to run less frequently (and at a lower firing rate if modulation is used).
In buildings where heating distribution piping heats more than one room/apartment, meaning that each
unit is not on its own space heating loop, two-way valves may not be sufficient since they will prevent
heat from getting down the line to other zones where heat may be desired. In this case, a three-way valve
and bypasses are necessary. When the thermostat controlling the TRV is satisfied, the valve diverts the
flow away from the heat emitter and through insulated bypass piping, where it then rejoins the heating
line after the bypassed emitters. This could involve additional pipe installation if it wasn’t already in
place, and it would have an effect on the potential for other hydronic heating measures discussed below.
3.2.6.3 Variable Frequency Drives & Premium Motors
Hydronic heating systems rely on pumps (and subsequently motors) to move heat through the building.
This is an additional caveat to identify when evaluating the efficiency of hot water heating systems
versus steam. Improving the efficiency and reducing the power draw of these motors will save money
on electricity bills.
A variable frequency drive (VFD) is an electrical intermediary between the power supply and the motor
which adjusts the frequency at which AC power is supplied. This varies the speed the motor spins, and
thus is capable of reducing the load on the pump and overall electricity usage. The speed of the motor is
regulated by an input signal, typically a pressure monitor at the end of the line, which speeds up or slows
down the motor based on the signal. In the case of the two-way shut-off TRVs discussed in the previous
section, the motor will slow down as more TRVs close to maintain the same level of pressure. This is not
as effective in the case of bypass valves as the pressure drop remains relatively constant, so TRVs should
be evaluated on a building by building basis. Attention should also be paid to the rating of the motor, as
some lighter duty motors do not have sufficient insulation to handle the varying electrical input and
would require replacement (preferably with NEMA premium motors).
36
The U.S. and the international community at large have been implementing standards for more
efficient motors for several decades. Recently, the U.S. Energy Policy Act (EPAct) has established
requirements for the minimum efficiency of motors and guidelines for highly efficient motors, of
“premium” efficiency. The premium efficiency standards were harmonized between the U.S. federal
government and the national electrical manufacturers association (NEMA) between 2001 and 2010,
therefore the classification is still relatively new and still has a large portion of the market to penetrate.24
Motors in lighter HVAC duty, such as heating pumps, have an expected lifetime that typically exceeds
minimum standards.25 Replacing motors (particularly motors 5 hp or larger) with models that have the
NEMA premium stamp will guarantee electricity savings and longer life, thanks to these new standards.
3.2.6.4 Elevator Vent Sealing
In mid- and high-rise residential buildings and hotels, some of the largest commonly found holes tend
to be open vents at the top of elevator shafts and stairwells, which are intended to vent smoke in the event
of a fire. Recent code changes allow buildings to mechanically close elevator smoke vents, providing a
cost-effective way to reduce heating costs at the property.
24 http://energy.gov/sites/prod/files/2013/10/f3/epact_2005.pdf 25 https://www.fanniemae.com/content/guide_form/4099f.pdf

37
4 Savings Projections The end goal of this analysis was to determine what a realizable goal was for total energy savings from
DERs across NYCHA’s portfolio. These savings projections are meant to put NYCHA in line with New
York State energy goals, including New York City’s goals as presented in the PlaNYC, Greener Greater
Buildings, and One City Built to Last plans put forth by the Bloomberg and de Blasio administrations.
One City Built to Last targets an 80% reduction in carbon emissions by 2050.
SWA used data collected from site visits and utility bills to model existing building conditions and project
energy savings from the ECMs laid out in previous sections. The savings projections, along with pre-and
post-retrofit energy usage statistics, are provided in the following sections. These savings are presented as
ranges to account for the multiple modeling methods and a window of uncertainty. Pre-retrofit energy use
for each typology was set to the NYCHA median weather-normalized source EUI found for each
typology, respectively.
4.1 Mid- and High-Rise Two Pipe Steam Buildings
The following Energy Conservation Measures were applied to this typology, in addition to the
portfolio-wide measures applicable to all typologies:
• Upgrades to the steam distribution system including: orifice plates, thermostatic radiator valves and radiant barriers for in-unit emitters
• Boiler/Burner Upgrade & Controls
o Boiler replacement o Linkageless burners o Burner modulation o Multi-sensor indoor heating controls
• Combined Heat and Power units • Elevator vent sealing
Projections within this group showed median source energy savings of 44%, with best case savings
of 54% and worst case savings of 33% of pre-retrofit whole building source energy usage. This equates
to a best-case carbon footprint reduction of 39%, and a worst case of 27%, using NYC-specific carbon
coefficients from the most recent version of the City’s Greenhouse Gas Inventory.26
26 http://www1.nyc.gov/assets/sustainability/downloads/pdf/publications/NYC_GHG_Inventory_2014.pdf

38
The most appreciable savings within this typology come from the typology-specific measures of large
scale upgrades to the heating system such as boiler upgrades and steam balancing through TRVs and
orifice plates and the addition of a CHP system. The CHP system modeled here has the potential for
significant source energy savings (9% to 11%) compared to fairly modest site energy savings (3% to 4%).
This is largely due to the heat recovered from the electricity generation of the CHP unit that can be used
for other purposes, such as the production of domestic hot water. However, it is important to note that as
the grid becomes less carbon-intensive over time due to cleaner production of electricity, the impact of
CHP may become less significant over time. Portfolio-wide measures such as exterior wall insulation,
low-flow water fixtures, and lighting upgrades also contribute to the savings. Sub-metering has the
potential for appreciable savings given the high population density and the above average electricity
usage within this typology.
A breakdown of how these scenarios contribute to energy savings energy end use is shown in
Figure 25. Heat energy use intensity (kBTU/SF) represents the energy used for space heating.
Domestic hot water (DHW) EUI represents the energy used to heat water for domestic use (i.e.,
showers and faucets). Common area EUI represents electricity used for common area purposes,
such as stairwell lighting, lobby cooling, or mechanical equipment. Tenant Electric EUI represents
electricity used within apartments. Figure 26 sorts the recommended measures by the two categories:
portfolio-wide measures and typology-specific measures to show the contributions of each to overall
energy reduction projections. Savings from CHP are distributed into both the Tenant Electric EUI and
Common Area Electric EUI, with two-thirds of the savings associated with Tenant Electric EUI
reductions and one-third of the savings associated with Common Area Electric EUI reductions.

39
Figure 25. Potential energy savings by end use for mid- to high-rise steam typology
*Note that both the Tenant and Common Area Electric EUI reductions in Figure 25 are much greater than the reductions seen in Figure 27 for the Low-Rise Steam typology because savings from CHP are included in this typology.
Figure 26. Potential energy savings by energy conservation measure for mid- to high-rise steam typology
A line by line table of projected energy and carbon savings ranges can be found in Appendix B.

40
4.2 Low-Rise One Pipe Steam Buildings
The following Energy Conservation Measures were applied to this typology, in addition to the
portfolio-wide measures applicable to all typologies:
• Steam to Hydronic Conversion • Thermostatic Radiator Valves
Projections within this group showed median source energy savings of 40%, with best case savings
of 49% and worst case of 31% of pre-retrofit whole building source energy usage. This equates to a
best-case carbon footprint reduction of 29%, and a worst case of 19%.
The largest savings projected within this typology is the conversion from steam heat to hydronic with
a 14% to 16% source energy reduction. This has been corroborated by several studies from other groups,
including the Taitem study mentioned in the measure description section. It is important to note that
while site energy savings are larger for the steam to hydronic conversion (20% to 22% site energy
savings), source energy savings are lower due to the slight increase in electric energy needed to run the
pumps and motors associated with a hydronic heating system. Significant savings were also projected
from envelope insulation improvements, low-flow water fixtures, TRVs for zoning apartment radiators,
and electric sub-metering.
CHP was excluded from this typology model given the small property size. Although CHP systems
are made for the small electrical/DHW loads experienced at low rise single properties, the economics
are not as favorable and the maintenance needs are greater.
A line by line table of projected energy and carbon savings ranges can be found in Appendix B.

41
Figure 27. Potential energy savings by end use for low-rise steam typology
Figure 28. Potential energy savings by energy conservation measure for low-rise steam typology

42
4.3 Hydronic Buildings
The following Energy Conservation Measures were applied to this typology, in addition to the
portfolio-wide measures applicable to all typologies:
• Boiler Upgrades – Condensing Boiler • Thermostatic Radiator Valves • Variable Frequency Drives & Premium Motors • Elevator Vent Sealing (for high-rise buildings only, when applicable)
Projections within this group showed median source energy savings of 27%, with best case savings
of 35% and worst case of 19% of pre-retrofit whole building source energy usage. This equates to a
best-case carbon footprint reduction of 22%, and a worst case of 13%.
The analyzed building has a lower baseline source EUI than the steam heated buildings analyzed in
the previous two examples. This is to be expected when comparing hydronic buildings to steam
heated buildings, and is another example of why steam to hydronic conversions are an excellent
option when feasible.
Predominant savings from this typology come from boiler upgrades to condensing models, apartment
hot water zoning with TRVs, exterior insulation systems, low flow devices, and electrical measures
such as sub-metering and lighting upgrades. Since heating makes up a smaller portion of the total
building EUI, more significant electricity savings percentages were noted (there is additional
reasoning for electricity savings since the building uses pumps for heating hot water).
A line by line table of projected energy and carbon savings ranges can be found in Appendix B.

43
Figure 29. Potential energy savings by end use for hydronic typology
Figure 30. Potential energy savings by energy conservation measure for the hydronic typology

44
5 Non-energy Benefits Many energy conservation measures, particularly those concerning the building envelope and HVAC
equipment, have co-benefits of improving resiliency and durability in addition to energy savings.
Air sealing can significantly reduce the number and volume of drafts that negatively affect occupant
comfort, as well as reduce energy costs. Air sealing also reduces air infiltration and exfiltration, which
stabilizes interior temperatures. This is particularly important in the event of a power outage, and may
allow residents to shelter in place for longer periods of time.27
While not modeled in this analysis, it is recommended to relocate the HVAC along with electrical
systems above the design flood elevation at the time of equipment upgrade to prevent costly damage
to equipment during flood conditions. In addition to relocation, one of the HVAC measures, CHP,
has additional non-energy benefits that relate to resiliency.
CHP is the simultaneous production of electricity and thermal energy (heat) in-house. We investigated the
use of CHP as a means to bring power generation to site as a sustainability and efficiency measure. These
systems are designed to track domestic hot water demand (thermally following). The electricity generated
will be consumed by base building loads. CHP units are gas-powered combustion appliances and require
sufficient gas service and venting. They also need thermal storage (i.e., water tanks) to act as a heat
battery so as to increase the system volume to maximize the operation time. These space requirements
and constraints can require discussion and an involved construction process.
CHP will result in utility and cost savings for all buildings as well as carbon reduction in line with
NYCHA’s sustainability goals. Energy savings is a difficult metric to apply to CHP as it appears to
increase site energy usage (more Btus per year are consumed at the site). However, the actual carbon
footprint and large-scale energy savings are significant. This is because CHP brings generation to the
site, which means that the site is now responsible for activities the power plant was previously taking
care. This increases energy usage at the site, but factoring in the savings at the power plant level shows
27 http://urbangreencouncil.org/spending

45
an actual source energy savings. This means that CHP provides sustainability benefits and confers
cost savings. Our calculations assumed that the units will be thermally following, which will minimize
‘dumping’ of heat when the building cannot use it. This control strategy will optimize the efficiency
of the units. Note, carbon savings benefits from CHP will vary in the future, pending the electric grid
becomes cleaner.
The use of CHP as a source of backup power needs to be evaluated on a site-by-site basis to determine
the size of the back load compared to the recommended size of the CHP unit for energy efficiency
purposes. At some sites damaged by Superstorm Sandy where we examined CHP closer, we found
that the CHP unit would not meet the required back up loads. Thus, CHP was recommended solely for
energy efficiency.
Outside of recommended technologies, system maintenance plays a large role in realizing energy and
non-energy benefits. For example, patching leaks in plumbing systems can reduce the persistence of
mold and avoid damage to walls and floors as well as reduce water utility costs.
On the electrical side, it is recommended when installing new lighting systems to install fixtures with
battery backup. This feature is not common in current lighting schemes across the NYCHA portfolio
and should be included in the scope of work when upgrading to the recommended lighting fixtures and
controls. This will result in higher capital costs and will not increase energy savings, but it will increase
resident safety in the event of a power outage. The most cost effective time to address battery pack up
fixtures is at replacement.
Lastly, air sealing has additional benefits beyond energy savings. Air sealing that reduces air movement
between the interior and exterior of the building as well as between interior spaces reduces pathways for
pest migration and odor transfer. Reducing pest migration and odor transfer improves indoor air quality.

46
6 Projected Capital Costs and Energy Savings Most measures were evaluated on a total cost basis, while others were evaluated on an incremental
basis, which considers only the cost premium to upgrade to high-performance materials. For example,
if all refrigerators in the building have reached their end of useful life, the incremental cost would be
the premium, or difference, between replacing with a higher-performing EnergyStar refrigerator and a
typical refrigerator to be replaced in-kind.
For this analysis, the following measures were evaluated as incremental costs: window replacement, roof
insulation, EnergyStar appliances, and exterior lighting for all typologies (a portion of the total cost of the
lighting upgrade measure); steam boiler replacement for the mid- to high-rise typology (a portion of the
total cost of the heating upgrade measure); and upgrading to a condensing boiler for the hydronic
typology.
The projected cost and savings were calculated for each typology on a per unit basis, as presented in
Table 5. Simple paybacks were found to be within the range of 9.4 to 15.6 years.
The Low-Rise Steam typology has the most intensive retrofit, converting from steam to hydronic heating
and distribution system. As the smallest typology and percentage of the three typologies, it incurs the
highest cost per unit, but the steam-to-hydronic conversion can also produce the greatest energy savings.
Table 5. Cost, savings, and simple paybacks
Typology
Floor Area in NYCHA Portfolio
(SF)
Units in NYCHA
Portfolio Cost/Unit
Annual Savings
/Unit
Simple Payback
(YR)
Mid- & High-Rise Steam 118,088,537 124,293 $ 16,400 $ 1,700 9.4
Low-Rise Steam 38,023,752 32,884 $ 30,600 $ 2,000 15.6
Hydronic 13,717,558 19,719 $ 12,200 $ 1,000 11.7
See Appendix C for full cost and savings analysis.

47
7 2030 and Beyond Looking at the larger city goals depicted in Figure 31, NYCHA properties have the potential to reduce
energy usage by 41% through the implementation of the identified comprehensive upgrades in a cost
effective manner. To meet the city’s 2050 goal of 50% to 60% energy use reduction, NYCHA would
need to further reduce their projected 2030 usage by an additional 31% to reach a median EUI of
roughly 70 kBTU/SF. If the city median tracks on a similar path to meet the city goals, NYCHA
would be 46% more energy intensive than the city median. If NYCHA’s goal is to reduce energy
use to the same level as the non-NYCHA NYC median multifamily building, additional energy
savings are required.
Given the projected capital costs and paybacks, NYCHA represents the largest savings potential in
the City. There is no greater opportunity for economically viable energy upgrades than at the NYCHA
portfolio. The projected simple paybacks fit within NYCHA’s EPC model. As such, it is recommended
to pilot the comprehensive upgrades laid out and determine methods to scale the retrofits.
The path to 2030 has been laid out in this study, moving from 2030 to 2050 is an unknown trajectory
for both the median City multifamily buildings and NYCHA properties. What we do know about the
trajectory to 2050 is the need to address electrification of systems in the NYCHA portfolio and cleaning
of the grid.
Table 6. NYCHA's existing and projected energy use compared to NYC goals

48
8 Glossary of terms Air Sealing: Comprehensive air sealing is shown to reduce heating costs by as much as 40% in old, leaky
buildings. Strategies include caulking cracks and service pipe penetrations within apartments, gasketing
outlets and cover plates, weather-stripping both interior and exterior doors, and upgrading windows to
more airtight designs.
Combined Heat and Power (CHP): The simultaneous production of electricity and heat in-house.
Deep Energy Retrofits (DERs): A whole-building analysis and retrofit process to achieve greater
energy efficiency results than conventional methods that focus on isolated system upgrades.
Energy Conservation Measure (ECM): Any technology, material, or project implemented to reduce
the energy consumption of a building.
Energy Performance Contract (EPC): A financing technique for HUD-funded public housing
authorities that uses cost savings from reduced energy consumption to repay the cost of installing
energy conservation measures.
EnergyStar® Appliances: The Environmental Protection Agency’s EnergyStar rating program gives
high efficiency appliances (i.e., refrigerators, air conditioners, etc.) a rating by which to recognize them
over less efficient alternatives.
Elevator Vent Sealing: In mid- and high-rise residential buildings and hotels, some of the largest
commonly found holes tend to be open vents at the top of elevator shafts and stairwells, which are
intended to vent smoke in the event of a fire. Recent code changes allow buildings to mechanically
close elevator smoke vents, providing a cost-effective way to reduce heating costs at the property.
Hydronic (Hot Water) Heating System: Heating boiler and distribution system that pumps heated
water around the building as a heat transfer medium.
Insulation: Material added to building envelope components, such as the roof or walls, or around
service pipes to reduce the transfer of heat.

49
Lighting Fixtures and Controls: Modern LED fixtures with controls can automatically switch lights
on and off depending on need, saving money and electricity.
Low-Flow Plumbing Fixtures: Water-conserving sink, shower, and toilet fixtures reduce the amount of
water that comes out of the fixture, thus saving water as well as the heating fuel used to heat hot water.
New York City Housing Authority (NYCHA): The public housing authority of New York City,
home to over 400,000 low- and moderate-income residents across the five boroughs.
Orifice Plate: Small disk with a central hole, installed at the inlet of a radiator. The size of the hole is
based on the heating capacity of the radiator and is meant to condense all of the steam before it reaches
the return piping.
Photovoltaics: Solar panels offset electricity consumption by converting solar energy to electricity.
The effectiveness and applicability are property dependent, since exposure to sunlight and ratio of
available real estate to building size heavily affect the size of the system.
Physical Needs Assessment (PNA): A periodic process for HUD-funded public housing authorities
to better assess the capital needs of portfolios and take advantage of capital improvement opportunities.
Premium Motor: The U.S. Energy Policy Act (EPAct) established requirements for the minimum
efficiency of motors and guidelines for highly efficient motors, of “premium” efficiency. Replacing
motors with models that have the national electrical manufacturers association (NEMA) premium
stamp will guarantee electricity savings and longer life.
Steam Heating System: Heating boiler and distribution system that relies on steam as a heat transfer
medium. Low-rise properties will tend to have a piping configuration known as one-pipe steam, while
taller properties will have a configuration known as two-pipe steam.
Sub-metering: The practice of monitoring individual apartments for electricity usage, then charging
each apartment for said usage.

50
Thermostatic Radiator Valve (TRV): A means for tenants to control interior temperatures by replacing
the radiator hand valve with an adjustable control. As temperature increases, the valve slowly closes to
meter the amount of steam entering the radiator.
U.S. Department of Housing and Urban Development (HUD): A Cabinet department in the Executive
branch of the United States federal government. HUD’s mission is to create strong, sustainable, inclusive
communities and quality affordable homes for all.
Variable Frequency Drive (VFD): An electrical intermediary between the power supply and the motor
that adjusts the frequency at which AC power is supplied. This varies the speed the motor spins, and thus
is capable of reducing the load on the pump and overall electricity usage.

A-1
Appendix A: Typology distribution by development count and square footage for entire NYCHA portfolio Figure A-1. Percentage of each type by development count
Figure A-2. Percentage of each type by square footage
7%18%
12%
17%
4%
42%
0%
Percentage of each type by development count
Stand Alone Low-riseSteamStand Alone Low-riseHydronicStand Alone Mid/HighRise SteamCampus Low-rise Steam
Campus Low-riseHydronicCampus Mid/High RiseSteamCampus Mid/High RiseElectric
1% 4% 4%
22%
2%
67%
0%
Percentage of each type by square footage
Stand Alone Low-riseSteamStand Alone Low-riseHydronicStand Alone Mid/HighRise SteamCampus Low-rise Steam
Campus Low-riseHydronicCampus Mid/High RiseSteamCampus Mid/High RiseElectric

B-1
Appendix B: Projected Savings by Measure Table B-1. Projected energy and carbon savings by measure for mid- and high-rise steam typology
Mid- and High-Rise Steam: Projected Savings by Measure Measure Source Energy
Savings Range Site Energy
Savings Range Source Carbon
Savings
Portfolio-Wide HVAC Measures Low-Flow Water Fixtures 3.0% - 4.5% 4.0% - 6.0% 2.0% - 3.0%
Portfolio-Wide Envelope Measures Air Sealing 0.7% - 1.5% 1.0% - 2.0% 0.5% - 1.0%
Exterior Wall Insulation 3.4% - 4.9% 4.5% - 6.5% 2.2% - 3.2% Roof Insulation 0.4% - 1.1% 0.5% - 1.5% 0.2% - 0.7%
Window Replacement 0.4% - 1.1% 0.5% - 1.5% 0.2% - 0.7% Portfolio-Wide Electrical Measures
Lighting Upgrades (LEDs & Controls) 1.8% - 3.7% 1.0% - 2.0% 0.9% - 1.7% Sub-metering 2.7% - 6.4% 1.5% - 3.5% 1.3% - 3.0%
EnergyStar® Appliances 0.9% - 2.7% 0.5% - 1.5% 0.4% - 1.3% Photovoltaics 0.0% - 1.8% 0.0% - 1.0% 0.0% - 0.9%
Typology-Specific Measures Boiler Upgrade with Balancing & Controls (includes TRVs) 9.7% - 11.2% 13% - 15% 6.5% - 7.5%
Combined Heat and Power (CHP)* 9.0% - 11.0% 3.0% - 4.0% 12.3% - 15.0% Elevator Vent Sealing 0.0% - 0.7% 0.0% - 1.0% 0.0% - 0.5%
Total 32% - 51% 30% - 46% 27% - 39% * CHP carbon savings may be less significant if grid becomes cleaner. Projected savings range accounts for whole-building energy use and interactions between measures
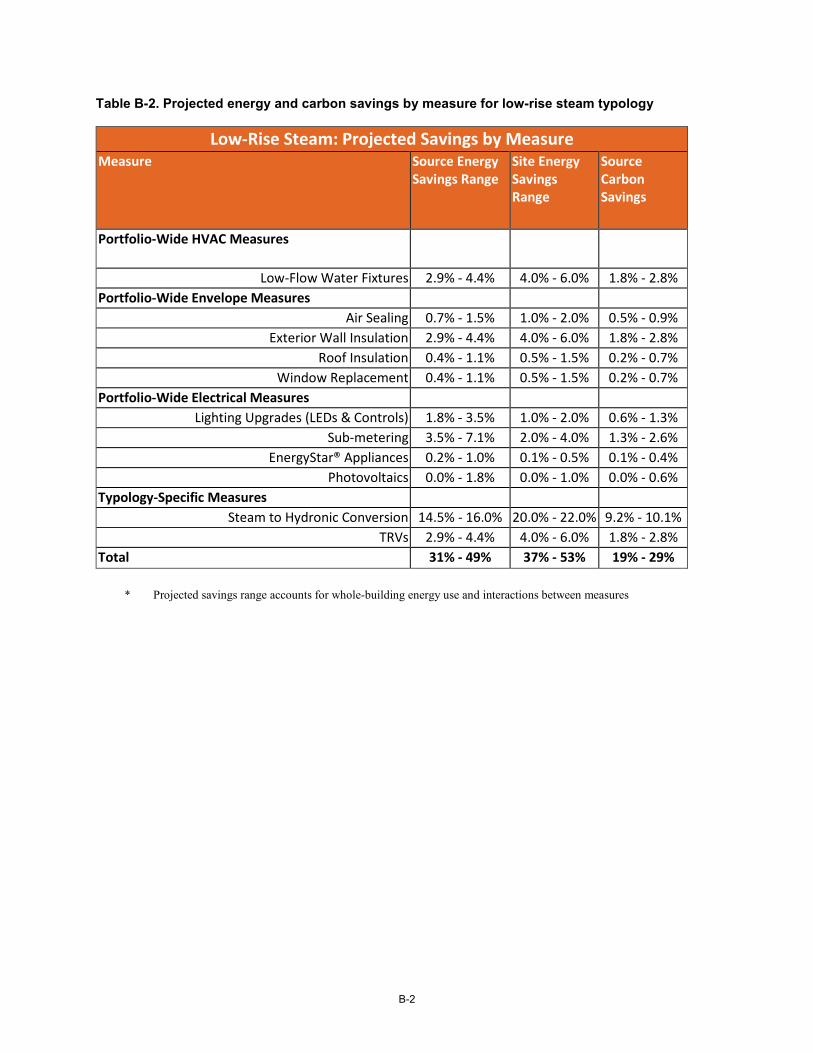
B-2
Table B-2. Projected energy and carbon savings by measure for low-rise steam typology
Low-Rise Steam: Projected Savings by Measure Measure Source Energy
Savings Range Site Energy Savings Range
Source Carbon Savings
Portfolio-Wide HVAC Measures
Low-Flow Water Fixtures 2.9% - 4.4% 4.0% - 6.0% 1.8% - 2.8% Portfolio-Wide Envelope Measures
Air Sealing 0.7% - 1.5% 1.0% - 2.0% 0.5% - 0.9% Exterior Wall Insulation 2.9% - 4.4% 4.0% - 6.0% 1.8% - 2.8%
Roof Insulation 0.4% - 1.1% 0.5% - 1.5% 0.2% - 0.7% Window Replacement 0.4% - 1.1% 0.5% - 1.5% 0.2% - 0.7%
Portfolio-Wide Electrical Measures Lighting Upgrades (LEDs & Controls) 1.8% - 3.5% 1.0% - 2.0% 0.6% - 1.3%
Sub-metering 3.5% - 7.1% 2.0% - 4.0% 1.3% - 2.6% EnergyStar® Appliances 0.2% - 1.0% 0.1% - 0.5% 0.1% - 0.4%
Photovoltaics 0.0% - 1.8% 0.0% - 1.0% 0.0% - 0.6% Typology-Specific Measures
Steam to Hydronic Conversion 14.5% - 16.0% 20.0% - 22.0% 9.2% - 10.1% TRVs 2.9% - 4.4% 4.0% - 6.0% 1.8% - 2.8%
Total 31% - 49% 37% - 53% 19% - 29% * Projected savings range accounts for whole-building energy use and interactions between measures

B-3
Table B-3. Projected energy and carbon savings by measure for hydronic typology
Hydronic: Projected Savings by Measure Measure Source Energy
Savings Range Site Energy Savings Range
Carbon Savings
Portfolio-Wide HVAC Measures
Low-Flow Water Fixtures 2.0% - 3.3% 3.0% - 5.0% 1.1% - 1.9% Portfolio-Wide Envelope Measures
Exterior Wall Insulation 3.3% - 4.0% 5.0% - 6.0% 1.9% - 2.3% Roof Insulation 1.3% - 2.7% 2.0% - 4.0% 0.8% - 1.5%
Portfolio-Wide Electrical Measures Lighting Upgrades (LEDs & Controls) 1.6% - 3.3% 1.0% - 2.0% 0.5% - 1.1%
EnergyStar® Appliances 0.0% - 1.6% 0.0% - 1.0% 0.0% - 0.5% Photovoltaics 1.6% - 3.3% 1.0% - 2.0% 0.5% - 1.1%
Typology-Specific Measures Hydronic Boiler Upgrade (condensing) 5.3% - 8.7% 8% - 13% 3.0% - 4.9%
TRVs 2.0% - 3.3% 3.0% - 5.0% 1.1% - 1.9% VFDs + Premium Motors 0.0% - 1.6% 0.0% - 1.0% 0.0% - 0.5%
Elevator Vent Sealing (for high-rise only) 0.0% - 0.7% 0.0% - 1.0% 0.0% - 0.4% Total 19% - 35% 25% - 44% 13% - 22%
* Projected savings range accounts for whole-building energy use and interactions between measures
The savings estimates for each measure depend on different variables, which vary between typologies.
Loose correlations that can be identified, but it is difficult to make concrete correlations due to
differences in apartment density, lighting surveys, normalized electricity consumptions, EUIs, etc.
In the case of ENERGY STAR appliances, the savings are based on a kWh reduction per apartment
for refrigerators and an efficiency improvement for cooling energy usage. If the square footage per
apartment were the same for each site, then the savings would trend closer together. However, the
modeled hydronic typology also had the smallest square footage per apartment (~695 SF/apt), while
the low-rise steam typology had the highest (~1155 SF/apt). There is a correlation between the number
of apartments per SF of building space and appliance savings as each apartment was modeled with the
same number of appliances. There is some obfuscation due to the hydronic building having a lower
EUI than the steam buildings, but this supports the trend.

B-4
For lighting, the effect of apartment density is removed somewhat since apartment lighting is only on
for a portion of the day (two to three hours). This makes common area and exterior lighting play a larger
role, which is a bit more consistent in a lighting power density sense across building types. We found,
after conducting lighting surveys and modeling to include for interactivity, that the savings percentage
was roughly equivalent across building types.
Sub-metering savings were calculated based on apartment electricity usage from linear regression
analysis of electric bills and benchmarking trends of similar buildings that SWA has audited in previous
inspections. We found that the low-rise steam building had the highest normalized apartment electricity
usage (~5.5 kWh/SF/year), while the mid- to high-rise steam was lower (5 kWh/SF/year). This does
show a correlation between savings projections and normalized apartment electricity consumption,
but it is again obfuscated a bit by differing EUIs.

C-1
Appendix C: Full Cost and Savings Table C-1. Projected cost and savings by measure for mid- and high-rise steam typology
Mid- & High-Rise Steam Cost / SF
Building Area
Annual Savings
/ SF Building
Area
Simple Payback
(YR)
Portfolio Cost / SF
(in Millions)
Portfolio Annual
Savings / SF (in Millions) Notes
Portfolio-Wide HVAC Measures
Low Flow Water Fixtures $0.10 $0.09 1.1 $11.81 $10.42
Pipe Insulation - - - - - Included in boiler system upgrade
Portfolio-Wide Envelope Measures
Air Sealing $0.34 $0.03 12.1 $40.35 $3.35 Exterior Wall Insulation $6.75 $0.49 13.8 $797.10 $57.86
Roof Insulation $0.19 $0.04 4.9 $22.44 $4.54
Incremental, cost specific to this typology
Window Replacement $3.16 $0.08 39.5 $373.16 $9.45 Incremental Portfolio-Wide Electrical Measures
EnergyStar® Appliances $0.02 $0.01 2.4 $2.48 $1.03 Incremental, refrigerators only
Lighting Upgrades (LEDs & Controls) $0.33 $0.09 3.6 $38.97 $10.88
Portion of cost due to exterior lighting upgrade is incremental
Photovoltaics $1.76 $0.08 22.0 $207.84 $9.45 Based on cost of $5,000/kW
Sub-metering $0.60 $0.14 4.3 $70.85 $16.53 Typology-Specific Measures
Boiler Upgrade w/ Balancing & Controls $2.11 $0.34 6.2 $249.17 $40.14
Portion of cost due to boiler replacement is incremental
Combined Heat and Power $1.77 $0.43 4.1 $209.02 $50.78
Based on the installation of 10 65-kW units
TRVs - - - - - Included in boiler system upgrade
Elevator Vent Sealing $0.10 $0.01 9.8 $11.81 $1.21 TOTAL $17.23 $1.83 9.4 $2,034.98 $215.62

C-2
Table C-2. Projected cost and savings by measure for low-rise steam typology
Low-Rise Steam Cost / SF Building
Area
Annual Savings
/ SF Building
Area
Simple Payback
(YR)
Portfolio Cost / SF
(in Millions)
Portfolio Annual
Savings / SF (in
Millions) Notes
Portfolio-Wide HVAC Measures
Low Flow Water Fixtures $0.10 $0.09 1.1 $3.80 $3.35
Pipe Insulation - - - - - Included in boiler system upgrade
Portfolio-Wide Envelope Measures
Air Sealing $0.34 $0.03 12.1 $12.99 $1.08 Exterior Wall Insulation $6.75 $0.49 13.8 $256.66 $18.63
Roof Insulation $0.42 $0.04 10.9 $15.97 $1.46
Incremental, cost specific to this typology
Window Replacement $3.16 $0.08 39.5 $120.16 $3.04 Incremental Portfolio-Wide Electrical Measures
EnergyStar® Appliances $0.02 $0.01 2.4 $0.80 $0.33
Incremental, refrigerators only
Lighting Upgrades (LEDs & Controls) $0.33 $0.09 3.6 $12.55 $3.50
Portion of cost due to exterior lighting upgrade is incremental
Photovoltaics $4.56 $0.37 12.3 $173.39 $14.07 Based on cost of $5,000/kW
Sub-metering $0.60 $0.14 4.3 $22.81 $5.32 Typology-Specific Measures
Steam to Hydronic (Condensing) Boiler
Conversion $10.17 $0.36 28.3 $386.56 $13.66 Includes VFDs
TRVs - - - - - Included in boiler system upgrade
TOTAL $26.45 $1.70 15.6 $1,005.69 $64.45

C-3
Table C-3. Projected cost and savings by measure for hydronic typology
Hydronic Cost / SF Building
Area
Annual Savings
/ SF Building
Area
Simple Payback
(YR)
Portfolio Cost / SF
(in Millions)
Portfolio Annual
Savings / SF (in Millions) Notes
Portfolio-Wide HVAC Measures
Low Flow Water Fixtures $0.10 $0.09 1.1 $1.37 $1.21
Pipe Insulation - - - - -
Included in boiler system upgrade
Portfolio-Wide Envelope Measures
Air Sealing $0.34 $0.03 12.1 $4.69 $0.39 Exterior Wall Insulation $6.75 $0.49 13.8 $92.59 $6.72
Roof Insulation $0.43 $0.04 11.2 $5.90 $0.53
Incremental, cost specific to this typology
Window Replacement $3.16 $0.08 39.5 $43.35 $1.10 Incremental Portfolio-Wide Electrical Measures
EnergyStar® Appliances $0.02 $0.01 2.4 $0.29 $0.12
Incremental, refrigerators only
Lighting Upgrades (LEDs & Controls) $0.33 $0.09 3.6 $4.53 $1.26
Portion of cost due to exterior lighting upgrade is incremental
Photovoltaics $5.29 $0.42 12.6 $72.57 $5.76
Based on cost of $5,000/kW
Typology-Specific Measures
Hydronic Boiler Upgrade (Condensing) $0.71 $0.16 4.4 $9.80 $2.21 Incremental
TRVs - - - - -
Included in boiler system upgrade
Hydronic Boiler Controls $0.10 $0.04 2.6 $1.37 $0.52 VFDs + Premium Motors $0.20 $0.04 4.5 $2.74 $0.61
Elevator Vent Sealing $0.10 $0.01 9.8 $1.37 $0.14 TOTAL $17.54 $1.50 11.7 $240.57 $20.57

C-4
Cost and savings estimates were derived from a number of sources, including previous work for the
New York City Buildings Technical Working Group (TWG)28 and industry experience. The TWG
analyzed numerous energy conservation measures to assign costs and savings based on total building
area in $/SF. This method is useful for ease of scaling up deep energy retrofits across a large portfolio,
but for some measures like roof insulation, photovoltaics, and CHP, alternate metrics are better suited
to understand cost implications.
The cost of roof insulation is based on the particular building’s roof area. When dealing with cost in
terms of gross floor area, the cost of the roof insulation is spread over the entire square footage. To
determine whether the cost metric is appropriate, the ratio of roof area to gross floor area must be
considered. Since the ratio is vastly different when comparing low-rise and high-rise buildings, this
analysis uses one cost metric for low-rise properties and another cost metric for high-rise properties.
Photovoltaics and CHP units are typically considered in terms of their electric component. For this
analysis, costs are provided both in terms of total building area ($/SF) and electric generation ($/kW).
Savings were based on fuel costs derived from the U.S. Energy Information Agency, with electricity
at $0.19/kWh and gas at $1.39/therm.
Most measures were evaluated on a total cost basis, while some were evaluated on an incremental
basis, which considers only the cost premium to upgrade to high-performance materials. For example,
if all refrigerators in a building have reached their end of useful life, the incremental cost would be the
premium, or difference, between replacing with a higher-performing EnergyStar refrigerator and a
typical refrigerator to be replaced in-kind. For this analysis, the following measures were evaluated
as incremental costs: window replacement, roof insulation, EnergyStar appliances, and exterior lighting
for all typologies; steam boiler replacement for the mid- to high-rise typology; and upgrading to a
condensing boiler for the hydronic typology.
28 http://www.nyc.gov/html/gbee/html/twg/techncial-working-group.shtml

D-1
Appendix D: Site Descriptions 1. Armstrong II (Table 17) 2. Audubon (Table 18) 3. Borinquen (Table 19) 4. Coney Island Site 8 (Table 20) 5. Farragut (Table 21) 6. Gowanus (Table 22) 7. Marcy (Table 23) 8. O’Dwyer Gardens (Table 24) 9. Palmetto (Table 25) 10. Smith (Table 26) 11. Surfside Gardens (Table 27) 12. Washington (Table 28)

D-2
Table D-1. Characteristics of Armstrong II development
NYCHA Property Armstrong II
Year Built 1970
Rise Low
Campus/Single Campus
# of buildings 6
# of residential units 247
# of bedrooms 656
# of stories 4
Conditioned Area Square Footage
306,100
Heating Type Hydronic
DHW Type Tankless Coil with Electronic Mixing Valve
Heating Fuel Natural Gas and Oil
Electricity Metering Configuration Master
Exterior Wall Type Mass Brick & Block
Window to Wall Ratio Not Calculated
Domestic Cold Water Delivery City Water Pressure
Predominant Lighting Type Fluorescent
Elevators? No
Additional Notes - Apartment windows in poor condition, drafty, need replacement - Exterior doors are poorly hung, have air leakage gaps

D-3
Table D-2. Characteristics of Audubon development
NYCHA Property Audubon
Year Built 1961
Rise High
Campus/Single Single
# of buildings 1
# of residential units 167
# of bedrooms 409
# of stories 20
Conditioned Area Square Footage
178,300
Heating Type Vari-Vac Two-Pipe Steam
DHW Type Indirect storage tank with mechanical mixing valve
Heating Fuel Natural Gas & Oil
Electricity Metering Configuration Master Metered
Exterior Wall Type Mass Brick & Block
Window to Wall Ratio Not Calculated
Domestic Cold Water Delivery Rooftop Water Tank
Predominant Lighting Type Fluorescent
Elevators? Yes
Additional Notes - Exterior doors were poorly weather-stripped - Exterior lights were on during daylight hours - Boiler pressure gauge set for ~10 psi, very high - Boiler 1 was off on airflow not being proven

D-4
Table D-3. Characteristics of Borinquen development
NYCHA Property Borinquen
Year Built 1931
Rise Mid
Campus/Single Campus
# of buildings 17
# of residential units 509
# of bedrooms 1,087
# of stories 7
Conditioned Area Square Footage
510,300
Heating Type Electric resistance - baseboard
DHW Type Dedicated DHW - Sealed Combustion Boilers
Heating Fuel Electricity
Electricity Metering Configuration Master Metered
Exterior Wall Type Mass Brick, Block, and Concrete
Window to Wall Ratio Not Calculated
Domestic Cold Water Delivery Not Confirmed
Predominant Lighting Type Fluorescent
Elevators? Yes
Additional Notes - Roofs are old, in need of repair - Windows are old, leaky, in need of replacement - Some roof fans were pulling very little air, could use repair

D-5
Table D-4. Characteristics of Coney Island Site 8 development
NYCHA Property Coney Island Site 8
Year Built 1972
Rise Mid
Campus/Single Single
# of buildings 1
# of residential units 124
# of bedrooms 316
# of stories 14
Conditioned Area Square Footage
135,660
Heating Type Vari-Vac Two-Pipe Steam
DHW Type Tankless Coil with Mechanical Mixing Valve
Heating Fuel Natural Gas
Electricity Metering Configuration Direct
Exterior Wall Type Mass Brick and Block
Window to Wall Ratio 23%
Domestic Cold Water Delivery Rooftop Water Tank
Predominant Lighting Type Fluorescent
Elevators? Yes
Additional Notes

D-6
Table D-5. Characteristics of Farragut development
NYCHA Property Farragut
Year Built 1951
Rise Mid
Campus/Single Campus
# of buildings 10
# of residential units 1,389
# of bedrooms 3,118
# of stories 14
Conditioned Area Square Footage
1,319,660
Heating Type Vari-Vac Two-Pipe Steam
DHW Type Indirect storage tank off boiler
Heating Fuel Natural Gas
Electricity Metering Configuration Master Metered
Exterior Wall Type Mass Brick & Block
Window to Wall Ratio 23%
Domestic Cold Water Delivery Rooftop Water Tank
Predominant Lighting Type Fluorescent
Elevators? Yes
Additional Notes - Heating zone valves bypassed, leading to possible overheating - Condensate tank was in disrepair, condensate was dumped to sewer and replaced with fresh water - Vari-Vac not pulling vacuum, steam pipes are very leaky - Boilers are ~25 years old, could use replacement - DHW was not working at time of inspection - Pressuretrols were set at ~10psi, very high for a vacuum system
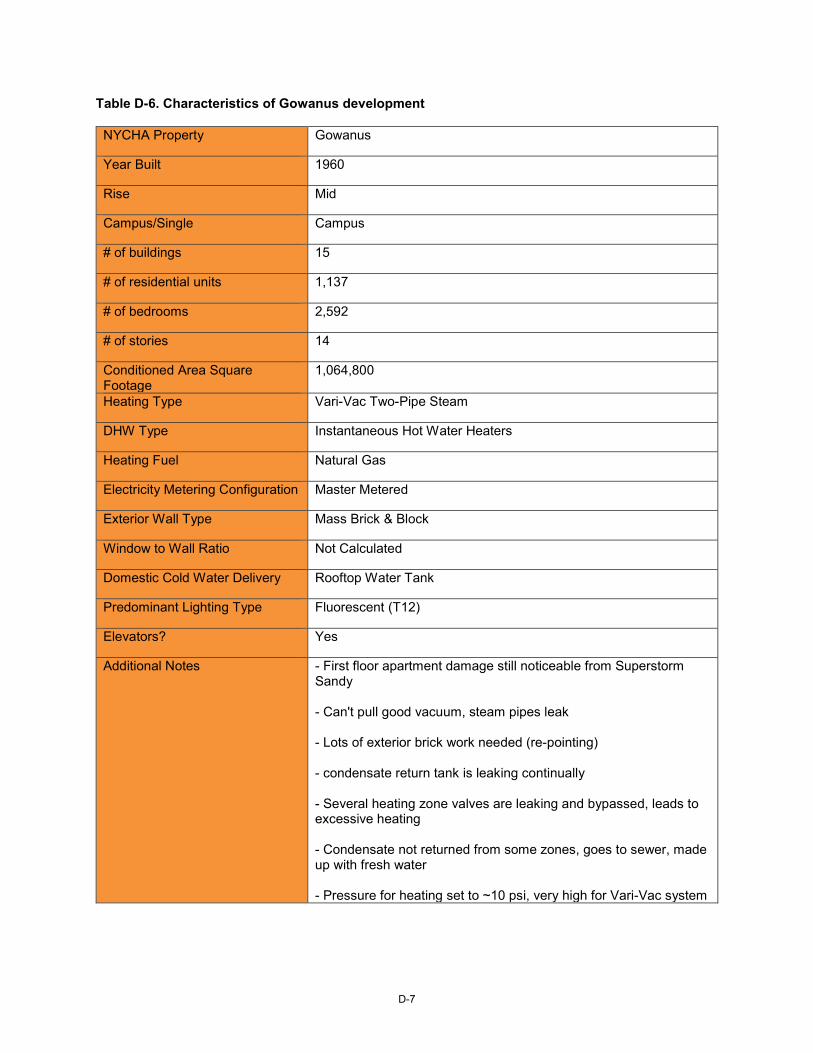
D-7
Table D-6. Characteristics of Gowanus development
NYCHA Property Gowanus
Year Built 1960
Rise Mid
Campus/Single Campus
# of buildings 15
# of residential units 1,137
# of bedrooms 2,592
# of stories 14
Conditioned Area Square Footage
1,064,800
Heating Type Vari-Vac Two-Pipe Steam
DHW Type Instantaneous Hot Water Heaters
Heating Fuel Natural Gas
Electricity Metering Configuration Master Metered
Exterior Wall Type Mass Brick & Block
Window to Wall Ratio Not Calculated
Domestic Cold Water Delivery Rooftop Water Tank
Predominant Lighting Type Fluorescent (T12)
Elevators? Yes
Additional Notes - First floor apartment damage still noticeable from Superstorm Sandy - Can't pull good vacuum, steam pipes leak - Lots of exterior brick work needed (re-pointing) - condensate return tank is leaking continually - Several heating zone valves are leaking and bypassed, leads to excessive heating - Condensate not returned from some zones, goes to sewer, made up with fresh water - Pressure for heating set to ~10 psi, very high for Vari-Vac system

D-8
Table D-7. Characteristics of Marcy development
NYCHA Property Marcy
Year Built 1955
Rise Low
Campus/Single Campus
# of buildings 28
# of residential units 1,714
# of bedrooms 3,972
# of stories 6
Conditioned Area Square Footage
1,636,248
Heating Type Vari-Vac Two-Pipe Steam
DHW Type Instantaneous Hot Water Heaters
Heating Fuel Natural Gas and Oil
Electricity Metering Configuration Master
Exterior Wall Type Mass Brick and Block
Window to Wall Ratio Not Calculated
Domestic Cold Water Delivery Rooftop Water Tank
Predominant Lighting Type Fluorescent
Elevators? Yes
Additional Notes - No apartment steam trap replacement protocol in place - Brick work being done per Local Law 11 - Boiler modulation not calibrated, currently on manual fire - Steam leaks are prevalent, Vari-Vac can’t hold vacuum - Not outdoor temperature sensors as they are vandalized - No nighttime set-back or warm weather shutdown - Boilers are old (~30 years), and could be replaced - Heat Timer clock was off by ~ 4 hours & 40 minutes - Several exterior lights were on during the daytime

D-9
Table D-8. Characteristics of O’Dwyer Gardens development
NYCHA Property O’Dwyer Gardens
Year Built 1968
Rise High
Campus/Single Campus
# of buildings 7
# of residential units 572
# of bedrooms 1,250 (estimated)
# of stories 16
Conditioned Area Square Footage
564,650
Heating Type Vari-Vac Two-Pipe Steam
DHW Type Tankless Coil with Mechanical Mixing Valve
Heating Fuel Natural Gas and Oil
Electricity Metering Configuration Master
Exterior Wall Type Mass Brick and Block
Window to Wall Ratio 21%
Domestic Cold Water Delivery Rooftop Water Tank
Predominant Lighting Type Fluorescent
Elevators? Yes
Additional Notes

D-10
Table D-9. Characteristics of Palmetto development
NYCHA Property Palmetto
Year Built 1980
Rise Low
Campus/Single Single
# of buildings 1
# of residential units 115
# of bedrooms 115
# of stories 6
Conditioned Area Square Footage
80,000
Heating Type Hydronic
DHW Type Tankless Coil w/ Mechanical Mixing Valve
Heating Fuel Natural Gas & Oil
Electricity Metering Configuration Master Metered
Exterior Wall Type Mass Brick & Block
Window to Wall Ratio 14%
Domestic Cold Water Delivery City Water Pressure
Predominant Lighting Type Fluorescent
Elevators? Yes
Additional Notes - Boiler 1 down, Boiler 2 off on flame failure - Roof shows need of replacement, bubbling, pooling - Some roof fans in need of repair, others working poorly - stairwell bulkhead vents could be sealed

D-11
Table D-10. Characteristics of Smith development
NYCHA Property Smith
Year Built 1950
Rise High
Campus/Single Campus
# of buildings 17
# of residential units 1933
# of bedrooms 4,150
# of stories 12
Conditioned Area Square Footage
214,9568
Heating Type Vari-Vac Two-Pipe Steam
DHW Type Indirect storage tank off boiler
Heating Fuel Dual Fuel (Natural Gas & Oil)
Electricity Metering Configuration Master Metered
Exterior Wall Type Mass Brick & Block
Window to Wall Ratio Not Calculated
Domestic Cold Water Delivery Rooftop Water Tank
Predominant Lighting Type Fluorescent
Elevators? Yes
Additional Notes - Pressure set for ~11 psi, very high for vacuum system - Significant steam leaks, difficult to maintain vacuum and steam balance - Boilers have issues going off on high water, low water, draft - No back-up generation on-site - Open windows indicate overheating in apartments - No apartment steam trap replacement protocol is in place, further disrupts steam balance - Some condensate tanks were overflowing / leaking

D-12
Table D-11. Characteristics of Surfside Gardens development
NYCHA Property Surfside Gardens
Year Built 1968
Rise Mid
Campus/Single Campus
# of buildings 5
# of residential units 598
# of bedrooms 1,072
# of stories 15
Conditioned Area Square Footage
553,000
Heating Type Vari-Vac Two-Pipe Steam
DHW Type Tankless Coil with Mechanical Mixing Valve
Heating Fuel Natural Gas and Oil
Electricity Metering Configuration Direct
Exterior Wall Type Mass Brick & Block / Curtain Wall
Window to Wall Ratio 23%
Domestic Cold Water Delivery Rooftop Water Tank
Predominant Lighting Type Fluorescent
Elevators? Yes
Additional Notes

D-13
Table D-12. Characteristics of Washington development
NYCHA Property Washington
Year Built 1930
Rise Low
Campus/Single Single
# of buildings 1
# of residential units 64
# of bedrooms 131
# of stories 6
Conditioned Area Square Footage
67,000
Heating Type Hydronic
DHW Type Tankless Coil with Indirect Storage Tank
Heating Fuel Natural Gas
Electricity Metering Configuration Tankless Coil with indirect storage
Exterior Wall Type Mass Brick & Block
Window to Wall Ratio Not Calculated
Domestic Cold Water Delivery City Water Pressure
Predominant Lighting Type Fluorescent
Elevators? Yes
Additional Notes - Hot water heating pumps were leaking from seals and flanges - Super notes that boilers frequently fail (low water, high water, flame failure) - Combustion air dampers were open, though boiler was off. Indicates problem with relay - Boilers on manual, not utilizing modulation - Heating circulator pumps not interlocked to boiler operation, run continuously - Operating aquastats for boilers were high (190°F - 200°F)


NYSERDA, a public benefit corporation, offers objective information and analysis, innovative programs, technical expertise, and support to help New Yorkers increase energy efficiency, save money, use renewable energy, and reduce reliance on fossil fuels. NYSERDA professionals work to protect the environment and create clean-energy jobs. NYSERDA has been developing partnerships to advance innovative energy solutions in New York State since 1975.
To learn more about NYSERDA’s programs and funding opportunities,
visit nyserda.ny.gov or follow us on Twitter, Facebook, YouTube, or
Instagram.
New York State Energy Research and
Development Authority
17 Columbia CircleAlbany, NY 12203-6399
toll free: 866-NYSERDAlocal: 518-862-1090fax: 518-862-1091

State of New York
Andrew M. Cuomo, Governor
New York State Energy Research and Development Authority
Richard L. Kauffman, Chair | John B. Rhodes, President and CEO