indiana evidence on the employment beta
TRANSCRIPT
4 � Indiana University Kelley School of Business, Indiana Business Research Center
Beta is a term widely used and accepted in the world of investments and corporate
finance to measure volatility. Portfolio managers use beta to select securities of a desired risk level and financial analysts to estimate a project’s required rate of return and the cost of capital. Portfolio theory suggests that an equity asset with a beta of more than 1 exhibits more volatility than the market, and an equity asset with a beta of less than 1 exhibits less volatility than the market.
The concept of beta can be applied to targeted industry analysis.1 Berry and Blackwell propose that economic developers consider the employment beta of the industry when conducting targeted industry selection. The authors indicate that industries with higher betas exhibit greater swings in employment than industries with lower betas. Therefore, high beta industries can contribute to greater social upheaval due to the greater sensitivity of its employment to overall changes in national employment. Berry and Blackwell suggest that, other things equal, economic developers should prefer high growth/low beta industries to high growth/high beta industries. From a social costs standpoint, employment in low beta industries is not as sensitive to changes in national employment and thus provides more certainty in local employment levels.
This article does not recommend that a region shun or discourage the growth of any particular industry, as those decisions are best made locally. However, given scarce resources among communities, the employment beta concept is one way to focus economic development efforts.
As a starting point for economic developers across Indiana,
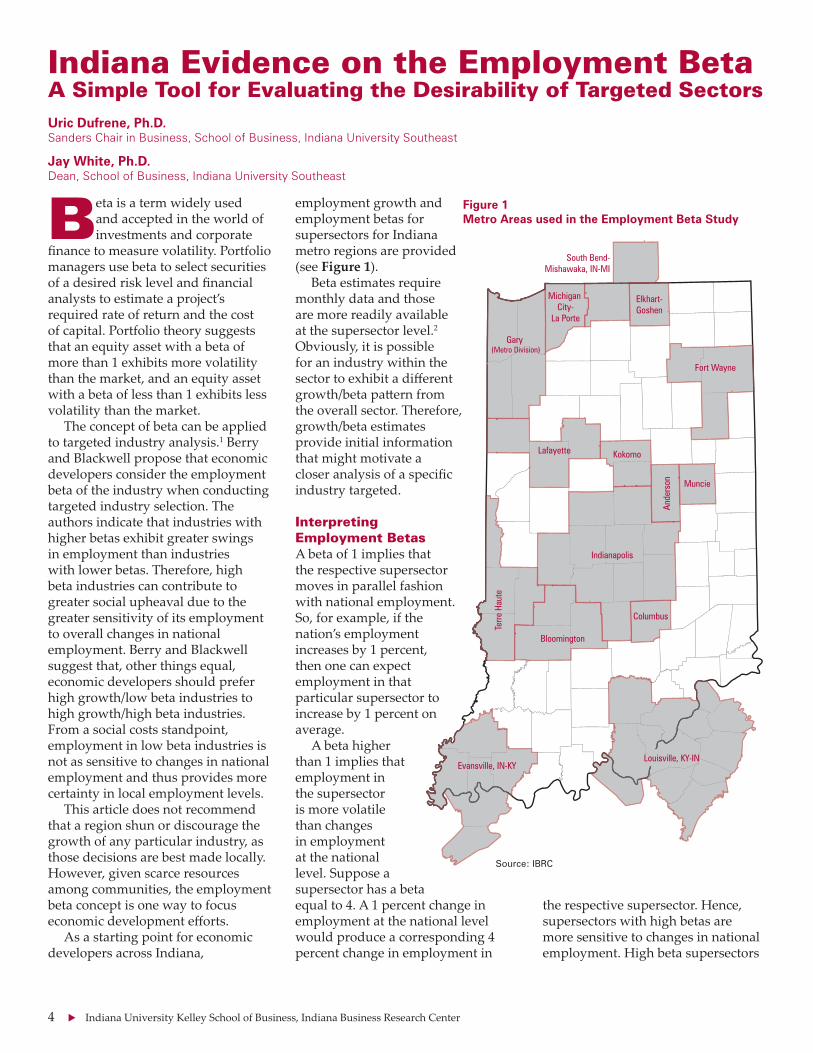
employment growth and employment betas for supersectors for Indiana metro regions are provided (see Figure 1).
Beta estimates require monthly data and those are more readily available at the supersector level.2
Obviously, it is possible for an industry within the sector to exhibit a different growth/beta pa�ern from the overall sector. Therefore, growth/beta estimates provide initial information that might motivate a closer analysis of a specific industry targeted.
Interpreting Employment BetasA beta of 1 implies that the respective supersector moves in parallel fashion with national employment. So, for example, if the nation’s employment increases by 1 percent, then one can expect employment in that particular supersector to increase by 1 percent on average.
A beta higher than 1 implies that employment in the supersector is more volatile than changes in employment at the national level. Suppose a supersector has a beta equal to 4. A 1 percent change in employment at the national level would produce a corresponding 4 percent change in employment in
the respective supersector. Hence, supersectors with high betas are more sensitive to changes in national employment. High beta supersectors
Indiana Evidence on the Employment Beta A Simple Tool for Evaluating the Desirability of Targeted SectorsUric Dufrene, Ph.D.Sanders Chair in Business, School of Business, Indiana University Southeast
Jay White, Ph.D.Dean, School of Business, Indiana University Southeast
Figure 1Metro Areas used in the Employment Beta Study
Ande
rson
Bloomington
Columbus
Elkhart-Goshen
Evansville, IN-KY
Fort Wayne
Indianapolis
KokomoLafayette
Louisville, KY-IN
Michigan City-
La Porte
Muncie
South Bend-Mishawaka, IN-MI
Terre
Hau
te
Gary (Metro Division)
Source: IBRC
Indiana Business Review, Fall 2007 � 5�
produce more jobs when national employment is on the upswing. When national employment is on the decline, however, these supersectors lose more jobs.
A beta of less than 1 implies that employment in the supersector is less volatile than changes in employment at the national level. A supersector with a beta of 0.5, for example, indicates that for a 1 percent change in employment at the national level, employment in the supersector will change by only 0.5 percent. Low beta supersectors have less sensitivity to changes in the overall economy. Therefore, when national employment is increasing, employment in the supersector increases at smaller rates. Conversely, when national employment is decreasing, local employment declines are smaller than national changes.
The Calculations Monthly non-seasonally adjusted employment data from the Bureau of Labor Statistics are used to calculate employment growth and employment betas.
Growth: Average annual growth measures for metro total nonfarm payrolls and metro supersectors are calculated using average fourth quarter employment � gures. The average annual rate of growth is calculated using the annual compound growth rate by using fourth quarter average employment in 1990 as the beginning value and fourth quarter average employment in 2006 as the ending value.
Betas: Monthly employment data are used to calculate employment betas. In this context, the monthly percentage change in employment is analogous to the monthly percentage return in a typical equity security calculation.
In a typical security beta calculation, ordinary least squares (OLS) is used to regress security returns against returns in a market portfolio. In calculating employment betas, the “market portfolio” is national total nonfarm payrolls.
Therefore, to calculate an employment beta, one can use OLS and regress monthly changes in employment at the local level against monthly changes in employment at the national level. This is done for total nonfarm payrolls in each metro area and for each supersector within each metro area. The coeffi cient on the independent variable, percentage change in monthly national total nonfarm payrolls, represents the employment beta.3
Beta Stability: The � nance literature has debated the issue of beta stability. Is the beta stable for a security over diff erent business cycles? The evidence suggests that the individual stock betas do change over time and portfolio betas exhibit more stability over time than individual securities.4 A supersector is, in essence, a portfolio of the individual industries; so the use of supersector data provides economic developers with betas that are potentially more stable and accurate.
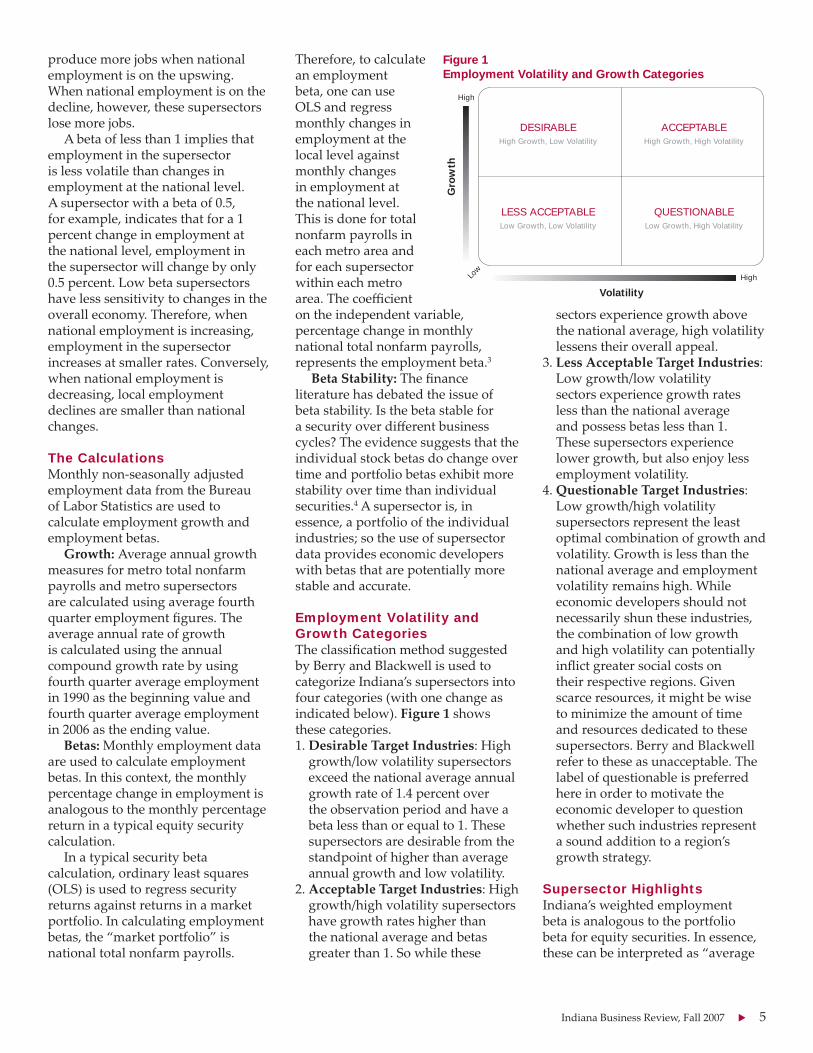
Employment Volatility and Growth CategoriesThe classi� cation method suggested by Berry and Blackwell is used to categorize Indiana’s supersectors into four categories (with one change as indicated below). Figure 1 shows these categories.
Desirable Target Industries1. : High growth/low volatility supersectors exceed the national average annual growth rate of 1.4 percent over the observation period and have a beta less than or equal to 1. These supersectors are desirable from the standpoint of higher than average annual growth and low volatility. Acceptable Target Industries2. : High growth/high volatility supersectors have growth rates higher than the national average and betas greater than 1. So while these
sectors experience growth above the national average, high volatility lessens their overall appeal. Less Acceptable Target Industries3. : Low growth/low volatility sectors experience growth rates less than the national average and possess betas less than 1. These supersectors experience lower growth, but also enjoy less employment volatility.Questionable Target Industries4. : Low growth/high volatility supersectors represent the least optimal combination of growth and volatility. Growth is less than the national average and employment volatility remains high. While economic developers should not necessarily shun these industries, the combination of low growth and high volatility can potentially in� ict greater social costs on their respective regions. Given scarce resources, it might be wise to minimize the amount of time and resources dedicated to these supersectors. Berry and Blackwell refer to these as unacceptable. The label of questionable is preferred here in order to motivate the economic developer to question whether such industries represent a sound addition to a region’s growth strategy.
Supersector HighlightsIndiana’s weighted employment beta is analogous to the portfolio beta for equity securities. In essence, these can be interpreted as “average
Gro
wth
VolatilityLo
wHigh
High Growth, Low VolatilityDESIRABLE
Low Growth, Low VolatilityLESS ACCEPTABLE
Low Growth, High VolatilityQUESTIONABLE
High Growth, High VolatilityACCEPTABLE
High
Figure 1Employment Volatility and Growth Categories

6 ��Indiana University Kelley School of Business, Indiana Business Research Center
betas” for employment in all metro regions. The weight of each beta is based on the metro region’s share of employment for all Indiana metro regions combined. Table 1 reports the overall metro betas by supersector. For example, the weighted average beta for all metro areas is 1.3. This suggests that employment volatility in Indiana’s metro areas is higher than changes in national employment.
As seen in Table 2, seven metro areas experienced growth greater than 1 percent annually, and three achieved growth higher than the national rate. Of these three, Bloomington had the highest employment beta at 1.6. The two metro areas with the highest betas, Anderson and Muncie, also observed the lowest annual rates of growth in employment, the least optimal combination of growth and volatility.
In Tables 3 through 6, we see that the durable goods supersector exhibits a beta of less than 1 in nine out of ten metro regions. One might � nd this counter-intuitive. However, recent evidence from the Federal Reserve and others points to the “great moderation” in overall employment volatility.5 Speci� cally, the evidence shows reduced volatility in the manufacturing and durable goods sectors. Indiana actually observed the fourth largest decrease in overall employment volatility in the nation from 1956–1983 to 1984–2002; in manufacturing, Indiana observed a 63.1 percent decline in volatility (Carlino 2007). Conversely, this stream of research points to an overall increase in services employment volatility.6
Beta estimates were overwhelmingly statistically signi� cant at the 5 percent level or higher. Only nine beta estimates were statistically insigni� cant.7
Education and Health ServicesEducation and health services consistently appeared in the desirable category (see Table 3). The average annual growth in employment exceeded national growth and the
Table 2Metro Growth and Betas for Total Nonfarm Employment
Source: Authors’ calculations using Bureau of Labor Statistics data
MetroAnnual Growth Beta
Anderson -0.9% 1.9
Muncie -0.1% 1.8
Kokomo 0.0% 1.7
Michigan City-La Porte 0.2% 1.4
Gary 0.4% 1.5
Terre Haute 0.4% 1.4
Fort Wayne 0.8% 1.3
South Bend 0.9% 1.5
Evansville 1.0% 1.0
Lafayette 1.1% 1.5
Louisville 1.2% 1.3
Columbus 1.3% 1.5
Bloomington 1.5% 1.6
Elkhart-Goshen 1.7% 1.2
Indianapolis 1.9% 1.2
Industry Metro Area Annual Growth BetaDurable Goods Elkhart-Goshen 2.8% 0.7
Education and Health
Kokomo 1.5% 0.9Bloomington 3.2% 0.9Muncie 2.2% 0.8Gary 2.7% 0.8Indianapolis 3.3% 0.7Terre Haute 1.5% 0.7South Bend 3.1% 0.7Elkhart-Goshen 2.5% 0.6Lafayette 1.9% 0.5Evansville 2.1% 0.5Michigan City-La Porte 2.1% 0.4Ft. Wayne 3.7% 0.4Louisville 2.3% 0.4Columbus 5.2% 0.4Anderson 2.2% 0.0
Financial ActivitiesBloomington 1.7% 0.6Louisville 1.7% 0.4Indianapolis 1.7% 0.3
Manufacturing Elkhart-Goshen 1.8% 0.8Other Services Indianapolis 1.5% 0.5
Professional and Business Services
Evansville 2.5% 1.0Bloomington 4.4% 0.9Elkhart-Goshen 4.8% 0.8Gary 2.2% 0.6Muncie 3.3% 0.5
Transportation and Utilities
South Bend 1.8% 1.0Indianapolis 4.0% 1.0Louisville 2.6% 0.9Evansville 1.5% 0.8
WholesaleIndianapolis 2.0% 0.5Elkhart-Goshen 2.6% 0.4Bloomington 1.7% -0.6
Table 3Desirable Target Industries: High Growth and Low Volatility H
H
L
Source: Authors’ calculations using Bureau of Labor Statistics data
Source: Authors’ calculations using Bureau of Labor Statistics data
Table 1Weighted Betas Across All Metro Regions
Industry Beta
Total Nonfarm 1.3
Service-Producing 1.4
Goods-Providing 1.1
Natural Resources, Mining, and Construction 3.3
Government 2.3
Leisure and Hospitality 2.1
Retail Trade 1.9
Professional and Business Services 1.4
Transportation and Utilities 1.0
Other Services 0.8
Manufacturing 0.7
Education and Health Services 0.6
Information 0.6
Wholesale Trade 0.5
Financial Activities 0.4

Indiana Business Review, Fall 2007 � 7�
volatility was less than volatility at the national level. The Columbus area achieved the highest overall growth in education and health services (beta was signi� cant at the 8 percent level).
Professional and Business ServicesThe professional and business services (PBS) supersector also produced some very impressive return/volatility combinations.8 Four metro areas ranked in the desirable category for the PBS sector. This is especially impressive for Gary and Muncie since both metros lagged Indiana and the nation in annual growth of total nonfarm employment. The PBS supersector might deserve
a closer look by planners in Gary and Muncie (PBS beta for Muncie is signi� cant at the 13 percent level). All other metro areas ranked in the acceptable category (see Table 4). These results show the potential of the PBS sector in Indiana and validate the assertions made by Marcus on the PBS sector in Indiana.9 Economic developers might think about the PBS sector in their respective region and its economic development advantages.10
Financial ActivitiesIndianapolis, Louisville, and Bloomington were the only metro areas with return/beta combinations
that ranked � nancial activities in the desirable category. Interestingly, all other metro areas appeared in the less than acceptable category (see Table 5). While less than the growth in national employment, six metro areas did observe average growth rates greater than zero. The positive growth in employment, coupled with low volatility, does provide some appeal to � nancial activities in these six metro areas.
ManufacturingOnly Elkhart-Goshen’s manufacturing sector ranked in the desirable category. The presence of large successful manufacturers in this
Industry Metro AreaAnnual Growth Beta
Durable Goods
Bloomington -1.1% 0.7South Bend 0.2% 0.6Ft. Wayne -1.0% 0.5Indianapolis -1.4% 0.4Columbus 1.2% 0.4Evansville 0.9% 0.3Lafayette 0.0% 0.3Gary -2.4% 0.3
Financial Activities
Anderson 0.4% 0.9Lafayette 0.5% 0.8Michigan City-La Porte 0.0% 0.8
Gary -0.6% 0.8Terre Haute 0.0% 0.6South Bend 0.7% 0.5Elkhart-Goshen 0.1% 0.5
Columbus -0.4% 0.5Evansville -0.8% 0.4Ft. Wayne -0.9% 0.4Muncie 0.3% 0.3Kokomo -0.8% 0.1
Goods-Producing
Ft. Wayne -0.3% 1.0Michigan City-La Porte -1.1% 1.0
Evansville 0.7% 1.0Columbus 0.9% 0.8Lafayette 0.4% 0.6
Information
Lafayette -0.5% 1.0Ft. Wayne -1.8% 0.8Bloomington 0.0% 0.6South Bend -0.5% 0.5Gary -1.8% 0.5Indianapolis 0.1% 0.5Evansville 1.0% 0.5Michigan City-La Porte 0.0% 0.3
Louisville -0.1% 0.2Columbus -1.4% -0.1
Industry Metro AreaAnnual Growth Beta
Manufacturing
Bloomington 0.0% 0.7Louisville -0.8% 0.6Muncie -4.2% 0.6Ft. Wayne -0.7% 0.6Gary -2.6% 0.6South Bend -0.6% 0.5Columbus 1.0% 0.5Michigan City-La Porte -1.6% 0.4
Indianapolis -0.7% 0.4Evansville 0.3% 0.3Terre Haute 0.4% 0.3Lafayette 0.2% 0.2
Other Services
South Bend -0.1% 1.0Terre Haute 0.1% 1.0Muncie -0.9% 0.9Elkhart-Goshen -0.6% 0.9
Gary 1.0% 0.8Louisville 0.8% 0.7Ft. Wayne 0.0% 0.5Evansville 1.2% 0.4
Service-Providing Evansville 1.2% 1.0
Transportation and Utilities
Michigan City-La Porte -0.6% 1.0
Ft. Wayne -0.5% 1.0Terre Haute -0.9% 0.6
Wholesale
Gary 0.4% 0.7Muncie -1.8% 0.7Michigan City-La Porte 0.8% 0.6
Ft. Wayne 0.7% 0.5South Bend 1.2% 0.4Evansville 0.2% 0.4Louisville 1.1% 0.3
Table 5Less Acceptable Target Industries: Low Growth and Low Volatility H
H
L
Industry Metro AreaAnnual Growth Beta
Goods-Producing
Elkhart-Goshen 1.8% 1.1
Government
Kokomo 1.4% 2.9Elkhart-Goshen 2.8% 2.7
Bloomington 1.5% 2.3
Leisure and Hospitality
Louisville 1.5% 2.4Indianapolis 2.5% 2.4Lafayette 1.5% 2.3Terre Haute 1.7% 2.1Gary 1.4% 1.8Ft. Wayne 1.6% 1.6Evansville 1.7% 1.2
Natural Resources, Mining, and Construction
Elkhart-Goshen 1.6% 4.8
Michigan City-La Porte 1.8% 4.1
Bloomington 1.4% 4.0Ft. Wayne 1.4% 3.0Louisville 1.8% 2.8Evansville 1.5% 2.7
Professional and Business Services
Kokomo 2.4% 2.5Ft. Wayne 2.7% 2.2Lafayette 9.7% 1.9Michigan City-La Porte 2.2% 1.8
Louisville 2.9% 1.7South Bend 2.1% 1.7Terre Haute 3.3% 1.2Indianapolis 4.3% 1.2Columbus 3.9% 1.1
Service-Providing
Columbus 1.7% 2.1Lafayette 1.4% 1.9Bloomington 1.7% 1.7Elkhart-Goshen 1.7% 1.3
Louisville 1.5% 1.3Indianapolis 2.2% 1.3
Transportation and Utilities Anderson 7.1% 2.9
Wholesale Columbus 3.1% 1.7
Table 4Acceptable Target Industries: High Growth and High Volatility H
H
L
Source: Authors’ calculations using Bureau of Labor Statistics data
Source: Authors’ calculations using Bureau of Labor Statistics data

8 ��Indiana University Kelley School of Business, Indiana Business Research Center
metro region presumably contributes to the overall high growth and low volatility. Unfortunately, the overall loss of jobs placed manufacturing in the less acceptable category for the other metro areas. However, only two metro areas placed in the questionable category (see Table 6). Five of the metros in the less acceptable group did experience average growth rates that were either neutral or greater than zero. Combined with lower employment volatility, these metro regions do enjoy some advantages with respect to manufacturing. The lower volatility evident in these metro areas is supported by Warnock and Warnock (2000) and Carlino (2007).
Retail TradePerhaps retail exhibits the most surprising result. Municipal leaders and economic developers o� en like to point to the explosion of retail in their particular locales. Certainly, retail is desirable from the standpoint of enhancing the amenities available for its citizenry and the economic development bene� ts that can be a� ributed to a� racting shoppers from outside the region.11 The results here indicate, however, that retail across all metro areas ranked in the questionable category. Less than average growth rates in employment and the presence of high volatility make retail less than desirable from a pure growth/volatility point of view. Seven metro areas exhibited negative growth rates and high volatility. However, the growth in retail employment was positive or neutral in eight metros, with Columbus being the highest. Evidence of higher volatility in the retail sector for Indiana warrants additional study.
Wholesale Trade The wholesale sector for three metro areas appeared in the desirable category. A fourth metro region also placed wholesale in the acceptable category. While the other metro areas
Industry Metro AreaAnnual Growth Beta
Durable Goods Anderson -6.8% 1.3
Goods-Producing
South Bend -0.2% 1.6
Bloomington 0.4% 1.6
Anderson -5.0% 1.5
Kokomo -0.8% 1.4
Gary -1.7% 1.3
Terre Haute 0.1% 1.3
Muncie -3.3% 1.2
Louisville -0.1% 1.2
Indianapolis 0.3% 1.1
Government
Anderson 0.3% 4.8
Muncie 0.3% 4.4
Columbus 1.1% 4.2
Ft. Wayne 1.1% 3.2
Gary 0.8% 2.9
Lafayette 1.0% 2.9
Michigan City-La Porte 0.9% 2.8
South Bend 0.8% 2.3
Terre Haute 1.0% 2.3
Indianapolis 0.7% 1.9
Evansville 0.9% 1.8
Louisville 1.1% 1.5
Information
Muncie -2.1% 3.1
Terre Haute -6.9% 2.0
Kokomo -2.5% 1.3
Elkhart-Goshen -2.0% 1.3
Anderson -2.3% 1.1
Leisure and Hospitality
Anderson 0.0% 2.8
Bloomington 1.3% 2.3
Elkhart-Goshen 1.2% 2.1
South Bend 0.7% 2.1
Columbus 0.7% 2.0
Muncie 0.8% 2.0
Michigan City-La Porte 0.6% 1.8
Kokomo 0.7% 1.7
ManufacturingKokomo -0.8% 1.2
Anderson -6.0% 1.1
Natural Resources, Mining, and Construction
Terre Haute -1.1% 4.4
Kokomo -0.5% 4.1
Muncie 0.2% 3.9
Anderson 0.9% 3.7
Columbus 0.1% 3.2
Lafayette 1.3% 2.8
South Bend 1.3% 2.8
Industry Metro AreaAnnual Growth Beta
Other Services
Columbus -0.5% 1.8
Anderson -0.6% 1.8
Bloomington 1.0% 1.7
Kokomo -3.1% 1.6
Lafayette 0.4% 1.4
Michigan City-La Porte 0.2% 1.3
Professional and Business Services
Anderson -0.2% 1.5
Retail
South Bend -0.5% 2.7
Columbus 1.2% 2.3
Louisville -0.2% 2.1
Kokomo 0.4% 2.0
Ft. Wayne -0.3% 1.9
Gary 0.5% 1.9
Anderson -1.0% 1.9
Michigan City-La Porte -0.7% 1.8
Bloomington 0.7% 1.8
Indianapolis 1.1% 1.8
Terre Haute -0.9% 1.8
Muncie 0.0% 1.8
Evansville -0.2% 1.7
Elkhart-Goshen 0.6% 1.6
Lafayette 0.7% 1.5
Service-Providing
Anderson 0.5% 2.1
Muncie 0.7% 2.0
Kokomo 0.4% 1.9
South Bend 1.2% 1.7
Michigan City-La Porte 0.7% 1.6
Gary 1.1% 1.5
Terre Haute 0.5% 1.5
Ft. Wayne 1.1% 1.4
Transportation and Utilities
Muncie -2.2% 3.4
Kokomo -2.0% 2.5
Columbus 0.9% 2.4
Bloomington 0.4% 1.9
Lafayette 1.3% 1.8
Elkhart-Goshen -0.7% 1.2
Gary -0.3% 1.2
Wholesale
Lafayette 0.9% 1.7
Anderson 0.5% 1.5
Terre Haute -1.3% 1.1
Kokomo 0.2% 1.1
Table 6Questionable Target Industries: Low Growth and High Volatility H
H
L
Source: Authors’ calculations using Bureau of Labor Statistics data

Indiana Business Review, Fall 2007 � 9
placed wholesale in the two other less favorable categories, we do observe positive employment in nine of the remaining metro areas. Only three of these nine metro areas observe high volatility in the wholesale sector. Overall, wholesale trade appears to be less volatile than the retail sector.
Transportation and UtilitiesLouisville was the only metro area in which transportation and utilities ranked in the desirable category. The growth of a major employer and warehousing and distribution industries likely contributed to employment stability and overall growth. Four other metro areas fared in the acceptable category, and the remaining four metros observed positive growth, but less than the overall growth in national employment.
Natural Resources, Mining, and ConstructionThe one supersector that exhibited high volatility consistently was natural resources, mining, and construction. In all metro areas, volatility exceeded the variation in national employment. Six metro areas did, however, rank in the acceptable category. While the other metro areas appeared in the questionable category, all enjoyed positive employment growth, with the exception of Terre Haute.
Leisure and HospitalitySimilar to the natural resources, mining, and construction supersector, leisure and hospitality exhibited high volatility in all metro regions. Seven metro regions did enjoy average annual growth rates that exceeded the national growth in employment, thus placing these metros in the acceptable category. All other metro areas experienced positive or neutral annual growth rates, but high volatility. The questionable categorization is somewhat deceptive for leisure and hospitality, given that
all metro regions exhibited positive growth. But the results clearly reveal a drawback of leisure and hospitality: a level of volatility that is consistently higher than national employment volatility.
InformationNo metro regions appeared in the desirable or acceptable categories. While the prevailing volatility level across metro areas was generally high, the annual growth rates were also less than the overall growth in national employment. Only four metro areas observed neutral or positive growth.
GovernmentEmployment in the government sector exhibited high volatility across all metro areas. Three metro regions experienced growth in employment that exceeded the national rate. Although growth is positive across the board, the combination of less than average national growth and high volatility placed government in the questionable category for the remaining metros.
ConclusionsCertain supersectors consistently provide the optimal growth/volatility combinations. Education and health services come out on top with respect to the highest annual growth and lowest volatility, while the professional and business services supersector was also notable. On the other hand, retail fared the worst, with high volatility and low growth.
This introductory evidence is a potential tool that state and local economic developers can use in conducting targeted industry analysis. In addition to traditional growth measures, the employment beta can provide valuable information on the acceptability of an industry. Rather than focus only on growth in employment, this article recommends that the economic developer also consider employment
volatility, as measured by the employment beta.
Notes1. Sam Berry and Calvin Blackwell, The Employment Beta,
Economic Development Journal, Summer 2005: 48 53.2. S.G. Berry, M. House and F.M. McGreary, Optimizing
Local Area Employment Stability: Utilizing the Employment Data, Paper presented at the Southern Economic Association meetings, 1981. Tosporn Chotigeat, Measurement of Industrial Employment Volatility in an Open Economy, Social and Economic Studies, 1987, 36: 113 25. William Seyfried, Quantifying and Comparing Regional and National Employment, B-Quest, 1998.
3. Developers can use a variety of statistical software packages, but Excel is suf cient to perform all calculations.
4. Marshall Blume, Betas and Their Regression Tendencies, Journal of Finance, une 1975, (3): 785 95. Robert Levy, On the Short-Term Stationarity of Beta Coef cients,
Financial Analysts Journal, December 1971, 27(5): 55 62.5. Gerald Carlino, The Great Moderation in Economic
Volatility: A View from the States, Business Review, Q1 2007, 11 20. Liz Laderman, Increased Stability in Twelfth District Employment Growth, Federal Reserve Bank of San Francisco Economic Letter, anuary 2003. Margaret McConnell and Gabriel Perez-Quiros. Output Fluctuations in the United States: What Has Changed Since the Early 1980s American Economic Review, December 2000, 90: 1,464 76.
6. M.V. Cacdac Warnock and Francis Warnock, The Declining Volatility of U.S. Employment: Was Arthur Burns Right Board of Governors of the Federal Reserve System, International Finance Discussion Papers, No. 677, August 2000.
7. Statistically Insigni cant Betas: Anderson Education and Health Services Bloomington Wholesale Columbus Information Columbus Education and Health Services (signi cance at 8 percent level) Kokomo Financial Activities Lafayette Non-Durable Goods Michigan City-La Porte Information Muncie Financial Activities (signi cance at 13 percent level) Muncie Professional and Business Services (signi cance at 13 percent level)
8. In a recent paper, Dufrene and Altmann (2007) discuss the professional and business services performance across Indiana metro areas and its attractiveness in an area’s economic development strategy. The results here provide further evidence on the attractiveness of the professional and business services sector from an economic development perspective.
9. Morton Marcus, Indiana’s Manufacturing Advantage, InContext, uly 2005, 6(4).
10. Ellen Harpel, Professional and Business Services in Regional Economies, Economic Development Journal, Fall 2006, 5(4): 50 57.
11. .A. Devine, Retail Targeting and Attraction Strategies, Economic Development Review, 1995, 12: 47 50. S.A. Lackey and C.R. Eckenstahler, The Forgotten Role of Retail in Economic Development, EconomicDevelopment Review, 1995, 13: 85 87. R.H. Pittman and R.P. Culp, When Does Retail Count as Economic Development Economic Development Review, 1995, 13: 4 6.