indian railways macroeconomics
TRANSCRIPT

7/29/2019 Indian Railways Macroeconomics
http://slidepdf.com/reader/full/indian-railways-macroeconomics 1/28

7/29/2019 Indian Railways Macroeconomics
http://slidepdf.com/reader/full/indian-railways-macroeconomics 2/28
AGENDA
• Introduction
• Indian Railways over the years
• Vital statistics
• Analysis of Revenues/Earnings over the years(Regression)
• Operating Ratio over the years for Indian Railways
• Analysis of GDP Vs Cost
• Analysis of GDP Vs Ticket Cost
• Analysis of Growth Rate Vs Change in Price over the
years(Regression)
• Conclusion
7/29/2019 Indian Railways Macroeconomics
http://slidepdf.com/reader/full/indian-railways-macroeconomics 3/28
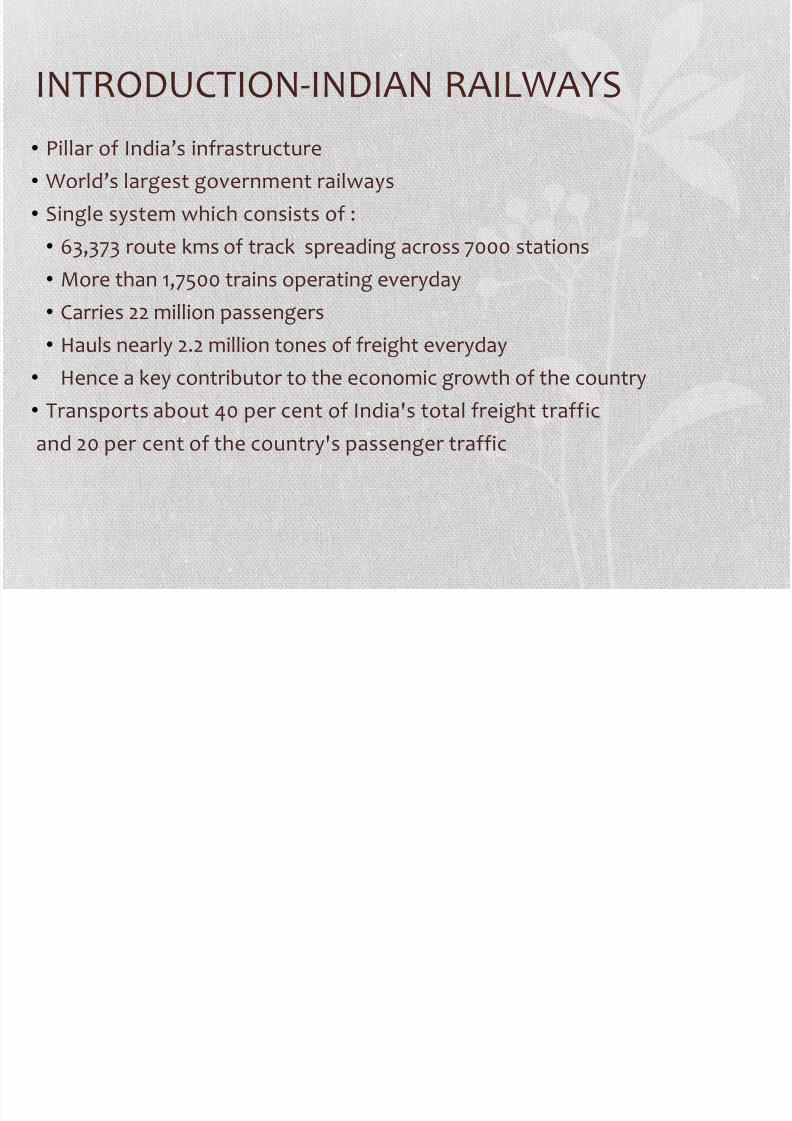
INTRODUCTION-INDIAN RAILWAYS
• Pillar of India’s infrastructure
• World’s largest government railways
• Single system which consists of :
• 63,373 route kms of track spreading across 7000 stations
• More than 1,7500 trains operating everyday• Carries 22 million passengers
• Hauls nearly 2.2 million tones of freight everyday
• Hence a key contributor to the economic growth of the country
•Transports about 40 per cent of India's total freight traffic
and 20 per cent of the country's passenger traffic

7/29/2019 Indian Railways Macroeconomics
http://slidepdf.com/reader/full/indian-railways-macroeconomics 4/28
Vital Statistics – Investment percentage•
The railways share in the country’s GDP has been more or lessconstant at a level of 1.18 per cent from 2003-04 onwards till 2007-08
• Investment in railways as a part of total transport sector investment was less than 10 percent during the 5th, 6th and 7th five
year plans.
• From 8th five year plan onwards the investment in railways apercent of total transport sector investment has steadily increasedand today stands at nearly 22 percent Freight and passenger traffic
are the 2 main components of railways• Subsequently, there has been an upsurge in freight
traffic/passenger since 2002.

7/29/2019 Indian Railways Macroeconomics
http://slidepdf.com/reader/full/indian-railways-macroeconomics 5/28
Vital Statistics- Post recession
• Post economic recession (2008) in meeting the demandsgenerated by the economic upturn, the main challengesfaced by the Railways were the constraints of infrastructure,particularly line capacity on busy routes, and terminal detentions.
• Railways adopted the strategy of intensive utilization of itsexisting assets and resources and improvisation of itsoperational and maintenance practices.

7/29/2019 Indian Railways Macroeconomics
http://slidepdf.com/reader/full/indian-railways-macroeconomics 6/28
Vital Statistics- Big picture
Year 2004 2005 2006 2007 2008 2009 2010 2011 2012
Frieghts in million tonnes 602.12 666.51 727.75 793.89 833.31 902.47 977.38 1058.53 1146.35
Passengers in 10 million 547.55 583.23 633.37 664.2 704.6 748.8 795.5 845.48 898.41
• The Railways have generated Rs 21,027.96 crore (US$ 3.80 billion) of
revenue earnings from commodity-wise freight traffic during April-
June 2012 as compared to Rs 16,507.66 crore (US$ 2.98 billion) during
the corresponding period last year, registering an increase of 27.38
per cent
• Railways earned 25704.64 crore as passenger earnings in the year 2010-11 as compared to 23414.44 crore in the year 2009-10.
• Railways carried 244.81 MT of commodity-wise freight traffic during
April-June 2012 as compared to 233.66 MT carried during the
corresponding period last year, registering an increase of 4.77 per cent.

7/29/2019 Indian Railways Macroeconomics
http://slidepdf.com/reader/full/indian-railways-macroeconomics 7/28
Railway Zones
Sr.No Name Abbr. Route Kms Head Quarters Divisions
1 Central CR 3905 Mumbai Mumbai,Bhusawal,Pune,Solapur,Nagpur
2 East Central ECR 3628 Hajipur Danapur,Dhanbad,Mughalsarai,Samastipur,Sonpur
3 East Coast ECoR 2572 Bhubaneswar Khurda Road,Sambalpur,Brahmapur,Visakhapatnam
4 Eastern ER 2414 Kolkata Howrah,Sealdah,Asansol,Malda
5 North Central NCR 3151 Allahabad Allahabad,Agra,Jhansi
6 North Eastern NER 3667 Gorakhpur Izzatnagar,Lucknow,Varanasi
7 North Western NWR 5459 Jaipur Jaipur,Ajmer,Bikaner,Jodhpur
8 Northeast Frontier NFR 3907 Guwahati Al ipurduar,Katihar,Rangia,Lumding,Tinsukia
9 Northern NR 6968 Delhi Delhi,Ambala,Firozpur,Lucknow,Moradabad
10 South Central SCR 5803 Secunderabad Secunderabad,Hyderabad,Guntakal ,Guntur,Nanded,Vijayawada
11 South East Central SECR 2447 Bilaspur Bilaspur,Raipur,Nagpur
12 South Eastern SER 2631 Kolkata Adra,Chakradharpur,Kharagpur,Ranchi
13 South Western SWR 3177 Hubli Hubli,Bangalore,Mysore
14 Southern SR 5098 Chennai Chennai,Trichy,Madurai,Palakkad,Salem,Thiruvananthapuram
15 West Central WCR 2965 Jabalpur Jabalpur,Bhopal,Kota
16 Western WR 6182 Mumbai Mumbai Central,Ratlam,Ahmedabad,Rajkot,Bhavnagar,Vadodara

7/29/2019 Indian Railways Macroeconomics
http://slidepdf.com/reader/full/indian-railways-macroeconomics 8/28
Railway Infrastructure
Infrastructure Quantum
RouteKilometresTotal 64,215
BroadGauge 54,600
MeterGauge 7,500
NarrowGauge 2,115RunningTrackkilometers 114,000
BroadGauge 72,539
MeterGauge 9,000
NarrowGauge 2,751
ElectrifiedRoutekilometersElectrifiedRoutekilometers 21,450
RollingStockunits
Wagons 2,29,381
Locomotives 9,213
Coaches 59,713
RailInfrastructure

7/29/2019 Indian Railways Macroeconomics
http://slidepdf.com/reader/full/indian-railways-macroeconomics 9/28
Revenues Vs GDPYear Revenues GDP87-88 9.1 301.791
88-89 9.8 301.233
89-90 10.02 326.608
90-91 12.51 274.8
91-92 14.47 293.262
92-93 15.4 284.193
93-94 18.1 333.01
94-95 21.2 366.59
95-96 23.6 399.7896-97 25.4 423.16
97-98 28.1 428.71
98-99 29.2 464.34
99-00 32 474.69
00-01 33 492.37
2001-02 36.01 522.79
2002-03 42.7410 617.57
2003-04 44.9 721.58
2004-05 49.046 834.21
2005-06 56.315 949.11
2006-07 64.785 1238.7
2007-08 73.276 1224.11
2008-09 81.658 1361.18
2009-10 89.229 1684.3
2010-11 96.681 1848.9
Source :http://planningcommission.nic.in/data/datatable/index.php?data=datatab

7/29/2019 Indian Railways Macroeconomics
http://slidepdf.com/reader/full/indian-railways-macroeconomics 10/28
Regression : (GDP Vs. Revenue)
Regression Statistics
Multiple R 0.981941
R Square 0.964208
Adjusted R Square 0.962581
Standard Error 90.23361
Observations 24
Coefficients
Standard Error t Stat P-value Lower 95%
Upper 95% Lower 95.0% Upper 95.0%
Intercept 7.793794 32.97399 0.236362 0.81533865 -60.59008117 76.17767 -60.59008117 76.17766957
X Variable 1 17.43486 0.716167 24.34469 2.1119E-17 15.94961872 18.9201 15.94961872 18.92009598
GDP(Y)= 7.7937+17.434(Revenue , X)

7/29/2019 Indian Railways Macroeconomics
http://slidepdf.com/reader/full/indian-railways-macroeconomics 11/28
Revenues/Expenditure (1987-2011)

7/29/2019 Indian Railways Macroeconomics
http://slidepdf.com/reader/full/indian-railways-macroeconomics 12/28
Reason for decline in IR growth rate in mid1990s•
The decline in the growth rate during the period(1996-2001) wasdue to the general recession in the industrial sector.
• During this period the movements of coal, food grains, iron ore etc.,which are important bulk commodities grew at a very slow paceWhen we looked at the year to year growth rates of freightmovement, two periods 1994-95 and 1998-99 registered negativegrowth rates
7/29/2019 Indian Railways Macroeconomics
http://slidepdf.com/reader/full/indian-railways-macroeconomics 13/28
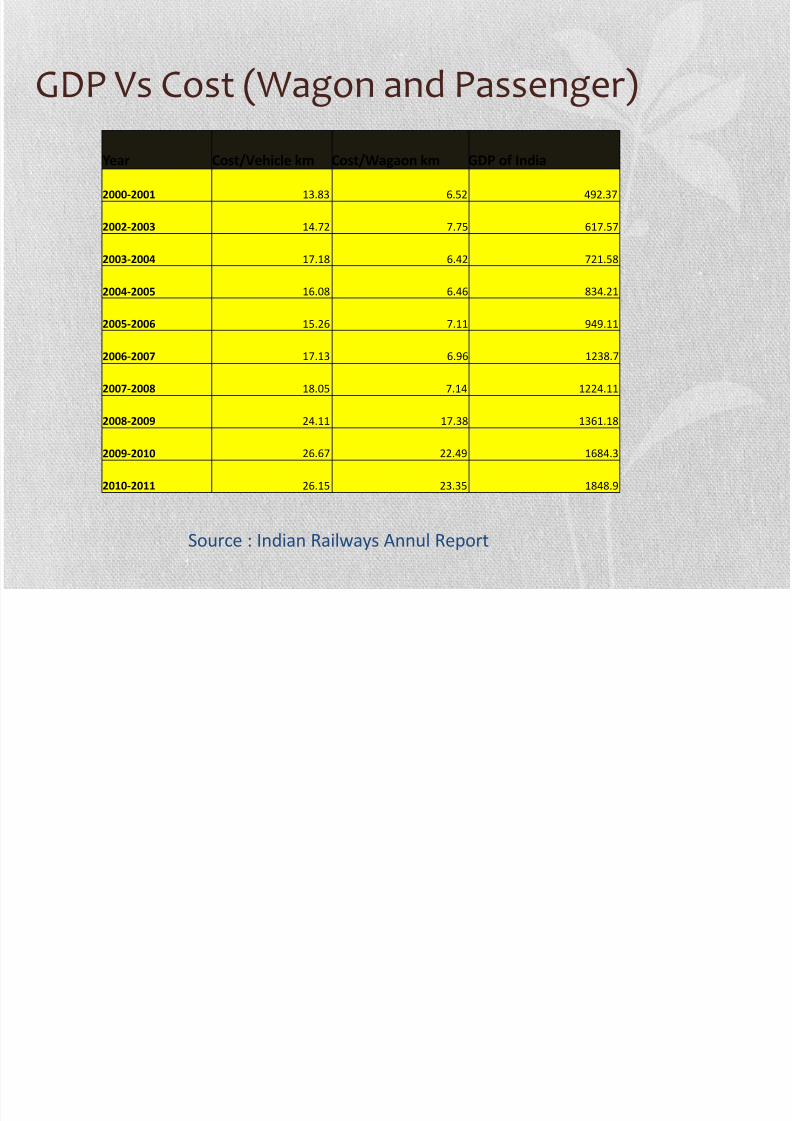
GDP Vs Cost (Wagon and Passenger)
Year Cost/Vehicle km Cost/Wagaon km GDP of India
2000-2001 13.83 6.52 492.37
2002-2003 14.72 7.75 617.57
2003-2004 17.18 6.42 721.58
2004-2005 16.08 6.46 834.21
2005-2006 15.26 7.11 949.11
2006-2007 17.13 6.96 1238.7
2007-2008 18.05 7.14 1224.11
2008-2009 24.11 17.38 1361.18
2009-2010 26.67 22.49 1684.3
2010-2011 26.15 23.35 1848.9
Source : Indian Railways Annul Report
7/29/2019 Indian Railways Macroeconomics
http://slidepdf.com/reader/full/indian-railways-macroeconomics 14/28
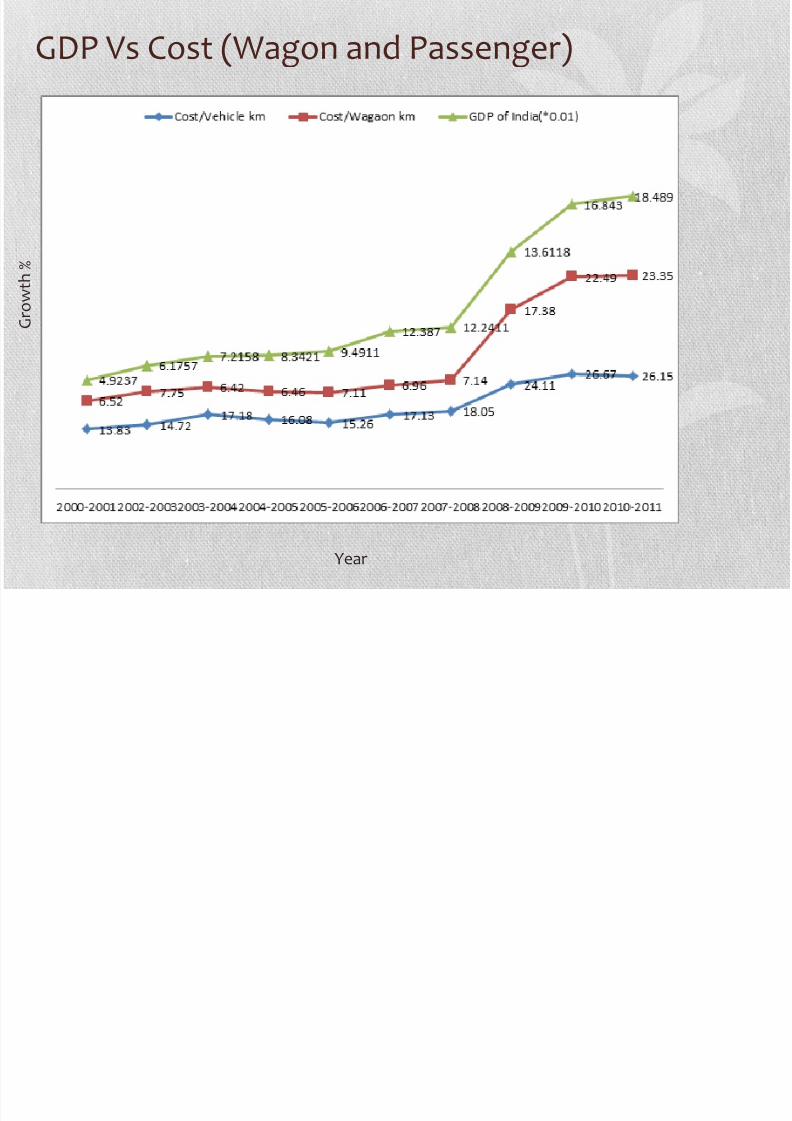
GDP Vs Cost (Wagon and Passenger)
Year
G r o w t h
%
7/29/2019 Indian Railways Macroeconomics
http://slidepdf.com/reader/full/indian-railways-macroeconomics 15/28
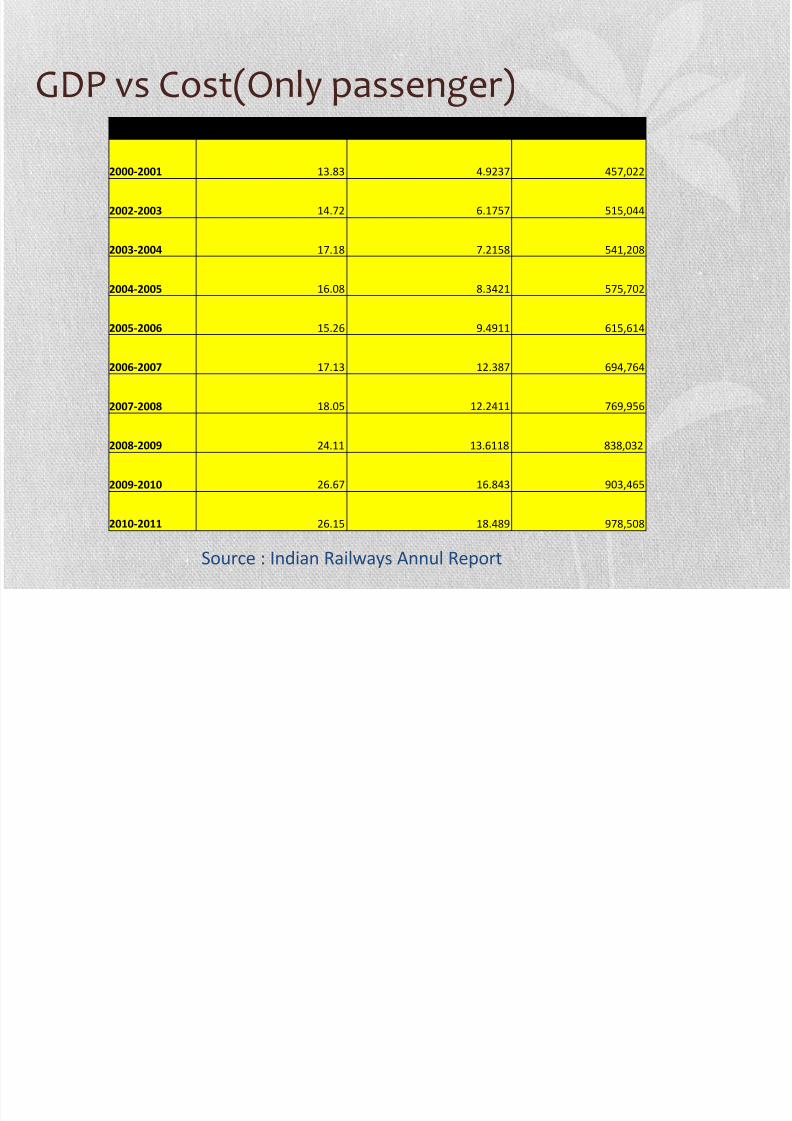
GDP vs Cost(Only passenger)Year Cost/Vehicle km GDP of India(*0.1) Passenger kms
2000-2001 13.83 4.9237 457,022
2002-2003 14.72 6.1757 515,044
2003-2004 17.18 7.2158 541,208
2004-2005 16.08 8.3421 575,702
2005-2006 15.26 9.4911 615,614
2006-2007 17.13 12.387 694,764
2007-2008 18.05 12.2411 769,956
2008-2009 24.11 13.6118 838,032
2009-2010 26.67 16.843 903,465
2010-2011 26.15 18.489 978,508
Source : Indian Railways Annul Report

7/29/2019 Indian Railways Macroeconomics
http://slidepdf.com/reader/full/indian-railways-macroeconomics 16/28
GDP vs Cost(Only passenger)
Year

7/29/2019 Indian Railways Macroeconomics
http://slidepdf.com/reader/full/indian-railways-macroeconomics 17/28
Cost Elasticity…

7/29/2019 Indian Railways Macroeconomics
http://slidepdf.com/reader/full/indian-railways-macroeconomics 18/28
GDP Vs. Ticket Cost
Year GDP of India(*0.1) Cost/Vehicle km Passenger kms/100000 Avg rate per passenger km(in paise)
2000-2001 4.9237 13.83 5 22.9400
2002-2003 6.1757 14.72 5 24.3500
2003-2004 7.2158 17.18 5 24.5000
2004-2005 8.3421 16.08 6 24.4000
2005-2006 9.4911 15.26 6 24.5000
2006-2007 12.387 17.13 7 24.7000
2007-2008 12.2411 18.05 8 25.7000
2008-2009 13.6118 24.11 8 26.0900
2009-2010 16.843 26.67 9 25.9000
2010-2011 18.489 26.15 10 26.3000
Source : Indian Railways Annul Report

7/29/2019 Indian Railways Macroeconomics
http://slidepdf.com/reader/full/indian-railways-macroeconomics 19/28
GDP Vs Ticket Cost
Year
G r o w t h
%

7/29/2019 Indian Railways Macroeconomics
http://slidepdf.com/reader/full/indian-railways-macroeconomics 20/28
Price Elasticity Graph..

7/29/2019 Indian Railways Macroeconomics
http://slidepdf.com/reader/full/indian-railways-macroeconomics 21/28
Regression (Growth Rate Vs. Change in Price)
Growth in Revenue(Y)=4.376+0.6107(Percentage change in price per km, X)
Regression StatisticsMultiple R 0.754084605
R Square 0.568643591
Adjusted R Square 0.549036482
Standard Error 3.363577582
Observations 24
Coefficients Standard Error t Stat P-value Lower 95% Upper 95% Lower 95.0% Upper 95.0%Intercept 4.376812995 1.421161502 3.079744 0.005478 1.42950443 7.32412156 1.42950443 7.32412156
% change in price / km 0.61076597 0.113412662 5.385342 2.08E-05 0.375562505 0.845969435 0.375562505 0.845969435
7/29/2019 Indian Railways Macroeconomics
http://slidepdf.com/reader/full/indian-railways-macroeconomics 22/28
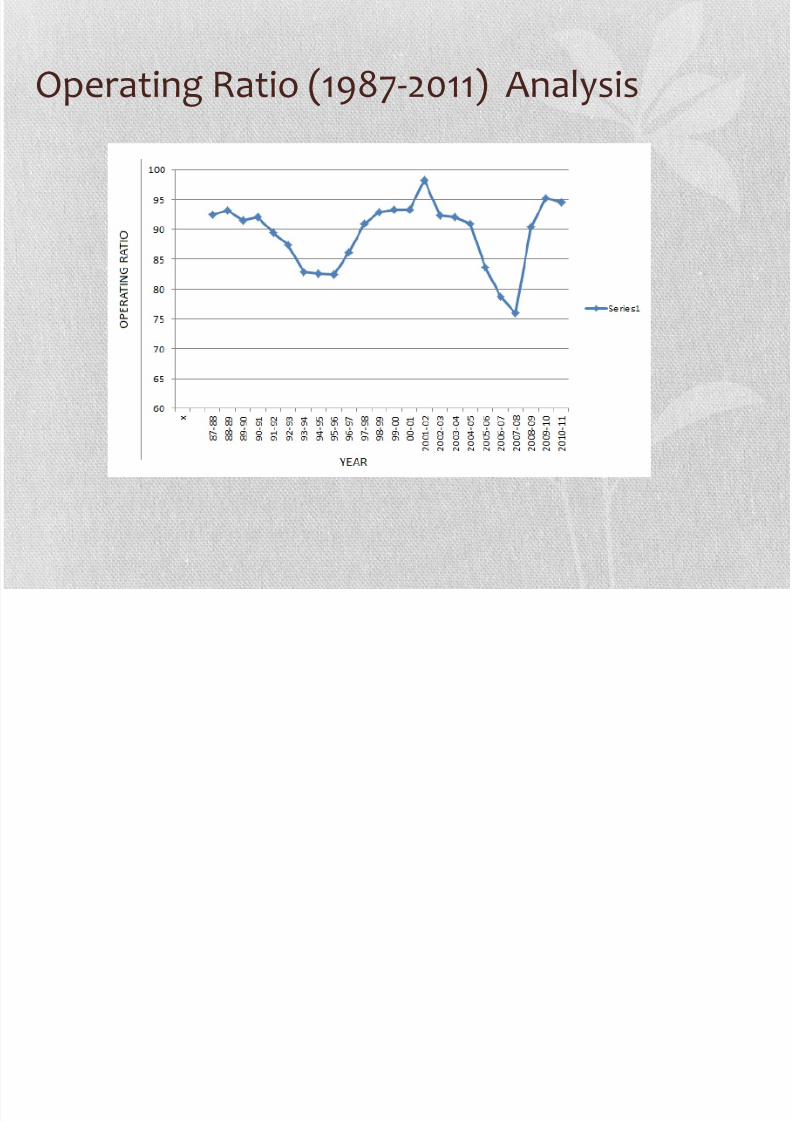
Operating Ratio (1987-2011) Analysis

7/29/2019 Indian Railways Macroeconomics
http://slidepdf.com/reader/full/indian-railways-macroeconomics 23/28
Change in IR Growth w.r.t Industry inflationUrban passenger services
Coefficients Standard Error t Stat P-value Lower 95% Upper 95% Lower 95.0% Upper 95.0%
Intercept 6.867549864 0.830675834 8.267425 1.53E-07 5.122364697 8.612735032 5.122364697 8.61273503
% change in price 63.39119245 8.875781523 7.142041 1.19E-06 44.74386742 82.03851747 44.74386742 82.0385175
Regression Statistics
Multiple R 0.859746179
R Square 0.739163492
Adjusted R Square 0.724672575
Standard Error 3.021759271
Observations 20 0
5
10
15
20
25
30
-0.1 -0.05 0 0.05 0.1 0.15 0.2 0.25 0.3 0.35
G r o w t h
% change in price
% change in price Line Fit Plot
Growth
Predicted Growth

7/29/2019 Indian Railways Macroeconomics
http://slidepdf.com/reader/full/indian-railways-macroeconomics 24/28
Change in IR Growth w.r.t Industry inflationSub-urban passenger services
Regression Statistics
Multiple R
0.8154514
44
R Square
0.6649610
57
Adjusted R Square
0.6452528
84
Standard Error
2.4460537
53
Observations 19
Coefficients Standard Error t Stat P-value Lower 95% Upper 95% Lower 95.0% Upper 95.0%
Intercept 8.935196853 0.781203826 11.43773 2.09E-09 7.2870009 10.5833929 7.28700085 10.5833929
% change in price 47.97735444 8.259644862 5.808646 2.1E-05 30.551027 65.4036818 30.551027 65.4036818
0
5
10
15
20
25
-0.05 0 0.05 0.1 0.15 0.2 0.25
G r o w t h
% change in price
% change in price Line Fit Plot
Growth
Predicted Growth

7/29/2019 Indian Railways Macroeconomics
http://slidepdf.com/reader/full/indian-railways-macroeconomics 25/28
Change in IR Growth w.r.t Industry inflationFrieght Services
Regression Statistics
Multiple R 0.9478191
R Square 0.8983611
Adjusted R Square 0.8935212
Standard Error 1.6172844
Observations 23
Coefficients Standard Error t Stat P-value Lower 95% Upper 95% Lower 95.0% Upper 95.0%
Intercept 1.6336263 0.753927456 2.166822 0.041896 0.0657484 3.2015043 0.065748365 3.201504305
% chage in price / km 0.8024374 0.058898735 13.62402 6.78E-12 0.6799507 0.924924 0.67995073 0.924923978
0
5
10
15
20
25
-10 0 10 20 30
G r o w t h ( % )
% chage in price / km
% chage in price / km Line Fit Plot
Growth(%)
Predicted Growth(%)

7/29/2019 Indian Railways Macroeconomics
http://slidepdf.com/reader/full/indian-railways-macroeconomics 26/28
-5
05
10
15
20
25
1 9 8 8 - 1 9 8 9
8 9 - 9 0
9 0 - 9 1
9 1 - 9 2
9 2 - 9 3
9 3 - 9 4
9 4 - 9 5
9 5 - 9 6
9 6 - 9 7
9 7 - 9 8
9 8 - 9 9
9 9 - 0 0
0 0 - 0 1
2 0 0 1 - 2 0 0 2
2 0 0 2 - 2 0 0 3
2 0 0 3 - 2 0 0 4
2 0 0 4 - 2 0 0 5
2 0 0 5 - 2 0 0 6
2 0 0 6 - 2 0 0 7
2 0 0 7 - 2 0 0 8
2 0 0 8 - 2 0 0 9
2 0 0 9 - 2 0 1 0
2 0 1 0 - 2 0 1 1
Growth(%)
% chage in price / km
-10
-5
0
5
10
15
20
1 9 8 8 - 1 9 8 9
8 9 - 9 0
9 0 - 9 1
9 1 - 9 2
9 2 - 9 3
9 3 - 9 4
9 4 - 9 5
9 5 - 9 6
9 6 - 9 7
9 7 - 9 8
9 8 - 9 9
9 9 - 0 0
0 0 - 0 1
2 0 0 1 - 2 0 0 2
2 0 0 2 - 2 0 0 3
2 0 0 3 - 2 0 0 4
2 0 0 4 - 2 0 0 5
2 0 0 5 - 2 0 0 6
2 0 0 6 - 2 0 0 7
Growth
% change in price
-20
0
20
40
% chage in price / km
Growth(%)
Freight ServicesNon- suburban services
Suburban services
Effect of inflation on Indian Railways Growth

7/29/2019 Indian Railways Macroeconomics
http://slidepdf.com/reader/full/indian-railways-macroeconomics 27/28
Conclusion
•Performance of the Indian railways has been very good over last 6 to 7 yearswhich is mainly due to higher economic growth leading to increase in freighttraffic and movement of people across states
• The good years were between 1993-94 to 1995-96, after which the expenses caughtup with the revenues until 2000-01, when the net revenue shrunk to a little over Rs1000 crores. The situation started improving steadily to reach an actual net revenue
of over Rs 14,000 crores in 2006-07, for a total earnings of Rs 62,731 crores.
• The main determinant of the Indian Railways revenues has been the inflation in theindustry as shown in the regression results :
Growth in Revenue(Y)=
4.376+0.6107(Percentage change in price per km, X)
• Further, government policy of simplifying traffic for freight and creatingdemand-driven pricing for passengers has helped revenue generation

7/29/2019 Indian Railways Macroeconomics
http://slidepdf.com/reader/full/indian-railways-macroeconomics 28/28