india’s first biennial update report to the unfccc… _j.b.pdf · • annual mean temperature...
TRANSCRIPT
India’s First Biennial Update Report to UNFCCC
Dr. J R Bhatt
Scientist-’G’ / Adviser (Climate Change) Ministry of Environment, Forest and Climate Change
Government of India
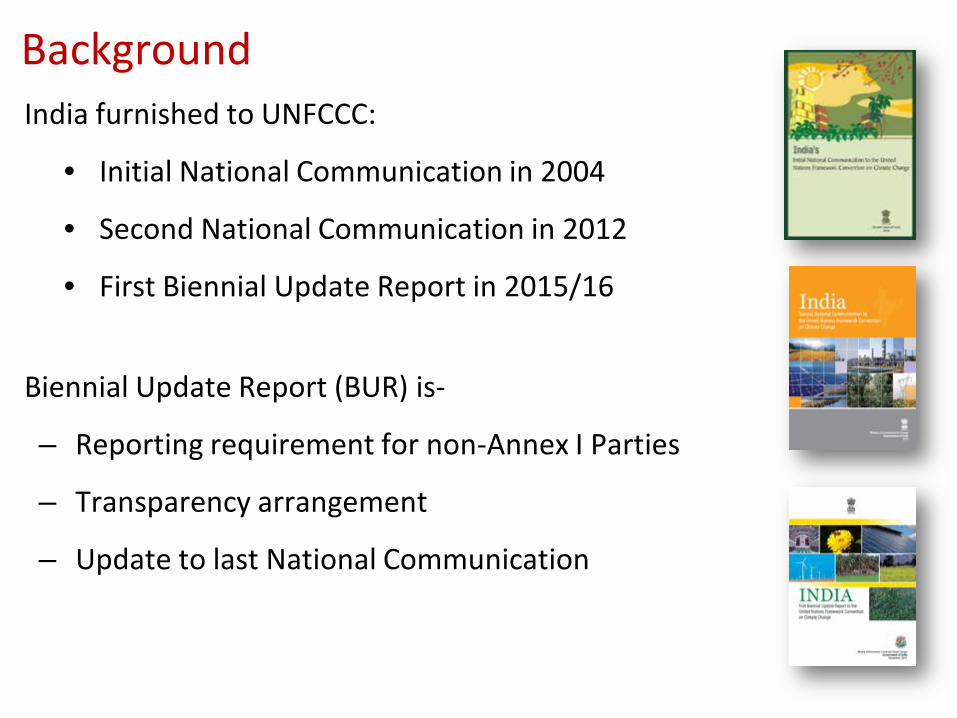
Background India furnished to UNFCCC:
• Initial National Communication in 2004
• Second National Communication in 2012
• First Biennial Update Report in 2015/16
Biennial Update Report (BUR) is-
– Reporting requirement for non-Annex I Parties
– Transparency arrangement
– Update to last National Communication
Process BUR prepared in collaboration with 17 expert institutions-
• Premier educational institutions (IIM Ahmedabad and Indian Institute of Science)
• CSIR laboratories (CIMFR, CRRI, IIP, NEERI and NPL),
• ICAR institutes (CRIDA, IARI, NDRI),
• MoEFCC Organizations (FSI and ICFRE)
• Non-governmental research organizations (TERI and IRADe); and
• Other institutions (CII, EESL, NRSC).
Multi-tier review process: Peer review, review by other governmental institutions, expert advisory
committee and national steering committee before final approval by the Union Cabinet.
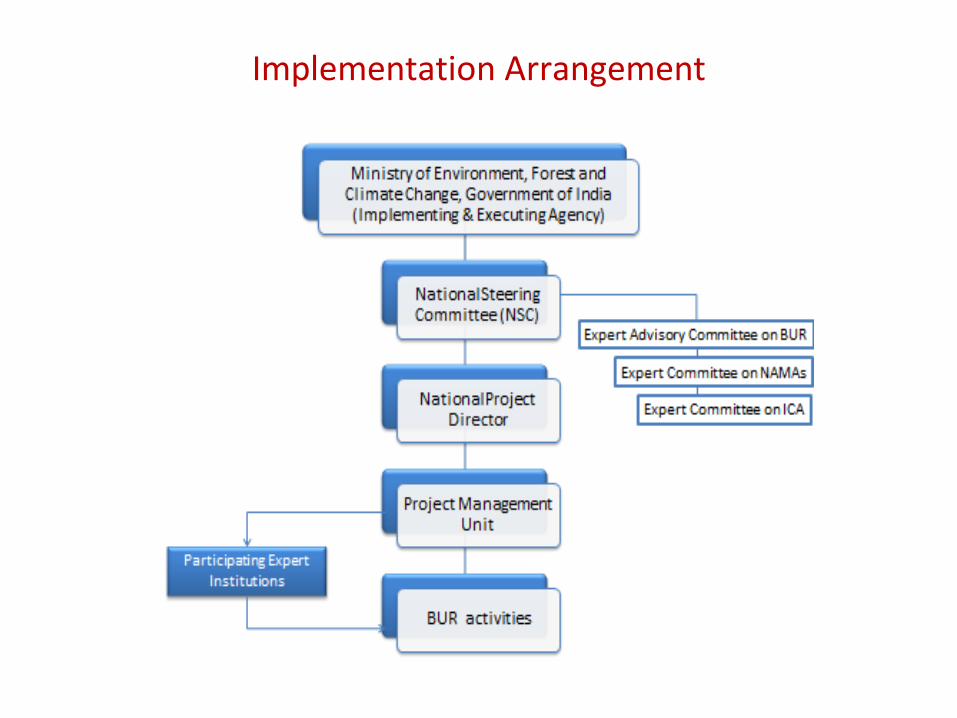
Implementation Arrangement

INSTITUTIONAL NETWORK
• 17 Institutions country-wide
• 26 studies

Outline of the report Background Information And Institutional Arrangement Chapter 1 :National Circumstances Chapter 2 :National Greenhouse Gas Inventory Chapter 3 : Mitigation Actions Chapter 4 : Finance, Technology and Capacity Building Needs and Support Received Chapter 5: Domestic Measurements, Reporting and Verification Arrangements Chapter 6: Additional Information

National Circumstances
• Annual mean temperature increase of about 0.6oC during 1901-2010.
• 17% of world’s population in just 2.4% of the world’s landmass
• Forest and tree cover area 24.16%, increasing steadily over time
• About 70% of rural households depend on fuelwood for cooking.
• 29.5% of population below poverty line
• 33% households have no access to electricity
• 55% households with kuccha and semi-pucca houses
• Low per capita energy consumption.
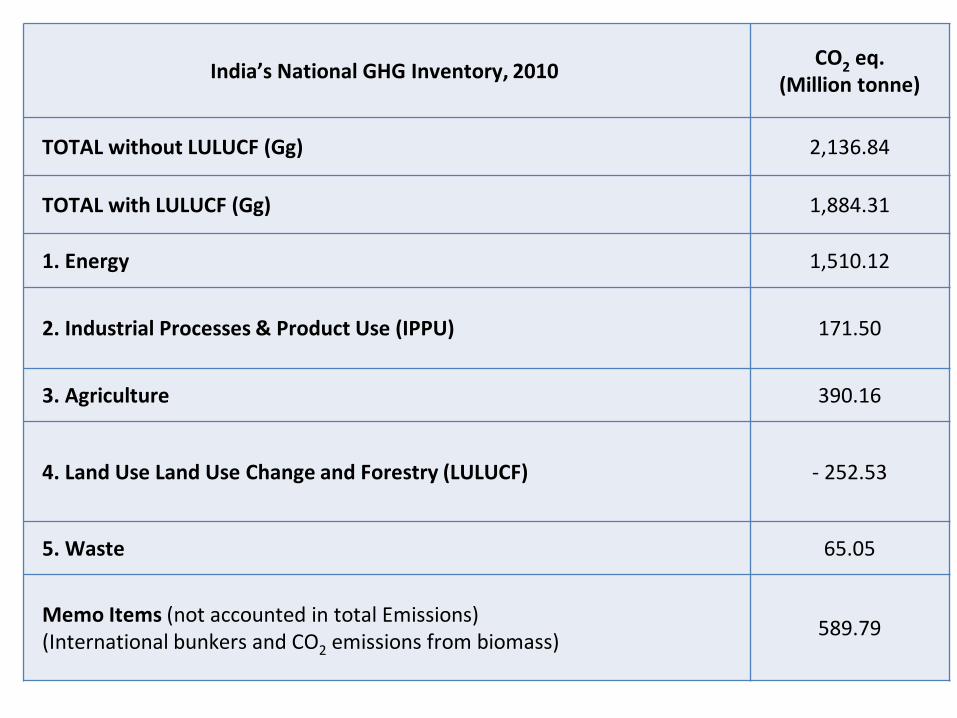
India’s National GHG Inventory, 2010 CO2 eq. (Million tonne)
TOTAL without LULUCF (Gg) 2,136.84
TOTAL with LULUCF (Gg) 1,884.31
1. Energy 1,510.12
2. Industrial Processes & Product Use (IPPU) 171.50
3. Agriculture 390.16
4. Land Use Land Use Change and Forestry (LULUCF) - 252.53
5. Waste 65.05
Memo Items (not accounted in total Emissions) (International bunkers and CO2 emissions from biomass) 589.79
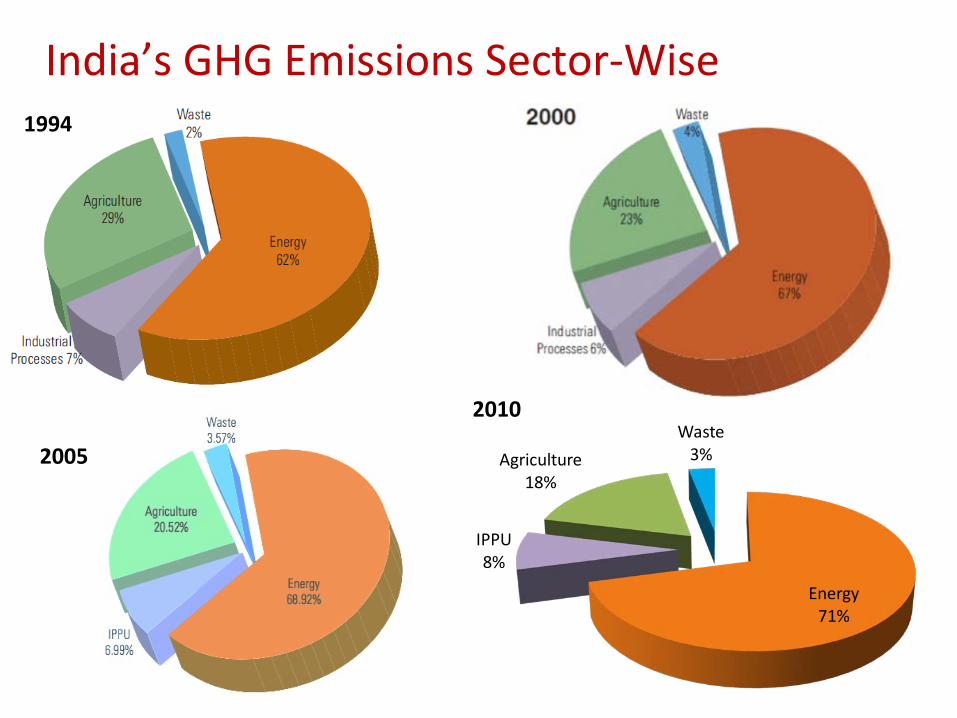
India’s GHG Emissions Sector-Wise 1994
Energy 71%
IPPU 8%
Agriculture 18%
Waste 3%
2010
2005

0%
25%
50%
75%
100%
CO2 CH4 N2O HFCs+PFCs+SF6
ENERGY INDUSTRIAL PROCESS AGRICULTURE WASTE
Sectoral distribution of GHG emissions, India, 2010
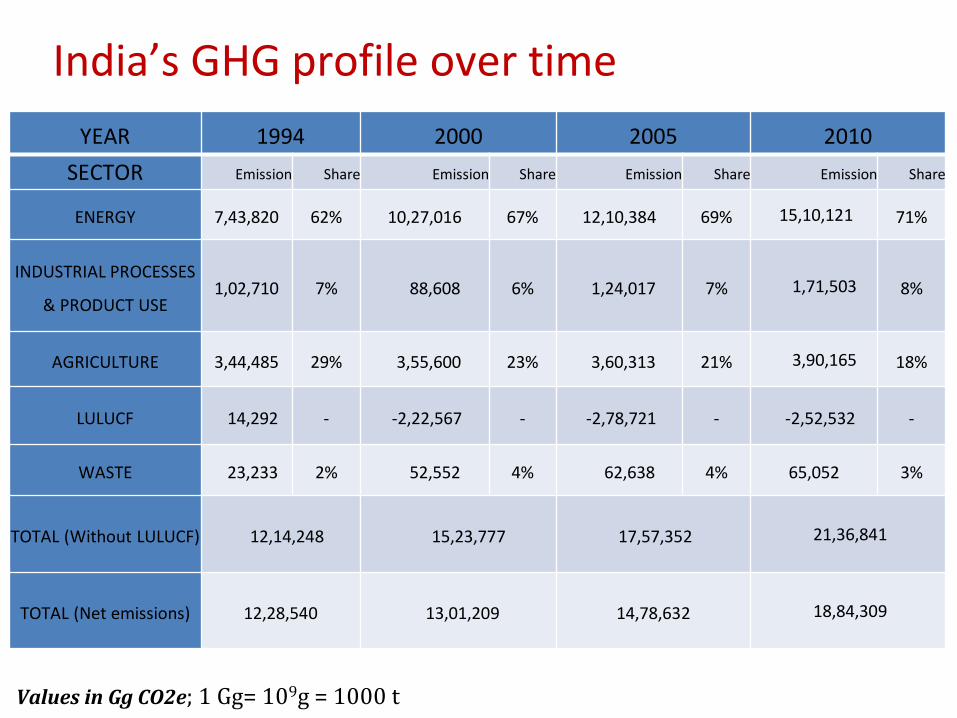
India’s GHG profile over time YEAR 1994 2000 2005 2010
SECTOR Emission Share Emission Share Emission Share Emission Share
ENERGY 7,43,820 62% 10,27,016 67% 12,10,384 69% 15,10,121 71%
INDUSTRIAL PROCESSES
& PRODUCT USE 1,02,710 7% 88,608 6% 1,24,017 7% 1,71,503 8%
AGRICULTURE 3,44,485 29% 3,55,600 23% 3,60,313 21% 3,90,165 18%
LULUCF 14,292 - -2,22,567 - -2,78,721 - -2,52,532 -
WASTE 23,233 2% 52,552 4% 62,638 4% 65,052 3%
TOTAL (Without LULUCF) 12,14,248 15,23,777 17,57,352 21,36,841
TOTAL (Net emissions) 12,28,540 13,01,209 14,78,632 18,84,309
Values in Gg CO2e; 1 Gg= 109g = 1000 t
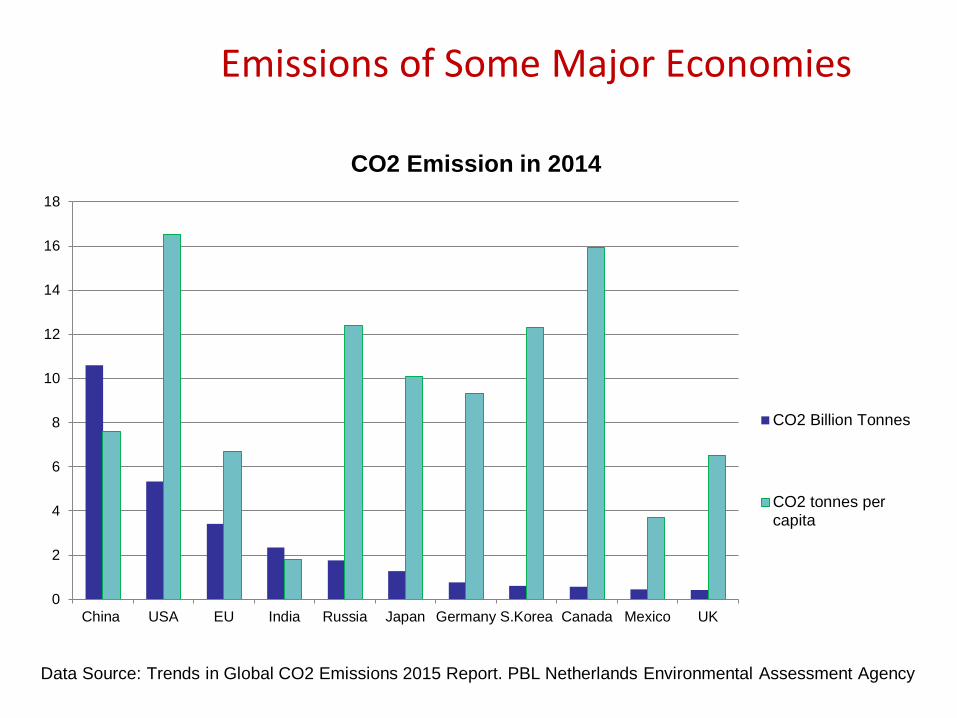
Emissions of Some Major Economies
0
2
4
6
8
10
12
14
16
18
China USA EU India Russia Japan Germany S.Korea Canada Mexico UK
CO2 Emission in 2014
CO2 Billion Tonnes
CO2 tonnes percapita
Data Source: Trends in Global CO2 Emissions 2015 Report. PBL Netherlands Environmental Assessment Agency

Voluntary pledge (2010)- India will endeavor to reduce the emissions intensity of its GDP by 20-25% by 2020 compared with the 2005 level; emissions from the agriculture sector would not form part of the assessment of emissions intensity. INDC (2015)- To reduce the emissions intensity of GDP by 33-35% by 2030 from 2005 level. 12% reduction in emission intensity achieved between 2005 and 2010
Mitigation Actions

20-25% reduction 33-35%
reduction
-12%
-8-15%
-8-15%
2005
2010
2020
2030
• 2005-2010: Reduction of about 12% in emission intensity achieved
in 5 years
• 2010-2020: further reduction of about 8-15% in emission intensity
of GDP is required in 10 years to meet voluntary pledge
• 2020-2030: A further reduction of about 8-15% in emission intensity
of GDP is required in 10 years to meet INDC target

Government’s Initiatives
National Action Plan on Climate Change- 8 missions
State Action Plan on Climate Change
Energy sector:
Increased target of renewable energy capacity to 175,000 MW by 2022
Renewable Energy Certificate (REC) to promote renewable energy and facilitate
Renewable Purchase Obligations (RPOs)
National Clean Environment Fund created; coal cess: Rs. 400/ metric tonne
Perform Achieve Trade (PAT)
Clean Coal Technology Initiatives
Super Efficient Equipment Programme
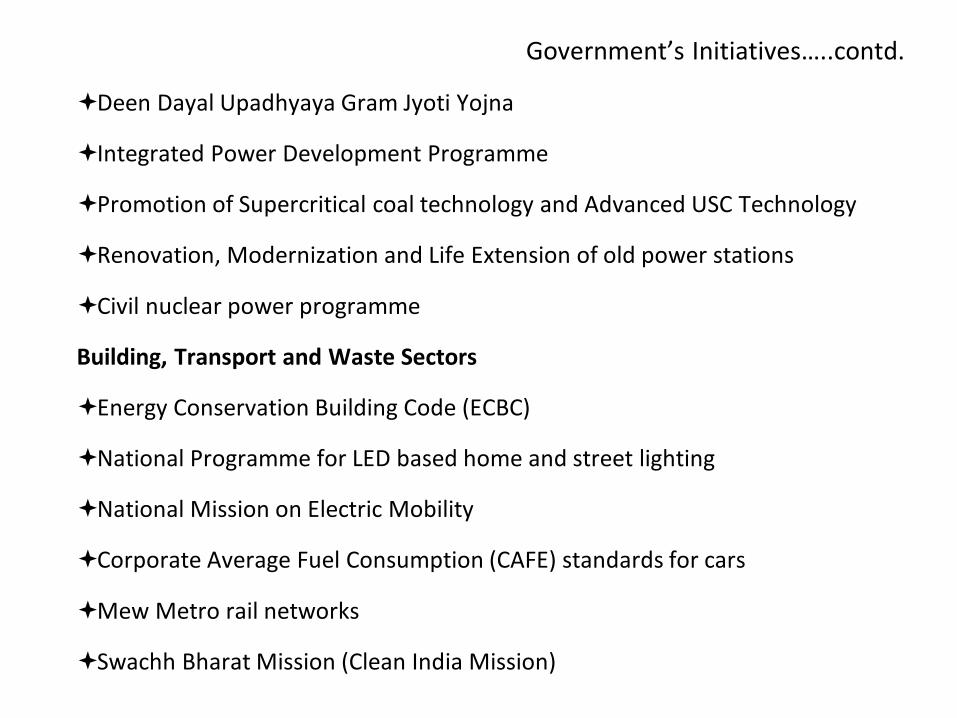
Government’s Initiatives…..contd.
Deen Dayal Upadhyaya Gram Jyoti Yojna
Integrated Power Development Programme
Promotion of Supercritical coal technology and Advanced USC Technology
Renovation, Modernization and Life Extension of old power stations
Civil nuclear power programme
Building, Transport and Waste Sectors
Energy Conservation Building Code (ECBC)
National Programme for LED based home and street lighting
National Mission on Electric Mobility
Corporate Average Fuel Consumption (CAFE) standards for cars
Mew Metro rail networks
Swachh Bharat Mission (Clean India Mission)

Finance, Technology and Capacity Building needs
• Adaptation related public spending: 12% of budget in 2013-14 (~2% of
GDP)
• Around USD 90 billion needed for solar capacity target
• About USD 21 billion required for grid infrastructure for renewable power
• Technology, finance and capacity building needs for sectors like Renewable
Energy, Clean coal technology, hydro power, shale gas, nuclear power and
transport
Domestic Measurement Reporting and Verification Arrangements
• India has well established monitoring systems for measuring and reporting of energy efficiency, renewable energy, agriculture and forestry sector programmes and projects
• Currently no MRV for GHG emissions and mitigation, but have arrangements for MRV of different kinds of parameters
• Forest area monitoring by latest remote sensing techniques
• Appropriate institutional mechanisms and capacity building required for
establishment of integrated domestic MRV arrangements with international support

Additional Information
• Sectoral reforms relating to GHG emissions
• 137 National and 286 State level policies and measures towards mitigating
climate change mapped on a non- exclusive basis.
• Actual number of policies and measures could be more.

Other initiatives of GoI

Current Activities
Preparation of Second and Third Biennial Update Reports
Preparation of Third National Communication
21

THANK YOU