2016 - unfccc · 2016 second biennial report of the united states of america under the united...
TRANSCRIPT

2016SECOND BIENNIAL REPORT of the United States of America
Under the United Nations Framework Convention on Climate Change


Published by the U.S. Department of State. You may electronically download this document from the UN Framework Convention on Climate Change website: http://unfccc.int/national_reports/biennial_reports_and_iar/submitted_biennial_reports/items/7550.php
2016SECOND BIENNIAL REPORT of the United States of America
Under the United Nations Framework Convention on Climate Change
Abbreviations and Acronyms . . . . . . . . . . . . . . . . . . . . . . . . . . . . . . . . . . . . . . . . . . . . . . . . . . . . 41. Introduction: Delivering Ambitious U.S. Climate Action . . . . . . . . . . . . . . . . . . . . . . . . . .72. U.S. Greenhouse Gas Emissions and Trends . . . . . . . . . . . . . . . . . . . . . . . . . . . . . . . . . . . . 9 Carbon Dioxide Emissions . . . . . . . . . . . . . . . . . . . . . . . . . . . . . . . . . . . . . . . . . . . . . . . . . . . . .10 Electricity Generation . . . . . . . . . . . . . . . . . . . . . . . . . . . . . . . . . . . . . . . . . . . . . . . . . . . . . . . 11 Transportation End-Use Sector . . . . . . . . . . . . . . . . . . . . . . . . . . . . . . . . . . . . . . . . . . . . . . 11 Industrial End-Use Sector . . . . . . . . . . . . . . . . . . . . . . . . . . . . . . . . . . . . . . . . . . . . . . . . . . . . 12 Residential and Commercial End-Use Sectors . . . . . . . . . . . . . . . . . . . . . . . . . . . . . . . . . 12 Methane Emissions . . . . . . . . . . . . . . . . . . . . . . . . . . . . . . . . . . . . . . . . . . . . . . . . . . . . . . . . . . . 13 Nitrous Oxide Emissions . . . . . . . . . . . . . . . . . . . . . . . . . . . . . . . . . . . . . . . . . . . . . . . . . . . . . . 13 Hydrofluorocarbon, Perfluorocarbon, and Sulfur Hexafluoride Emissions . . . . . . . . 13 Land Use, Land-Use Change, and Forestry . . . . . . . . . . . . . . . . . . . . . . . . . . . . . . . . . . . . . . 133. Policies Driving Substantial Progress toward Our Targets . . . . . . . . . . . . . . . . . . . . . .15 Major Federal Actions on Mitigation . . . . . . . . . . . . . . . . . . . . . . . . . . . . . . . . . . . . . . . . . . . 15
Carbon Pollution Standards for Power Plants . . . . . . . . . . . . . . . . . . . . . . . . . . . . . . . . . . 15 Increased Efficiency of Cars and Trucks . . . . . . . . . . . . . . . . . . . . . . . . . . . . . . . . . . . . . . .16 Building Renewable Energy . . . . . . . . . . . . . . . . . . . . . . . . . . . . . . . . . . . . . . . . . . . . . . . . . .18 Cutting-Energy Waste in Buildings and Homes . . . . . . . . . . . . . . . . . . . . . . . . . . . . . . . .19 Alternative Fuels for Vehicles . . . . . . . . . . . . . . . . . . . . . . . . . . . . . . . . . . . . . . . . . . . . . . . 20 Clean Energy Research and Development . . . . . . . . . . . . . . . . . . . . . . . . . . . . . . . . . . . .21 Phasing Down Hydrofluorocarbons . . . . . . . . . . . . . . . . . . . . . . . . . . . . . . . . . . . . . . . . . . 22 Reducing Methane Emissions . . . . . . . . . . . . . . . . . . . . . . . . . . . . . . . . . . . . . . . . . . . . . . 23 Agriculture and Forest Emissions . . . . . . . . . . . . . . . . . . . . . . . . . . . . . . . . . . . . . . . . . . . . 24 Federal Government Leading by Example . . . . . . . . . . . . . . . . . . . . . . . . . . . . . . . . . . . . 26 Other Federally Driven Measures . . . . . . . . . . . . . . . . . . . . . . . . . . . . . . . . . . . . . . . . . . . 27
Regional, State, and Local Actions on Mitigation . . . . . . . . . . . . . . . . . . . . . . . . . . . . . . . 27 Regional Emissions Trading . . . . . . . . . . . . . . . . . . . . . . . . . . . . . . . . . . . . . . . . . . . . . . . . . 27 Power Sector Programs and Standards . . . . . . . . . . . . . . . . . . . . . . . . . . . . . . . . . . . . . . . 28 Other State and Local Initiatives . . . . . . . . . . . . . . . . . . . . . . . . . . . . . . . . . . . . . . . . . . . . . 28
4. Projections: Delivering on Our 2020 and 2025 Targets . . . . . . . . . . . . . . . . . . . . . . . . 30 Projections for Current and Additional Measures . . . . . . . . . . . . . . . . . . . . . . . . . . . . . . . 30 Projections: Delivering on Our 2020 and 2025 Targets . . . . . . . . . . . . . . . . . . . . . . . . . 30 Projections Methodology . . . . . . . . . . . . . . . . . . . . . . . . . . . . . . . . . . . . . . . . . . . . . . . . . . . . . .31
Integrated Projections Approach . . . . . . . . . . . . . . . . . . . . . . . . . . . . . . . . . . . . . . . . . . . . .31 Updates to Land Use, Land-Use Change, and Forestry Methodology . . . . . . . . . . . .31 Range of Land Use, Land-Use Change, and Forestry Projections . . . . . . . . . . . . . . . 32
Current Measures Projections . . . . . . . . . . . . . . . . . . . . . . . . . . . . . . . . . . . . . . . . . . . . . . . . 35 Additional Measures Projections . . . . . . . . . . . . . . . . . . . . . . . . . . . . . . . . . . . . . . . . . . . . . . 36
Table of Contents

3 Table of Contents
Carbon Dioxide . . . . . . . . . . . . . . . . . . . . . . . . . . . . . . . . . . . . . . . . . . . . . . . . . . . . . . . . . . . . 36 Hydrofluorocarbons . . . . . . . . . . . . . . . . . . . . . . . . . . . . . . . . . . . . . . . . . . . . . . . . . . . . . . . . 37 Methane and Nitrous Oxide . . . . . . . . . . . . . . . . . . . . . . . . . . . . . . . . . . . . . . . . . . . . . . . . 37
Summary of Projections: Progress toward our 2020 and 2025 Targets . . . . . . . . . 385. Supporting the Global Community: International Climate Finance
and Other Activities . . . . . . . . . . . . . . . . . . . . . . . . . . . . . . . . . . . . . . . . . . . . . . . . . . . . . . . 40 Financing Climate Change Action—Overview of U.S. Climate Finance
in FYs 2013–2014 . . . . . . . . . . . . . . . . . . . . . . . . . . . . . . . . . . . . . . . . . . . . . . . . . . . . . . . . . . . . 40 Climate Finance Channels . . . . . . . . . . . . . . . . . . . . . . . . . . . . . . . . . . . . . . . . . . . . . . . . . . .41 Financial Instruments . . . . . . . . . . . . . . . . . . . . . . . . . . . . . . . . . . . . . . . . . . . . . . . . . . . . . . 42 Geography . . . . . . . . . . . . . . . . . . . . . . . . . . . . . . . . . . . . . . . . . . . . . . . . . . . . . . . . . . . . . . . . 42 Pillars . . . . . . . . . . . . . . . . . . . . . . . . . . . . . . . . . . . . . . . . . . . . . . . . . . . . . . . . . . . . . . . . . . . . . 43 Promoting Effectiveness . . . . . . . . . . . . . . . . . . . . . . . . . . . . . . . . . . . . . . . . . . . . . . . . . . . . . 45 Supporting Country-Driven Approaches . . . . . . . . . . . . . . . . . . . . . . . . . . . . . . . . . . . . . 45 Building Effective Enabling Environments . . . . . . . . . . . . . . . . . . . . . . . . . . . . . . . . . . . . . 45 Scaling Down Support for High-Carbon Infrastructure . . . . . . . . . . . . . . . . . . . . . . . . 46
Ensuring Transparency . . . . . . . . . . . . . . . . . . . . . . . . . . . . . . . . . . . . . . . . . . . . . . . . . . . . . . 46 New and Additional Climate Finance . . . . . . . . . . . . . . . . . . . . . . . . . . . . . . . . . . . . . . . . . . 46
Mobilizing Private Finance . . . . . . . . . . . . . . . . . . . . . . . . . . . . . . . . . . . . . . . . . . . . . . . . . 46 Technology Development and Transfer . . . . . . . . . . . . . . . . . . . . . . . . . . . . . . . . . . . . . . . 48 Changes in Policies and Activities since the First Biennial Report . . . . . . . . . . . . . . . . 49 Challenges in Delivering Technology Transfer and Development . . . . . . . . . . . . . . . . 49
Energy Activities at the National, Regional, and Global Levels . . . . . . . . . . . . . . . . . . 49 Adaptation and Sustainable Landscapes at the National, Regional, and Global Levels . . . . . . . . . . . . . . . . . . . . . . . . . . . . . . . . . . . . . . . . . . . . . . . . . . . . . . . . 53
Capacity Building . . . . . . . . . . . . . . . . . . . . . . . . . . . . . . . . . . . . . . . . . . . . . . . . . . . . . . . . . . . . 556. Conclusion . . . . . . . . . . . . . . . . . . . . . . . . . . . . . . . . . . . . . . . . . . . . . . . . . . . . . . . . . . . . . . . . . . 57Appendix 1: Methodologies Used in the Reporting of Financial Information . . . . . . . . 58 Overall Methodology for Producing Information on Climate Finance . . . . . . . . . . . . 58 Methodology for Determining Which Funds Are “Climate-Specific” . . . . . . . . . . . . 59
Adaptation . . . . . . . . . . . . . . . . . . . . . . . . . . . . . . . . . . . . . . . . . . . . . . . . . . . . . . . . . . . . . . . . 59 Clean Energy . . . . . . . . . . . . . . . . . . . . . . . . . . . . . . . . . . . . . . . . . . . . . . . . . . . . . . . . . . . . . . 60 Sustainable Landscapes . . . . . . . . . . . . . . . . . . . . . . . . . . . . . . . . . . . . . . . . . . . . . . . . . . . . 60
Methodology Used to Specify Funds as “Committed” . . . . . . . . . . . . . . . . . . . . . . . . . . .61 Methodology Used for Reporting Core/General Contributions through . . . . . . . . . .61
Multilateral Channels Other Methodological Issues . . . . . . . . . . . . . . . . . . . . . . . . . . . . . . . . . . . . . . . . . . . . . . . . . .61Appendix 2: Methodologies for Current Measures and Additional Measures . . . . . . . . . . 62 Energy Carbon Dioxide . . . . . . . . . . . . . . . . . . . . . . . . . . . . . . . . . . . . . . . . . . . . . . . . . . . . . . 62 Methane and Nitrous Oxide . . . . . . . . . . . . . . . . . . . . . . . . . . . . . . . . . . . . . . . . . . . . . . . . . . 63 Hydrofluorocarbons . . . . . . . . . . . . . . . . . . . . . . . . . . . . . . . . . . . . . . . . . . . . . . . . . . . . . . . . . 63 Land-Use Sink—Synthesis Projections and Uncertainty . . . . . . . . . . . . . . . . . . . . . . . . 64Appendix 3: U.S. Policies and Measures . . . . . . . . . . . . . . . . . . . . . . . . . . . . . . . . . . . . . . . . . 65Bibliography . . . . . . . . . . . . . . . . . . . . . . . . . . . . . . . . . . . . . . . . . . . . . . . . . . . . . . . . . . . . . . . . . . . 74
Table of Contents

AEO Annual Energy Outlook AFV alternative fuel vehicleARPA-E Advanced Research Projects Agency–Energy ASHRAE American Society of Heating, Refrigerating, and Air-Conditioning Engineers BAU business as usual BR Biennial Report Btu British thermal unit C2F6 hexafluoroethane CAFE corporate average fuel economyCAA Clean Air Act CBET cross-border electricity trade CCAC Climate and Clean Air Coalition CCS carbon capture and storageCEADIR Climate Economic Analysis for Development, Investment, and ResilienceCESC Clean Energy Solutions Center CH4 methaneCO2 carbon dioxideCO2e carbon dioxide equivalent COP Conference of the Parties CPP Clean Power PlanCRP Conservation Reserve Program CTCN Climate Technology Centre and NetworkCTF common tabular format DASP Disaster Assistance Support Program DC direct current DFI development finance institution DOD United States Department of Defense DOE United States Department of EnergyDOI United States Department of the InteriorDOS United States Department of State DOT United States Department of TransportationECA export credit agency EC-LEDS Enhancing Capacity for Low Emission Development Strategies EIA United States Energy Information Administration EPA United States Environmental Protection AgencyEPSA Energy Policy and Systems Analysis EV electric vehicle
Acronyms and Abbreviations
5
EXIM Export-Import Bank of the United States FSF fast-start finance FY fiscal year GCCI Global Climate Change Initiative GDP gross domestic productGEF Global Environment FacilityGHG greenhouse gas GIZ Deutsche Gesellschaft für Internationale Zusammenarbeitgpm grams per mile GW gigawatts GWP global warming potentialHCFC hydrochlorofluorocarbon HDV heavy-duty vehicle HFC hydrofluorocarbonHUD United States Department of Housing and Urban Development IBRs integrated biorefineriesIPCC Intergovernmental Panel on Climate ChangeISGAN International Smart Grid Action Network kt kilotonkWh kilowatt-hourLDCs least-developed countries LDV light-duty vehicleLEAP Global Lighting and Energy Access Partnership LEDS low-emission development strategies LULUCF land use, land-use change, and forestryMAC marginal abatement cost curveMCC Millennium Challenge Corporation MDB multilateral development bank mpg miles per gallon MSW municipal solid waste Mt million metric tons MW megawatts MY model yearN2O nitrous oxideNAP National Adaptation PlanningNASA National Aeronautics and Space AdministrationNDE National Designated EntityNEMS National Energy Modeling System NF3 nitrogen trifluorideNOAA National Oceanic and Atmospheric Administration NSIs national systems of innovationOAP Office of Atmospheric Programs OECD Organisation for Economic Co-operation and Development OPIC Overseas Private Investment Corporation PACE U .S .–India Partnership to Advance Clean Energy PEACE Promoting Energy Access through Clean Energy
Acronyms and Abbreviations

6 2016 Second Biennial Report
PFC perfluorocarbonR&D research and developmentRCSPs Regional Carbon Sequestration PartnershipsREDD+ reducing emissions from deforestation and forest degradationRFS Renewable Fuel Standard RPS renewable portfolio standard SEAD Super-efficient Equipment and Appliance Deployment SF6 sulfur hexafluorideSLCP short-lived climate pollutant SNAP Significant New Alternatives Policy TEC Technology Executive Committee Tg teragram TRIPS Trade-Related Aspects of Intellectual Property Rights UNFCCC United Nations Framework Convention on Climate Change USAID United States Agency for International Development USDA United States Department of AgricultureUSFS United States Forest ServiceUSTDA United States Trade Development Agency USWP U .S . Water Partnership VOC volatile organic compound

Addressing nearly 150 world leaders at the 2015 Conference of the Parties (COP) to the United Nations Framework Convention on Climate Change (UNFCCC) in Paris, President Obama stated: “Nearly 200 nations have assembled here this week—a
declaration that for all the challenges we face, the growing threat of climate change could define the contours of this century more dramatically than any other .” The United States is strongly committed to taking action and leading internationally to meet this challenge . Working together, we can set a new global course that will reduce the greatest risks of climate change and keep the world on a pathway to limit warming to less than 2 degrees Celsius .
The effects of climate change are already being felt around the world and across our nation . Certain types of extreme weather events with links to climate change have become more frequent or more intense, including heat waves, heavy rainfall, and in some regions, floods and droughts . These extreme weather events—from the recent severe droughts and wildfires in the West to record heat waves throughout the country—are hitting communities across the United States . Fourteen of the 15 warmest years on record have all occurred in the first 15 years of this century; 2014 was the warmest year ever, and 2015 is on track to be warmer still . The most vulnerable among us—including children, older adults, people with heart or lung disease, and people living in poverty—are most at risk from the impacts of climate change .
These and other aspects of climate change are disrupting people’s lives and damaging our economy . Delaying our response will only make the situation worse for people around the world; thus, taking meaningful action now is critical .
President Obama understands the urgency of the issue and has been leading domestic and international efforts to confront this challenge . Building on major first-term actions, such as fuel economy standards, the President released the Climate Action Plan in 2013, which outlines his vision to cut greenhouse gas (GHG) pollution, prepare American communities for the im-pacts of climate change, and engage internationally (EOP 2013) . Since then, the United States has initiated and completed an ambitious series of policies and measures across all sectors of the U .S . economy . These actions are already driving down carbon pollution and other GHG emissions, and are also creating cleaner air, better health for our communities, increased en-ergy security, and new economic opportunities .
Our longstanding, consistent investments in science and technology have combined with poli-cies and market developments to spur dramatic decreases in the costs of clean energy, assist-ing the U .S . transition to a low-carbon economy . We are working with communities and state, tribal, and local governments to build resilience and adapt to climate-related hazards . We have also been leading internationally and working closely with the global community to de-liver the components of an ambitious and durable international approach to climate change .
Introduction: Delivering Ambitious U.S. Climate Action

8 2016 Second Biennial Report
These efforts include creating new and bolstering existing agreements, such as the U .S .–China Joint Announcement and Joint Statement, the U .S .–Brazil Joint Statement, U .S .–Mexico par-ticipation on a high-level bilateral clean energy and climate policy interagency task force, and our engagement with the UNFCCC process and other multilateral and bilateral forums .
The 2016 Second Biennial Report of the United States of America presents the actions we are un-dertaking to deliver on our climate goals and to support our global partners . It begins with an overview of the Inventory of U.S. Greenhouse Gas Emissions and Sinks: 1990-2013 (U .S .EPA/OAP 2015) and recent trends in U .S . emissions . It then details the components of The President’s Climate Action Plan (EOP 2013), shows how we are on track to reach our 2020 emission re-duction target, and demonstrates how we are setting up the foundation to reach our ambi-tious 2025 target . It then describes how the United States is supporting the global effort through financial, technological, and capacity-building support to developing countries .
In 2007, U .S . emissions peaked at about 0 .5 percent above 2005 levels . Since then, they have generally been on a downward trajectory, led recently by policy actions . In 2013, U .S . emis-sions were 10 percent below 2005 levels . Since 2005, fuel economy standards, appliance ef-ficiency standards, building codes, and private-sector innovation have reduced energy consumption by roughly 2 percent, even as real gross domestic product (GDP) increased by 13 percent . This record demonstrates our ability to grow our economy and reduce energy consumption and emissions simultaneously .
This report is organized as follows: Chapter 2 describes U .S . GHG emissions and trends, sum-marizing historical and current information for all sectors and gases covered in the U .S . GHG inventory; Chapter 3 outlines the major policies and measures we have implemented and plan to implement to drive our emissions down to meet our economy-wide 2020 and 2025 emis-sion reduction targets; Chapter 4 presents our estimates of how existing and additional policy measures will drive down emissions, and demonstrates how they place us on track to hit our 2020 target and lay the foundation for reaching our 2025 target; and Chapter 5 shows how we are supporting the global community through technology, climate finance, and capacity building, and details our efforts to ensure that developing countries have the ability to re-spond to climate change in a way appropriate for their circumstances .
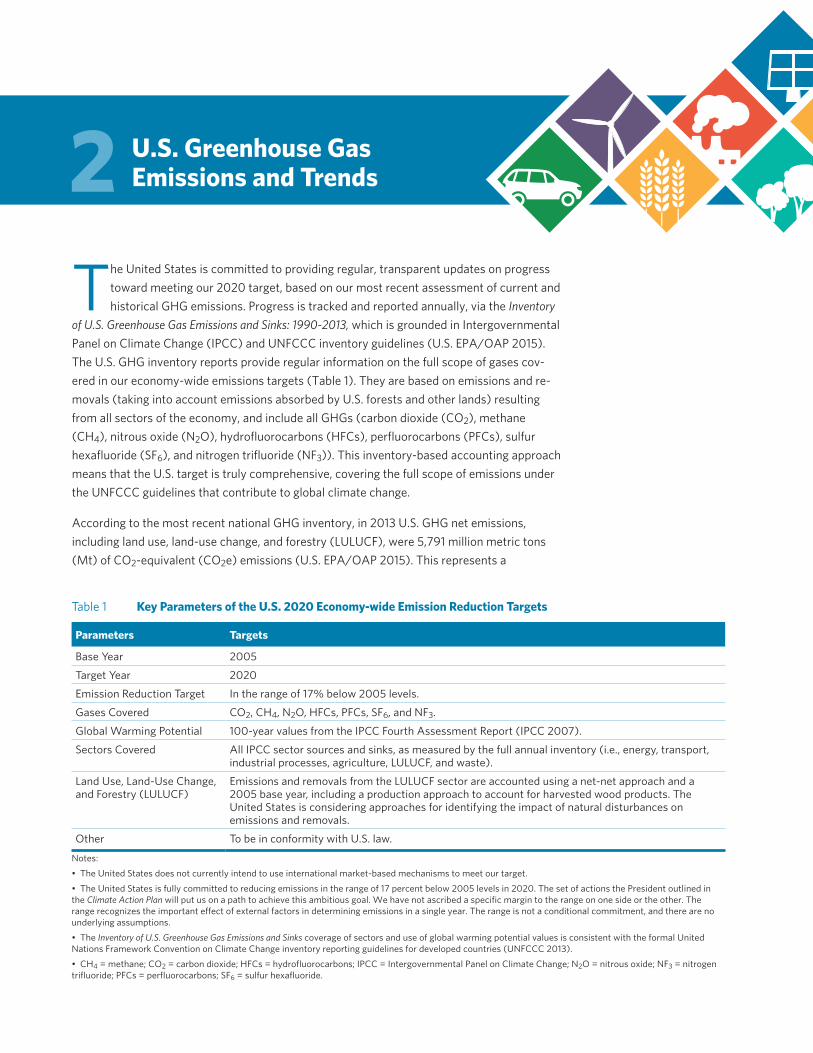
The United States is committed to providing regular, transparent updates on progress
toward meeting our 2020 target, based on our most recent assessment of current and historical GHG emissions . Progress is tracked and reported annually, via the Inventory
of U.S. Greenhouse Gas Emissions and Sinks: 1990-2013, which is grounded in Intergovernmental Panel on Climate Change (IPCC) and UNFCCC inventory guidelines (U .S . EPA/OAP 2015) . The U .S . GHG inventory reports provide regular information on the full scope of gases cov-ered in our economy-wide emissions targets (Table 1) . They are based on emissions and re-movals (taking into account emissions absorbed by U .S . forests and other lands) resulting from all sectors of the economy, and include all GHGs (carbon dioxide (CO2), methane (CH4), nitrous oxide (N2O), hydrofluorocarbons (HFCs), perfluorocarbons (PFCs), sulfur hexafluoride (SF6), and nitrogen trifluoride (NF3)) . This inventory-based accounting approach means that the U .S . target is truly comprehensive, covering the full scope of emissions under the UNFCCC guidelines that contribute to global climate change .
According to the most recent national GHG inventory, in 2013 U .S . GHG net emissions, including land use, land-use change, and forestry (LULUCF), were 5,791 million metric tons (Mt) of CO2-equivalent (CO2e) emissions (U .S . EPA/OAP 2015) . This represents a
U.S. Greenhouse Gas Emissions and Trends
Table 1 Key Parameters of the U.S. 2020 Economy-wide Emission Reduction Targets
Parameters Targets
Base Year 2005
Target Year 2020
Emission Reduction Target In the range of 17% below 2005 levels .
Gases Covered CO2, CH4, N2O, HFCs, PFCs, SF6, and NF3 .
Global Warming Potential 100-year values from the IPCC Fourth Assessment Report (IPCC 2007) .
Sectors Covered All IPCC sector sources and sinks, as measured by the full annual inventory (i .e ., energy, transport, industrial processes, agriculture, LULUCF, and waste) .
Land Use, Land-Use Change, and Forestry (LULUCF)
Emissions and removals from the LULUCF sector are accounted using a net-net approach and a 2005 base year, including a production approach to account for harvested wood products . The United States is considering approaches for identifying the impact of natural disturbances on emissions and removals .
Other To be in conformity with U .S . law .
Notes:
• The United States does not currently intend to use international market-based mechanisms to meet our target .
• The United States is fully committed to reducing emissions in the range of 17 percent below 2005 levels in 2020 . The set of actions the President outlined in the Climate Action Plan will put us on a path to achieve this ambitious goal . We have not ascribed a specific margin to the range on one side or the other . The range recognizes the important effect of external factors in determining emissions in a single year . The range is not a conditional commitment, and there are no underlying assumptions .
• The Inventory of U.S. Greenhouse Gas Emissions and Sinks coverage of sectors and use of global warming potential values is consistent with the formal United Nations Framework Convention on Climate Change inventory reporting guidelines for developed countries (UNFCCC 2013) .
• CH4 = methane; CO2 = carbon dioxide; HFCs = hydrofluorocarbons; IPCC = Intergovernmental Panel on Climate Change; N2O = nitrous oxide; NF3 = nitrogen trifluoride; PFCs = perfluorocarbons; SF6 = sulfur hexafluoride .

10 2016 Second Biennial Report
10 percent reduction below 2005 levels . Despite continued economic growth, annual net emissions have declined by 1 .3 percent on average since 2005—a reversal of past trends of average annual increases of 1 .1 percent per year from 1990 to 2005 (Figures 1 and 2) .
Figure 1 U.S. Greenhouse Gas Emissions and Removals by Source: 2005–2013
-1,000
0
1,000
2,000
3,000
4,000
5,000
6,000
7,000
8,000
2005 2006 2007 2008 2009 2010 2011 2012 2013
■ Waste ■ Industrial processes ■ Agriculture ■ Energy ■ Land use, land-use change, and forestry
Mt C
O2e
Source: U .S . EPA/OAP 2015 .
Figure 2 Comparison of U.S. Real Gross Domestic Product, Primary Energy, and Net Emissions: 2005–2013
2005 2006 2007 2008 2009 2010 2011 2012 2013 75
80
85
90
95
100
105
110
115
120
125
Inde
x (2
005=
100)
Real GDP
U.S. EnergyConsumption
Net Emissions(Sources and Sinks)

11
CARBON DIOXIDE EMISSIONS
Since 2007, the United States has seen significant reductions in emissions of CO2, the pri-mary GHG emitted by human activities . In 2013, CO2 emissions represented more than 82 percent of total U .S . GHG emissions . The major economic sectors that contribute to CO2 emissions from fossil fuel combustion are electricity generation; transportation; and indus-trial, residential, and commercial end use (Figure 3) .
From 1990 through the mid-2000s, energy-related CO2 emissions increased from approxi-mately 4,900 Mt to a peak of just over 5,900 Mt in 2007 . Policies and market developments have subsequently driven CO2 emissions down sharply, to approximately 5,300 Mt in 2013—down 10 percent from 2005 levels .
Emissions from fossil fuel combustion, the largest source of CO2 emissions (94 percent, ex-cluding removals from LULUCF) and of overall GHG emissions (77 percent), decreased at an average annual rate of 1 .3 percent from 2005 to 2013 . Historically, changes in emissions from fossil fuel combustion have been the dominant factor affecting U .S . emission trends . According to the U .S . Energy Information Administration, in 2013, approximately 82 percent of the energy consumed in the United States (on a British thermal unit (Btu) basis) was pro-duced through the combustion of fossil fuels (U .S . DOE/EIA 2015b) . The remaining 18 per-cent came from other energy sources, such as hydropower, biomass, nuclear, wind, and solar energy (Figures 3 and 4) .
Electricity GenerationThe United States relies on electricity to meet a significant portion of its energy demands . Electricity generators consumed 34 percent of U .S . energy from fossil fuels and emitted 40 percent of the CO2 from fossil fuel combustion in 2013 . Due principally to shifting from coal to natural gas, as well as rapidly growing deployment of renewable sources of energy, in 2013, CO2 emissions from electricity generation decreased to 15 percent below 2005 levels .
Transportation End-Use SectorTransportation activities (excluding international bunker fuels) accounted for 33 percent of CO2 emissions from fossil fuel combustion in 2013 . Virtually all of the energy consumed in
Figure 3 U.S. Greenhouse Gas Emissions by Gas and by Sector: 2013
Source: U .S . EPA/OAP 2015 .
Methane10%
Carbondioxide
82%
Nitrous oxide5%
Fluorinated gases3% Residential
6%Commercial6%
Agriculture9%
Industry21%
Electricitygeneration
31%
Transportation27%
Note: Percentages are based on Mt CO2e .
2 U .S . Greenhouse Gas Emissions and Trends

12 2016 Second Biennial Report
this end-use sector came from petroleum products . Nearly 62 percent of the emissions re-sulted from gasoline consumption for personal vehicle use, while the remaining emissions came from other transportation activities, including the combustion of diesel fuel in heavy-duty vehicles and jet fuel in aircraft . From 2005 to 2013, transportation emissions dropped by 9 percent due, in part, to increased fuel efficiency across the U .S . vehicle fleet and efficiency in the domestic aviation system .
Industrial End-Use SectorIndustrial CO2 emissions, resulting both directly from the combustion of fossil fuels and indi-rectly from the generation of electricity that is consumed by industry, accounted for 25 per-cent of CO2 from fossil fuel combustion in 2013 . Emissions from industry have steadily declined since 2005 (11 percent) due to structural changes in the U .S . economy (i .e ., shifts from a manufacturing-based to a service-based economy), fuel switching, and efficiency improvements .
Residential and Commercial End-Use SectorsThe residential and commercial end-use sectors accounted for 21 and 22 percent, respec-tively, of CO2 emissions from fossil fuel combustion in 2013, including each sector’s “indirect” emissions from electricity consumption . Both sectors relied heavily on electricity to meet en-ergy demands; 72 and 79 percent of residential and commercial emissions, respectively, were attributable to electricity consumption for lighting, heating, cooling, and operating appliances .
Figure 4 U.S. Primary Energy Profile Highlights: 2005–2014 Energy use has declined since 2005, while real GDP and population have increased . In addition, clean energy sources, including renewables, are growing as a fraction of the overall U .S . energy economy .
100 Quads 99 Quads 97 Quads 98 Quads
0
20
40
60
80
100
2005 2008 2011
■ Nonhydro Renewables■ Hydropower ■ Nuclear■ Natural Gas■ Coal■ Petroleum
2014
4%3%
8%
23%
23%
40%
5%3%
8%
24%
22%
37%
6%3%
8%
25%
20%
35%
7%2%
8%
28%
18%
35%
Qua
drill
ion
Btu

13
Emissions from the residential and commercial end-use sectors, including both direct emis-sions and indirect emissions from electricity consumption, have decreased by 8 percent and slightly more than 1 percent since 2005, respectively .
METHANE EMISSIONS
Between 2005 and 2013, CH4 emissions decreased by more than 10 percent . These emis-sions primarily result from enteric fermentation associated with domestic livestock, natural gas systems, and decomposition of wastes in landfills . Emissions from natural gas systems, the second-largest anthropogenic source of CH4 emissions, decreased by 11 percent since 2005, primarily as a result of a drop in emissions from field production .
NITROUS OXIDE EMISSIONS
Agricultural soil management, mobile-source fuel combustion, and stationary-source fuel combustion were the major sources of N2O emissions, which decreased slightly from 2005 levels . Making up 74 percent of total N2O emissions, highly variable agricultural sector fac-tors affecting soils are the main factors that influence overall N2O levels .
HYDROFLUOROCARBON, PERFLUOROCARBON, AND SULFUR HEXAFLUORIDE EMISSIONS
Despite being emitted in smaller quantities than the other principal GHGs, emissions of HFCs, PFCs, and SF6 constitute a significant and growing share of U .S . emissions, because many of these gases have extremely high global warming potentials (GWPs) and, in the cases of PFCs and SF6, long atmospheric lifetimes . Emissions of substitutes for ozone-depleting substances and emissions of HFC-23 during the production of hydrochlorofluorocarbon (HCFC)-22 were the primary contributors to aggregate HFC emissions, which as a class of fluorinated gases increased by 24 percent between 2005 and 2013 (although HFC-23 has dropped substan-tially as a component of this overall trend) . PFC emissions declined by 12 percent, resulting from both the decline in aluminum production and actions taken by aluminum manufacturers to reduce emissions . Electrical transmission and distribution systems accounted for most SF6 emissions, which were down 52 percent from 2005 levels in 2013 because of reductions un-dertaken through voluntary partnerships with the industry .
LAND USE, LAND-USE CHANGE, AND FORESTRY
In 2013, the land sector resulted in a net carbon sequestration of 882 Mt CO2e, which, in ag-gregate, offset 13 .2 percent of total U .S . GHG emissions . While the primary driver of the land sector carbon uptake was growth in the existing stock of U .S . forests, other practices further bolstered the carbon sink, such as forest management, tree planting and growth of existing trees in urban areas, the management of agricultural soils, and growth in other carbon pools . Forests (including vegetation, soils, and harvested wood) accounted for 88 percent of total 2013 CO2 removals, urban trees accounted for 10 percent, mineral and organic soil carbon stock changes accounted for less than 0 .5 percent, and landfilled yard trimmings and food scraps accounted for 1 percent of the total CO2 removals in 2013 . The net forest sequestration is a result of forest growth and increasing forest area, as well as accumulation of carbon stocks in harvested wood pools .
2 U .S . Greenhouse Gas Emissions and Trends

14 2016 Second Biennial Report
The institutional arrangements for measuring progress toward the target are explained in more detail in the Inventory of U.S. Greenhouse Gas Emissions and Sinks 1990–2013, in Section 1 .2 on National Inventory Arrangements (U .S . EPA/OAP 2015) . The U .S . Environmental Protection Agency (EPA), in cooperation with other U .S . government agencies, prepares the annual GHG inventory . Several agencies and individuals are involved in supplying data to, reviewing, or pre-paring portions of the inventory, including federal and state government authorities, research and academic institutions, industry associations, and private consultants . Within EPA, the Office of Atmospheric Programs (OAP) is the lead office responsible for the emission calcula-tions provided in the national GHG inventory, as well as the completion of the National Inventory Report and the Common Reporting Format tables . EPA’s Office of Transportation and Air Quality is also involved in calculating emissions for the inventory . While the U .S . Department of State (DOS) officially submits the annual inventory to the UNFCCC, EPA’s OAP serves as the inventory focal point for technical questions and comments on the U .S . inventory . The institutional arrangements have not changed since the First Biennial Report of the United States of America.

Since President Obama took office, the United States has made substantial progress in advancing policies to reduce GHG emissions . These actions have accelerated during the past two years as the Obama Administration strives to meet the objectives set
forth in The President’s Climate Action Plan (EOP 2013) . The policies and measures established in the Climate Action Plan put the United States on track to meet its 2020 target and lay the foundation to reach our 2025 target . Since the First Biennial Report of the United States of America, the United States has proposed or finalized many new policies addressing GHG emissions within the federal government and across multiple sectors of the economy, includ-ing the transportation, power, energy end-use, industrial, agricultural, land-use and forestry, and waste sectors (U .S . DOS 2014a) .1 These actions will cut GHG emissions, improve air quality, and reduce waste, while saving consumers money and creating jobs in America . The emission reductions from these measures will build in effect and magnitude over time as old-er, less efficient cars and trucks are replaced with newer, more efficient vehicles; as consum-ers transition to cost-saving appliances; and as clean energy sources, such as wind and solar, are integrated into the electrical grid . This chapter outlines the major federal policies and re-gional, state, and local actions to reduce GHG pollution . Appendix 3 of this report presents a full list of policies and measures .
MAJOR FEDERAL ACTIONS ON MITIGATION
Carbon Pollution Standards for Power PlantsIn the summer of 2015, the United States took historic action to target the largest source of GHG emissions by finalizing the Clean Power Plan (CPP), which will limit carbon pollution from power plants under the Clean Air Act (CAA) . The CPP is one of the most significant single ac-tions the Administration has taken to date to combat climate change . By targeting power plants, which were responsible for 31 percent of U .S . GHG emissions in 2013, the CPP strengthens America’s progress toward cleaner and lower-polluting energy and will cut pollu-tion to historically low levels by 2030 . The final CPP sets flexible and achievable standards to reduce CO2 emissions by 32 percent from 2005 levels by 2030—cutting carbon pollution by 870 million tons, or the equivalent of the annual emissions from more than 166 million cars . Beyond the carbon reduction benefits, the CPP, and other policies put in place to drive a cleaner energy sector, will decrease pollutants that contribute to soot and smog and reduce premature deaths from power plant emissions by 90 percent in 2030 compared with 2005 . The public health and climate benefits of the CPP are estimated at up to $54 billion per year in 2030—much higher than anticipated costs of $5 .1–$8 .4 billion .
The final CPP rule was the result of two years of extensive outreach involving an unprecedent-ed level of EPA engagement with stakeholders . In 2013, the President directed EPA to use its authority under the CAA to set carbon emission standards for existing power plants and es-tablished a timeline to complete this task . EPA released its draft CPP one year later . EPA took
1 While many new policies have been implemented and initiated, our domestic institutional situation has not changed since the First Biennial Report of the United States of America .
Policies Driving Progress toward Our Targets

16 2016 Second Biennial Report
into account more than four million comments that were submitted during the public com-ment period when developing the final plan released in the summer of 2015 .
The CPP follows in the CAA’s tradition of federal-state partnership in addressing air pollution problems . EPA identified the best system of emission reduction for regulated power plants, which considers the potential to improve the efficiency of fossil fuel-fired electric steam gen-erating units, the potential to shift from existing steam generation to underutilized gas gen-eration, and the potential to shift from fossil fuel-fired generation to new renewable generation . Based on that system, EPA established interim and final CO2 emission perfor-mance rates measured in pounds of CO2 per megawatt hour for fossil fuel-fired electric steam generating units and for natural gas-fired combined-cycle generating units . However, states, tribes, and U .S . territories have the flexibility to design plans to meet those targets .
To maximize the range of choices available to states, EPA used these performance rates to also establish interim and final statewide goals in three additional forms: a single rate-based state goal that would apply to all regulated sources, a mass-based state goal measured in to-tal short tons of CO2, and a mass-based state goal with a new source complement (to accom-modate state inclusion of new power plants in the mass-based program) measured in total short tons of CO2 . The performance rates were applied to all affected sources in each state to arrive at the individual statewide rate- and mass-based goals . Each state has a different goal based upon its own particular electricity generation mix .
States develop and implement tailored plans to ensure that their power plants collectively meet these standards . The final rule provides additional flexibility in how state plans can be imple-mented . It enables states to include emission reduction opportunities not identified as part of the best system of emission reduction, such as demand-side energy efficiency, in their plans, and allows states to develop “trading ready” plans to “opt in” to an emission credit trading mar-ket with other states taking parallel approaches without the need for interstate agreements . All low-carbon electricity generation technologies can play a role in state plans, including renew-ables, energy efficiency, natural gas, nuclear, and carbon capture and storage (CCS) . As part of the CPP, states will need to submit implementation plans by September 2016 or an initial sub-mittal with a request for an extension for up to two additional years for plan development . The interim targets apply beginning in 2022 (allowing states to meet the interim goals over an eight-year averaging period), and the final goals must be met by 2030 .
Increased Efficiency of Cars and Trucks
National Programs for Light-Duty Vehicle GHG Emissions and CAFE Standards
Since 2009, the United States has been implementing policies to dramatically increase the efficiency of American vehicles to reduce carbon pollution . In 2010, EPA and the National Highway Traffic Safety Administration issued standards for light-duty passenger vehicles, including passenger cars and light trucks for model years (MYs) 2012–2016 . At the time of the final rule, the MY 2012–2016 standards were expected to result in average new vehicle tailpipe CO2 emissions of 250 grams per mile (gpm) by MY 2016, based on corporate aver-age fuel economy (CAFE) compliance testing . These actions are the equivalent of raising the average new vehicle fuel economy to over 35 .5 miles per gallon (mpg) in 2016 .
Following the first phase of vehicle efficiency standards, President Obama instructed the U .S . Department of Transportation (DOT) and EPA to issue standards for passenger vehicles for

17
MYs 2017–2025 . In 2012, these agencies finalized the rule that will raise the average new vehicle fuel efficiency of cars and light trucks to roughly 54 .5 mpg and lower the CO2 emis-sion level to a compliance-based value of 163 gpm in 2025 . At the time of the rulemaking, the combined standards were expected to cut per-mile GHG emissions of new vehicles by ap-proximately 40 percent . This would reduce U .S . oil consumption by 12 billion barrels cumula-tively by 2025 and eliminate 6 billion metric tons of carbon pollution over the lifetime of vehicles sold . Already, they are delivering results; in 2014, new vehicles achieved their highest fuel economy ever .
National Programs for Heavy-Duty Vehicle GHG Emissions and Fuel Efficiency Standards
When President Obama came into office in 2009, heavy-duty trucks and buses—from deliv-ery vans to the largest tractor-trailers—were required to meet pollution standards for soot- and smog-causing air pollutants, but were not required to meet fuel efficiency or carbon pollution standards . Fuel consumption and GHG emissions from heavy-duty vehicles (HDVs) had been growing; by 2013, these vehicles accounted for 23 percent of total U .S . transporta-tion-related GHG emissions .
In 2010, President Obama directed EPA and DOT to develop the first-ever joint GHG and fuel efficiency standards for HDVs, which were finalized in August 2011 . These standards apply to HDVs for MYs 2014–2018, including combination tractors, vans, delivery trucks, buses, and garbage trucks . Due to the diversity of vehicle type and purpose, the standard is divided into three major categories . Within each of those categories, specific targets were established based on the design and purpose of the vehicle . In total, the MY 2014–2018 standards are expected to reduce oil consumption by 530 million barrels and GHG pollution by approxi-mately 270 Mt over the lifetime of the vehicles .
EPA and DOT have proposed a second phase of HDV standards . The new, more stringent proposed standards are expected to lower carbon emissions by approximately 1 billion metric tons, cut fuel costs by about $170 billion, and reduce oil consumption by up to 1 .8 billion bar-rels over the lifetime of the vehicles sold under the program . The proposed rule would apply to MY 2021–2027 vehicles .
Developing Cutting-Edge Electric Vehicle (EV) Technology and Charging Infrastructure
In March 2012, President Obama and Energy Secretary Steven Chu launched EV Everywhere, an electric vehicle Grand Challenge that seeks to make EVs as affordable and convenient to own as today’s gasoline-powered vehicles within a decade . This initiative is spurring dramatic technological and cost improvements in batteries, electric motors, power electronics, light-weight structures, and innovative charging technology, such as wireless charging U .S . Department of Energy (DOE) investments through the Grand Challenge have achieved a 50 percent reduction in the price of EV batteries over the past four years .
Since the program’s launch, 250 employers have joined the Workplace Charging Challenge and pledged to provide charging access for their employees, significantly increasing charging access and convenience for EV owners . DOE investments in EV technology have addressed key technical and market barriers to achieving the Grand Challenge . Since January 2014, DOE has invested $167 million of funding for more than 33 industry, 26 national laboratory, and 20 university projects that explore how to make EV batteries more efficient and cost-effective . In
3 Policies Driving Substantial Progress toward Our Targets
18 2016 Second Biennial Report
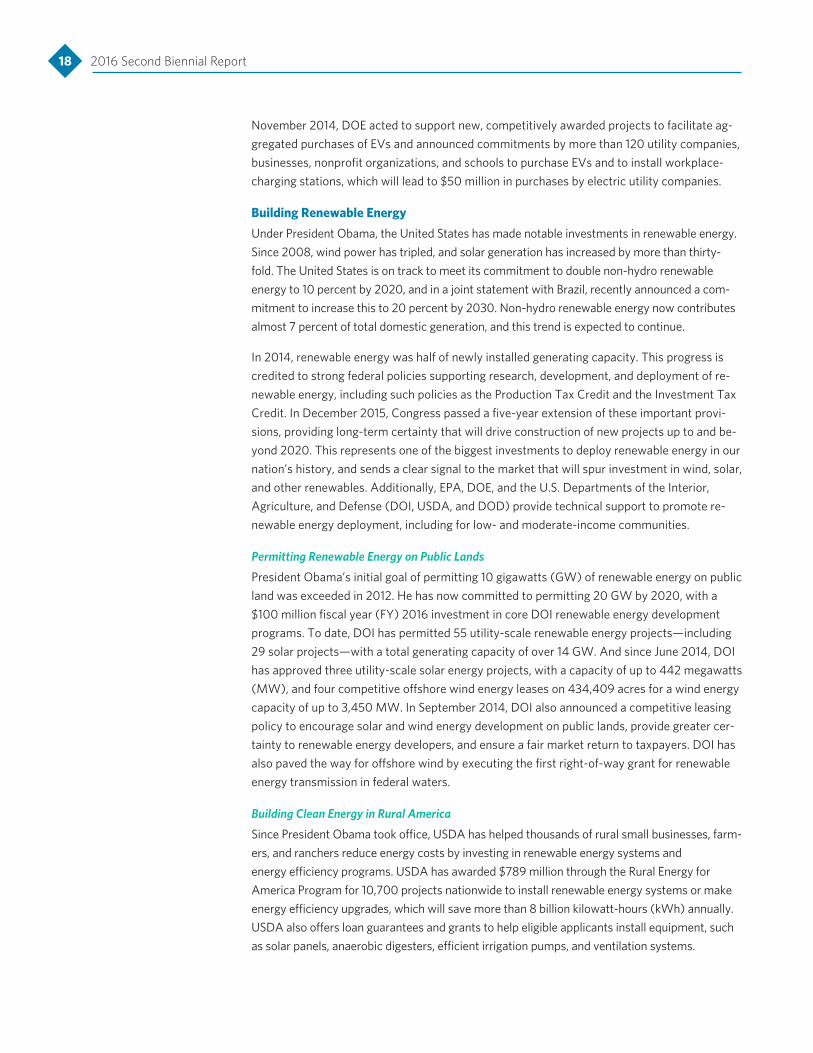
November 2014, DOE acted to support new, competitively awarded projects to facilitate ag-gregated purchases of EVs and announced commitments by more than 120 utility companies, businesses, nonprofit organizations, and schools to purchase EVs and to install workplace-charging stations, which will lead to $50 million in purchases by electric utility companies .
Building Renewable EnergyUnder President Obama, the United States has made notable investments in renewable energy . Since 2008, wind power has tripled, and solar generation has increased by more than thirty-fold . The United States is on track to meet its commitment to double non-hydro renewable energy to 10 percent by 2020, and in a joint statement with Brazil, recently announced a com-mitment to increase this to 20 percent by 2030 . Non-hydro renewable energy now contributes almost 7 percent of total domestic generation, and this trend is expected to continue .
In 2014, renewable energy was half of newly installed generating capacity . This progress is credited to strong federal policies supporting research, development, and deployment of re-newable energy, including such policies as the Production Tax Credit and the Investment Tax Credit . In December 2015, Congress passed a five-year extension of these important provi-sions, providing long-term certainty that will drive construction of new projects up to and be-yond 2020 . This represents one of the biggest investments to deploy renewable energy in our nation’s history, and sends a clear signal to the market that will spur investment in wind, solar, and other renewables . Additionally, EPA, DOE, and the U .S . Departments of the Interior, Agriculture, and Defense (DOI, USDA, and DOD) provide technical support to promote re-newable energy deployment, including for low- and moderate-income communities .
Permitting Renewable Energy on Public Lands
President Obama’s initial goal of permitting 10 gigawatts (GW) of renewable energy on public land was exceeded in 2012 . He has now committed to permitting 20 GW by 2020, with a $100 million fiscal year (FY) 2016 investment in core DOI renewable energy development programs . To date, DOI has permitted 55 utility-scale renewable energy projects—including 29 solar projects—with a total generating capacity of over 14 GW . And since June 2014, DOI has approved three utility-scale solar energy projects, with a capacity of up to 442 megawatts (MW), and four competitive offshore wind energy leases on 434,409 acres for a wind energy capacity of up to 3,450 MW . In September 2014, DOI also announced a competitive leasing policy to encourage solar and wind energy development on public lands, provide greater cer-tainty to renewable energy developers, and ensure a fair market return to taxpayers . DOI has also paved the way for offshore wind by executing the first right-of-way grant for renewable energy transmission in federal waters .
Building Clean Energy in Rural America
Since President Obama took office, USDA has helped thousands of rural small businesses, farm-ers, and ranchers reduce energy costs by investing in renewable energy systems and energy efficiency programs . USDA has awarded $789 million through the Rural Energy for America Program for 10,700 projects nationwide to install renewable energy systems or make energy efficiency upgrades, which will save more than 8 billion kilowatt-hours (kWh) annually . USDA also offers loan guarantees and grants to help eligible applicants install equipment, such as solar panels, anaerobic digesters, efficient irrigation pumps, and ventilation systems .

19
In October 2014, USDA committed up to $250 million to finance the Energy Efficiency and Conservation Loan Program, the first program of its kind to enable rural cooperatives to invest in energy efficiency improvements and renewable energy systems . In total, USDA has fi-nanced more than $1 .7 billion to help rural electricity providers reduce carbon pollution, as well as reduce costs and improve the quality of life for end users . Since 2007, the number of farms using a renewable energy-producing system has more than doubled .
Department of Energy Loan Guarantees and Grants
In July 2014, DOE issued a solicitation for up to $4 billion in loan guarantees available for in-novative renewable energy and energy efficiency projects that avoid, reduce, or sequester GHGs . Eligible projects include advanced grid integration and storage, drop-in biofuels, waste-to-energy, enhancement of existing facilities, micro-hydro or hydro updates to existing nonpowered dams, and efficiency improvements .
In August 2015, DOE invited innovative distributed energy projects to apply for more than $12 billion in loan guarantee authority, as well as provided up to $1 billion in additional loan guar-antee authority through its current solicitations for new Renewable Energy and Energy Efficiency Projects and Fossil Energy Projects . This significantly boosts the resources available to new applicants, which can accelerate the transformation of U .S . energy markets by spur-ring innovation in distributed energy projects .
Over the past two years, DOE has awarded $78 million to U .S . states to help them advance their clean energy economy while contributing to national energy goals . Additionally, DOE has sup-ported advanced fossil energy, investing $167 million and breaking ground last year on its Petra Nova project, a post-combustion carbon capture, use, and storage retrofit of an existing coal-fired generating facility . In April 2015, in a landmark accomplishment, DOE announced that a group of its CCS projects had safely captured 10 Mt CO2—the equivalent of removing more than 2 million passenger vehicles from the nation’s roads for one year .
Additionally, in February 2014, DOE announced a guarantee of $6 .5 billion in loans to Georgia Power Company and Oglethorpe Power Corporation for construction of the Vogtle project, the first new nuclear reactors to be licensed and begin construction in the United States in three decades . In December 2014, DOE issued a solicitation for up to $12 .5 billion in loan guarantees available for advanced nuclear energy projects that avoid, reduce, or sequester GHGs . Eligible projects include advanced nuclear reactors, small modular reactors, uprates or upgrades at existing facilities, and front-end nuclear . In June 2015, DOE issued a guarantee of $1 .8 billion in loans to three subsidiaries of the Municipal Electric Authority of Georgia for their portion of the Vogtle project .
Cutting-Energy Waste in Buildings and Homes
Conservation Standards for Appliances and Equipment
Since 2009, the United States has finalized 34 new or updated standards to make appliances, homes, and equipment more efficient . In 2013 alone, consumers avoided more than 155 mil-lion tons of carbon emissions by using more than 70 categories of EPA’s ENERGY STAR prod-ucts . Actions taken by the Administration ensure that dishwashers, refrigerators, and many other products operate more cleanly and efficiently .
3 Policies Driving Substantial Progress toward Our Targets
20 2016 Second Biennial Report
We are implementing these new standards at a rapid pace: as of September 2015, the Administration has proposed 11 and finalized 5 additional energy conservation standards . In total, standards completed during this Administration to date will avoid more than 2 .2 billion metric tons of carbon emissions and save consumers more than $520 billion on their utility bills through 2030 . This puts the United States on track to meet its goal set in the Climate Action Plan of cutting 3 billion metric tons of carbon pollution from efficiency standards for appliances and federal buildings by 2030 (EOP 2013) .
Making Buildings and Homes More Efficient
The President’s Better Buildings Challenge continues to drive progress by helping American commercial, industrial, and multifamily buildings become at least 20 percent more energy efficient by 2020 . In total, more than 250 organizations have committed to the Better Buildings Challenge, including more than 60 new cities, school districts, universities, manu-facturers, and businesses in 2014 . This has incentivized businesses to reduce energy intensity in more than 3 .5 billion square feet of building space since 2009 . The Better Buildings part-ners are making tremendous progress and saving on average 2 percent a year, with total sav-ings to date of 94 trillion Btus .
Additionally, improved building codes have already saved U .S . homes and businesses $44 billion on their energy bills . DOE is committed to continuing its strong support and participa-tion in the American National Standards Institute, American Society of Heating, Refrigerating and Air-Conditioning Engineers (ASHRAE), Illuminating Engineering Society of North America, and International Energy Conservation Code (IECC) model code development for residential and commercial buildings to help states and the federal government continue to save money and energy on building operations .
The U .S . Department of Housing and Urban Development (HUD) is also improving the energy efficiency of assisted and insured housing stock through a variety of programs, including Energy Performance Contracts in Public Housing, Property Assessed Clean Energy, and Federal Housing Administration financing programs, such as PowerSaver and Energy Efficient Mortgages . Finally, EPA’s ENERGY STAR program is making buildings and homes more efficient across the country . In 2013 alone, commercial, industrial, and residential buildings and homes that received the ENERGY STAR label avoided nearly 140 million tons of carbon emissions .
Alternative Fuels for Vehicles
Renewable Fuel Standard
The Renewable Fuel Standard (RFS) program mandates the deployment and use of 36 billion gallons of renewable fuel annually by 2022 . The program includes volume requirements for biomass-based diesel and other advanced biofuels, such as 16 billion gallons of cellulosic biofuel . The requirements also include new definitions and criteria for both renewable fuels and the feedstocks used to produce them, with new life-cycle GHG emission thresholds for renewable fuels .
On November 30, 2015, EPA finalized the volume requirements and associated percentage standards under the RFS program for the years 2014 to 2016, and final volume requirements for biomass-based diesel for 2014 to 2017 . The final 2016 standard for cellulosic biofuel—the fuel with the lowest carbon emissions—is nearly 200 million gallons, or seven times more than the market produced in 2014 . The final 2016 standard for advanced biofuel is nearly
21
1 billion gallons, or 35 percent higher than the actual 2014 volumes, while the total renewable standard requires growth of more than 1 .8 billion gallons of biofuel by 2016 . Biodiesel standards will grow steadily over the next several years, in order to reach 2 billion gallons by 2017 . Overall, the RFS program is anticipated to achieve significant reductions in both petroleum use and GHG emissions, providing for achievable growth in the biofuels industry .
Supporting Innovative Biofuel Technology
Biofuels are a key component of President Obama’s energy strategy and play an important role in reducing America’s dependence on oil . The Administration has supported research and engaged in public–private partnerships to pursue innovations in biofuel technologies, increase production of U .S . biofuels, and strengthen American energy security .
Through Regional Feedstock Partnerships, DOE’s Bioenergy Technologies Office has worked to identify and analyze feedstock supply and conduct crop field trials to address barriers associated with the development of a sustainable and predictable supply of biomass feedstocks . DOE contin-ues to invest in cutting-edge technologies to produce advanced biofuels from nonfood biomass feedstocks . As of 2014, DOE has awarded funds to 22 biorefinery projects working to prove the viability of various feedstock and conversion pathways and reduce the associated technical and financial risks . DOE has issued two loan guarantees available to support innovative cellulosic eth-anol biorefineries . In addition, several USDA programs support the deployment of new and emerging technologies for refining advanced biofuels and utilizing renewable biomass as an en-ergy feedstock, including the Advanced Biofuel Payment Program, the Biorefinery Assistance Program, and the Repowering Assistance Program .
Clean Energy Research and Development While the United States is taking action to encourage the adoption of cleaner forms of energy today, we are also making major investments in research and development (R&D) to support the clean energy and climate change mitigation technologies of tomorrow . To accelerate the transi-tion to a clean energy economy, the Obama Administration and Congress continue to enhance cutting-edge R&D of clean energy sources, such as solar, wind, and low-carbon fossil fuels, as well as energy-efficient technologies, products, and process improvements .
The President’s FY 2016 Budget requested $7 .4 billion for clean energy technology research, development, demonstration, and deployment activities . This includes $325 million to continue the innovative work of the Advanced Research Projects Agency–Energy (ARPA-E), which, as of January 2015, has funded more than 400 high-potential, high-impact energy projects through 25 focused programs and open-funding solicitations . In August 2015, ARPA- E announced 11 projects in 7 states to develop innovative solar technologies to achieve a 50 percent increase in the amount of energy each solar panel can produce from the sun, while reducing the costs and space required to generate solar energy .
In addition to consistent and high federal R&D support, in February 2015, the Administration launched its Clean Energy Investment Initiative, aimed at promoting private-sector investment in clean energy technology innovation . Already, the initiative has leveraged more than $4 billion in commitments from foundations, institutional investors, and philanthropies to fund solutions to help fight climate change . These efforts will help increase the affordability and convenience of advanced vehicles and domestic renewable fuels, advance energy efficiency and building tech-nologies, and integrate energy systems more easily into the electric grid .
3 Policies Driving Substantial Progress toward Our Targets

22 2016 Second Biennial Report
U .S . investments are providing real payoffs . For example, the President’s SunShot initiative has the goal of making solar power fully cost-competitive with traditional energy sources, without incentives, by 2020 . Already, the program is nearly 70 percent of the way to achiev-ing its affordability goal . On batteries, we have reduced the modeled, high-volume cost of EV battery production from $1,000 per kWh in 2009 to $264 per kWh in 2015, with a goal of $125 per kWh by 2022 . On biofuels, we have reduced the modeled mature cost of cellulosic ethanol from more than $13 per gallon to about $2 per gallon .
DOE is also developing technologies that reduce the costs of carbon capture from fossil fuels and undertaking research to ensure the safe, permanent storage of CO2 in underground geo-logic formations . DOE has also funded R&D to measure and mitigate methane emissions from hydraulic fracturing, and is supporting R&D in advanced nuclear reactor technologies, life ex-tension for existing power plants, and innovative fuel-cycle concepts .
At the UN climate negotiations in Paris, President Obama and other world leaders launched Mission Innovation, a landmark commitment to dramatically accelerate public and private global clean energy innovation . By joining this initiative, 20 countries (including the five most populous nations—China, India, the United States, Indonesia, and Brazil) representing 80 per-cent of global clean energy R&D agreed to double their respective R&D investment over five years . The Breakthrough Energy Coalition, a global group of private investors spearheaded by Bill Gates, was also announced in conjunction with the Mission Innovation launch . To rein-vigorate global efforts promoting clean energy innovation, all participants of both efforts share a common goal to develop breakthrough technologies and substantial cost reductions, which will enable the global community to meet our shared climate goals, increase access to clean and affordable energy, support economic development, and strengthen energy security .
Phasing Down Hydrofluorocarbons
Significant New Alternatives Policy Program
The United States remains firmly committed to phasing down HFCs through domestic and international actions . Domestically, the Obama Administration finalized a rule in July 2015 to prohibit some of the most harmful HFCs in various end uses under EPA’s Significant New Alternatives Policy (SNAP) program . Additionally, in February 2015, EPA finalized a rule to expand the list of acceptable alternatives .
The Administration has also announced its intention to initiate a new rulemaking during the first half of 2016 that would prohibit certain uses of HFCs and further expand the list of acceptable alternatives . Over the last two years, the Administration has recognized private-sector leaders who are taking action to reduce HFCs . Taken together, private-sector commit-ments and federal regulatory action will cut HFC emissions and avoid more than 1 billion metric tons of CO2e through 2025 .
Refrigerant Management Requirements
In October 2015, EPA proposed a rule that would improve the way refrigerants are sold, handled, recovered, and recycled . The proposal would strengthen the existing requirements for handling refrigerants and apply those rules to ozone-depleting and HFC refrigerants alike . EPA estimates that this rule would prevent annual emissions of GHGs equivalent to 7 .5 Mt CO2e .
23
Montreal Protocol Amendment
HFCs are widely used alternatives to hydrochlorofluorocarbons (HCFCs), chlorofluorocarbons (CFCs), and other ozone-depleting substances that are being phased out globally under the Montreal Protocol on Substances that Deplete the Ozone Layer . In April 2015, the United States, Mexico, and Canada, for the fifth year in a row, jointly submitted an amendment proposal to the Montreal Protocol to phase down the production and consumption of HFCs and limit by-product emissions of HFCs . In response to the concerns expressed by some countries about the availability of alternatives to HFCs, the proposal recommended including a technology review provision that would call for parties to the Montreal Protocol to review progress at a specified future date in the deployment of climate-friendly alternatives as the basis to con-sider adjustments to the phasedown schedules . If adopted, the amendment would reduce HFCs through 2050 by more than 90 gigatons of CO2e globally, which is about two years of current global anthropogenic emissions of all GHGs . Cumulative benefits from HFC-23 by-product emission controls, as estimated by the U .S . government, amount to 12,000 Mt CO2e through 2050 . In November 2015, in large part because of the leadership of the United States, Mexico, and Canada, countries across the world took the historic step to work together on a 2016 amendment to the Montreal Protocol to reduce the production and consumption of HFCs . The United States remains fully committed to this process, and we will continue to work with our North American partners and other Montreal Protocol parties to finalize an HFC amendment in 2016 .
Reducing Methane Emissions In March 2014, the White House released a Strategy to Reduce Methane Emissions . Methane accounts for 10 percent of domestic GHG emissions (EOP 2014a) . The strategy identifies opportunities to cut emissions from landfills, coal mines, agricultural practices, and the oil and gas sector .
Cutting Emissions from the Oil and Gas Sector
In January 2015, the White House announced a goal of reducing methane emissions from the oil and gas sector by 40–45 percent below 2012 levels by 2025 . To help meet that goal, in the summer of 2015, the Administration released proposed standards for methane and volatile organic compound (VOC) emissions from new or modified hydraulically fractured oil wells, as well as components located downstream from the production . These proposed standards complement the 2012 new source performance standards and cover equipment in the natural gas transmission segment of the industry that was not regulated in the 2012 rule .
The proposed rule requires “reduced emissions completion” or “green completion” that cap-tures methane when drilling wells, and limits emissions from new or modified pneumatic pumps, compressor stations, and pneumatic controllers . It also proposes requiring owners and operators to find and repair leaks, which can be a significant source of methane and VOC pollution . The rule is expected to prevent emissions equal to 7 .7–9 .0 million Mt CO2e by 2025, while also improving air quality . The benefits of these actions will total $120–$150 million in 2025 .
Reducing Landfill Methane
In August 2015, EPA issued two proposals to further reduce emissions of methane-rich gas from municipal solid waste (MSW) landfills . MSW landfills are the third-largest source of U .S .
3 Policies Driving Substantial Progress toward Our Targets
24 2016 Second Biennial Report
human-related methane emissions, accounting for 18 percent of methane emissions in 2013—or approximately 100 Mt CO2e . Under the proposals, new, modified, and existing landfills would begin collecting and controlling landfill gas at emission levels nearly a third lower than current requirements . Combined, the proposed rules are expected to reduce methane emis-sions by an estimated 436,000 tons a year beginning in 2025—equivalent to reducing 10 .9 Mt CO2e . EPA estimates the climate benefits of the combined proposals at nearly $670 mil-lion in 2025, or nearly $14 for every dollar spent to comply with the proposed standards
Agriculture and Forest Emissions
USDA Building Blocks for Climate Smart Agriculture and Forestry
Recognizing the role that forests and agricultural activities play in domestic GHG emissions, in April 2015 USDA announced a comprehensive and detailed approach to reduce GHG emis-sions from agricultural production, increase carbon storage in our forests and soils, and gen-erate clean renewable energy . The strategy includes ten building blocks that promote the adoption of GHG mitigating technologies and practices in the context of working production systems . The building blocks focus on a specific set of USDA’s agricultural, forestry, and energy-related programs to encourage GHG reductions, while also providing multiple eco-nomic and environmental co-benefits . These actions, such as cutting energy waste and pro-moting renewable energy in rural communities, are expected to reduce emissions by more than 120 Mt CO2e per year by 2025 . These measures include those in the following subsections .
Soil HealthUSDA programs are improving soil resilience and increasing productivity by promoting con-servation tillage and no-till systems, planting cover crops and perennial forages, managing applications of organic inputs, and alleviating compaction . These efforts will increase soil car-bon sequestration and prevent the release of CO2 into the atmosphere .
Nitrogen StewardshipAgricultural activities represent one of the largest sources of nitrous oxide emissions . N2O, which has a high GWP, is emitted from the soil following application of nitrogen fertilizers . Overapplication of nitrogen causes excessive emissions and leads to nutrient runoff, which degrades water quality . USDA is working with farmers to help optimize nitrogen application by focusing on the right timing, type, placement, and quantity of nutrients, thereby reducing N2O emissions while maintaining agricultural yield and increasing profits .
Livestock PartnershipsLivestock naturally produce methane as a part of the normal digestive process . Additionally, methane is emitted from livestock manure stored in lagoons or holding tanks . There is large potential to capture much of the methane from manure and use it for beneficial use . USDA aims to reduce methane emissions by expanding the use of anaerobic digesters, lagoon cov-ers, composting, and solids separators .
Conservation of Sensitive LandsUSDA’s Conservation Reserve Program (CRP) and Natural Resources Conservation Service programs aim to reduce GHG emissions on high-carbon, sensitive lands . These efforts include creating riparian buffers, planting trees, and conserving wetlands and organic soils . These ac-tions will improve carbon sequestration in soils, enhance soil quality, and reduce erosion and
25
runoff . By 2025, USDA aims to enroll 400,000 acres of CRP lands with high GHG benefits, protect 40,000 acres through easements, and gain additional benefits by transferring expir-ing CRP acres to permanent easements .
Grazing and Pasture Lands Grasslands can act as carbon sinks by removing carbon from the atmosphere and storing it in soils . However, soil degradation caused by excessive grazing can release much of this carbon into the atmosphere . USDA’s support of rotational grazing management will help to avoid soil carbon loss through improved management of forage, soils, and grazing livestock . By 2025, USDA plans to support improved grazing management on an additional 9 million acres, for a total of 27 million acres .
Private Forest Growth and RetentionAmerica’s forests play an important role in buffering the impacts of carbon pollution by off-setting roughly 13 percent of total GHG emissions every year . For this reason, promoting for-est preservation, avoiding deforestation, and planting more forests have high climate benefits . USDA is working to promote private forest growth and retention through such programs as the Forest Legacy Program and the Community Forest and Open Space Conservation Program, which protect almost 1 million additional acres of working landscapes .
Stewardship of Federal ForestsThe U .S . Forest Service (USFS) oversees 192 million acres of federal forestland . USDA is com-mitted to maintaining federal forest health . One of the agency’s largest areas of focus is refor-esting areas damaged by wildfire, insects, or disease, and increasing forests’ resilience to those disturbances . Under its stewardship strategy, USDA plans to reforest 5,000 additional post-disturbance acres by 2025 .
Promotion of Wood ProductsWood stores carbon, even after the tree has been harvested . USDA is striving to increase the use of wood as a building material to promote additional carbon storage in buildings and to offset the use of energy from fossil fuels associated with energy-intensive iron, steel, and ce-ment manufacturing . USDA plans to expand the number of wood building projects supported through cooperative agreements with partners and technical assistance, in addition to re-search and market promotion for innovative wood building products .
Urban ForestsCarbon sequestration is just one benefit of forests; they also have the ability to improve water quality and regulate temperature . By encouraging tree planting in urban areas, USDA is help-ing to reduce energy costs, stormwater runoff, and urban heat island effects, while increasing carbon sequestration and property values . Working with partners, USDA plans to plant an average of 10,000 additional trees in urban areas every year through 2025 .
Energy Generation and EfficiencyThrough its Energy Efficiency and Conservation Loan Program, USDA is working with utilities to improve the efficiency of equipment and appliances . Alternative energy generation also promotes emission reductions by decreasing the use of fossil fuels . Through the Rural Energy for America Program and other programs, USDA supports the development of additional re-newable energy, bioenergy, and biofuel opportunities, as well as investments in farm energy efficiency and farm energy audits .
3 Policies Driving Substantial Progress toward Our Targets
26 2016 Second Biennial Report
Enhancing the Resilience of America’s Natural Resources
In October 2014, the Administration announced a Priority Agenda for Enhancing the Climate Resilience of America’s Natural Resources, a first-of-its-kind comprehensive commitment to support the resilience of our natural resources and enhance carbon storage in the U .S . land sector (EOP 2014c) . While working with agencies, including USDA, EPA, DOI, and the National Oceanic and Atmospheric Administration (NOAA), the Obama Administration has been implementing actions focused on protecting important landscapes, fostering climate-resilient lands and waters; maintaining and enhancing U .S . carbon sinks in forests, grasslands, wetlands, and coastal areas; promoting innovative 21st-century infrastructure that integrates natural systems into community development; and modernizing federal programs and ser-vices to build resilience and enhance carbon storage in the land sector . The Administration also announced a collection of commitments from the private and public sectors that support resilient natural resources and the communities that depend on them .
Promoting Biogas Recovery
Run jointly by USDA and EPA, AgSTAR encourages the use of methane (biogas) recovery technologies at confined animal feeding operations that manage manure as liquids or slurries . Using technologies, such as anaerobic digesters, the program has captured and burned biogas that otherwise would escape into the atmosphere and has avoided GHG emissions (CO2, CH4, and N2O) and other pollutants by using the captured biogas for energy generation . In 2013, AgSTAR’s activities contributed to direct methane emission reductions from approxi-mately 239 livestock farms . Cumulatively, anaerobic digesters on livestock farms have re-duced emissions by 5 .6 Mt CO2e since 2000 .
Federal Government Leading by Example
Federal Sustainability Targets
The federal government is the single-largest consumer of energy in the United States . In March 2015, President Obama signed Executive Order 13693, “Planning for Federal Sustainability in the Next Decade” (EOP 2015) . The order aims to reduce GHG emissions in the federal govern-ment by 40 percent over the next decade, and to increase the share of electricity the federal government consumes from renewable and alternative sources to 30 percent . These targets will save U .S . taxpayers up to $18 billion in avoided energy costs . The Administration also released a new scorecard to publicly track disclosure of emissions and targets by major federal suppliers, and announced commitments from these suppliers to reduce GHG emis-sions . The combined results of these actions are projected to cut GHG emissions by 26 Mt by 2025—the equivalent of taking nearly 5 .5 million cars off the road for a year .
Federal Renewable Energy Targets
Federal agencies are working toward achieving the federal renewable energy targets . DOD is making significant progress on the Administration’s goal of deploying 3,000 MW of renew-able energy on military installations by 2025 . DOD has completed a 16-MW solar array and has developed another 19 renewable energy installations that will provide more than 460 MW of power .
In 2015, HUD announced that 45 affordable housing and service providers across the nation have committed to installing more than 180 MW of on-site renewable energy—putting HUD on track to surpass the initial goal to install 100 MW of renewable capacity across federally

27
subsidized housing by 2020 . In July 2015, the Administration set a new goal to reach 300 MW, as well as expanded the goal to include community and shared solar installations . HUD also announced that it will offer direct technical assistance to overcome barriers to installa-tion for affordable housing organizations making a commitment toward the Administration’s new 300-MW goal .
Other Federally Driven Measures In addition to the major actions listed above, the Administration has been committed to com-bating climate change and cutting GHG emissions through a range of other programs and activities . Two examples of the Administration’s domestic climate change mitigation strate-gies are the Coalbed Methane Outreach Program, which focuses on the reduction of coalbed methane, and the Advanced Outdoor Lighting Challenge, which seeks to upgrade public light-ing and housing efficiency .
In addition, the Administration has been active in addressing aircraft CO2 emissions through the International Civil Aviation Organization’s process that will ultimately lead to EPA domestic rulemaking; collaboration with the aviation industry through the Federal Aviation Administra-tion’s Clean Low Energy, Emissions and Noise technologies program; and the modernization of the national airspace (Next Gen) . Furthermore, the Administration has actively worked to pro-mote expanding and modernizing the electric grid and is transitioning to low-emission transpor-tation fuels in shipping and public transit systems . Appendix 3 presents a full list of policies and measures .
REGIONAL, STATE, AND LOCAL ACTIONS ON MITIGATION
In the United States, local, tribal, state, and federal governments share responsibility for the nation’s economic development, energy sector, natural resources, and many other areas that affect climate change . In addition to the major policies listed above, the federal government supports state and local government actions to reduce GHG emissions by sponsoring policy dialogues, issuing technical documents, facilitating consistent measurement approaches and model policies, and providing direct technical assistance . Separately, numerous state and lo-cal policies and measures complement federal efforts to reduce GHG emissions . State and local policies include those that target emission reductions from the electricity and transpor-tation sectors, as well as complementary policies that indirectly reduce emissions .
Regional Emissions Trading
Regional Greenhouse Gas Initiative
The Regional Greenhouse Gas Initiative is a cooperative effort among nine states to reduce emissions in the power sector . In February 2012, the states agreed to make significant revi-sions to the program, capping CO2 emissions at 91 million short tons per year in 2014—a 45 percent reduction from the previous cap of 165 million short tons . The cap will decrease by 2 .5 percent each year from 2015 through 2020, when it reaches 78 million short tons of CO2—a level approximately 50 percent below 2005 levels .
California Global Warming Solutions Act
California’s Global Warming Solutions Act (AB 32) requires the state to reduce GHG emis-sions to 1990 levels by 2020 . As part of a portfolio of measures to achieve this statewide cut-back, the California Air Resources Board adopted cap-and-trade regulations, which set a
3 Policies Driving Substantial Progress toward Our Targets
28 2016 Second Biennial Report
declining cap on sources responsible for approximately 85 percent of statewide GHG emis-sions, including refineries, power plants, industrial facilities, and transportation fuels . Other measures include mandatory GHG emission reporting programs for large emitters, a renew-able portfolio standard (RPS), and various energy efficiency measures and incentives . The state GHG inventory shows that emissions fell by 1 .5 Mt in 2013, which keeps California on track to meet its 2020 target .
In April 2015, the California governor issued an executive action to establish a GHG reduction target of 40 percent below 1990 levels by 2030 . This target aligns with those of international governments leading up to the December 2015 UNFCCC meeting in Paris . This interim goal will put California on a trajectory to meet its ultimate goal of 80 percent GHG reduction by 2050 . In addition, in October 2015, California passed a law requiring that the state generate half of its energy from renewable sources by 2030, up from a current target of 33 percent by 2020 .
Power Sector Programs and Standards
State Renewable Portfolio Standards
Thirty-seven states have implemented an RPS or renewable energy goals . The designs of these programs vary (e .g ., applicability, targets and timetables, geographic and resource eligi-bility, alternative compliance payments) . States with an RPS have demonstrated higher levels of capacity for developing renewable energy . Financial mechanisms and incentives for renew-able energy of some form exist in most states, with more than 200 tax incentives across the nation .
In addition, nearly 100 performance-based incentives are offered from state and local governments, as well as utilities and nonprofit organizations . Currently, 18 states have performance-based policies, and in several other states, utilities have adopted programs with performance-based incentives, including feed-in tariffs, standard offer payments, and payments in exchange for renewable energy certificates .
Demand-Side Energy Efficiency
States have employed a variety of strategies to increase investment in demand-side energy efficiency technologies and practices . As of 2014, all 50 states have demand-side energy ef-ficiency incentive programs, and annual expenditures for demand-side management pro-grams reached an estimated $8 billion in 2013 . The most prevalent strategies are financial mechanisms and incentives for energy efficiency in the form of rebates and loan programs .
In addition, 23 states have mandatory energy efficiency resource standards, 2 states have voluntary targets, and 2 more states allow energy efficiency to be used to meet part of a man-datory RPS . Most states are meeting or are on track to meet their incremental savings goals, which typically range from an annual reduction in electricity of about 0 .25–2 .5 percent . Nine states and the District of Columbia have enacted appliance efficiency standards that go be-yond federal standards . Additionally, building energy codes are found in most states, with 32 having adopted IECC 2009 or 2012 residential standards, and 38 states mandating ASHRAE 90 .1-2007 or 2010 commercial codes .
Other State and Local InitiativesAcross the country, state and local governments (i .e ., cities, counties, tribes, and regions) are implementing measures in their climate change action plans to reduce GHG emissions and
29
prepare for climate change impacts . Small and large cities alike—from Homer, Alaska, and the Swinomish Indian Tribal Community to Philadelphia and Los Angeles—have been at the fore-front of climate change action, with current and proposed measures already preventing mil-lions of tons of GHG emissions . New York City and Portland plan to procure 100 percent of their electricity from renewable sources, and many other cities have installed solar and wind generation on public lands and buildings . Los Angeles, Phoenix, and San Francisco are replac-ing petroleum and diesel vehicles in the city fleets with alternative-fuel and electric vehicles . The City of Oakland has retrofitted 100 percent of its trucks, installed shore power at 11 port berths, and implemented Zero Waste franchise agreements, while the cities of Atlanta, Boston, Miami, and New York have committed millions of square feet of building space to energy efficiency and Green Building standards .
In September 2015, a diverse set of U .S . cities and states signed the U .S .–China Climate Leaders Declaration to support the achievement and implementation of each country’s in-tended nationally determined contributions and enhanced actions . In signing the declaration, U .S . cities and states, like their Chinese counterparts, stated their intention to establish ambi-tious targets to reduce and regularly report on GHG emissions, develop climate action plans to reduce emissions, and enhance bilateral partnerships and bilateral cooperation . U .S . cities, counties, and states have put forward ambitious, long-term emission reduction targets, in-cluding a commitment from the State of California to reduce emissions by 80–90 percent below 1990 levels by 2050, and a commitment from the City of Seattle to become carbon-neutral by 2050—producing no net GHG emissions . The City of Lancaster, New York, com-mitted to become one of the world’s first net-zero cities, meaning it will procure and produce more energy via renewable sources than the total amount of energy the city consumes .
Additionally, 123 domestic and international states, provinces, and municipalities have signed the Subnational Global Climate Leadership Memorandum of Understanding, better known as the Under 2 MOU, which brings together states and regions willing to limit the increase in global temperature to below 2 degrees Celsius . At the UN climate negotiations in Paris, 43 new regions signed onto the agreement . In total, the states and local governments that have signed the Under 2 MOU account for 720 million people and $19 .9 trillion in combined GDP .
Through the U .S . Conference of Mayors, 1,060 mayors have joined the Climate Protection Agreement, committing to reduce GHG emissions in their cities to meet or beat the U .S . emission reduction goals . These mayors have committed to take action on climate change mitigation, resilience, and advocacy in their own communities by using best practice guide-lines . They are actively urging state and federal governments to strengthen policies and pro-grams to reduce emissions and prepare for a changing climate .
Other groups are also taking measures to reduce emissions, including American businesses and American colleges and universities . In July 2015, the White House announced the American Business Act on Climate Pledge . By signing this pledge, U .S . companies demon-strate their support for action on climate change both domestically and internationally . As of December 2015, a total of 154 companies, representing more than $4 .2 trillion in annual rev-enue with a combined market capitalization of more than $7 trillion, have signed the pledge . Separately, more than 200 universities and colleges located in 40 states announced actions to reduce GHG emissions and increase campus sustainability and resilience—including more than 100 schools that have pledged to become carbon neutral in the next few decades .
3 Policies Driving Substantial Progress toward Our Targets

This chapter provides updated projections of U .S . GHG emissions through 2030, including the impacts of policies and measures in effect as of the summer of 2015, along with information on the potential range of further reductions from additional
measures . The methodologies used to generate these projections, described in Appendix 2: Methodologies for Current Measures and Additional Measures consistent with the Climate Action Plan, are similar to those used in the 2014 Climate Action Report, with updates noted where applicable (U .S . DOS 2014b) . Table 2 summarizes the key variables and assumptions used throughout this projection analysis .
This chapter will show in detail how we are laying the foundation to hit our 2020 and 2025 targets . Already, policies finalized under the Obama Administration are driving down emis-sions, and this trend is projected to continue through 2025 . Factoring in all of our planned additional measures, including measures that have been proposed, but not yet finalized, we are on track to be in the range of 17 percent below 2005 levels by 2020 . These additional measures also have the potential to drive our emissions down to 22–27 percent below 2005 levels by 2025 . The numbers for 2025 could go higher based on new action by Congress or on positive changes in the broader economy .
PROJECTIONS FOR CURRENT AND ADDITIONAL MEASURES
In this report, as for the First U.S. Biennial Report in 2014, we present two emission projections . These are designed to demonstrate (1) the likely impact of policies implemented to date, and (2) the likely impact of both existing policies and planned policies that can be implemented before the target dates . Both projections of U .S . GHG emissions described here reflect na-tional estimates that consider population growth, long-term economic growth, historic rates of technology improvement, and normal weather patterns . They are based on anticipated trends in technology deployment and adoption, demand-side efficiency gains, fuel switching, and the implemented policies and measures discussed in the previous chapter and identified in Appendix 3 .
One projection, which we call the Current Measures scenario,2 reflects the impacts of only ex-isting policies and measures (Tables 3 and 4) . It includes a large number of policies that have recently been implemented or finalized through mid-2015 under the Climate Action Plan, but does not include additional reductions from any further measures formulated in coming years and implemented over the remainder of the decade to 2025 (EOP 2013) . Notably, the Current Measures scenario includes the effects of the Clean Power Plan for the electricity sector, which was finalized in August 2015, as well as light-duty vehicle fuel efficiency standards, many re-cent appliance and equipment efficiency standards, and other important policies detailed in the previous chapter . Because the Current Measures scenario already includes the effects of numerous policy actions, it is important to note that it should not be interpreted as a
Projections: Delivering on Our 2020 and 2025 Targets
2 The Current Measures projection is the “with measures” scenario required by the United Nations Framework Convention on Climate Change Reporting Guidelines on National Communications (UNFCCC 1999) .

31
“Business As Usual” (BAU) or “No Policy” case . A genuine BAU or No Policy case would not include any of these policy actions, and would therefore produce a much higher emissions outcome . Also, because the Current Measures scenario includes policies only to mid-2015, it does not include the impacts of planned, additional measures, such as those that have been proposed, but not yet finalized, and thus produces a lower estimate of reductions compared with a projection that includes the impacts of all planned policies .
The second projection, which we call the Additional Measures scenario,3 is based on an assess-ment of further reductions that could be achieved through implementation of additional mea-sures consistent with the President’s 2013 Climate Action Plan (EOP 2013) . This projection reflects reductions from planned policies and measures that have been proposed, but not fi-nalized, and other measures that would fall under the initiatives laid out in the Climate Action Plan . Additional Measures reductions were estimated for CO2, HFCs, and CH4, and N2O .
PROJECTIONS METHODOLOGY
Integrated Projections ApproachDOE, in consultation with an interagency team, provided the baseline projections of energy-related CO2 emissions . The baseline projections are based on the U .S . Energy Information Administration’s Annual Energy Outlook 2015 (U .S . DOE/EIA 2015a), with modifications to reflect actions finalized after it was released .4 Projected CO2 emissions were adjusted to match international inventory convention .5 EPA prepared the projections of non-energy- related CO2 emissions and non-CO2 emissions from the energy, transportation, industrial processes, and waste sectors . The methodologies used to project non-CO2 emissions are explained in the background document Methodologies for U.S. Greenhouse Gas Emissions Projections: Non-CO2 and Non-Energy CO2 Sources (U .S . EPA 2013) . USDA prepared estimates of CO2 sequestration and GHG emissions associated with agriculture, and USDA and EPA both provided estimates of carbon sequestration from forests . These estimates reflect more detailed modeling than has been used in past U .S . Climate Action Reports, which is described in the following section . Historical emissions data are drawn from EPA’s Inventory of U.S. Greenhouse Gas Emissions and Sinks: 1990–2013 (U .S . EPA/OAP 2015) . In general, the projec-tions reflect long-run trends and do not attempt to mirror short-run departures from those trends . All GHGs in this document are reported in Mt CO2e using the 100-year GWPs listed in the IPCC’s Fourth Assessment Report (IPCC 2007) to convert non-CO2 gases to CO2e .
Updates to Land Use, Land-Use Change, and Forestry MethodologyOver the past two years, the U .S . government has made significant strides in improving data and modeling of emission trends in the LULUCF sector . A multiagency effort was initiated
following the First U.S. Biennial Report in 2014 (U .S . DOS 2014a) . This effort resulted in a num-ber of immediate improvements that will be included in the 2016 U .S . GHG inventory, as well as additional improvements that are being developed and will be included in subsequent Inventories . These improvements have been made through a joint effort among EPA, USDA, and NOAA . Immediate improvements or additions to the inventory include:
• Adopting a new Forest Carbon Accounting Framework to improve attribution of land-use change and disturbance across the inventory time series (1990–2014), estimate forest soil organic carbon based on nationwide in situ data, and implement corrections for missing historic data (Woodall et al . 2015) .
• Accounting for carbon stock changes in soils on federal grasslands .
3 The Additional Measures projection is the “with additional measures” scenario from the United Nations Framework Convention on Climate Change Reporting Guidelines on National Communications (UNFCCC 1999) . 4 The 2016 Current Measures scenario includes estimated impacts of the recently finalized Clean Power Plan . 5 AEO2015 estimates for CO2 from fossil fuel combustion were adjusted for the purpose of these projections to remove emissions from bunker fuels and non-energy use of fossil fuels, and to add estimated CO2 emissions in the U .S . territories (since these emissions are not included in AEO2015), consistent with international inventory convention . These changes are consistent with previous U .S . Climate Action Reports .
4 Projections: Delivering on Our 2020 and 2025 Targets

32 2016 Second Biennial Report
• Completing preliminary estimates of carbon stock changes and non-CO2 emissions from coastal wetlands .
• Integrating survey data from the National Resources Inventory to improve estimates of land cover change .
• Updating the time series for satellite-based data to improve estimation of biomass produc-tion and carbon inputs to agricultural soils .
• Replacing 32-kilometer-resolution weather data with 4-kilometer-resolution data, thereby improving climate drivers and subsequent estimates of land sector GHG emissions .
• Updating soils attribute data using the most recent database compiled by the National Cooperative Soil Survey .
• Improving accounting of methane emissions from rice cultivation .
A more detailed explanation of the forest inventory improvements can be found in a recent USDA General Technical Report (Woodall et al . 2015) . To reflect the most up-to-date under-standing of the U .S . land sector, we have used these new results as the basis for the projec-tions presented in this Biennial Report . In addition, results in this report reflect a synthesis of modeling results from a multiyear land-use modeling effort between USDA (particularly USFS) and EPA . As part of this effort, key modeling uncertainties have been identified, which underlie the range of potential future emissions and sinks from America’s land sector .
Range of Land Use, Land-Use Change, and Forestry ProjectionsAs described in Chapter 2, LULUCF activities in 2013 resulted in net sequestration of nearly 900 Mt CO2e (U .S . EPA/OAP 2015) . Total LULUCF sequestration increased by approximate-ly 14 percent between 1990 and 2013, largely due to a positive growth-to-harvest ratio for U .S . forests nationally and small expansions in forested land area . U .S . forest attributes and area are changing as the demand for forest products changes, as forests age, and as land uses shift . In addition, other factors, such as climate change, are altering forest characteristics and dynamics . Projecting emission fluxes from LULUCF is challenging due to the uncertainties in estimating future potential outcomes associated with complex carbon dynamics of different terrestrial ecosystems, related market interactions, and the potential extent of land-use change between sectors .
To reflect the uncertainties highlighted above, the U .S . LULUCF projections through 2030 are presented as a range . This range was developed via a collaborative multiagency effort using different models reflecting alternate modeling techniques . Using different model types in con-cert allows for a more robust range of projections . These models represent different perspec-tives on future macroeconomic outlooks (derived from recent U .S . government projections for GDP, population, and forest products demand) as well as forest characteristics and manage-ment trends .
The lower sequestration projection ranges reflect results from a USDA/USFS model scenario, which is driven by high population growth, related land-use conversion from forest to urban uses, and housing starts . This projection assumes that forested land begins to decline in 2020, which is driven by an assumption of a fixed relationship between increasing population and de-veloped land and leads to a decline in forest area and forest carbon after 2020 . If the link be-tween population and land use differs from the assumed scenario—for example, in the case of increasing dense development—this approach would underestimate the forest sink .
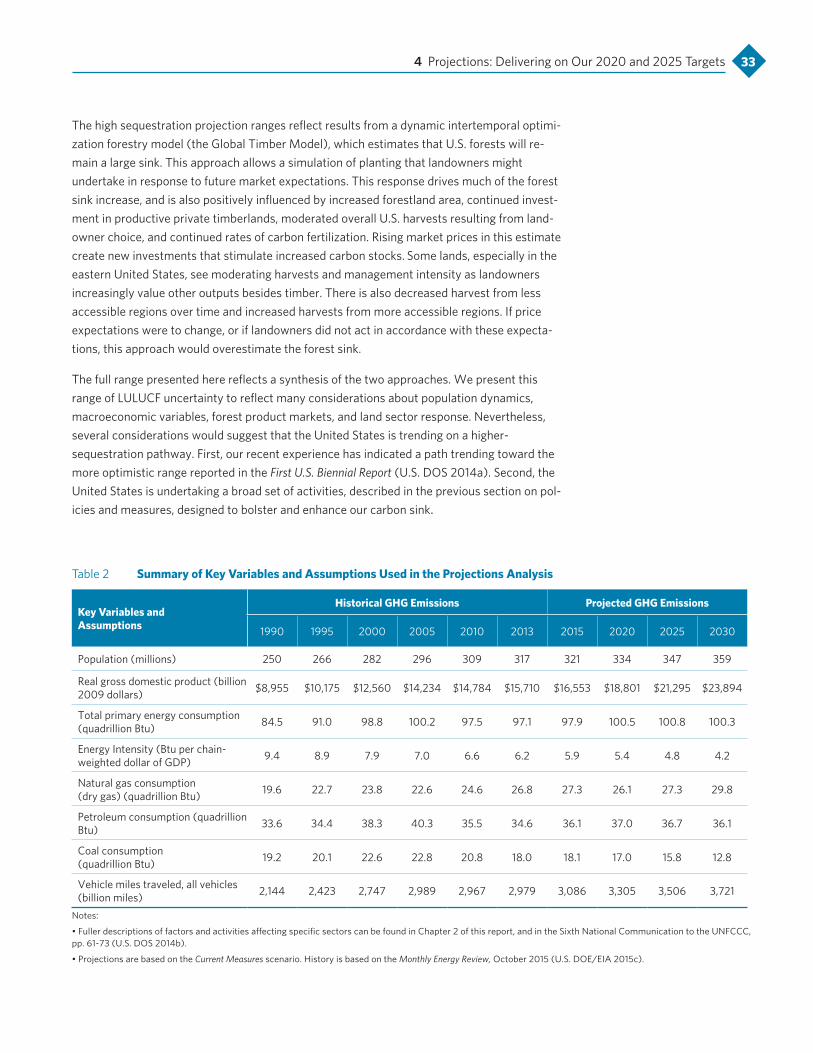
33
The high sequestration projection ranges reflect results from a dynamic intertemporal optimi-zation forestry model (the Global Timber Model), which estimates that U .S . forests will re-main a large sink . This approach allows a simulation of planting that landowners might undertake in response to future market expectations . This response drives much of the forest sink increase, and is also positively influenced by increased forestland area, continued invest-ment in productive private timberlands, moderated overall U .S . harvests resulting from land-owner choice, and continued rates of carbon fertilization . Rising market prices in this estimate create new investments that stimulate increased carbon stocks . Some lands, especially in the eastern United States, see moderating harvests and management intensity as landowners increasingly value other outputs besides timber . There is also decreased harvest from less accessible regions over time and increased harvests from more accessible regions . If price expectations were to change, or if landowners did not act in accordance with these expecta-tions, this approach would overestimate the forest sink .
The full range presented here reflects a synthesis of the two approaches . We present this range of LULUCF uncertainty to reflect many considerations about population dynamics, macroeconomic variables, forest product markets, and land sector response . Nevertheless, several considerations would suggest that the United States is trending on a higher- sequestration pathway . First, our recent experience has indicated a path trending toward the more optimistic range reported in the First U.S. Biennial Report (U .S . DOS 2014a) . Second, the United States is undertaking a broad set of activities, described in the previous section on pol-icies and measures, designed to bolster and enhance our carbon sink.
4 Projections: Delivering on Our 2020 and 2025 Targets
Table 2 Summary of Key Variables and Assumptions Used in the Projections Analysis
Key Variables and Assumptions
Historical GHG Emissions Projected GHG Emissions
1990 1995 2000 2005 2010 2013 2015 2020 2025 2030
Population (millions) 250 266 282 296 309 317 321 334 347 359
Real gross domestic product (billion 2009 dollars) $8,955 $10,175 $12,560 $14,234 $14,784 $15,710 $16,553 $18,801 $21,295 $23,894
Total primary energy consumption (quadrillion Btu) 84 .5 91 .0 98 .8 100 .2 97 .5 97 .1 97 .9 100 .5 100 .8 100 .3
Energy Intensity (Btu per chain-weighted dollar of GDP) 9 .4 8 .9 7 .9 7 .0 6 .6 6 .2 5 .9 5 .4 4 .8 4 .2
Natural gas consumption (dry gas) (quadrillion Btu) 19 .6 22 .7 23 .8 22 .6 24 .6 26 .8 27 .3 26 .1 27 .3 29 .8
Petroleum consumption (quadrillion Btu) 33 .6 34 .4 38 .3 40 .3 35 .5 34 .6 36 .1 37 .0 36 .7 36 .1
Coal consumption (quadrillion Btu) 19 .2 20 .1 22 .6 22 .8 20 .8 18 .0 18 .1 17 .0 15 .8 12 .8
Vehicle miles traveled, all vehicles (billion miles) 2,144 2,423 2,747 2,989 2,967 2,979 3,086 3,305 3,506 3,721
Notes:
• Fuller descriptions of factors and activities affecting specific sectors can be found in Chapter 2 of this report, and in the Sixth National Communication to the UNFCCC, pp . 61-73 (U .S . DOS 2014b) .
• Projections are based on the Current Measures scenario . History is based on the Monthly Energy Review, October 2015 (U .S . DOE/EIA 2015c) .

34 2016 Second Biennial Report
Table 4 Historical and Projected* U.S. Greenhouse Gas Emissions under Current Measures, by Gas: 2000–2030 (Current Measures only, Mt CO2e)
Greenhouse GasesHistorical GHG Emissions (1) Projected GHG Emissions
2000 2005 2010 2013 2015 2020 2025 2030
Carbon dioxide (2) 6,003 6,134 5,705 5,505 5,578 5,409 5,305 5,094
Methane 716 708 667 636 647 670 674 682
Nitrous oxide 335 356 360 355 350 338 335 334
Hydrofluorocarbons 125 131 153 163 182 211 250 265
Perfluorocarbons 16 7 5 6 6 5 5 7
Sulfur hexafluoride 18 14 10 7 9 9 9 10
International bunker fuels (not included in totals) 102 114 118 101 102 108 113 118
Total Gross Emissions 7,213 7,350 6,899 6,673 6,772 6,641 6,580 6,392
Sequestration removalsHigh sequestration
–641 –912 –872 –882–970 –1,191 –1,201 –1,118
Low sequestration –928 –1,044 –908 –689
Total Net EmissionsHigh sequestration
6,571 6,438 6,027 5,7915,802 5,451 5,379 5,274
Low sequestration 5,844 5,597 5,672 5,703
Notes:
*Projections are for the current measures and do not reflect the impact of additional measures .
(1) Historical emissions and sinks data are from U .S . EPA/OAP 2015 . Bunker fuels and biomass combustion are not included in inventory calculations .
(2) Energy-related CO2 projections are calculated from U .S . DOE/EIA 2015 with adjustments to reflect the impacts of the Clean Power Plan, to remove emissions associated with international bunker fuels, and to add emissions associated with U .S . territories .
Table 3 Historical and Projected* U.S. Greenhouse Gas Emissions under Current Measures, by Sector: 2000–2030 (Current Measures only, Mt CO2e)
Sectors (2)Historical GHG Emissions (1) Projected GHG Emissions
2000 2005 2010 2013 2015 2020 2025 2030
Energy 4,280 4,345 4,097 3,898 4,004 3,860 3,816 3,657
Transportation 1,862 1,929 1,758 1,739 1,701 1,680 1,622 1,578
Industrial processes 397 367 354 359 388 430 477 497
Agriculture 460 494 525 516 512 504 499 494
Forestry and land use 32 26 20 23 28 28 28 28
Waste 182 189 145 138 138 138 138 137
Total Gross Emissions 7,213 7,350 6,899 6,673 6,772 6,641 6,580 6,392
Forestry and land use (sinks) (3)
High sequestration–641 –912 –872 –882
–970 –1,191 –1,201 –1,118
Low sequestration –928 –1,044 –908 –689
Total Net Emissions High sequestration
6,571 6,438 6,027 5,7915,802 5,451 5,379 5,274
Low sequestration 5,844 5,597 5,672 5,703
Notes:
*Projections are for the current measures and do not reflect the impact of additional measures .
(1) Historical values are from U .S . EPA/OAP 2015 .
(2) Sectors correspond to inventory-reporting sectors, except that carbon dioxide, methane, and nitrous oxide emissions associated with mobile combustion have been moved from energy to transportation .
(3) Sequestration is only included in the net emissions total .
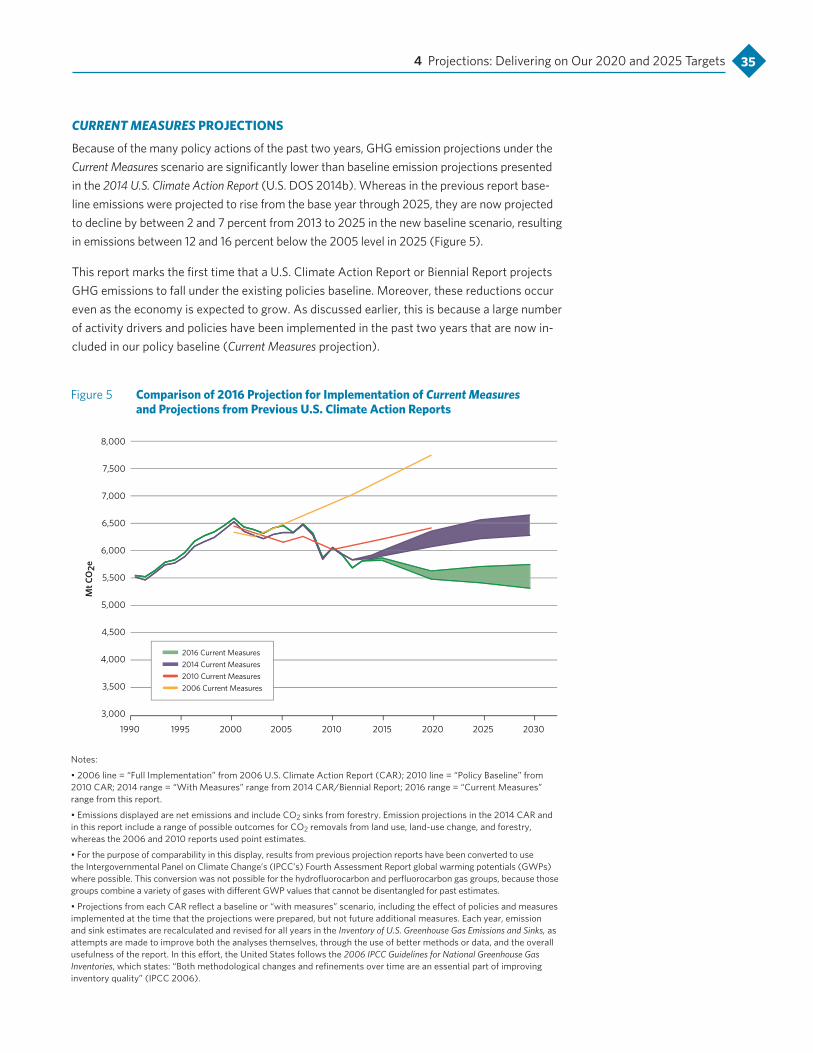
35
CURRENT MEASURES PROJECTIONS
Because of the many policy actions of the past two years, GHG emission projections under the Current Measures scenario are significantly lower than baseline emission projections presented in the 2014 U.S. Climate Action Report (U .S . DOS 2014b) . Whereas in the previous report base-line emissions were projected to rise from the base year through 2025, they are now projected to decline by between 2 and 7 percent from 2013 to 2025 in the new baseline scenario, resulting in emissions between 12 and 16 percent below the 2005 level in 2025 (Figure 5) .
This report marks the first time that a U .S . Climate Action Report or Biennial Report projects GHG emissions to fall under the existing policies baseline . Moreover, these reductions occur even as the economy is expected to grow . As discussed earlier, this is because a large number of activity drivers and policies have been implemented in the past two years that are now in-cluded in our policy baseline (Current Measures projection) .
Figure 5 Comparison of 2016 Projection for Implementation of Current Measures and Projections from Previous U.S. Climate Action Reports
1990 1995 2000 2005 2010 2015 2020 2025
Mt C
O2e
2030
3,000
3,500
4,000
4,500
5,000
5,500
6,000
6,500
7,000
7,500
8,000
2016 Current Measures 2014 Current Measures 2010 Current Measures 2006 Current Measures
Notes:
• 2006 line = “Full Implementation” from 2006 U .S . Climate Action Report (CAR); 2010 line = “Policy Baseline” from 2010 CAR; 2014 range = “With Measures” range from 2014 CAR/Biennial Report; 2016 range = “Current Measures” range from this report .
• Emissions displayed are net emissions and include CO2 sinks from forestry . Emission projections in the 2014 CAR and in this report include a range of possible outcomes for CO2 removals from land use, land-use change, and forestry, whereas the 2006 and 2010 reports used point estimates .
• For the purpose of comparability in this display, results from previous projection reports have been converted to use the Intergovernmental Panel on Climate Change’s (IPCC’s) Fourth Assessment Report global warming potentials (GWPs) where possible . This conversion was not possible for the hydrofluorocarbon and perfluorocarbon gas groups, because those groups combine a variety of gases with different GWP values that cannot be disentangled for past estimates .
• Projections from each CAR reflect a baseline or “with measures” scenario, including the effect of policies and measures implemented at the time that the projections were prepared, but not future additional measures . Each year, emission and sink estimates are recalculated and revised for all years in the Inventory of U.S. Greenhouse Gas Emissions and Sinks, as attempts are made to improve both the analyses themselves, through the use of better methods or data, and the overall usefulness of the report . In this effort, the United States follows the 2006 IPCC Guidelines for National Greenhouse Gas Inventories, which states: “Both methodological changes and refinements over time are an essential part of improving inventory quality” (IPCC 2006) .
4 Projections: Delivering on Our 2020 and 2025 Targets

36 2016 Second Biennial Report
An indication of U .S . progress—and a rough substitute for a BAU or No Policy case—can be obtained by looking at the change over time in baseline projections from successive U .S . Climate Action Reports, as indicated in Figure 5 .5 It shows a very clear improvement in U .S . emission trajectories between 2006 and 2016 . In 2006, emissions were projected to increase by about 20 percent above 2005 levels by 2020 . In 2010, we anticipated an increase of just 4 percent over the same period . In 2014, we projected a 0–5 percent decline from 2005 levels (U .S . DOS 2010, U .S . DOS 2014b) . In this report, emissions under the 2016 Current Measures scenario are expected to be 13–15 percent below 2005 levels in 2020 .
ADDITIONAL MEASURES PROJECTIONS
While the projections in the 2016 Current Measures scenario show significant divergence from the Current Measures projections in the 2014 Climate Action Report due to a number of poli-cies and measures that have been implemented and adopted in the last two years, additional measures are achievable under existing authorities that will lead to further reductions in 2020 and 2025 . The Additional Measures projections are calculated by starting with estimates of U .S . emissions based on currently implemented and adopted policies and measures and pro-jections of reductions from policies and measures that have yet to be fully implemented . This includes such policies as the proposed second round of heavy-duty vehicle standards, which were released in draft form in the summer of 2015 and will be finalized in 2016 (U .S . EPA 2015d) . The reductions from Additional Measures were estimated for three categories of actions depending on the affected pollutant: CO2, HFCs, and CH4, and N2O . These additional place us solidly on track to be in the range of 17 percent below 2005 levels by 2020, and have the potential to bring emissions to 22–27 percent below 2005 levels in 2025 .
Carbon DioxideCO2 represents the largest share of GHG emissions in the United States . Already, the Obama Administration has taken strong steps to cut carbon emissions from some of the most signifi-cant sectors . This includes the Clean Power Plan, which was finalized in the summer of 2015 and, thus, included in the Current Measures projections . Additional measures can achieve sub-stantial reductions of CO2 through implementation of the Climate Action Plan and other mea-sures under existing authorities (EOP 2013) . The estimates for CO2 reductions under the Additional Measures projection are based on a range of actions, many of which are already proposed and listed in Chapter 3 . These actions include but are not limited to:
• Full implementation of Phase II heavy-duty vehicle fuel economy standards .
• Finalization of proposed, new, or updated appliance and equipment efficiency standards .
• Increased efficiency of new and existing residential and commercial buildings .
• Reduction in industrial energy demand in several subsectors .
• Additional state actions in the electricity sector .
• Enhanced federal programs that lead to greater efficiencies in industry and transportation, including greater biofuel deployment and commercial aviation efficiency .
Appendix 2 contains further information on the Current Measures and Additional Measures scenarios .
As reflected in Table 5, this analysis shows that, taken together, additional actions have the potential to reduce CO2 emissions by another 114–413 Mt CO2e in 2025 relative to the 2016 policy baseline or, equivalently, to further reduce emissions from 2005 levels by 2–6 percent .
5 This approach is rough because it only excludes recently implemented measures and does not account for changes in macroeconomic drivers .

37
HydrofluorocarbonsThe U .S . government has collaborated with the governments of Mexico and Canada for the past five years to propose an amendment to the Montreal Protocol on Substances that Deplete the Ozone Layer that would phase down production and consumption of, and control byproduct emissions of, HFCs (U .S . EPA 2015i) . The amendment calls for progressive global reductions in the consumption and production of HFCs through 2046 . In November 2015, in large part be-cause of the leadership of the United States, Mexico, and Canada, the parties to the Montreal Protocol agreed to work toward an amendment to phase down HFCs in 2016 . This was the first time the Montreal Protocol had endorsed using this forum to address HFCs . The United States remains fully committed to this process, and will continue to work with our North American partners and other Montreal Protocol parties to finalize an HFC amendment in 2016 .
Estimates for potential achievable U .S . reductions for HFCs are considered under the Additional Measures scenario and are based on a new analysis conducted by EPA for a pro-posed global commitment to phase down production and consumption of HFCs under the Montreal Protocol . The United States is already taking steps domestically, and will continue to do so, as it moves toward an international agreement, including using EPA authority through the SNAP program and leveraging federal government purchasing power to promote cleaner alternatives . These actions, which are modeled in the 2016 Current Measures scenario, can set the United States on firm ground for reaching reductions proposed under the Montreal Protocol . HFC emission reductions through additional measures in 2020 and 2025 relative to the 2016 Current Measures scenario are presented in Table 5 and are estimated to be 63 and 113, Mt CO2e, respectively .
Methane and Nitrous OxideIn March 2014, the Obama Administration released the Strategy to Reduce Methane Emissions
(U .S . EPA 2014a) . The strategy builds on progress to date and identifies additional opportuni-ties to cut methane emissions from a range of sectors, including landfills, coal mining, agricul-ture, and oil and gas systems . In January 2015, the Administration announced a new goal to cut methane emissions from the oil and gas sector by 40–45 percent from 2012 by 2025, and established a set of actions to put the United States on a path to achieve this ambitious goal . Since the release of the strategy, the United States has proposed policies and measures to significantly cut emissions from new oil and gas systems . Additionally, the Administration announced proposed standards regulating landfill gas from new and existing landfills . These proposed measures are expected to be finalized over the next year and, therefore, are includ-ed in the Additional Measures scenario .
Table 5 Ranges of Potential Emission Reductions for the Additional Measures Scenario Relative to Emissions in the 2016 Current Measures Scenario (Mt CO2e)
PollutantPotential Reductions
2020 2025
Carbon dioxide 35 –234 114–413
Methane and nitrous oxide 104–149 123–175
Hydrofluorocarbons 63 113
Total 202–446 349–700
4 Projections: Delivering on Our 2020 and 2025 Targets
38 2016 Second Biennial Report
The Additional Measures scenario also incorporates reductions in methane and nitrous oxide from a range of measures, including, but not limited to:
• more efficient nutrient application techniques that reduce nitrous oxide emissions, and
• additional reductions that are cost-effective under EPA’s Marginal Abatement Cost Curve (MAC) model .
Based on the analysis running the MAC model against the 2015 policy baseline emissions and projections, the range of CH4 and N2O abatement potential in 2020 relative to baseline for the purposes of this report is 104–149 Mt CO2e; in 2025, this range is 123–175 Mt CO2e .
SUMMARY OF PROJECTIONS: PROGRESS TOWARD OUR 2020 AND 2025 TARGETS
Figure 6 shows both the Current Measures and Additional Measures projections . It also includes projections from previous U .S . Climate Action Reports as an indication of how much the U .S . emissions trajectory has been driven down in the past decade . As noted earlier, since the last CAR published in 2014, the Current Measures projection has shifted significantly downward, re-flecting the impacts of the Clean Power Plan and additional major actions, as described in Chapter 3 .
This projection only includes policies implemented to mid- 2015; it shows substantial move-ment toward the 2020 and 2025 goals, though it does not reach them . The Additional Measures projection shows that we are on track to hit our 2020 target, in the range of 17 per-cent below 2005 levels . With the U .S . land sector sink tracking toward the optimistic end of the range, the projection shows U .S . emissions decreasing to 22–27 percent below 2005 lev-els in 2025 .
Due to the inherent uncertainty of projected emissions and removals from LULUCF, and the more limited ability to influence these outcomes relative to other sectors of the economy, both scenarios include a range of potential LULUCF outcomes . This range is represented graphically by the gray shaded areas in Figure 6 . In addition, a portion of the Additional Measures range results from uncertainty in policy implementation, as described in Figure 6; this range is represented graphically by the darker solid shading . As discussed earlier, we have reason to believe that the U .S . land sector will trend toward the optimistic side of the uncertainty range, but we are presenting the full range here for transparency .
These results indicate three important conclusions .
• First, our efforts of the past years, starting in the President’s first term and accelerating under the Climate Action Plan, have already yielded significant emission reductions . This is evident from the dramatic reductions in Figure 5 from the 2006 and 2010 Current Measures to the 2014 and 2016 Current Measures.
• Second, a comprehensive implementation of the planned measures under the Climate Action Plan puts us on track to hit our 2020 target and builds the foundation for meeting our 2025 target . Under these scenarios, we will reduce emissions by up to 27 percent by 2025 at the same time that our economy is projected to grow by 50 percent from 2005 levels .

39
Figure 6 U.S. Emissions Projections—2016 Current Measures Compared with Potential Reductions from Additional Measures Consistent with the Climate Action Plan Also shown are previous projections from the 2006, 2010, and 2014 U .S . Climate Action Reports, which demonstrate the dramatic ratcheting down of projected U .S . emissions over the past decade .
Notes:
• The 2016 Policy Baseline scenario assumes that no additional measures are implemented after 2015 .
• The range for the 2016 Current Measures scenario (gray shaded wedges) reflects uncertainty in projected net LULUCF sequestration rates, much of which will be determined by factors that cannot be directly influenced by policies and measures .
• The Additional Measures scenario (blue shaded wedge) incorporates post-2015 implementation of additional measures . The range for the Additional Measures scenario reflects both the LULUCF sequestration range (gray shaded wedges), as well as uncertainty regarding projected emission reductions from measures that will be implemented consistent with the Climate Action Plan (solid shading) . The solid portion labeled “policy range” illustrates the range of emission outcomes that can be directly influenced by implementation of additional measures, assuming higher land sequestration levels .
17% below 2005
26% below 2005
2014 Current Measureswith Optimistic Sink
28% below 2005
4,000
4,500
5,000
5,500
6,000
6,500
7,000
7,500
8,000
1990 1995 2000 2005 2010 2015 2020 2025
LULUCF Uncertainty
LULUCF Uncertainty
LULUCF Uncertainty
Major New Policies:Hydrofluorocarbon Standards
Methane StandardsHeavy-Duty Vehicle Standards
Major New Policies:Vehicle E�ciency StandardsEnergy E�ciency Standards
Major New Policies:Clean Power Plan
Energy E�ciency Standards
2016 Additional MeasuresPolicy Range
22–27% below 2005with Optimistic Sink
U.S
. Net
Em
issi
ons
(Mt C
O2e
)
2006 Current Measures
2016 Current Measureswith Optimistic Sink
2010 Current Measures
4 Projections: Delivering on Our 2020 and 2025 Targets
• Finally, we will continue to strive to achieve the upper end of our target of 28 percent be-low 2005 levels in 2025 . Our projection here includes only planned measures that can be undertaken or otherwise initiated by the Obama Administration . Future administrations or Congress have further options on the table that they can exercise to bring us to, or beyond, the upper range of our target .
The United States is committed to leading efforts to mobilize resources for developing countries to mitigate and adapt to climate change . Since the First Biennial Report, the United States committed more than $5 .5 billion in public climate finance in FYs 2013
and 2014 and pledged $3 billion to the Green Climate Fund . After meeting the fast-start fi-nance (FSF) commitment, developed countries are working toward the collective goal of mo-bilizing $100 billion in climate finance per year by 2020 from a wide variety of public, private, bilateral, and multilateral sources . This climate finance will address the needs of developing countries in the context of meaningful mitigation actions and transparency on implementa-tion . To accomplish this goal, we are using a full range of channels and instruments to mobi-lize climate finance efficiently and effectively .
Financing climate change action is integral to U .S . diplomatic, development, and global secu-rity efforts . Since the First Biennial Report, President Obama has continued to advance U .S . leadership on these fronts by signing an Executive Order that calls for integrating climate re-silience considerations into the core of our foreign assistance work, calling for an end to public support of new coal-fired power plants overseas except in rare circumstances,6 announcing that the United States intends to contribute $3 billion to the Green Climate Fund, and inte-grating climate change into our Quadrennial Diplomacy and Development Review—a blue-print for advancing America’s interests in global security, inclusive economic growth, accountable governance, and freedom for all (U .S . DOS 2015) . By taking a multidimensional approach, the United States is working to build a low-emission, climate-resilient future across all relevant sectors .
These latest efforts play a critical role in advancing the 2010 Presidential Policy Directive on Global Development, which identified the Global Climate Change Initiative (GCCI) as one of three priority U .S . development initiatives . As part of the broader GCCI effort, the 2012 U .S . Agency for International Development (USAID) Climate Change and Development Strategy set out principles, objectives, and priorities for USAID climate change assistance from 2012 through 2016 (USAID 2012) . This strategy prioritizes not only clean energy, sustainable land-scapes, and adaptation, but also integration—factoring climate change knowledge and prac-tice into all USAID programs to ensure that all sector portfolios are climate resilient and, where possible, reduce GHG emissions .
FINANCING CLIMATE CHANGE ACTION—OVERVIEW OF U.S. CLIMATE FINANCE IN FYS 2013–2014
Throughout FYs 2013 and 2014, the United States committed $5.5 billion to help developing countries address the causes and impacts of climate change . As illustrated in Table 6, this finance can be explored across a number of dimensions—including the institutional channels through which it is delivered, the financial instruments used, the geographies targeted, and its ultimate end use in terms of building resilience, reducing emissions, or improving land use .
Supporting the Global Community: International Climate Finance and Other Activities
6 These include plants in the poorest countries where no economically feasible alternative exists or if the plant is equipped with CCS technology .

41 5 Supporting the Global Community: International Climate Finance and Other Activities
Climate Finance ChannelsThe United States provides climate finance through both bilateral and multilateral channels .
Bilateral Channels
In FYs 2013 and 2014, the United States committed more than $4.5 billion in bilateral climate finance to its developing country partners . This finance was provided in one of three forms:
• Congressionally appropriated, grant-based bilateral climate assistance—This finance is pro-grammed directly through country-specific, regional, and global programs, principally GCCI . These programs are mainly administered by USAID, but are also supported by DOS, the Millennium Challenge Corporation (MCC), and other U .S . government agencies . This assistance amounted to more than $1.5 billion over FYs 2013 and2014 .
• Development finance—Under the Obama Administration, the United States—primarily through the Overseas Private Investment Corporation (OPIC)—has become one of the world’s largest financiers of clean energy projects in developing countries, committing more than $2.6 billion through bilateral development finance agencies over FYs 2013 and 2014 . In addition to standard debt products, OPIC provides senior secured loans to private equity funds—making it one of the largest supporters of private equity funds in developing countries—and political risk insurance to project lenders and equity investors operating in emerging markets .
• Export credit—The Export-Import Bank of the United States (EXIM) continued to scale up its competitively priced, long-term, climate-related financing . During FYs 2013 and2014, EXIM committed $379 million of financing to support climate-specific activities in devel-oping countries .
Multilateral Channels
• Multilateral climate change funds—These entities feature institutional structures governed jointly by developed and developing countries . They play an important role in promoting a coordinated, global response to climate change . During FYs 2013 and 2014, the United States committed $921 million to multilateral climate change funds, including the Clean Technology Fund ($406 million), Forest Investment Program ($12 million), Global Environment Facility (GEF) ($134 million), Initiative for Sustainable Forest Landscapes ($32 million), Least Developed Countries Fund ($53 million), Pilot Program for Climate
Table 6 Dimensions of U.S. Climate Finance
Channels Instruments Geography Use (or “Pillar”)
Bilateral• Congressionally appropriated, bilateral
assistance, including the U .S Global Climate Change Initiative
• U .S . Export-Import Bank • U .S . Overseas Private Investment
Corporation
Multilateral• Multilateral development banks • Climate funds
• Grants• Loans
– Concessional– Market rate
• Guarantees and insurance
• Country-specific activities
• Global, regional, and multicountry activities
• Adaptation• Clean energy• Sustainable
landscapes

42 2016 Second Biennial Report
Figure 7 Geographic Breakdown of U.S. Climate Finance: FY 2013–2014
By Channel
EXIM $378.94
OPIC$2,622.15
MultipleCountry$1,341.01
Middle East $4.13Europe and Eurasia$28.79
Africa$406.64
Asia$470.60
Latin Americaand Caribbean
$213.25
Total
$5,465.51 billion
Multilateral$920.60
Bilateral$4,544.91
CongressionallyAppropriated
$2,464.43
By Geography
Country-Specific
$1,123.41
Note: EXIM = Export-Import Bank of the United States; OPIC = Overseas Private Investment Corporation .
Resilience ($162 million), Scaling-Up Renewable Energy Program in Low Income Countries ($12 million), and Special Climate Change Fund ($10 million) .
• Multilateral development banks (MDBs)—U .S . contributions to the MDBs, as well as those from other development partners, play a key role in enabling these institutions to provide billions in climate support to developing countries . In 2013 and 2014, the MDBs committed more than $52 billion in total climate finance . However, since countries’ contributions to MDBs are not earmarked for specific purposes, it is not possible to specify the exact pro-portion of U .S . support that ultimately finances climate change activities in developing countries . Thus, U .S . contributions to the ordinary capital resources of the MDBs are not included in figures presented in this chapter . Nevertheless, even though we do not include it here, MDB financing for climate activities is included in the $100 billion climate finance goal, according to the methodology developed in October 2015 by the Organisation for International Co-operation and Development (OECD) .
Financial InstrumentsThe United States uses a range of financial instruments and interventions to mobilize climate finance through these channels . These include grants; risk mitigation tools, such as guaran-tees and insurance; and low-cost, long-term debt financing, including both concessional and market-rate loans . Together, these instruments are helping to mobilize finance by providing a robust, yet flexible, toolkit that is prioritized and adapted according to each country’s unique needs, circumstances, and specific financing and investment barriers .
GeographyU .S . climate finance is provided through both country-specific programs and multi-country programs that often have a regional or global focus . While finance provided by OPIC and EXIM is more demand driven and available for all eligible countries to access, U .S . grant-based assistance is typically appropriated by Congress for specific countries or regions, with the exception of funds that are appropriated for multilateral climate activities . Figure 7 pres-ents a geographic breakdown of U .S . congressionally appropriated assistance that can be at-tributed to a particular region . In FYs 2013 and 2014, approximately 42 percent of this finance went to Asia, 36 percent to Africa, 19 percent to Latin America and the Caribbean, and the balance to developing economies in Europe and the Middle East .

43
PillarsU .S . climate finance supports activities across three main pillars: adaptation, clean energy, and sustainable landscapes . As illustrated in Figure 8, of U .S . congressionally appropriated climate finance, approximately 49 percent supported clean energy activities, 34 percent sup-ported adaptation activities, and 17 percent supported sustainable landscape activities . Finance committed through more demand-driven U .S . climate finance channels, such as OPIC and EXIM, typically supported clean energy activities . The following sections provide a sam-ple of initiatives within each pillar .
Adaptation
The United States is committed to helping poor and vulnerable countries adapt to climate change and enhance the resilience of their communities and economies . Dedicated U .S . finan-cial support for adaptation has increased more than eightfold since 2009, and the United States committed $834 million in FYs 2013 and 2014 alone to activities that promote climate resilience in developing countries .
The United States prioritizes climate adaptation assistance for countries, regions, and popula-tions that are highly vulnerable to the impacts of climate change, with particular emphasis on small island developing states, glacier-dependent countries, and least-developed countries (LDCs), especially in sub-Saharan Africa . By increasing resilience in key sectors, such as food security, water, coastal management, and public health, our support helps vulnerable coun-tries prepare for and respond to increasing climate- and weather-related risks .
U .S . adaptation assistance is helping identify and disseminate adaptive strategies, and it is providing needed climate services—including actionable science, data, information, tools, and training—to developing countries working to strengthen their national resilience to the im-pacts of climate change . It is building the capacity of partner governments and civil society partners to respond to climate change risks through programs, such as the Climate Services for Resilient Development partnership . U .S . support is also helping developing countries make their own decisions on how to address the impacts of climate change and advance their National Adaptation Planning (NAP) processes through such programs as the NAP Global Network .
At the same time, the magnitude of the challenge requires not only dedicated adaptation finance flows, but also a broader, integrated approach to international development . To help
5 Supporting the Global Community: International Climate Finance and Other Activities
By Pillar
CleanEnergy
$1,216.20
Adaptation$832.12
SustainableLandscapes
$415.90
By Channel
EXIM $378.94
OPIC$2,622.15
Total
$5,465.51 billion
Multilateral$920.60
Bilateral$4,544.91
CongressionallyAppropriated
$2,464.43
Figure 8 Breakdown of U.S. Climate Finance by Pillar: FY 2013–2014
Note: EXIM = Export-Import Bank of the United States; OPIC = Overseas Private Investment Corporation .
44 2016 Second Biennial Report
address this challenge, President Obama issued Executive Order 13677 in September 2014, which mandates federal agencies to integrate climate-resilience considerations in all U .S . in-ternational development work (EOP 2014b) . Development investments in areas as diverse as malaria prevention and treatment, building hydropower facilities, improving agricultural yields, and developing urban infrastructure will not be effective in the long term if they do not account for such impacts as shifting ranges of disease-carrying mosquitoes, changing water availability, or rising sea levels .
Clean Energy
In FYs 2013 and 2014, the United States committed $4.2 billion to finance clean energy ac-tivities in developing countries . This climate assistance focused on countries and sectors of-fering significant emission reduction potential over the long term, as well as countries that offered the potential to demonstrate leadership in sustained, large-scale deployment of clean energy . In terms of sector coverage, clean energy includes renewable energy and energy ef-ficiency and excludes natural gas and other fossil fuel power plant construction or retrofits . The United States is supporting countries to place the building blocks to scale up renewable energy, for example, by providing technical assistance to energy system planners, regulators, and grid operators to improve the capability of regional energy grids to distribute clean en-ergy . The United States also supports global programs that focus chiefly on information shar-ing and building coalitions for action on clean energy technologies and practices .
The United States is helping countries expand access to clean, affordable electricity through such programs as Power Africa, the Global Lighting and Energy Access Partnership (Global LEAP), and the U .S .-Africa Clean Energy Finance initiative . Our work through the Climate and Clean Air Coalition and Global Methane Initiative is reducing emissions of short-lived climate pollutants, such as methane, black carbon, and many HFCs . The United States is also support-ing efforts to identify and pursue country-driven, low-carbon development strategies that make the most sense for them through the Enhancing Capacity for Low Emission Development Strategies (EC-LEDS) program and the LEDS Global Partnership .
Sustainable Landscapes
For activities related to land-use mitigation (or “sustainable landscapes”), including reducing emissions from deforestation and forest degradation (REDD+), dedicated U .S . climate change assistance works to (1) reduce GHG emissions from deforestation and other land uses; (2) increase the sequestration of carbon stored in trees, plants, and soils; and (3) generate ad-ditional social and environmental benefits, such as good governance, enhanced resilience, and biodiversity conservation . In FYs 2013 and 2014, the United States committed $483 million to promote sustainable landscapes in developing countries . Our support prioritizes the mitiga-tion potential of investments; countries with the political will to implement large-scale efforts to reduce emissions from deforestation, forest degradation, and other land-use activities; and potential for investments in monitoring, reporting, and verification of forest cover and GHG emission reductions .
Reducing Emissions from Forests and Other LandsGHG emissions from deforestation, agriculture, and other land uses constitute approximately one-quarter of global emissions . In some developing countries, land sector GHG emissions can account for as much as 80 percent of total emissions . To meet the challenge of reducing

45
these emissions, the United States is working with partner countries to put in place the sys-tems and institutions necessary to significantly reduce global land-use-related emissions, supporting the provision of data and information about forests and land use, and creating new models for rural development that generate climate benefits, while conserving biodiversity, protecting watersheds, and improving livelihoods .
Support for multilateral initiatives from the U .S . Department of the Treasury and DOS—such as the Forest Investment Program, the Forest Carbon Partnership Facility, and the BioCarbon Fund Initiative for Sustainable Forest Landscapes—is building capacity and facilitating imple-mentation of REDD+ strategies and other sustainable landscape programs in dozens of devel-oping countries . Together with the Consumer Goods Forum, a coalition of more than 400 global corporations, USAID and DOS launched the Tropical Forest Alliance 2020 to reduce tropical deforestation linked to major commodities and their supply chains . In Indonesia, MCC is funding a five-year Green Prosperity program that supports environmentally sustain-able, low-carbon economic development in select districts .
PROMOTING EFFECTIVENESS
To promote effective use of climate finance, the United States works to ensure that our sup-port is efficient, effective, and innovative; based on country-owned plans; and focused on achieving measurable results, with a long-term view of economic and environmental sustainability .
Supporting Country-Driven Approaches U .S . support for country-driven approaches involves engaging in strategic planning to ensure that climate finance is distributed effectively and is designed to meet partner countries’ needs . For example, the EC-LEDS program is designed to provide partner countries the neces-sary tools (e .g ., technical support for developing GHG inventories and conducting technical and economic analyses) for developing their own low-emission development strategies that are driven by their unique circumstances and priorities . U .S . government funding for adapta-tion is also tailored to partner country needs and often works directly through country-led processes .
Building Effective Enabling Environments The United States also acknowledges the critical role our partner countries play in promoting the effectiveness of climate finance . Where our partners set in place systems that reflect high standards of transparency, good governance, and accountability, we will respond directly to country priorities, making new investments in line with established national strategies and country development plans based on broad consultation, and will empower responsible gov-ernments to drive development and sustain outcomes by working through national institu-tions, rather than around them .
Moreover, our experience in climate finance has shown that any public financial instrument and intervention’s ability to mobilize and deploy additional finance depends largely on the broader policy framework in place in developing countries . This can involve climate-specific policies, such as energy sector regulations and carbon pricing, as well as broader, non- climate-specific policies and legal frameworks . The United States remains committed to working with our development partners to identify complementary solutions for addressing
5 Supporting the Global Community: International Climate Finance and Other Activities

46 2016 Second Biennial Report
domestic investment barriers and achieving their low-carbon, climate-resilient development strategies .
Scaling Down Support for High-Carbon Infrastructure Achieving our shared climate objectives depends not only on how much we are investing in low-carbon activities, but also on how much we are scaling down support for high-carbon activities . To this end, in June 2013, President Obama called for an end to U .S . government support for public financing of new coal power plants overseas, except for (1) the most efficient coal technology available in the world’s poorest countries, in cases where no other economically feasible alternatives exist, or (2) facilities deploying carbon capture and seques-tration technologies . The United States has worked to secure the agreement of other coun-tries, export credit agencies (ECAs), development finance institutions (DFIs), and MDBs to adopt similar policies . In November 2015, OECD reached a landmark agreement significantly reducing export credit availability for coal-fired power plants around the world—the first mul-tilateral standards of this kind . In addition, a number of other MDBs and bilateral agencies have now adopted similar policies .
ENSURING TRANSPARENCY
The United States views transparent tracking and reporting of climate finance as key to ensur-ing accountability, promoting effectiveness, and building trust . To ensure robust reporting, each implementing government agency or entity follows strict guidelines and eligibility crite-ria when collecting information on support of activities related to adaptation, clean energy, and sustainable landscapes . For instance, activity descriptions provided by USAID missions are reviewed by climate change specialists to ensure compliance with USAID climate change goals .
For the purpose of our climate finance reporting to the UNFCCC, the United States only in-cludes programs that have mitigation and /or adaptation objectives or significant co-benefits (e .g ., relevant biodiversity and food security activities) . In the case of programs for which only part of the activity is targeted toward a climate objective, only the relevant financial support is counted, rather than the entire program budget .
NEW AND ADDITIONAL CLIMATE FINANCE
International assistance for climate change continues to be a major priority for the United States . The Obama Administration seeks new funding from Congress on an annual ba-sis . Since ratifying the UNFCCC in 1992, U .S . international climate finance increased from vir-tually zero to around $2 .7 billion per year in FYs 2013 and 2014 . During the FSF period alone (2010–2012), average annual appropriated climate assistance increased fourfold compared with 2009 funding levels .
Mobilizing Private Finance While maintaining a strong core of public climate finance is essential, the United States is actively pursuing strategies to encourage private investment in low-carbon, climate-resilient activities in developing countries . We are working to combine our significant, but finite, public contributions with targeted, smart policies to mobilize maximum private investment in climate-friendly activities . It is important to note that more efficient leveraging of private investment can allow limited public resources to be concentrated in areas and sectors where

47
the private sector is less likely to invest on its own, particularly in adaptation activities in the most vulnerable countries and LDCs .
U .S .-supported efforts to mobilize private finance include the following:
• The Pilot Auction Facility for Methane and Climate Change Mitigation, which is testing an in-novative performance-based approach to allocate public finance for methane abatement projects and reduce risk for private investors .
• The Clean Technology Initiative Private Financing Advisory Network, which is helping promising clean energy entrepreneurs in developing countries to develop business plans and investment pitches, connect with private investors, and ultimately secure financing .
• The R4 Rural Resilience Initiative, which is improving the resilience and food security of vulnerable rural households across Africa (e .g ., Ethiopia, Senegal, Malawi, Zambia), by enabling some of the poorest farmers to gain access to insurance products .
• The USAID Development Credit Authority, which is addressing market barriers to private investment, including investment in forest conservation .
In many cases, the barriers to mobilizing private finance relate to a combination of factors, including poor incentives, challenges in engaging with host government regulatory processes, perceived risk, and lack of knowledge in the commercial banking sector about climate-friendly opportunities . U .S . bilateral assistance through USAID targets technical assistance to address these and other issues .
As we work to identify new ways to unlock billions more in private finance, the United States also recognizes the importance of developing new financing tools . This is why in June 2014, the United States, Germany, and the United Kingdom launched The Global Innovation Lab for Climate Finance . The Lab is a public–private initiative to identify and pilot cutting-edge cli-mate finance instruments to unlock new private investment for climate change mitigation and adaptation in developing countries . After receiving more than 90 proposals for consideration from around the world, the Lab has selected four of the most promising proposals through an expert evaluation process to move toward the pilot phase . The intent is for the Lab to demon-strate the viability of innovative climate finance instruments for countries, MDBs, DFIs, and other institutions to potentially deploy .
Improving the Tracking of Mobilized Private Finance
Since the First Biennial Report, the United States and other developed countries have been working to enhance our ability to track the amount of private finance mobilized by public in-terventions . Building on the work of the Research Collaborative on Tracking Private Climate Finance,7 we have worked with other developed countries to reach a common understanding of the scope of mobilized climate finance and a common methodology for tracking and re-porting toward our collective goal . Our institutions and agencies will endeavor to use this framework as a basis going forward, and work with relevant multilateral and other institutions to harmonize our approaches over time .
For our common methodological framework and tracking progress toward the $100 billion goal, we consider mobilized climate finance to include the following:
• Public finance provided by our governments through a variety of institutions (including through the operating entities of the financial mechanism of the UNFCCC, bilateral aid
5 Supporting the Global Community: International Climate Finance and Other Activities
7 Hosted by the Organisation for Economic Co-operation and Development, the Research Collaborative on Tracking Private Climate Finance is a consortium of experts from international financial institutions, the private sector, governments, and nongovernmental organizations that is working to develop tools for more accurately tracking mobilized private climate finance .

48 2016 Second Biennial Report
agencies, DFIs, ECAs, and multilateral entities) and instruments (concessional and non-concessional, including grants, loans, equity, and de-risking instruments), where such finance is identified as climate relevant using criteria agreed upon by relevant international organizations, such as OECD, IPCC, and MDBs . We intend to report transparently on different categories of public climate finance .
• Private finance for climate-relevant activities that has been mobilized by public finance or by a public policy intervention, including technical assistance to enable policy and regula-tory reform .
While developing our methodology, we have been guided by the following principles: (1) en-sure that only finance mobilized by developed country governments is counted toward the $100 billion goal and that, where multiple actors are involved, the resulting finance is only counted once in tracking our progress; and (2) ensure that our reporting framework encour-ages and incentivizes the most effective use of climate finance .
To account for mobilized private climate finance, we intend to assess the amount of private finance mobilized on an activity-by-activity basis and to report on private finance associated with activities both where there is a clear causal link between a public intervention and pri-vate finance and where the activity would not have moved forward, or moved forward at scale, in the absence of our governments’ intervention . In recognition of the role that develop-ing countries play in mobilizing private finance, our governments will report only on our share of private finance mobilized, excluding the share of private finance that developing countries’ public finance has mobilized .
It is important to note that current data and methodological limitations prevent us from ac-counting for the full range of flows that we are mobilizing toward the $100 billion goal at this time—in particular, those mobilized through public policy interventions and improvements in institutional capacity and other aspects of the enabling environment . As such, any near-term estimate produced will necessarily be partial, and will omit some—and possibly a substantial amount of—climate finance mobilized . We intend to continue to improve our methodology as data availability increases and measurement methods evolve . As a result, we expect our re-porting to become more complete over time .
TECHNOLOGY DEVELOPMENT AND TRANSFER
Since 2012, the United States has engaged in a number of activities to enhance the develop-ment, deployment, and diffusion of climate technologies and practices to developing coun-tries and economies in transition . Table 7 provides an illustrative—though not exhaustive—list of efforts undertaken by the United States over the past several years to build endogenous capacities and technologies at the national level in developing countries . At all levels of activ-ity, the principal U .S . focus is to facilitate the development of the policies, regulations, and overall institutional scaffolding that is required to enhance technology transfer actions .
Through this perspective, the United States led the effort to create the Task Force on National Systems of Innovation (NSI) under the policy arm of the Technology Mechanism of the UNFCCC—the Technology Executive Committee (TEC) . The United States has played an ac-tive role on the TEC since the First Biennial Report and is pleased to have seen the delivery of a TEC Brief on NSI in advance of COP-21 in Paris describing the conditions necessary for
49
cultivating NSIs that will attract investment, grow local economies, and develop endogenous capabilities by educating the next generation of climate technology entrepreneurs .
One of the greatest advances in the climate technology domain over the past few years has been the launch of the operational arm of the technology mechanism under the UNFCCC—the Climate Technology Centre and Network (CTCN) . The United States has played a leader-ship role in the CTCN from its inception, with DOE’s National Renewable Energy Laboratory serving as one of 11 regional core Consortium Partners from around the world . The CTCN has allowed the global community access to the advanced knowledge and policy planning exper-tise necessary to advance clean-energy and climate-resilient technologies at the national lev-el . In 2015, the United States named its National Designated Entity (NDE) to serve as a focal point both for requests going to the CTCN as well as a proactive resource of information dis-semination . The United States is also among the leading financial contributors to the CTCN, having delivered more than $2 million in core funding over its first two years of operations .
CHANGES IN POLICIES AND ACTIVITIES SINCE THE FIRST BIENNIAL REPORT
In addition to the information contained herein and in Table 7, we encourage readers to re-view U .S . contributions to the Trade-Related Aspects of Intellectual Property Rights (TRIPS) agreement, specifically its reporting requirements under Article 66 .2 (which is similar to the UNFCCC Biennial Report obligation with some notable differences, including that Article 66 .2 only applies to LDCs and covers all technologies) . The United States also submits a parallel report under Article 67 of the TRIPS agreement regarding capacity-building programs, which provides a chronological list of programs conducted by the United States in 2014 .
CHALLENGES IN DELIVERING TECHNOLOGY TRANSFER AND DEVELOPMENT
While the initiatives listed in Table 7 provide insight into some of the success stories related to our engagement in technology transfer and development, challenges remain . Briefly ad-dressing a few of them here will facilitate efforts to overcome these challenges, while also informing the efforts of others to find ways to avoid them altogether .
One challenge has been the relatively low number of requests being made to the CTCN from developing country NDEs . The vision of the CTCN was that the GEF- and United Nations Environment Programme-supported Technology Needs Assessments would provide develop-ing countries with the foundation from which such requests for technical assistance could be made . Partly in response to our urging, the CTCN Secretariat has increased its outreach to developing country NDEs to help stimulate requests .
Another challenge has been the ability of some developing countries to attract the finance necessary to successfully transfer, develop, and deploy climate technologies . To address this challenge, we have formalized a partnership between the Clean Energy Solutions Center (CESC) and the CTCN, and have launched a new service under the CESC to assist countries in designing clean energy finance measures that will help mobilize investment in priority technologies .
Energy Activities at the National, Regional, and Global LevelsThis section outlines technology transfer and development activities that relate specifically to mitigation at the national, regional, and global levels . These examples are illustrative in na-ture . Several others are contained in Table 7 .
5 Supporting the Global Community: International Climate Finance and Other Activities

50 2016 Second Biennial Report
Table 7 Examples of Implemented U.S. Technology Development and Transfer Activities
Recipient Country and/or Region
Targeted Area/ Sector
Measures and Activities Related to Technology Transfer
Sources of Funding and
Implementation
Clean Energy Ministerial
Members: Australia, Brazil, Canada, China, Denmark, European Commission, Finland, France, Germany, India, Indonesia, Italy, Japan, Korea, Mexico, Norway, Russia, Saudi Arabia, South Africa, Spain, Sweden, United Arab Emirates, United Kingdom, and United States
Mitigation/ Energy
This high-level global forum promotes policies and programs that advance clean energy technology, share lessons learned and best practices, and encourage the transition to a global clean energy economy . Initiatives (such as Global LEAP, 21st Century Power Partnership, SEAD, and ISGAN, described below) are based on areas of common interest among participating governments and other stakeholders .
Public
Global Lighting and Energy Access Partnership
Africa, India, and South Asia
Mitigation/ Energy
Global LEAP (1) enhances the efficiency of the direct current (DC)-powered appliances designed for use in an off-grid context (e .g ., using home-based electricity systems, often powered by a solar panel on the roof, or community-level DC power via minigrids); (2) catalyzes markets through support for quality assurance frameworks, which build consumer and investor confidence; (3) encourages market transformation toward the best, most efficient off-grid energy service technologies through its awards programs; and (4) facilitates collaboration among donors in the off-grid lighting and energy access space .
Public
21st Century Power Partnership
India, Mexico, and South Africa
Mitigation/ Energy
A global partnership that (1) provides in-depth technical assistance to support transformation of power systems and enable increased penetration of renewable energy, energy efficiency, storage, and smart grid technologies; and (2) conducts thought leadership reports and web seminars on innovations in clean power system transformation to enable global education and support for strategies for increased use of clean energy technologies .
Public
Super-efficient Equipment and Appliance Deployment (SEAD)
India, Mexico, South Africa, and Indonesia
Mitigation/ Energy
This global partnership (1) provides direct technical assistance to support the development of best-practice appliance energy efficiency policies and programs, and (2) supports voluntary collaboration among governments working to promote the manufacture, purchase, and use of energy-efficient appliances, lighting, and equipment worldwide .
Public
International Smart Grid Action Network (ISGAN)
Official participating countries: Australia, Austria, Belgium, Canada, France, Germany, India, Italy, Korea, Mexico, the Netherlands, Sweden, Switzerland, and United States
Mitigation/ Energy
ISGAN (1) facilitates dynamic knowledge sharing, technical assistance, and project coordination on innovative policies, regulations, and projects and related best practices; (2) develops testing standards for smart grid components; (3) facilitates coordination of testing efforts across a consortium of international laboratories; (4) authors reports and other resources on emerging smart grid concepts, with a focus on reaching policymakers, regulators, and technology developers and implementers; (5) develops tools for assessing the costs and benefits of implementing smart grid projects; and (6) convenes a network of country representatives, regulators, policymakers, and energy service and technology providers to exchange best practices and lessons learned .
Public

51
Recipient Country and/or Region
Targeted Area/ Sector
Measures and Activities Related to Technology Transfer
Sources of Funding and
Implementation
Readiness for Investment in Sustainable Energy Index
Initially piloted in 17 countries (including Armenia, Chile, Ethiopia, Honduras, India, Kenya, Liberia, Maldives, Mali, Mongolia, Nepal, Solomon Islands, and Tanzania), with plans to extend to global coverage in future years
Mitigation/ Energy
The index (1) provides information on country performance in terms of the market conditions, policies, institutions, laws, and regulations that contribute to an enabling environment for private investment; (2) builds on existing measures, such as the World Bank’s “Doing Business Index,” while identifying sector-specific barriers and incentives; and (3) guides donors and developing country governments toward concrete measures for improving the enabling environment for private-sector investments in clean technologies .
Public
Power Africa
sub-Saharan Africa Mitigation/ Energy
This initiative (1) provides early-stage transaction support, financing support, assistance with regulatory and policy design and reform, capacity building, legal assistance, and other informational resources to facilitate the deployment of clean energy technologies throughout sub-Saharan Africa; and (2) aims to double access to power in sub-Saharan Africa through advancing the transfer of assets from the public to the private sector .
Public and private
funding; public
implementation
Climate Services For Resilient Development
Subregions of Latin America (the Andean region and Caribbean), Africa (East Africa and the Sahel), and Asia (South Asia and Southeast Asia), starting with Colombia, Ethiopia, and Bangladesh
Adaptation/ Cross-cutting
This program (1) enables developing countries to access and use climate information to enhance decision making; (2) provides needed climate services—including actionable science, data, information, tools, and training—to developing countries that are working to strengthen their national resilience to the impacts of climate change; (3) comprises an international group of founding partner institutions (e .g ., American Red Cross, Asian Development Bank, Esri, Google, Inter-American Development Bank, Skoll Global Threats Fund, and United Kingdom) to pool resources and leverage one another’s efforts; and (4) works with Peace Corps to provide support for on-the-ground implementation of climate-resilience activities .
Public and private
U.S. Forest Service-International Union of Forest Research Organizations Partnership
Africa, Asia, and Latin America
Adaptation and
Sustainable Landscapes/
Forestry
This partnership (1) strengthens national forest research systems and enhances the development and implementation of sound forest management policies and practices through the generation and dissemination of quality-research results on forests and trees in Africa, Asia, and Latin America, particularly through capacity development, assistance to scientists, and institution building; (2) mobilizes and disseminates forest-related information; (3) implements capacity-building activities through the International Union of Forest Research Organizations’ Special Program for Development of Capacities; and (4) assists forest research institutions to effectively contribute to shaping national and local forest policies and sustainable forest management systems .
Public
Global Forest Information Service
Global Adaptation and
Sustainable Landscapes/
Forestry
This service (1) provides a framework and information services to scientists and policymakers to enable sharing of forest-related data and information through a single gateway; and (2) promotes the dissemination and sharing of forest information and knowledge by developing a common information platform, building capacity, and enhancing partnerships among forestry information providers and users .
Public
Table 7 Examples of Implemented U.S. Technology Development and Transfer Activities, continued
5 Supporting the Global Community: International Climate Finance and Other Activities

52 2016 Second Biennial Report
Regional and Global Energy Activities
Clean Energy Solutions CenterCESC has provided technical support to strengthen more than 175 policies and programs in more than 80 countries that are enabling clean energy technology development and deploy-ment, while also conducting clean energy webinars and other training activities with more than 10,000 participants from countries around the world . CESC is in the process of launch-ing a new service to assist countries with designing clean energy finance measures that will help mobilize investment in priority technologies .
Scaling-Up Renewable Energy for Low Income CountriesThis program focuses on deploying renewable energy to increase energy access in several developing countries, including LDC pilot countries Bangladesh, Benin, Cambodia, Haiti, Lesotho, Madagascar, Malawi, Mali, Nepal, Rwanda, Sierra Leone, the Solomon Islands, Tanzania, Uganda, Vanuatu, Yemen, and Zambia .8
South Asia Regional Initiative for Energy IntegrationThis USAID initiative focuses on creating an enabling environment to advance cross-border electricity trade (CBET) in South Asia through the advancement of interconnections among transmission systems, the development of the regional energy market through the three task forces with representation from different South Asian countries, and the harmonization of policy and legal and regulatory mechanisms among governments . The program facilitates exchanges among the South Asian countries to learn from the successful CBET in the region and provide a platform to discuss potential energy trade agreements . Exchanges explore the harmonization of economic and regulatory aspects for electricity at national and regional levels .9
National-Level Energy Activities
BurundiThe U .S . Trade Development Agency (USTDA) is supporting increased trade and investment with a $597,000 grant to a Burundian energy company to fund a feasibility study that will support the development of a 7 .5-MW solar photovoltaic power plant . Implementation of the project will increase Burundi’s national power supply by 15 percent and help to power an esti-mated 60,000 households and businesses, thereby increasing access to energy and promot-ing an enabling environment to support growth of the country’s private sector .
HaitiUSTDA supports activities to increase the reliability of electricity generation in Haiti . To in-crease the provision of electricity in Haitian towns where little or no grid electricity is sup-plied, USTDA is providing a grant of $484,999 toward a feasibility study to assess and rank the viability of pre-paid microgrid development in about 100 Haitian towns . The study is iden-tifying the most promising towns for microgrid replication, covering aspects related to eco-nomic fundamentals, physical infrastructure, municipal government receptivity, and potential partners .
IndiaIn 2009, President Obama and Indian Prime Minister Singh launched the U .S .-India Partnership to Advance Clean Energy (PACE) to accelerate inclusive, low-carbon growth by supporting research and deployment of clean energy technologies . In their September 2014
8 See http://www .climateinvestmentfunds .org/cif/node/67 . 9 See http://www .sari-energy .org .
53
meeting, President Obama and Prime Minister Modi agreed to strengthen and expand the highly successful partnership through a series of priority initiatives . PACE is comprised of three action-oriented tracks:
• Research (PACE-R): Under PACE-R’s $125 million Joint Clean Energy Research and Development Center, three consortia are now in their second year of cutting-edge research on solar energy, building energy efficiency, and advanced biofuels . In 2015, the United States and India agreed to add a new track on smart grids and energy storage .
• Deployment (PACE-D): Under PACE-D, seven U .S . government agencies (USAID, DOE, DOS, Department of Commerce, USTDA, EXIM, and OPIC) are working on a broad range of clean energy deployment activities . By September 2015, the PACE-D track had mobilized $254 billion in public and private clean energy finance to support India’s clean energy goals, including support for 20 percent of India’s first 1,000 MW of installed solar energy capacity .
• Access (PEACE): In September 2013, the two countries added a new track to PACE—Promoting Energy Access through Clean Energy (PEACE)—which aims to harness com-mercial enterprise to bring clean energy access to unserved and underserved Indian villages . Notable PEACE activities include (1) a joint $7 .9 million “PACEsetter fund” to pro-vide early-stage grants to innovative off-grid clean energy projects, (2) a public–private partnership that seeks to mobilize $41 million to scale up and sustain off-grid clean energy businesses, and (3) the Clean Energy Access Network, a nationwide alliance of off-grid entrepreneurs .
Adaptation and Sustainable Landscapes at the National, Regional, and Global LevelsThis section outlines technology transfer and development activities that relate specifically to adaptation and sustainable landscapes at the national, regional and global levels . These ex-amples are illustrative in nature . Several others are contained in Table 7 .
Regional- and Global-Level Adaptation and Sustainable Landscapes Activities
SERVIRThe United States continues to support the SERVIR program, which provides developing countries access to satellite information and geospatial technologies to help them manage risks associated with climate and land-use change . USAID and the National Aeronautics and Space Administration provide technology, data, capacity building, scientific models, and data analysis methods to leading regional organizations in 4 regions serving 37 countries . SERVIR helps meet the needs of local decision makers facing challenges related to food security, wa-ter resources, disasters, weather and climate, and land use . More than 2,000 people have been trained through the program to predict, monitor, and assess risks, and more than 322 institutions have been engaged in these activities . A few examples of results from this effort include:
• A flood early-warning system originally developed in Bangladesh was shared with the Government of Pakistan to help the country manage future floods .
• A team of international scientists developed a tool that integrated satellite rainfall data into a hydrologic model that could be used to predict floods in East Africa .
• Nine countries in sub-Saharan Africa have worked with SERVIR in eastern and southern Africa to develop 30-meter-resolution land cover maps for 2000 and 2010 to enable the regions to produce GHG inventories from land-use change .
5 Supporting the Global Community: International Climate Finance and Other Activities

54 2016 Second Biennial Report
U.S. Water Partnership The U .S . Water Partnership (USWP) has created momentum that helps ensure self-sustain-ability in water governance and management . USWP is a DOS-led initiative to mobilize U .S . expertise, knowledge, and resources to address global water security challenges, many of which are related to climate change . USWP’s 107 members from the private sector, civil soci-ety, government, and academia provide benefits to developing world stakeholders through both long-term initiatives and shorter programs . For 2014 World Water Day, USWP held an event called “U .S . Tech H2 .0,” which highlighted innovative water technologies . Further, the USWP’s H2infO portal empowers those working on water in developing countries to access more than 4,000 resources, including connections with experts and stakeholders and guid-ance in thematic areas .10 To date, H2infO has reached more than 4,800 users in 145 coun-tries . USWP’s Water Consultants cover the costs of bringing experts on a particular topic in a developing country to help locals solve problems .
Disaster Assistance Support Program (DASP)USFS created DASP to provide technical support in disaster response management, plan-ning, operations, preparedness, and prevention . USAID coordinates responses to dozens of foreign disasters each year along with the Bureau of Land Management, which has exten-sive emergency response capability and experience in wildland firefighting . These unique capabilities and resources are applicable in a multitude of disaster situations . Over the past two decades, the role of DASP has expanded to include emergency support functions, such as training, developing, and improving USAID’s methodologies for disaster response, and coordinating USAID and foreign disaster preparedness . In addition, the program provides technical and training expertise to U .S . domestic and overseas partners in emergency pre-paredness, response, and disaster mitigation .
SilvaCarbonSilvaCarbon is a technical cooperation program that draws on the strengths of various techni-cal agencies in the U .S . government, nongovernmental organizations, academia, and industry . SilvaCarbon and its partners work with developing countries to build capacity for monitoring and managing forest and terrestrial carbon . SilvaCarbon helps to identify, test, and dissemi-nate good practices and cost-effective, accurate technologies .
National-Level Adaptation and Sustainable Landscapes Activities
JamaicaThe United States has supported Jamaica in developing a drought forecast tool aimed at pro-viding farmers with information to help inform agriculture and water resource planning . The tool was developed by the Jamaican Meteorological Service and the Rural and Agricultural Development Agency of Jamaica with support from the United States and technical support from Columbia University’s International Research Institute for Climate and Society . The tool provided actionable information on the droughts of 2014 and 2015 .
10 See http://h2info .us .
55
CAPACITY BUILDING
Since a long-term view of climate change and development is crucial to sustainability and re-sults, the United States is approaching the issue of capacity building for climate change in an integrated manner . Linking capacity building directly to projects and programs helps ensure that capacity built is relevant, effective, and tied to results . Building local capacity through greater reliance on local cooperating agencies is an explicit goal of USAID . In 2014, USAID missions awarded 16 .9 percent of their funding, or $1 .4 billion, to local institutions .
Capacity-building needs are addressed throughout all U .S . support activities, not as separate line items or projects, and are provided as a means for taking action on a mutually shared goal . Table 8 highlights examples of U .S . capacity-building support . Please note that this table is purely illustrative and does not represent an exhaustive list of U .S . capacity- building activities .
5 Supporting the Global Community: International Climate Finance and Other Activities
Table 8 Examples of U.S. Capacity-Building Activities Currently Being Implemented
Recipient Country/Region Targeted Area Program/Project Description
Public–Private Partnership: Climate Services for Resilient Development
Global Adaptation USAID launched this new public–private partnership to strengthen the resilience of countries contending with climate change . Working with partners that include the United Kingdom, the American Red Cross, and Google, USAID aims to increase the capacity of partner countries by making existing climate data, scientific information, tools, and services more accessible to decision makers and vulnerable individuals around the world .
High Mountain Adaptation Partnership
Peru, the Himalaya Hindu-Kush region of South Asia, and the Pamir Mountain region of Central Asia
Adaptation With support from USAID and DOS, this partnership facilitates South–South learning to understand and manage climate-related challenges in high-mountain communities . The program has pioneered rapid assessment techniques for studying the risks of glacier lakes and has supported community-led consultation and planning to address these risks in a timely and effective fashion .
SERVIR
Africa, Himalaya, and Mekong regions
Adaptation This joint venture between NASA, USAID, and leading regional technical institutes provides state-of-the-art, satellite-based Earth monitoring, imaging and mapping data, geospatial information, predictive models, and science applications to help improve capacity for environmental decision making among developing nations in eastern and southern Africa, the Hindu-Kush region of the Himalayas, and the lower Mekong River Basin in Southeast Asia .
GIZ Climate Finance Readiness
Global Adaptation This comprehensive climate finance-readiness support program prioritizes the role of domestic budgets and private investment in climate financing and the facilitation of access to international funds, such as the Green Climate Fund . The goals of the USAID-GIZ partnership include (1) building the capacity of countries to develop ambitious and effective strategies for large-scale mitigation and adaptation linked to enhanced public- and private-sector financing, (2) removing barriers to increased private-sector involvement, (3) increasing the capacity of institutions to access and use climate finance, and (4) increasing the capacity of mission staff to understand and address climate finance issues .
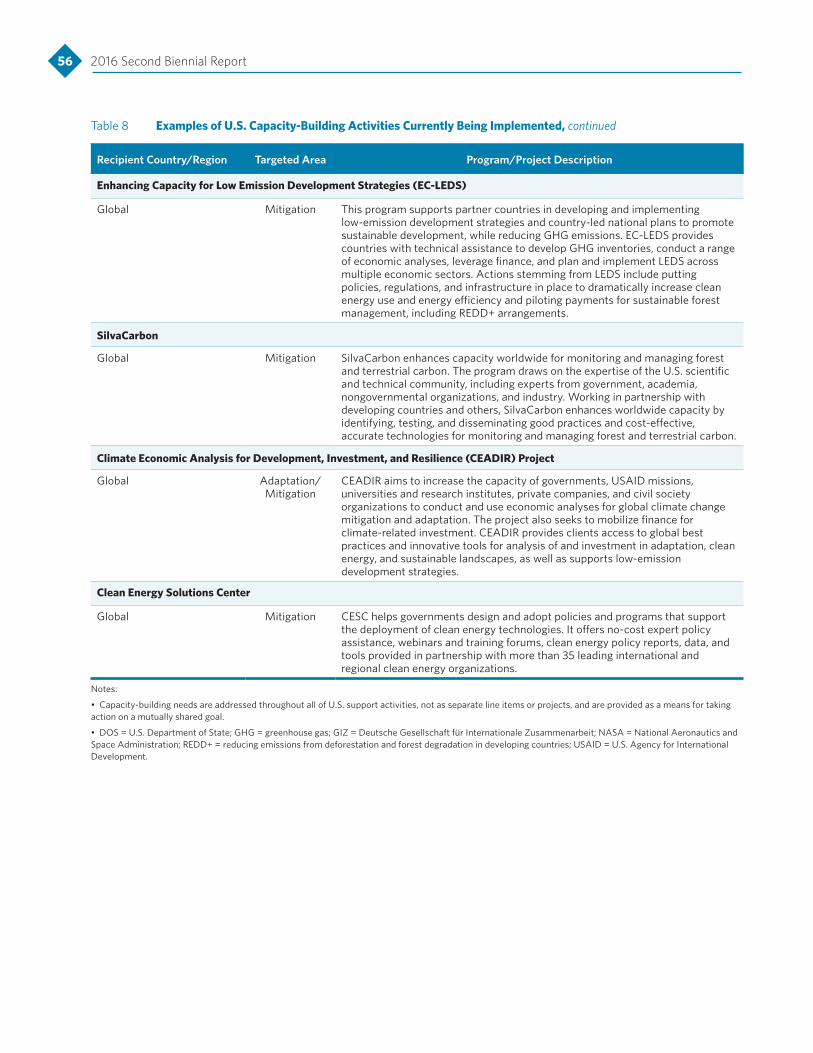
56 2016 Second Biennial Report
Table 8 Examples of U.S. Capacity-Building Activities Currently Being Implemented, continued
Recipient Country/Region Targeted Area Program/Project Description
Enhancing Capacity for Low Emission Development Strategies (EC-LEDS)
Global Mitigation This program supports partner countries in developing and implementing low-emission development strategies and country-led national plans to promote sustainable development, while reducing GHG emissions . EC-LEDS provides countries with technical assistance to develop GHG inventories, conduct a range of economic analyses, leverage finance, and plan and implement LEDS across multiple economic sectors . Actions stemming from LEDS include putting policies, regulations, and infrastructure in place to dramatically increase clean energy use and energy efficiency and piloting payments for sustainable forest management, including REDD+ arrangements .
SilvaCarbon
Global Mitigation SilvaCarbon enhances capacity worldwide for monitoring and managing forest and terrestrial carbon . The program draws on the expertise of the U .S . scientific and technical community, including experts from government, academia, nongovernmental organizations, and industry . Working in partnership with developing countries and others, SilvaCarbon enhances worldwide capacity by identifying, testing, and disseminating good practices and cost-effective, accurate technologies for monitoring and managing forest and terrestrial carbon .
Climate Economic Analysis for Development, Investment, and Resilience (CEADIR) Project
Global Adaptation/ Mitigation
CEADIR aims to increase the capacity of governments, USAID missions, universities and research institutes, private companies, and civil society organizations to conduct and use economic analyses for global climate change mitigation and adaptation . The project also seeks to mobilize finance for climate-related investment . CEADIR provides clients access to global best practices and innovative tools for analysis of and investment in adaptation, clean energy, and sustainable landscapes, as well as supports low-emission development strategies .
Clean Energy Solutions Center
Global Mitigation CESC helps governments design and adopt policies and programs that support the deployment of clean energy technologies . It offers no-cost expert policy assistance, webinars and training forums, clean energy policy reports, data, and tools provided in partnership with more than 35 leading international and regional clean energy organizations .
Notes:
• Capacity-building needs are addressed throughout all of U .S . support activities, not as separate line items or projects, and are provided as a means for taking action on a mutually shared goal .
• DOS = U .S . Department of State; GHG = greenhouse gas; GIZ = Deutsche Gesellschaft für Internationale Zusammenarbeit; NASA = National Aeronautics and Space Administration; REDD+ = reducing emissions from deforestation and forest degradation in developing countries; USAID = U .S . Agency for International Development .
Conclusion
“Climate change is not a problem for another generation. Not anymore.”—President Obama
Climate change is no longer a distant threat, but a global challenge that must be addressed today . The United States is firmly committed to taking action and working collaboratively with our global partners to minimize the risks posed by climate change . This report has detailed the comprehensive policies the United States is undertaking to drive emissions down, even as our economy is growing strongly . Those policies are keeping us on track to reach our 2020 emission reduction target and are preparing the foundation for realizing our ambitious, but achievable, 2025 emission reduction goal .
In partnership with states, local communities, and the private sector, the Obama Administration is taking major actions to address CO2, HFC, CH4, and N2O emissions both within the federal government and across the transportation, power, energy end-use, industrial, agricultural, land-use and forestry, and waste sectors . Actions include implementing the Clean Power Plan, increasing renewable energy generation, cutting energy waste by extending appliance and equipment efficiency standards, strengthening vehicle fuel economy regulations, and improving the efficiency of residential and commercial buildings . Together, these policies are driving downward trends in U .S . GHG emissions and are creating cleaner, healthier air, while still allow-ing for economic growth and job creation .
Still, more work remains to be done . Climate change is not a challenge that the United States can conquer alone . While focusing domestically on managing and reducing GHG emissions nationwide, the United States is also dedicated to leading internationally and engaging with global partners to develop a robust international approach to climate change . We have worked with partners to build a shared vision for a successful global response to climate change, and we stand ready to continue and enhance partnerships to reduce emissions, im-prove resilience, drive improvements in technology, and improve air quality . Moving forward, the United States will continue to empower the global community through financial support, technology development and transfer, and capacity building .
Climate change is an urgent challenge that we all share . Understanding that an immediate response is essential, the United States is taking action today to deliver on our climate goals, to promote the health and safety of people around the globe, and to support our global partners .

Appendix 1: Methodologies Used in the Reporting of Financial Information
In this 2016 Biennial Report, we outline how U .S . action on climate change puts our nation on a path to achieve its commitments in Copenhagen, Cancún, and Durban until 2020 . We have included additional reporting information, as specified in decisions 1/CP .16, 2/CP .17 (Annex I), and 19/CP .18 adopted by the Parties to the UNFCCC .
The UNFCCC reporting guidelines for biennial reports also specify that Parties are to provide the underlying methodology for all financial assistance provided (UNFCCC 2013a) . Specifically, the guidelines state: “Parties shall report in a rigorous, robust and transparent manner the underlying assumptions and methodologies used to produce information on finance .”
The United States conducted an interagency process to compile methodology documents for all figures for financial assistance, particularly those figures listed in supplemental tables 7, 7(a), and 7(b) .
Pursuant to paragraph 15 of the 2011 UNFCCC biennial reporting guidelines for developed country Parties, this appendix provides background information on the underlying assump-tions and methodologies used to produce information on finance . Specifically, this appendix describes:
• The overall methodology used for producing information on finance,
• The methodology for determining which funds are “climate-specific,”
• The methodology used to specify funds as “committed,”
• The methodology used for reporting core/general contributions through multilateral channels, and
• Other methodological issues .
OVERALL METHODOLOGY FOR PRODUCING INFORMATION ON CLIMATE FINANCE
This report covers U .S . international climate finance for FY 2013 (October 1, 2012, through September 30, 2013) and FY 2014 (October 1, 2013, through September 30, 2014) . U .S . inter-national climate finance is provided through the following channels:
• Congressionally appropriated finance, which is delivered through both bilateral and multi-lateral channels, and includes foreign assistance funding for international development through USAID, the Departments of State and Treasury, and MCC;
Appendices
59
• Development finance through OPIC; and
• Export credit finance through EXIM .
To ensure accurate and comprehensive reporting, interagency data requests were issued government-wide in 2013 and 2014 to request information on climate-related international programs or activities supported with FY 2013 and FY 2014 resources . In addition, DOS and USAID issued internal data calls in FY 2013 and FY 2014 for climate-related finance as part of their annual Operational Plan process .
METHODOLOGY FOR DETERMINING WHICH FUNDS ARE “CLIMATE-SPECIFIC”
Climate-specific funds are those assessed to support climate adaptation or mitigation . This includes activities that were conceived and funded specifically to achieve climate-related ob-jectives, as well as activities that provide climate co-benefits . In cases where only a portion of a program’s budget supports climate benefits, only that relevant fraction was counted—not the entire program budget .
U .S . international climate finance is categorized under the three thematic pillars of the President’s Global Climate Change Initiative (EOP 2009): adaptation, clean energy, and sus-tainable landscapes .
AdaptationAdaptation programming seeks to reduce the vulnerability of people, places, and livelihoods to negative impacts of climate change by integrating effective adaptive strategies into key devel-opment sectors, including agriculture and food security, infrastructure, health, water, disaster preparedness, and conflict prevention . Types of activities include, but are not limited to:
• Developing tools for information dissemination or building new capacity among hydrome-teorological information providers to deliver climate information and services .
• Providing support for modeling, mapping, and research to better understand climate im-pacts in specific regions or sectors .
• Strengthening government and local community response and communications capacity for climate change-related disasters, such as floods .
• Building capacity among decision makers to use hydrometeorological data to inform climate-resilient planning .
• Increasing water storage and water use efficiency to deal with increased variability in water supply .
• Distributing drought-resistant seeds or promoting management practices that increase the ability of farmers to cope with reduced rainfall .
• Introducing and enforcing flood management plans and zoning and building codes, or coastal zone management activities, to reduce vulnerability to rising sea levels and storm surges .
• Reducing risk through such activities as implementing flood and famine early-warning sys-tems, negotiating transboundary water issues, and meeting critical infrastructure needs .
Appendix 1: Methodologies Used in the Reporting of Financial Information
60 2016 Second Biennial Report
Clean EnergyClean energy programming seeks to enable countries to accelerate their transition to climate resilience, lower GHG emissions, and sustainable economic development through assistance for clean, low-emission energy systems in the energy, industry, transportation, and buildings sectors . Types of activities include, but are not limited to:
• Promoting and deploying clean energy, including renewable energy technologies, energy-efficient end-use technologies, and carbon accounting .
• Supporting clean energy technologies, such as development of agricultural biodigesters, improved cookstoves, solar water heaters, and electricity generation from landfill methane .
• Strengthening GHG inventory and accounting systems .
• Supporting an improved enabling environment (law, regulations, policies) for integrating renewable energy into national grids, enhancing cost recovery in the energy sector, and improving the financial and regulatory capacities of energy utilities .
• Supporting efforts to reduce gas flaring through the creation of domestic markets and pro-ductive uses for the gas .
• Supporting the substitution of natural gas for gasoline and diesel fuels for vehicular trans-portation, or for efficient transportation or comprehensive transportation planning, analy-sis, and strategy .
• Promoting supply-side energy efficiency by retrofitting existing, high-GHG-emitting fossil fuel power plants with more efficient turbines or by installing more energy-efficient trans-formers in a power distribution grid with a large fossil generation component .
• Reducing technical losses in an energy distribution system or upgrading transmission and operating systems that carry clean energy, in whole or in part (if in part, only that share should be attributed) .
Sustainable LandscapesSustainable landscapes programming seeks to slow, halt, and reverse GHG emissions from land
use. Types of activities include, but are not limited to:
• Programs that build a country’s capacity to estimate, report, and monitor GHGs from for-est and land use at the national or subnational level .
• Support for creating or strengthening national forest and forest carbon inventory and moni-toring systems .
• Assistance with implementing land-use strategies that affect forests, for example, by ad-dressing the most influential drivers of deforestation and forest degradation or by restoring degraded lands through enhanced tree cover .
• Forest conservation projects that lead to reduced-impact logging and reduced deforestation .
• Forest conservation projects that improve governance in indigenous reserves and protect-ed areas that are under threat of deforestation .
• Programs that improve land tenure systems to create incentives for communities to man-age and restore forested areas, and result in increased carbon sequestration in tree biomass .
61
• Programs that improve land-use planning for agriculture, resulting in reducing the conver-sion of high-carbon natural habitats .
• Programs that develop economic incentives or alternative livelihoods to reduce the conver-sion of ecosystems in order to protect biodiversity, watersheds, or other ecosystem ser-vices that also will result in reduced GHG emissions .
METHODOLOGY USED TO SPECIFY FUNDS AS “COMMITTED”
The CTF for UNFCCC biennial reporting includes three options for the status of financial support: “provided,” “committed,” and “pledged .” All public financial support reported in this document is considered to be at least “committed .” Details regarding the meaning of “commit-ted” across each of the channels of international climate finance follow:
• For congressionally appropriated finance, funds reported as committed are those that have been appropriated by Congress and allocated by the funding agency for a specific fund, country, project, or program .
• For development finance, funds reported as committed are those for which a commitment letter is signed and executed by all parties .
• For export credit, funds reported as committed are those authorized by EXIM for that par-ticular purpose .
METHODOLOGY USED FOR REPORTING CORE/GENERAL CONTRIBUTIONS THROUGH MULTILATERAL CHANNELS
For core /general contributions through multilateral channels that do not include a climate-specific component, data reflect total U .S . contributions to covered institutions . While a portion of these funds is used by the recipient institutions to finance climate change activities in developing countries, the United States does not include these nonclimate-specific contributions .
OTHER METHODOLOGICAL ISSUES
Tables 7, 7(a), and 7(b) include four categories for “type of support”: Mitigation, Adaptation, Cross-cutting, and Other . With the exception of some multilateral funds that are listed as Cross-cutting, U .S . data are presented as follows:
• All U .S . “clean energy” funds, projects, programs, and activities are listed as Mitigation .
• All U .S . “sustainable landscapes” funds, projects, programs, and activities are listed as Mitigation .
• All U .S . “adaptation” funds, projects, programs, and activities are listed as Adaptation .
Tables 7(a) and 7(b) also include several options for “sector”: Energy, Transport, Industry, Agriculture, Forestry, Water and Sanitation, Cross-cutting, and Not Applicable . To ensure consistency across the data set, information on sectors is tied directly to the three thematic pillars noted earlier . Specifically, U .S . data are presented as follows:
• All U .S . “clean energy” funds are listed as Energy .
• All U .S . “sustainable landscapes” funds are listed as Forestry and Agriculture .
• All U .S . “adaptation” funds are listed as Cross-cutting .
Appendix 1: Methodologies Used in the Reporting of Financial Information
62 2016 Second Biennial Report
Appendix 2: Methodologies for Current Measures and Additional Measures Consistent with the Climate Action PlanThis report assesses the potential range of GHG reductions that are achievable in 2020 and 2025 based on estimates of the abatement potential from a range of possible additional measures .
The analysis conducted for this report sheds light on the potential scale of additional reduc-tions through 2025 by assessing the broad categories of actions contained in The President’s Climate Action Plan (EOP 2013) . Although many of the specific measures that scale up and expand existing efforts are already underway, several of the plan’s actions will require U .S . government agencies to develop recommendations, propose new rules, augment existing ac-tivities, and undertake processes that entail significant stakeholder outreach and public com-ment before final rules and programs are in place .
Starting with projections of U .S . emissions based on policies as of 2015, estimates of the ad-ditional reductions achievable by 2025 are for three categories of actions depending on the affected pollutant: CO2, HFCs, CH4, or N2O . All projected emissions and potential reductions are expressed using 100-year IPCC Fourth Assessment Report GWPs (IPCC 2007) . Detailed methodologies for each category follow .
ENERGY CARBON DIOXIDE
The 2016 Current Measures scenario was constructed using EPSA-NEMS,11 an integrated energy system model . In addition, two policy scenarios were constructed using a combination of EPSA-NEMS and estimates of reductions in GHG emissions from policies and measures that cannot be modeled using EPSA-NEMS, to explore the potential energy-related CO2 emission impacts of extending and expanding existing policies and programs . The Current Measures scenario input assumptions were based on the final release of the 2015 Annual Energy Outlook (AEO2015) (DOE/EIA 2015a), which was updated to include the Clean Power Plan .
States will ultimately determine precisely how to comply with the rule, but the Current Measures scenario achieves the broad emission reductions required by the rule, consistent with EPA analysis . The modeled scenario assumes that states choose the mass-based state goal approach with new source complement,12 and make early investments rewarded under the Clean Energy Incentive Program .13 In all scenarios, projected CO2 emissions were adjusted to match international inventory convention .14
The Additional Measures scenario includes a low and high policy implementation range, which we here describe as “Scenario 1” (lower abatement) and “Scenario 2” (higher abatement) . Scenario 1 includes the Current Measures assumptions, along with additional standards and regu-lations that are not included in AEO2015 but either are proposed or are likely to continue . Scenario 1 assumes that federal energy appliance and equipment efficiency standards and build-ing codes are updated periodically, and that incentives for distributed solar and combined heat and power are extended . Scenario 1 also updates the Renewable Fuel Standard requirements to reflect the proposed fuel volumes as of August 2015, and assumes implementation of proposed medium- and heavy-duty engine and vehicle fuel economy standards .15
11 The version of the National Energy Modeling System (NEMS) used in this report has been run by OnLocation, Inc ., with input assumptions determined by DOE’s Office of Energy Policy and Systems Analysis (EPSA) . Since this analysis was commissioned by EPSA and uses a version of NEMS that differs from the one used by the U .S . Energy Information Administration (EIA), the model is referred to throughout the document as EPSA-NEMS . The results described in this report do not necessarily represent the views of EIA . 12 The modeling includes the new source complement, a variation of the mass-based goal that provides mass-based CO2 limits for all existing and new fossil generation units . 13 We assume 80 percent adoption of the Clean Energy Incentive Program . States can use this voluntary allowance or credit-“matching” program to incentivize early investment in eligible renewable energy, as well as demand-side energy efficiency projects that are implemented in low-income communities . Eligible projects can generate additional emission allowances or emission rate credits in 2020 and/or 2021 . 14 EPSA-NEMS estimates for CO2 from fossil fuel combustion were adjusted for the purpose of these projections to remove emissions from bunker fuels and non-energy use of fossil fuels, and to add estimated CO2 emissions in the U .S . territories consistent with international inventory convention . 15 We assumed implementation of Alternative 3 of the proposed rule in Scenario 1 and implementation of Alternative 4 in Scenario 2 .

63
Scenario 2 (higher abatement in Additional Measures) includes the same assumptions as Scenario 1, plus assumptions of additional energy savings stemming from improvements in existing residential and commercial building shells, reductions in industrial energy demand in several subsectors, improved commercial aviation efficiency, a decrease in vehicle miles trav-elled, greater biofuel deployment, efficient tire and oil retrofits for vehicles, improvements in rail freight and shipping, impacts of federal target-setting under Executive Order 13693 (EOP 2015), impacts of green mortgages and similar authorities, and faster implementation of fuel economy standards for medium- and heavy-duty vehicles .16 Scenario 2 also includes the im-pacts of state-level action in the electricity sector, which is consistent with existing state-level policy and may exceed federal requirements .
METHANE AND NITROUS OXIDE
The abatement potential for CH4 was estimated by applying the CH4 MAC curve from the EPA report, Global Mitigation of Non-CO2 Greenhouse Gases (U .S . EPA 2014), to the baseline CH4 emission projections in the First U.S. Biennial Report (U .S . DOS 2014a) . The EPA report provides country-level MAC curves for all non-CO2 GHGs by sector . MAC curves are con-structed for each region and sector from estimated abatement potential and bottom-up aver-age breakeven price calculations for each mitigation option . The mitigation options are ordered producing a stepwise curve, where each point reflects the average cost and reduction potential if a mitigation technology were applied across the sector within a given region . In conjunction with appropriate baseline and projected emissions for a given sector, the results are expressed in terms of absolute reductions of Mt CO2e . This analysis makes no assump-tions regarding specific policies that might encourage the implementation of mitigation options .
Based on the analysis running the MAC model against the 2016 Current Measures emissions and projections, in 2020, the range of CH4 and N2O abatement potential relative to baseline for the purposes of this report is 104–149 Mt CO2e; in 2025, this range is 119–174 Mt CO2e . This range reflects varying assumptions about the ability to achieve the full economic poten-tial abatement represented in the MAC model due to non-price barriers and the effectiveness of voluntary measures . Additional opportunities in N2O reductions from precision agriculture were also estimated .
HYDROFLUOROCARBONS
The U .S . government has collaborated with the governments of Mexico and Canada for the past five years to propose an amendment to the Montreal Protocol on Substances that Deplete the Ozone Layer that would phase down HFC production and consumption and control HFC byproduct emissions (U .S . EPA/OAP 2015) . The amendment calls for progressive global re-ductions in the consumption and production of HFCs through 2046 . The amendment pro-poses that national aggregate HFC production and consumption in CO2e terms be reduced to 15 percent of a baseline by 2036 and 2046 for developed and developing countries, respec-tively, with milestones in intermediate years . Also, emissions of HFC-23 during the production of other fluorocarbons must be reduced significantly to remain below prescribed levels . The analysis of HFC emission reductions from these actions, summarized below, is given in EPA’s Benefits of 2015 HFC Amendment, to be posted on EPA’s web site .17
Appendix 2: Methodologies for Current Measures and Additional Measures
16 We assumed implementation of Alternative 3 of the proposed rule in Scenario 1 and implementation of Alternative 4 in Scenario 2 . 17 For more information, see http://www3 .epa .gov/ozone/intpol/

64 2016 Second Biennial Report
The reductions from the HFC phasedown are analyzed assuming the United States meets the required reductions while complying with all other Montreal Protocol obligations, including completing the phaseout of remaining ozone-depleting substances . The United States is al-ready taking steps domestically as it moves toward an international agreement, including us-ing EPA authority through the SNAP program and leveraging federal government purchasing power to promote cleaner alternatives . Emission reductions from these actions already under-way are assumed in the 2016 Current Measures scenario . EPA’s analysis assumes that several process and handling options and multiple alternative chemicals would be implemented to reduce or replace HFCs in the sectors where they are used today, reducing HFC consumption from the 2016 Current Measures projection to levels necessary to meet the proposed amend-ment . Estimates of the emission patterns from various types of HFC applications, as set forth in the Inventory of U.S. Greenhouse Gas Emissions and Sinks: 1990–2013, allow for the calculation of emission reductions .
The U .S . domestic estimate for HFC-23 emissions in 2020 and 2025 is based in part on the Inventory of U.S. Greenhouse Gas Emissions and Sinks: 1990–2013 (U .S . EPA/OAP 2015), the Global Mitigation of Non-CO2 Greenhouse Gases: 2010–2030 (U .S . EPA 2014), estimated im-pacts of actions reducing hydrochlorofluorocarbon production, and recent corporate commit-ments . Reductions are then calculated, assuming these estimated emissions are reduced to comply with the 2016 proposal submitted by the United States, Canada, and Mexico to ad-dress HFCs under the Montreal Protocol (U .S . EPA/OAP 2015) .
HFC emission reductions through additional measures in the years 2020 and 2025 relative to the 2016 Current Measures scenario are estimated to be 63 and 113, Mt CO2e, respectively .
LAND-USE SINK—SYNTHESIS PROJECTIONS AND UNCERTAINTY
As discussed in the projections section, the land-use sink estimates reflect input from models developed by USDA and EPA . We have made additional efforts to assess uncertainty in our projections; as such, each model produced a high and a low estimate, as well as a central esti-mate . A Synthesis projection estimate was produced as a mean of the two model projections . The combined LULUCF uncertainty range was generated as the sum of squares of the uncer-tainty estimates from the model and was applied to the Synthesis projection . This range is reflected in figures and other outputs in this report .

65
Appendix 3: U.S. Policies and Measures
GHGs Affected
Objective and/or Activity Affected
Brief Description Status of Implementation
Type of Instrument
Implementation Start Year
Implementing Entities
Estimate of Mitigation Impact (not cumulative)
(kt CO2e)
2013 2020
Transportation
National Program for Light-Duty Vehicle GHG Emissions and CAFE Standards
CO2, N2O, CH4, HFCs
Reduce GHG emissions from vehicles .
Establishes corporate emissions fuel economy and GHG emission standards for new light-duty vehicles (LDVs) produced for sale in the U .S .
Implemented Regulatory 2010 DOT/EPA
35,000 236,000
Renewable Fuel Standard
CO2 Increase use of renewable fuels .
Increases the share of renewable fuels used in transportation via implementation of the Renewable Fuel Standard Program .
Implemented Regulatory 2010 EPA n/a 138,400
National Program for Heavy-Duty Vehicle GHG Emissions and Fuel Efficiency Standards
CO2, N2O, CH4, HFCs
Reduce GHG emissions from vehicles .
Establishes fuel efficiency and GHG emis-sion standards for work trucks, buses, and other heavy-duty vehicles (HDVs) .
Implemented Regulatory 2011 DOT/EPA
n/a 37,700
SmartWay Transport Partnership
CO2 Reduce GHG emissions from movement of goods .
Promotes collaboration with busi-nesses and other stakeholders to decrease climate-related and other emissions from movement of goods .
Implemented Voluntary 2004 EPA 33,000 43,000
Light-Duty Vehicle Fuel Economy and Environment Label
CO2 Provide informa-tion to vehicle buyers .
Provides comparable information on new LDVs’ fuel economy, energy use, fuel costs, and environmental impacts .
Implemented Regulatory, Information
2011 EPA/DOT/DOE
n/a n/a
National Clean Diesel Campaign
CO2 Reduce diesel emissions .
Reduces diesel emissions through the implementation of proven emission control technologies and innovative strategies .
Implemented Voluntary/ Negotiated Agreements
2008 EPA n/a n/a
Advanced Technology Vehicle Manufacturing Loan Program
CO2 Provide loans to advanced vehicle technology manu-facturers .
Provides direct loans to qualifying U .S . ad-vanced technology vehicles or component and engineering integration projects .
Implemented Economic 2008 DOE 2,500 2,500
Next Generation Air Transportation Systems
CO2 Reduce GHG emissions from the aviation sector .
Achieves more efficient aircraft operations and reduced GHG emissions through airspace, operational, and infrastructure improvements . The Continuous Lower Energy, Emissions, and Noise Program is an element of NextGen .
Implemented Economic, Research
2004 DOT 200 1,500
Other Aviation Low-Emission, Fuel Efficiency, and Renewable Fuels Measures
CO2 Reduce GHG emissions from the aviation sector .
Implements strategies that reduce GHG emissions from the aviation sector .
Implemented Economic, Voluntary, Research
2004– 2006
DOT n/a n/a
State and Alternative Fuel Provider Fleet Program
CO2 Require fleets to purchase alterna-tive fuel vehicles (AFVs) .
Requires covered fleets either to acquire AFVs as a percentage of their annual LDV acquisitions or to employ other petroleum-reduction methods .
Implemented Regulatory 1992 DOE n/a n/a
Federal Transit, Highway, and Railway Programs
All Reduce GHG emissions from the transit and railway sectors .
Helps public transportation providers, railways, and other key stakeholders to implement strategies that reduce GHGs .
Implemented Fiscal, Voluntary, Research
1991– 2012
DOT n/a n/a
Appendix 3: U .S . Policies and Measures

66 2016 Second Biennial Report
GHGs Affected
Objective and/or Activity Affected
Brief Description Status of Implementation
Type of Instrument
Implementation Start Year
Implementing Entities
Estimate of Mitigation Impact (not cumulative)
(kt CO2e)
2013 2020
On-road GHG Assessment Tools
CO2 Support state and local strategies to reduce GHG emissions from the transportation sector .
Supports and encourages state and local governments to estimate future GHG emissions from the on-road portion of the transportation sector and find strategies to mitigate these effects .
Implemented Information 2011 DOT n/a n/a
Vehicle Technology Deployment (Clean Cities)
CO2, CH4, N2O
Support the use of alternative fuel vehicles and other petroleum- reducing vehicle technologies .
Provides technical assistance, consumer information, industry coordination, tools, knowledge sharing, and cost-shared funding for local and regional projects that mitigate GHG emissions and reduce reliance on petroleum in the transporta-tion sector .
Implemented Economic 1993 DOE 6,700 15,600
Commercial-Scale Integrated Biorefineries
CO2 Support the development of commercial-scale integrated biorefineries (IBRs) .
Through industry partnerships, these deployment projects facilitate the development of integrated biorefineries at commercial scale . The six DOE-supported IBRs will have the capacity to produce ap-proximately 160 million gallons of biofuel by 2020, including 60 million gallons of ethanol and 100 million gallons of hydro-carbon fuel .
Under development
Economic 2009 DOE n/a 800
Energy
Energy Efficiency and Conservation Loan Program
CO2 Fund energy efficiency .
Provides loans to finance energy efficiency and conservation projects for commercial, industrial, and residential consumers .
Implemented Voluntary, Economic
2014 USDA n/a n/a
Energy: Supply
Clean Energy Supply Programs
CO2 Reduce GHG emissions through green power purchases and combined heat and power (CHP) .
The Green Power Partnership encourages U .S . organizations to voluntarily purchase green power, and the Combined Heat and Power Partnership reduces the environ-mental impact of power generation by encouraging the use of CHP .
Implemented Voluntary/ Negotiated
Agreements
2001 EPA 36,300 73,300
Hydroelectric Production Incentive Program
CO2 Support the expansion of hydropower energy develop-ment at existing dams through an incentive pay-ment procedure .
Makes incentive payments to the owner or operator of a qualified hydroelectric facility based on the number of kilowatt-hours of hydroelectric energy generated by the facility during the incentive period . Only appropriated for one year with a limited budget . DOE only accepted applications for generation produced in calendar year 2013 .
Implemented Economic 2013 DOE n/a n/a
Onshore Renewable Energy Development Programs
CO2 Encourage renewable energy development .
Provides opportunities for and encourages use of federal public lands for the develop-ment of wind, solar, and geothermal energy .
Implemented Economic, Voluntary
Around 1980 DOI/ BLM
8,200 41,500
Rural Energy for America Program
CO2, CH4 Fund energy efficiency and renewable energy systems .
Provides grants and loan guarantees to various rural residents, agricultural producers, and rural businesses for energy efficiency and renewable energy systems .
Implemented Voluntary, Economic
2008 USDA 1,136 17,500
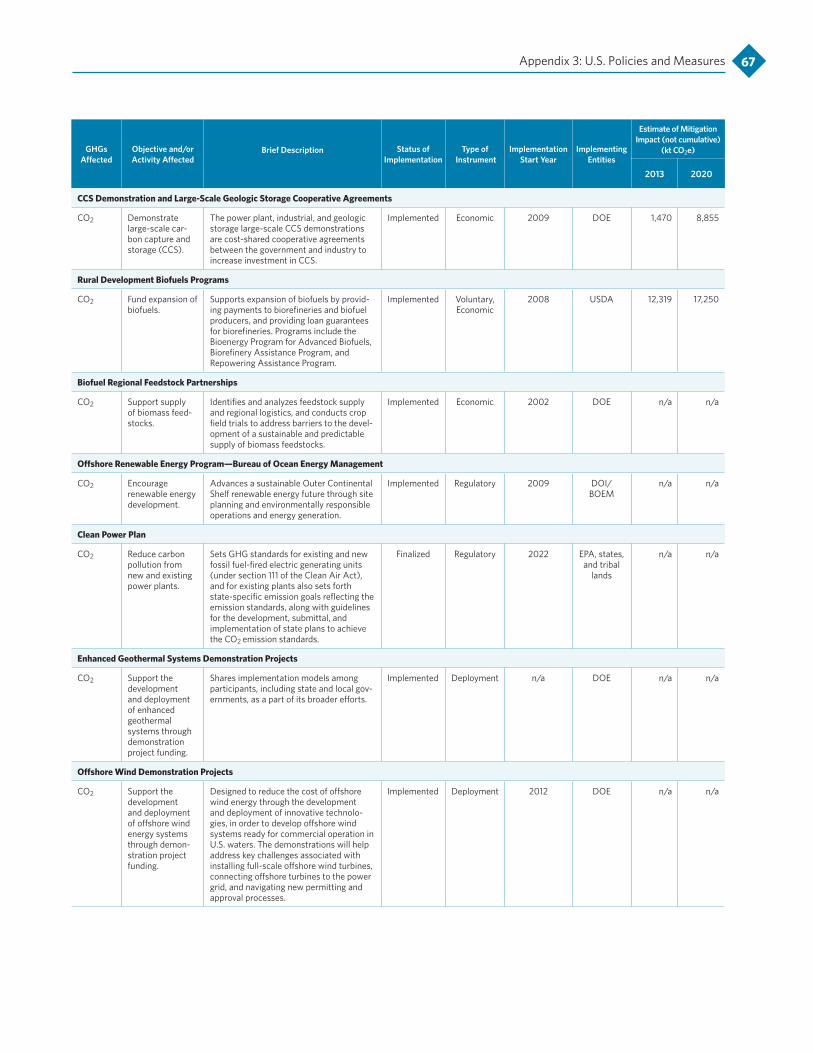
67
GHGs Affected
Objective and/or Activity Affected
Brief Description Status of Implementation
Type of Instrument
Implementation Start Year
Implementing Entities
Estimate of Mitigation Impact (not cumulative)
(kt CO2e)
2013 2020
CCS Demonstration and Large-Scale Geologic Storage Cooperative Agreements
CO2 Demonstrate large-scale car-bon capture and storage (CCS) .
The power plant, industrial, and geologic storage large-scale CCS demonstrations are cost-shared cooperative agreements between the government and industry to increase investment in CCS .
Implemented Economic 2009 DOE 1,470 8,855
Rural Development Biofuels Programs
CO2 Fund expansion of biofuels .
Supports expansion of biofuels by provid-ing payments to biorefineries and biofuel producers, and providing loan guarantees for biorefineries . Programs include the Bioenergy Program for Advanced Biofuels, Biorefinery Assistance Program, and Repowering Assistance Program .
Implemented Voluntary, Economic
2008 USDA 12,319 17,250
Biofuel Regional Feedstock Partnerships
CO2 Support supply of biomass feed-stocks .
Identifies and analyzes feedstock supply and regional logistics, and conducts crop field trials to address barriers to the devel-opment of a sustainable and predictable supply of biomass feedstocks .
Implemented Economic 2002 DOE n/a n/a
Offshore Renewable Energy Program—Bureau of Ocean Energy Management
CO2 Encourage renewable energy development .
Advances a sustainable Outer Continental Shelf renewable energy future through site planning and environmentally responsible operations and energy generation .
Implemented Regulatory 2009 DOI/ BOEM
n/a n/a
Clean Power Plan
CO2 Reduce carbon pollution from new and existing power plants .
Sets GHG standards for existing and new fossil fuel-fired electric generating units (under section 111 of the Clean Air Act), and for existing plants also sets forth state-specific emission goals reflecting the emission standards, along with guidelines for the development, submittal, and implementation of state plans to achieve the CO2 emission standards .
Finalized Regulatory 2022 EPA, states, and tribal
lands
n/a n/a
Enhanced Geothermal Systems Demonstration Projects
CO2 Support the development and deployment of enhanced geothermal systems through demonstration project funding .
Shares implementation models among participants, including state and local gov-ernments, as a part of its broader efforts .
Implemented Deployment n/a DOE n/a n/a
Offshore Wind Demonstration Projects
CO2 Support the development and deployment of offshore wind energy systems through demon-stration project funding .
Designed to reduce the cost of offshore wind energy through the development and deployment of innovative technolo-gies, in order to develop offshore wind systems ready for commercial operation in U .S . waters . The demonstrations will help address key challenges associated with installing full-scale offshore wind turbines, connecting offshore turbines to the power grid, and navigating new permitting and approval processes .
Implemented Deployment 2012 DOE n/a n/a
Appendix 3: U .S . Policies and Measures

68 2016 Second Biennial Report
GHGs Affected
Objective and/or Activity Affected
Brief Description Status of Implementation
Type of Instrument
Implementation Start Year
Implementing Entities
Estimate of Mitigation Impact (not cumulative)
(kt CO2e)
2013 2020
Regional Carbon Sequestration Partnerships (RCSPs)
CO2 Support large-scale field tests for validating basic science approaches to geologic carbon storage .
RCSPs are tasked to determine the best geologic storage approaches and apply technologies to safely and permanently store CO2 for their specific regions . Geographical differences in fossil fuel use and storage opportunities across North America dictate regional approaches to storage of CO2 and other GHGs . The RCSPs are focusing on the carbon capture and storage opportunities within their spe-cific regions, while collectively building an effective and robust nationwide initiative .
Implemented Economic 2008 DOE 2,000 n/a
Energy: Residential, Commercial, and Industrial End Use
Appliance, Equipment, and Lighting Energy Efficiency Standards
CO2 Establish minimum energy conservation requirements .
Establishes minimum energy conservation standards for more than 60 categories of appliances and equipment .
Implemented Regulatory 1987 DOE 173,000 216,000
ENERGY STAR Labeled Products
CO2 Reduce GHG emissions through energy-efficient products .
Labels distinguish energy-efficient prod-ucts in the marketplace .
Implemented Voluntary 1992 EPA/ DOE
155,100 141,200
ENERGY STAR Commercial Buildings
CO2 Reduce GHG emissions through energy-efficient buildings .
Promotes improvement in energy perfor-mance in commercial buildings .
Implemented Voluntary 1995 EPA 96,000 93,500
ENERGY STAR for Industry
CO2 Reduce GHG emissions through energy-efficient industrial plants .
Promotes improvement in energy perfor-mance across industry .
Implemented Voluntary 1995 EPA 39,700 36,600
ENERGY STAR Certified New Homes
CO2 Reduce GHG emissions through energy-efficient new homes .
Promotes improvement in energy perfor-mance in residential buildings beyond the labeling of products .
Implemented Voluntary 1995 EPA 3,100 3,800
Home Performance with ENERGY STAR
CO2 Encourage energy efficiency improvements in existing homes .
Provides homeowners with resources to identify trusted contractors for high-quality, comprehensive energy audits and residential retrofits .
Implemented Economic 2002 DOE 600 2,800
Building Energy Codes
CO2 Support energy- efficient building codes .
Develops cost-effective building energy codes with adoption and compliance strategies .
Implemented Regulatory 1992 DOE 29,700 56,100
Combined Heat & Power Technical Assistance Partnerships and Industrial Assessment Centers
CO2 Encourage energy efficiency in industrial plants .
Provides technical assistance, includ-ing energy audits, to increase energy efficiency and reduce costs for CHP plants and industrial processes .
Implemented Economic 2007 DOE n/a n/a

69
GHGs Affected
Objective and/or Activity Affected
Brief Description Status of Implementation
Type of Instrument
Implementation Start Year
Implementing Entities
Estimate of Mitigation Impact (not cumulative)
(kt CO2e)
2013 2020
National Energy Information Surveys and Analysis
CO2 Provide informa-tion and analysis critical to under-standing energy .
The Energy Information Administration collects and publishes national energy data and analysis . For example, end-use consumption data are the basis for bench-marking and measuring energy efficiency, providing policymakers with the tools to develop mitigation policies .
Implemented Information 1977 DOE-EIA n/a n/a
Green Retrofit Program
CO2 Support energy- efficient invest-ments in federally assisted afford-able housing .
Retrofitted 20,000 units of affordable housing with $250 million in ARRA funds, resulting in lower utility costs and green features .
Closed Economic (Financing)
2010 HUD n/a n/a
Update Energy Efficient Building Codes and Standards
CO2 Support energy- efficient invest-ments in federally assisted afford-able housing .
Provides incentives for investing public- and private-sector funds in energy-efficient upgrades in 1 .1 million housing units, and meets statutory requirements to update building codes and provide incentives for ENERGY STAR and other above-code green building standards in new federally assisted housing .
Implemented Regulatory, Economic
2010 HUD/ USDA
n/a n/a
Incentives for Energy Efficient Homeownership
CO2 Enable home- owners to improve the ef-ficiency of single-family homes .
Implements a suite of energy-efficient mortgage or finance products to assist homeowners to invest in energy efficiency .
Implemented Economic 1985 HUD n/a n/a
Renew300 Federal Renewable Energy Target
CO2 Triple the adop-tion of renewable energy in federally assisted housing .
Sets a target of 300 MW for solar and renewable energy in federally assisted housing .
Implemented Voluntary, Economic,
Information
2014 HUD n/a n/a
Better Buildings Challenge
CO2 Establish minimum energy conservation requirements and encourage adop-tion of sustainable and energy- efficient building practices and investments .
DOE is currently pursuing strategies within four interrelated key areas to catalyze change and investment in energy efficien-cy: developing innovative, replicable solu-tions with market leaders; making energy efficiency investment easier; developing a skilled clean energy workforce, including multifamily housing with HUD; and leading by example in the federal government .
Implemented Voluntary, Economic,
Information
2011 DOE/ HUD n/a n/a
Energy: Commercial and Industrial End Use
Better Buildings/Better Plants
CO2 Support energy efficiency in build-ings and industrial facilities .
Shares implementation models among participants, including state and local gov-ernments, as a part of its broader efforts .
Implemented Economic 2011 DOE n/a n/a
Superior Energy Performance/ISO 50001
CO2 Support energy efficiency in the manufactur-ing sector by providing guid-ance, tools, and protocols .
Provides guidance, tools, and protocols to facilitate energy efficiency savings and improved energy performance .
Implemented Economic 2007 DOE n/a n/a
Appendix 3: U .S . Policies and Measures
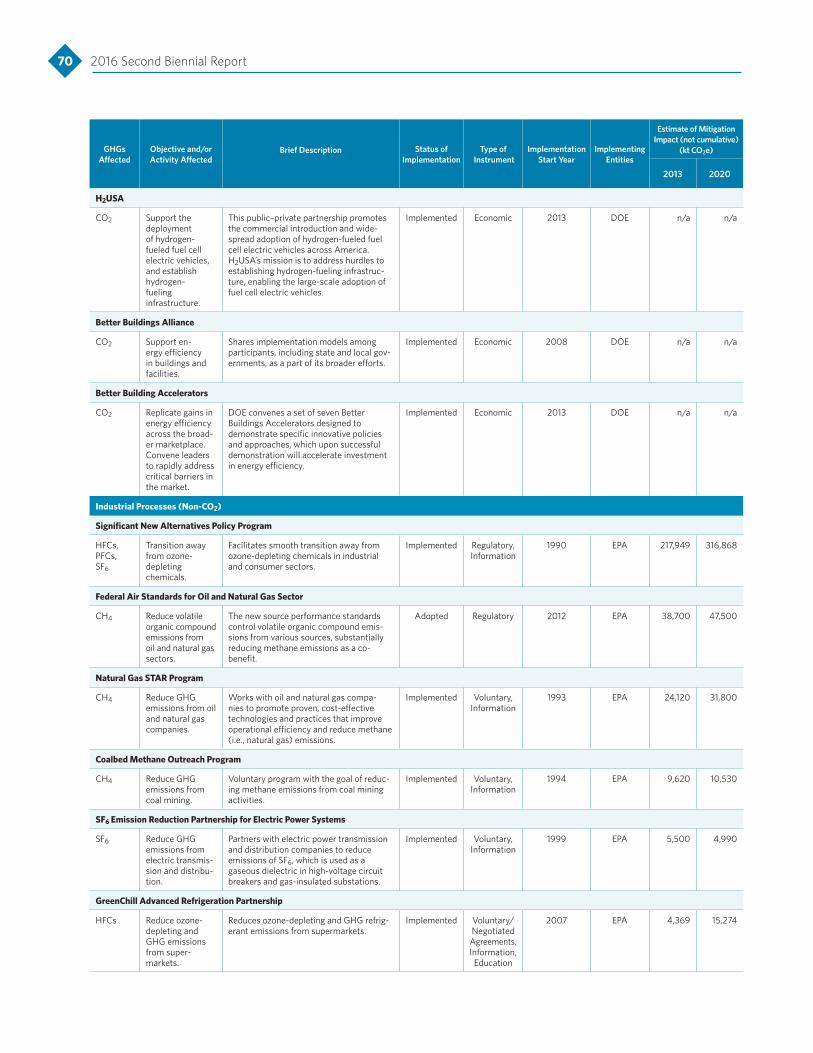
70 2016 Second Biennial Report
GHGs Affected
Objective and/or Activity Affected
Brief Description Status of Implementation
Type of Instrument
Implementation Start Year
Implementing Entities
Estimate of Mitigation Impact (not cumulative)
(kt CO2e)
2013 2020
H2USA
CO2 Support the deployment of hydrogen- fueled fuel cell electric vehicles, and establish hydrogen- fueling infrastructure .
This public–private partnership promotes the commercial introduction and wide-spread adoption of hydrogen-fueled fuel cell electric vehicles across America . H2USA’s mission is to address hurdles to establishing hydrogen-fueling infrastruc-ture, enabling the large-scale adoption of fuel cell electric vehicles .
Implemented Economic 2013 DOE n/a n/a
Better Buildings Alliance
CO2 Support en-ergy efficiency in buildings and facilities .
Shares implementation models among participants, including state and local gov-ernments, as a part of its broader efforts .
Implemented Economic 2008 DOE n/a n/a
Better Building Accelerators
CO2 Replicate gains in energy efficiency across the broad-er marketplace . Convene leaders to rapidly address critical barriers in the market .
DOE convenes a set of seven Better Buildings Accelerators designed to demonstrate specific innovative policies and approaches, which upon successful demonstration will accelerate investment in energy efficiency .
Implemented Economic 2013 DOE n/a n/a
Industrial Processes (Non-CO2)
Significant New Alternatives Policy Program
HFCs, PFCs, SF6
Transition away from ozone- depleting chemicals .
Facilitates smooth transition away from ozone-depleting chemicals in industrial and consumer sectors .
Implemented Regulatory, Information
1990 EPA 217,949 316,868
Federal Air Standards for Oil and Natural Gas Sector
CH4 Reduce volatile organic compound emissions from oil and natural gas sectors .
The new source performance standards control volatile organic compound emis-sions from various sources, substantially reducing methane emissions as a co-benefit .
Adopted Regulatory 2012 EPA 38,700 47,500
Natural Gas STAR Program
CH4 Reduce GHG emissions from oil and natural gas companies .
Works with oil and natural gas compa-nies to promote proven, cost-effective technologies and practices that improve operational efficiency and reduce methane (i .e ., natural gas) emissions .
Implemented Voluntary, Information
1993 EPA 24,120 31,800
Coalbed Methane Outreach Program
CH4 Reduce GHG emissions from coal mining .
Voluntary program with the goal of reduc-ing methane emissions from coal mining activities .
Implemented Voluntary, Information
1994 EPA 9,620 10,530
SF6 Emission Reduction Partnership for Electric Power Systems
SF6 Reduce GHG emissions from electric transmis-sion and distribu-tion .
Partners with electric power transmission and distribution companies to reduce emissions of SF6, which is used as a gaseous dielectric in high-voltage circuit breakers and gas-insulated substations .
Implemented Voluntary, Information
1999 EPA 5,500 4,990
GreenChill Advanced Refrigeration Partnership
HFCs Reduce ozone- depleting and GHG emissions from super-markets .
Reduces ozone-depleting and GHG refrig-erant emissions from supermarkets .
Implemented Voluntary/ Negotiated
Agreements,Information,
Education
2007 EPA 4,369 15,274

71
GHGs Affected
Objective and/or Activity Affected
Brief Description Status of Implementation
Type of Instrument
Implementation Start Year
Implementing Entities
Estimate of Mitigation Impact (not cumulative)
(kt CO2e)
2013 2020
Responsible Appliance Disposal Program
HFCs Reduce emissions from end-of-life appliances .
Reduces emissions of refrigerant and foam-blowing agents from end-of-life appliances .
Implemented Voluntary/ Negotiated
Agreements
2006 EPA 207 774
Voluntary Aluminum Industry Partnership
PFCs Reduce GHG emissions from the aluminum industry .
Partners with industry to reduce PFCs, tetrafluoromethane, and hexafluoroethane where cost-effective technologies and op-erational practices are technically feasible .
Implemented Voluntary, Information
1995 EPA 6,500 400
Voluntary Code of Practice for the Reduction of Emissions of HFC and PFC Fire Protection Agents
HFCs, PFCs
Reduce GHG emissions from fire protection agents .
Minimizes nonfire emissions of HFCs and PFCs used as fire-suppression alternatives, and protects people and property from the threat of fire using proven, effective products and systems .
Implemented Voluntary/ Negotiated
Agreements
2002 EPA n/a n/a
Industrial Processes (CO2)
New Source Performance Standards for Petroleum Refineries
CO2 Reduce GHG emissions through flare gas recovery .
The new source performance standards require refiners to develop flare manage-ment practices to reduce the amount of waste gases flared .
Adopted Regulatory 2012 EPA n/a 2,262
Agriculture
Conservation Reserve Program
CO2 Promote sustain-able develop-ment .
Encourages farmers to convert highly erodible cropland or other environmentally sensitive acreage .
Implemented Economic, Information
1985 USDA 43,900 39,800
Natural Resources Conservation Service
CO2, N2O, CH4
Promote sustain-able develop-ment .
Helps landowners to implement practices or measures that address natural resource concerns .
Implemented Voluntary, Economic,
Information
1935– 2014 USDA 9,237 27,600
AgSTAR
CH4 Reduce GHG emissions using biogas recovery .
Encourages the use of methane recovery technologies at confined animal feeding operations that manage manure as liquids or slurries .
Implemented Voluntary, Information
1994 EPA/ USDA
824 1,070
Forestry and Land Management
Woody Biomass Utilization Grants Program
CO2 Promote sustain-able develop-ment .
Creates markets for small-diameter woody material and low-valued trees removed from forest restoration activities .
Implemented Voluntary, Economic,
Information
2005 USDA n/a n/a
Forest Ecosystem Restoration and Hazardous Fuels Reduction Programs
CO2 Promote sustain-able develop-ment .
Restores the health of the nation’s forests, woodlands, and rangelands .
Implemented Voluntary 2003 USDA/DOI n/a n/a
Biological Carbon Sequestration Assessment
CO2, CH4, N2O
Enhance land-sector carbon management .
Provides decision support and technical assistance to Department of the Interior land management agencies, for example, by developing estimates of the biological carbon sequestration potential of specific environmental restoration projects .
Implemented Information 2015 DOI/ USGS
n/a n/a
Retention of Private Forests
CO2 Promote sustain-able development .
Maintains the extent and health of the na-tion’s private forests and woodlands .
Implemented Voluntary 1978–2008 USDA n/a n/a
Appendix 3: U .S . Policies and Measures

72 2016 Second Biennial Report
GHGs Affected
Objective and/or Activity Affected
Brief Description Status of Implementation
Type of Instrument
Implementation Start Year
Implementing Entities
Estimate of Mitigation Impact (not cumulative)
(kt CO2e)
2013 2020
Waste Management/Waste
Landfill Air Regulations
CH4 Reduce landfill gas emissions .
Limits GHG emissions by limiting landfill gas emissions from landfills that are at least 2 .5 million megagrams in size . Land-fill gas is approximately 50% methane .
Implemented (under 8-year
review)
Regulatory 1996 EPA 251,762 261,885
Landfill Methane Outreach Program
CH4 Reduce GHG emissions at landfills .
Reduces GHG emissions at landfills by supporting the recovery and use of landfill gas for energy .
Implemented Voluntary, Information
1994 EPA 31,280 18,690
Sustainable Materials Management
CO2 Encourage sustainable materials management .
Provides a systemic approach to reduce the use of materials and their associated environmental impacts over their entire life cycle .
Implemented Voluntary/ Negotiated
Agreements, Information,
Education
2011 EPA 500 30
Wastewise
CO2 Encourage sustainable materials management .
Helps organizations and businesses apply sustainable material management practices to reduce municipal and select industrial wastes .
Implemented Voluntary/ Negotiated
Agreements, Information,
Education
1994 EPA n/a n/a
Federal Government
Federal Energy Management Program
CO2 Promote energy efficiency and renewable energy in federal facilities .
Promotes energy efficiency and renewable energy use in federal buildings, facilities, and operations .
Implemented Regulatory 2008 DOE 8,800 14,400
National Park Service Programs
CO2 Promote climate mitigation and sustainable practices at national parks .
Supports efforts to mitigate the effects of climate change and integrate sustainable practices .
Implemented and ongoing
Economic, Voluntary,
Educational
2003–2012 DOI/ NPS
38 200
Cross-Cutting
State Energy Program
CO2 Fund energy efficiency and renewable energy state programs .
Provides funding to state energy offices to reduce market barriers to the cost-effective adoption of renewable energy and energy efficiency technologies .
Implemented Economic 1977 DOE 14,000 16,200
Energy Efficiency and Conservation Block Grants
CO2 Fund energy efficiency and renewable energy local programs .
Assists eligible entities in implement-ing strategies that will improve energy efficiency in the transportation, building, and other sectors, and reduce fossil fuel emissions and total energy use .
Implemented Economic 2009 DOE 4,400 4,400
Section 1703/1705 Loan Guarantee Program
CO2 Mitigate risks related to innova-tive advanced technology investments .
Mitigates the financing risks associated with innovative and, in the case of the Section 1705 Program, some commercial energy projects .
Implemented Economic 2009 DOE 2,500 14,000
Weatherization Assistance Program
CO2,CH4, N2O
Fund weather-ization services for low-income households .
Provides funding and technical support to states, U .S . territories, and tribes, which in turn work with a network of about 900 local agencies to provide trained crews to perform residential weatherization services for income-eligible households .
Implemented Economic 1977 DOE 500 2,200
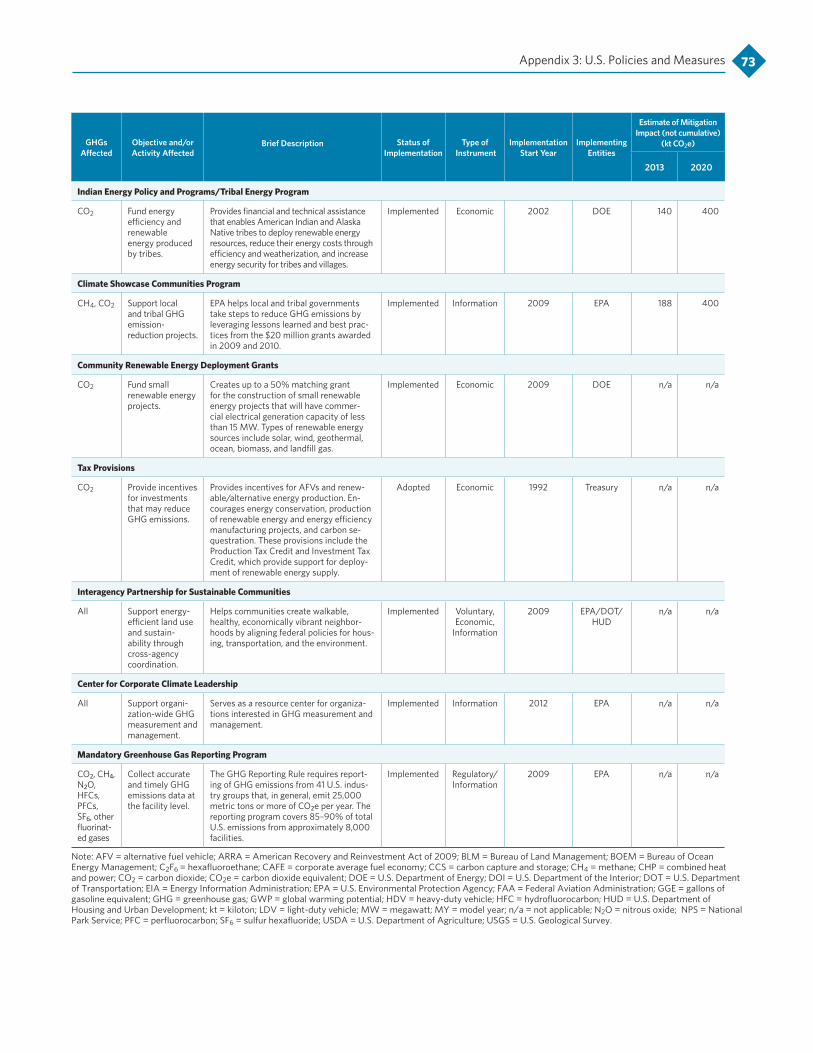
73
GHGs Affected
Objective and/or Activity Affected
Brief Description Status of Implementation
Type of Instrument
Implementation Start Year
Implementing Entities
Estimate of Mitigation Impact (not cumulative)
(kt CO2e)
2013 2020
Indian Energy Policy and Programs/Tribal Energy Program
CO2 Fund energy efficiency and renewable energy produced by tribes .
Provides financial and technical assistance that enables American Indian and Alaska Native tribes to deploy renewable energy resources, reduce their energy costs through efficiency and weatherization, and increase energy security for tribes and villages .
Implemented Economic 2002 DOE 140 400
Climate Showcase Communities Program
CH4, CO2 Support local and tribal GHG emission- reduction projects .
EPA helps local and tribal governments take steps to reduce GHG emissions by leveraging lessons learned and best prac-tices from the $20 million grants awarded in 2009 and 2010 .
Implemented Information 2009 EPA 188 400
Community Renewable Energy Deployment Grants
CO2 Fund small renewable energy projects .
Creates up to a 50% matching grant for the construction of small renewable energy projects that will have commer-cial electrical generation capacity of less than 15 MW . Types of renewable energy sources include solar, wind, geothermal, ocean, biomass, and landfill gas .
Implemented Economic 2009 DOE n/a n/a
Tax Provisions
CO2 Provide incentives for investments that may reduce GHG emissions .
Provides incentives for AFVs and renew-able/alternative energy production . En-courages energy conservation, production of renewable energy and energy efficiency manufacturing projects, and carbon se-questration . These provisions include the Production Tax Credit and Investment Tax Credit, which provide support for deploy-ment of renewable energy supply .
Adopted Economic 1992 Treasury n/a n/a
Interagency Partnership for Sustainable Communities
All Support energy- efficient land use and sustain-ability through cross-agency coordination .
Helps communities create walkable, healthy, economically vibrant neighbor-hoods by aligning federal policies for hous-ing, transportation, and the environment .
Implemented Voluntary, Economic,
Information
2009 EPA/DOT/ HUD
n/a n/a
Center for Corporate Climate Leadership
All Support organi-zation-wide GHG measurement and management .
Serves as a resource center for organiza-tions interested in GHG measurement and management .
Implemented Information 2012 EPA n/a n/a
Mandatory Greenhouse Gas Reporting Program
CO2, CH4, N2O, HFCs, PFCs, SF6, other fluorinat-ed gases
Collect accurate and timely GHG emissions data at the facility level .
The GHG Reporting Rule requires report-ing of GHG emissions from 41 U .S . indus-try groups that, in general, emit 25,000 metric tons or more of CO2e per year . The reporting program covers 85–90% of total U .S . emissions from approximately 8,000 facilities .
Implemented Regulatory/ Information
2009 EPA n/a n/a
Note: AFV = alternative fuel vehicle; ARRA = American Recovery and Reinvestment Act of 2009; BLM = Bureau of Land Management; BOEM = Bureau of Ocean Energy Management; C2F6 = hexafluoroethane; CAFE = corporate average fuel economy; CCS = carbon capture and storage; CH4 = methane; CHP = combined heat and power; CO2 = carbon dioxide; CO2e = carbon dioxide equivalent; DOE = U .S . Department of Energy; DOI = U .S . Department of the Interior; DOT = U .S . Department of Transportation; EIA = Energy Information Administration; EPA = U .S . Environmental Protection Agency; FAA = Federal Aviation Administration; GGE = gallons of gasoline equivalent; GHG = greenhouse gas; GWP = global warming potential; HDV = heavy-duty vehicle; HFC = hydrofluorocarbon; HUD = U .S . Department of Housing and Urban Development; kt = kiloton; LDV = light-duty vehicle; MW = megawatt; MY = model year; n/a = not applicable; N2O = nitrous oxide; NPS = National Park Service; PFC = perfluorocarbon; SF6 = sulfur hexafluoride; USDA = U .S . Department of Agriculture; USGS = U .S . Geological Survey .
Appendix 3: U .S . Policies and Measures
Bibliography
EOP (Executive Office of the President) . 2009 . “President Obama’s Development Policy and the Global Climate Change Initiative .” https://www .whitehouse .gov/sites/default/files/Climate_Fact_Sheet .pdf .
_____ . 2013 . The President’s Climate Action Plan. June 2013 . http://www .whitehouse .gov/sites/default/files/image/president27sclimateactionplan .pdf .
_____ . 2014a . Climate Action Plan—Strategy to Reduce Methane Emissions. https://www .whitehouse .gov/sites/default/files/strategy_to_reduce_methane_emissions_2014-03-28_final .pdf .
_____ . 2014b . “Climate-Resilient International Development Memorandum of September 23, 2014—Deepening U .S . Government Efforts to Collaborate with and Strengthen Civil Society .” Executive Order 13677 . Federal Register 79 (187) . http://www .gpo .gov/fdsys/pkg/FR-2014-09-26/pdf/2014-23228 .pdf .
_____ . 2014c . Priority Agenda for Enhancing the Climate Resilience of America’s Natural Resources. Prepared by the Council on Climate Preparedness and Resilience Climate and Natural Resources Working Group . https://www .whitehouse .gov/sites/default/files/docs/enhancing_climate_resilience_of_americas_natural_resources .pdf .
_____ . 2015 . “Planning for Federal Sustainability in the Next Decade .” Executive Order 13693 . Federal Register 80 (57) . http://www .gpo .gov/fdsys/pkg/FR-2015-03-25/pdf/2015-07016 .pdf .
IPCC (Intergovernmental Panel on Climate Change, Task Force on National Greenhouse Gas Inventories) . 2006 . 2006 IPCC Guidelines for National Greenhouse Gas Inventories. S . Eggleston, L . Buendia, K . Miwa, T . Ngara, and K . Tanabe, eds . Kanagawa, Japan: Institute for Global Environmental Strategies . http://www .ipcc-nggip .iges .or .jp/public/2006gl/index .html .
_____ . 2007 . Climate Change 2007: Synthesis Report. Contribution of Working Groups I, II, and III to the Fourth Assessment Report of the Intergovernmental Panel on Climate Change . Core Writing Team, R . K . Pachauri, and A . Reisinger, eds . Geneva, Switzerland . http://www .ipcc .ch/publications_and_data/publications_ipcc_fourth_assessment_report_synthesis_report .htm .
UNFCCC (United Nations Framework Convention on Climate Change) . 2006 . “Updated UNFCCC Reporting Guidelines on Annual Inventories Following Incorporation of the Provisions of Decision 14/CP .11 . FCCC/ SBSTA/2006/9 .” http://unfccc .int/resource/docs/2006/sbsta/eng/09 .pdf .
_____ . 2013a . “Biennial Reports (Annex I) .” http://unfccc .int/national_reports/biennial_reports_and_iar/items/7534 .php .
_____ . 2013b . UNFCCC Reporting Guidelines on Annual Inventories for Parties Included in Annex I to the Convention. http://unfccc .int/national_reports/annex_i_ghg_inventories/reporting_requirements/items/2759 .php .
_____ . 2015 . “Draft TEC Brief on National Systems of Innovation .” Presented at the eleventh meeting of the Technology Executive Committee, Bonn, Germany, September 7–11 . http://unfccc .int/ttclear/misc_/StaticFiles/gnwoerk_static/TEM_TEC_meetings/e55736b7e0a1437dab14ae104e35af75/b336804d89d94e7abbd1128211549f2c .pdf .

75
USAID (United States Agency for International Development) . 2012 . USAID Climate Change and Development Strategy: 2012–2016. Washington, DC . http://www .cgdev .org/doc/Rethinking%20Aid/Climate_Change_&_Dev_Strategy .pdf .
U .S . DOE/EIA (United States Department of Energy, Energy Information Administration) . 2015a . Annual Energy Outlook 2015. Washington, DC . http://www .eia .gov/forecasts/aeo/ .
_____ . 2015b . Monthly Energy Review. February . Washington, DC . http://www .eia .gov/totalenergy/data/monthly/index .cfm .
_____ . 2015c . Monthly Energy Review . October . Washington,DC . http://www .eia .gov/totalenergy/data/monthly/ .
U .S . DOS (United States Department of State) . 2006 . U.S. Climate Action Report—2006. Fourth National Communication of the United States of America under the United Nations Framework Convention on Climate Change . Washington, DC . http://www .state .gov/documents/organization/84252 .pdf .
_____ . 2010 . U.S. Climate Action Report 2010. Fifth National Communication of the United States of America under the United Nations Framework Convention on Climate Change . Washington, DC . June . http://www .state .gov/e/oes/rls/rpts/car5/ .
_____ . 2014a . First Biennial Report of the United States of America. Under the United Nations Framework Convention on Climate Change . Washington, DC . http://www .state .gov/e/oes/rls/rpts/car6/index .htm .
_____ . 2014b . U.S. Climate Action Report 2014 . Sixth National Communication of the United States of America under the United Nations Framework Convention on Climate Change Washington, DC . June . http://www .state .gov/e/oes/rls/rpts/car6/index .htm .
_____ . 2015 . “The Quadrennial Diplomacy and Development Review .” http://www .state .gov/s/dmr/qddr/ .
U .S . EPA (United States Environmental Protection Agency) . 2013 . Methodologies for U.S. Greenhouse Gas Emissions Projections: Non-CO2 and Non-Energy CO2 Sources. Washington, DC . http://www .state .gov/documents/organization/214971 .pdf .
_____ . 2014 . Global Mitigation of Non-CO2 Greenhouse Gases: 2010–2030. EPA-430-S-14-001 . Washington, DC . http://www3 .epa .gov/climatechange/Downloads/EPAactivities/MAC_Report_2013 .pdf
U .S . EPA/OAP (United States Environmental Protection Agency, Office of Atmospheric Programs) . 2015 . Inventory of U.S. Greenhouse Gas Emissions and Sinks: 1990–2013. Washington, DC . http://www3 .epa .gov/climatechange/Downloads/ghgemissions/US-GHG-Inventory-2015-Chapter-1-Introduction .pdf .
Woodall, C . W ., et al . 2015 The U.S Forest Carbon Accounting Framework: Stocks and Stock Change, 1990–2016. http://www .fia .fs .fed .us/forestcarbon/docs/CarbonReport_OnlineDraft-opt .pdf .
Bibliography


