2015 - unfccc
TRANSCRIPT

i
ANTIGUA AND BARBUDA
THIRD NATIONALCOMMUNICATION
2015

ii
Prepared on behalf ofThe Government of Antigua and Barbuda
Department of EnvironmentMinistry of Health and Environment

iii
ANTIGUA & BARBUDATHIRD NATIONAL COMMUNICATION ON CLIMATE CHANGE
Under the United Nations Framework Convention on Climate change

EXECUTIVE SUMMARY
iv
Antigua and Barbuda is a small island developingstate (SID) located in the Eastern Caribbean. Thecountry became a member of the United NationsFramework Convention on Climate Change(UNFCCC) on February 2nd, 1993. It alsosubsequently ratified the Kyoto Protocol to theUNFCCC on November 3rd 1998. As a developingcountry, Antigua and Barbuda is categorized as aNon-Annex I Party to the UNFCCC. According toArticles 3.2 and 4.8 of the UNFCCC, the countryfalls within a range of characteristic criteria whichis recognized as being particularly vulnerable tothe impacts of climate change and deserving ofthe support of the international community toaddress climate change impacts.
To determine the impact at which internationalagreements such as the UNFCCC, and Rio+20,amongst others influence development, thecountry has undertaken internal and regionalassessments. The results of the assessments sofar conclude that most of the countries in theCaribbean, including Antigua and Barbuda, aremiddle-income, and do not have sufficient accessto concessional resources and technicalassistance. In the last decade weather-relateddisasters have also put the countries of theCaribbean to the test, with serious implicationsfor the economies of the region. Additionally,with specific reference to climate change, thesmall size of the country’s economy is a furtherimpediment to its ability to afford necessarymitigation and adaptation technologies on itsown.
Antigua and Barbuda’s environmental resourcescreate the foundation for social and economicdevelopment. Primary resources include a veryagreeable climate, outstanding land andseascapes, extensive areas of high ecologicalvalue, an engaging history, democraticgovernance, a well-educated and healthypopulation, and significant natural resources(beaches, agricultural lands and fish stocks).Although the country’s natural resources were ofprimary economic importance throughout muchof its history, the other resources previously
mentioned, coupled with the ease of accessibilityto North America and Europe, have led to athriving tourism industry. This industry accountsfor more than half of the country’s grossdomestic product (GDP). With tourism as themain GDP contributor, heavily dependent onhealthy environmental resources, the country issignificantly vulnerable to the impacts of climatechange.
In an effort to address its vulnerability and showits commitment to the ongoing internationaldiscourses on climate change, the Government ofAntigua and Barbuda has undertaken manystrides to enable climate resilient development.Since the last report to the UNFCCC, theGovernment has enacted its EnvironmentalProtection and Management Act 2015, theNational Physical Development Plan, an EnergyPolicy, and publicly made a commitment throughthe UNFCCC’s Copenhagen Accord in 2010 toreduce the country’s green house gas emissionsby 25% of its 1990 levels by 2020. Additionally,the Intended Nationally DeterminedCommitments (INDC) have also been submittedin preparation for the COP21 Paris agreements. Itis in this light, that the Third NationalCommunication (TNC) has been prepared todocument the country’s progress to mitigate andadapt to global climate change.
National Circumstances presents information onthe existing status of the islands’ environmentalresources that would be impacted by climatechange, namely, marine resources such as seagrass, coral reefs, beaches, and mangroves. Whilethe island has experienced significant coastalerosion, particularly along the Northwest coast,associated with storm surge and other extremeweather events, watersheds and water resourcesare continuously impacted by an increase indrought conditions. This has resulted in theincreased use of desalination plants which oftenaccounts for 60 -95% of water supply. Anoverview of land use patterns highlight trendsrelevant to food and water security as well asurban sprawl. The economic profile examines the

v
main sectors of economic contribution, such as,agriculture, manufacturing, tourism and thefinancial services sector. The health sector hasseen an increased emergence of vector bornediseases. This has implications for the economyas health advisory warnings deter tourists to theisland.
GHG Inventory for the country’s major emittedgasses is provided through a detailedmethodology and data collection. In 2006,945.544Gg of CO2 were reported; 7% from LandUse Change and Forestry and 92% from FuelCombustion in the Energy Sector. However, sincethe Initial and Second National Communications,data quality and collection has improved and mayaccount for the sharp increase. In 2000, therewas very little data available for the Land UseChange and Forestry Sector but in 2006 there wassubstantially more data available hence theincrease in emissions from that sector.
Methane, Nitrous Oxide and Non-methaneVolatile Organic Carbon (NMVOC) emissionsdecreased when comparing 2000 and 2006 GHGInventories. In 2000, the methane emissionsreported were 6.6Gg; Nitrous Oxide emissionswere 0.159Gg; and NMVOC emissions were 2.Gg.
However, Hydrofluorocarbon (HFC) emissionsincreased when the 2000 and 2006 GHGinventories were compared. In 2000, the HFCemissions reported were 0.0037 Gg comparedwith 114.034Gg in the 2006 GHG Inventory. Inthe latter case, greater efforts were made incollecting data from that sector than in theprevious GHG inventory, hence the significantincrease. It is important to note that there areefforts in place to significantly reduce the GHGemissions by 2020. Additionally, data from thisInventory may be used to provide evidence of thepresent day situation so that solutions can beencouraged to reduce emissions and point theway forward towards Renewable Energy Sourcesand Energy Efficiency.
2006 National GHG emissions are as follows:
Carbon Dioxide 945.544Gg
Methane (CH4) 0.639Gg
Nitrous Oxide (N20) 0.079Gg
Non-Methane Volatile Organiccompounds (NMVOC)
0.035Gg
Hydroflurocarbons (HFC) 114.034Gg
Policy and Measures This chapter discusses thecountry’s efforts to address climate changeadaptation and mitigation under the UNFCCCconvention. It looks at efforts undertaken tomeet national commitments under theCopenhagen Accord and the recent COP21 ParisINDCs. It also highlights efforts to mainstreamclimate change mainstreaming nationally.
Vulnerability, Assessments, Climate Changeimpacts and adaptation details the majorsectors requiring urgent intervention throughstakeholder consultation and various studies.Biodiversity, agriculture, health, and water arehighlighted as priorities in an overview of climatehazards and disasters experienced on the twinisland state. Chronic drought conditions andimpacts currently being experienced arediscussed and highlight the need for large scalecapital investment projects in renewable energy.
Other Information relevant to research andsystematic observation, education, training, andawareness. The chapter also highlights regionalpartnerships to achieve its objectives under theConvention.
Gaps and Constraints This chapter summarisesmajor constraints provided throughout thereport. These constraints hinder the country’sprogress in meeting the obligations of theConvention. These relate to data collection andavailability, inadequate infrastructure, limitedprivate and public sector engagement, and theisland’s transportation profile.

TABLE OF CONTENTS
vi
1 NATIONAL CIRCUMSTANCES 12
1.1 ENVIRONMENTAL CONTEXT 151.1.1 MARINE RESOURCES 151.1.2 WATERSHED AND WATER RESOURCES 191.1.3 LANDUSE CHANGES 201.1.4 CLIMATE PROFILE 211.2 DEMOGRAPHIC PROFILE 251.2.1 SOCIO-ECONOMIC INDICATOR 271.3 POVERTY ESTIMATES 271.4 HEALTHCARE 271.5 ECONOMIC PROFILE 281.5.1 TOURISM AND THE ECONOMIC GROWTH 301.5.2 AGRICULTURE AND THE ECONOMY 301.5.3 MANUFACTURING AND THE ECONOMY 321.5.4 FINANCIAL SERVICES SECTOR AND THE ECONOMY 321.6 POLITICAL STRUCTURE AND GOVERNANCE 331.6.1 POLICY, LEGAL AND INSTITUTIONAL FRAMEWORK 341.7 ECONOMIC AND POLITICAL CHALLENGES 351.8 STRATEGIC APPROACHES 351.9 SUMMARY 36
2 GHG INVENTORY 37
2.1 ENERGY SECTOR 382.1.1 METHODOLOGY –ENERGY SECTOR 382.1.2 EMISSIONS 382.2 INDUSTRIAL SECTOR 392.2.1 METHODOLOGY 392.2.2 EMISSIONS 392.3 AGRICULTURE SECTOR 402.3.1 METHODOLOGY 402.3.2 EMISSIONS 412.4 FORESTRY AND OTHER LAND USES 412.4.1 METHODOLOGY (FORESTRY & OTHER LAND USES) 412.4.2 EMISSIONS 422.5 WASTE SECTOR 432.5.1 METHODOLOGY 432.5.2 EMISSIONS 432.6 KEY CATEGORY ANALYSIS 442.7 UNCERTAINTIES 482.8 ENERGY SECTOR – UNCERTAINTIES 492.9 INDUSTRIAL SECTOR - UNCERTAINTIES 492.10 AGRICULTURE SECTOR - UNCERTAINTIES 502.11 FORESTRY AND OTHER LAND USES -UNCERTAINTY 512.12 WASTE SECTOR - UNCERTAINTIES 51

vii
2.13 QUANTIFIED UNCERTAINTY 522.14 RECOMMENDATIONS 582.15 POLICIES 602.16 SUMMARY 60
3 MITIGATION: POLICY & MEASURES 62
3.1 TOWARDS COPENHAGEN 633.1.1 ELECTRICITY PROFILE 653.2 TOWARDS COP21 PARIS AGREEMENTS 653.3 MAINSTREAMING CLIMATE CHANGE 66
4 VULNERABILITY, ASSESSMENTS, CLIMATE CHANGE IMPACTS AND ADAPTATION MEASURES 68
4.1 ASSESSMENTS OF IMPACTS AND ADAPTATION MEASURES 694.2 CLIMATE VARIABILITY AND CHANGE 744.3 INCREASED CLIMATE VARIABILITY 774.4 CHANGES IN MEAN CLIMATE: RAINFALL 774.5 CHANGES IN MEAN CLIMATE: TEMPERATURE 794.6 CHANGES TO MEAN CLIMATE: EXTREME WEATHER 804.7 CHANGES IN MEAN CLIMATE: SEA LEVEL RISE AND STORM SURGE 824.8 VULNERABLE SECTORS 904.8.1 BIODIVERSITY 904.8.2 WATER 914.8.3 AGRICULTURE 954.8.4 HEALTH 954.9 SUMMARY OF VULNERABILITY ASSESSMENTS 964.10 COOPERATION ON ADAPTATION 1024.11 REGIONAL COOPERATION 1034.12 BUILDING AWARENESS 104
5 OTHER INFORMATION 105
5.1 RESEARCH AND SYSTEMATIC OBSERVATION 1055.1.1 EIMAS 1055.1.2 RESEARCH IN RENEWABLE ENERGY 1065.1.3 COASTAL MONITORING 1065.1.4 DATA COLLECTION 1075.1.5 MODEL DOWNSCALING 1075.2 TECHNOLOGY TRANSFER 1085.2.1 MET AND CLIMATOLOGY 1085.2.2 RENEWABLE ENERGY AND ENERGY EFFICIENCY 1085.3 EDUCATION, TRAINING AND PUBLIC AWARENESS 1095.4 SUMMARY 113
6 GAPS AND CONSTRAINTS 115
6.1 DATA COLLECTION 1156.2 INADEQUATE INFRASTRUCTURE 1156.3 FINANCIAL SERVICES SECTOR 115

viii
6.4 PRIVATE AND PUBLIC SECTOR ENGAGEMENT 1156.5 TRANSPORTATION SECTOR 116
7 ANNEX: UNCERTAINTY CALCULATIONS 117
8 STATEMENT OF INDC 128

TABLE OF CONTENTS
ix
List of Tables
Table 1:Land-use Trends in Antigua & Barbuda ______________________________________________________________________20Table 2: Age Structure of national population ________________________________________________________________________25Table 3: CO2 Emissions in Antigua and Barbuda from the Energy Sector – Inventory Year 2006 ___________________38Table 4: Non-CO2 Emissions from Antigua and Barbuda – Inventory Year 2006 ____________________________________38Table 5: Detailed Emissions in Antigua and Barbuda from the Industrial Sector – Inventory Year 2006___________39Table 6: Summary Emissions in Antigua and Barbuda from the Industrial Sector - Inventory Year 2006 __________40Table 7: Detailed emissions in Antigua and Barbuda from the Agriculture Sector – Inventory Year 2006_________41Table 8: Summary Emissions in Antigua and Barbuda from the Agriculture Sector - Inventory Year 2006 ________41Table 9: Detailed Forestry and Other Landuse CO2 Emissions and Removals _______________________________________42Table 10: Detailed emissions in Antigua and Barbuda from Waste sector – Inventory Year 2006 _________________43Table 11: Summary emissions in Antigua and Barbuda for the Waste Sector - Inventory year 2006 ______________43Table 12: Approach 1 Level Assessment for GHG Inventory for 2000 (previous inventory) in Key Category Analysis– The Key Categories are in bold* _____________________________________________________________________________________44Table 13: Approach 1 Level Assessment for GHG Inventory for 2006 in Key Category Analysis – The key categoriesare in bold* _____________________________________________________________________________________________________________46Table 14: Approach 1 –Calculation of Uncertainties _________________________________________________________________53Table 15: National Emission Reporting Source Categories in Gigagrams (Gg) ______________________________________64Table 16: Summary of Agencies/ Responsibilities ____________________________________________________________________71Table 17: Observed and GCM Projected Changes in Temperature for Antigua and Barbuda ______________________75Table 18: Observed and GCM Projected changes in Precipitation for Antigua and Barbuda _______________________76Table 19: Economic Loss/Damage of events between 1995 - 2010 __________________________________________________81Table 20: Rates and absolute changes in mean sea level pressure __________________________________________________83Table 21: Impacts associated with sea-level rise (1and 2 m) and beach erosion (50 and 100m in Antigua &Barbuda_________________________________________________________________________________________________________________83Table 22: National Drought Index _____________________________________________________________________________________85Table 23: Flood Prone villages in Antigua and Barbuda ______________________________________________________________88Table 24: Agriculture and Fishing- Relationship to the Water Sector________________________________________________95Table 25: Summary of Climate Change Impacts, Adaptation, and Vulnerability ___________________________________98
List of FiguresFigure 1: Mangrove population trends ________________________________________________________________________________17Figure 2: Annual Temperature Anomaly for Antigua (1981 - 2013) _________________________________________________22Figure 3: Monthly rainfall accumulation trends (1981 - 2015 ________________________________________________________23Figure 4: Rainfall Anomaly for Antigua 1981 -2010 __________________________________________________________________23Figure 5: Tourist arrival trends from 1985 -2005 indicating when Hurricanes occurred ____________________________25Figure 6: GDP Contribution 2001 -2009 _______________________________________________________________________________28Figure 7: Excerpt of Copenhagen Pledge ______________________________________________________________________________63Figure 8: Institutional Map ____________________________________________________________________________________________69Figure 9: Average monthly rainfall by decades. Data recorded from VC Bird International Airport _______________79Figure 10: Monthly variation in average daily maximum, minimum, and mean temperature 1995 -2014 ________80Figure 11: Average monthly mean daily temperature by decades. Data recorded from VC Bird InternationalAirport __________________________________________________________________________________________________________________81Figure 12: Category of cyclones and their number of strike types for Antigua and Barbuda (1971 - 2012)________82Figure 13: Major Flood prone areas ___________________________________________________________________________________89

x
List of MapsMap 1: Antigua Geological Profile........................................................................................................................................................... 14Map 2: Barbuda topographic map ..........................................................................................................................................................14Map 3: Watershed groupings in Barbuda ............................................................................................................................................19Map 4: Land use Patterns in Antigua .....................................................................................................................................................21Map 5: Barbuda Land use Patterns….………………………………………………………………………………………………………………..22Map 6: Drought Risk map based on watershed groupings…………………………………………………………………………………86Map 7: Agricultural zones by watershed groups……………………………………………………………………………………………….87Map 8: Antigua’s geology and hydrology…………………………………………………………………………………………………………91Map 9: Barbuda water resources…………………………………………………………………………………………………………………….93
List of Images
Image 1: Antigua and Barbuda within the global context. Source: Google Earth __________________________________13Image 2: Antigua Population and housing by Parish. Sourced from the Antigua and Barbuda 2011 Populationand Housing Census: book of statistical tables._______________________________________________________________________26Image 3: Barbuda Population and households _______________________________________________________________________26Image 4: Monthly rainfall Climatology stations in Antigua _________________________________________________________77Image 5: Monthly Rainfall Climatology for Barbuda _________________________________________________________________78

GLOSSARY
xi
AMO Atlantic Multi-decadal OscillationAOSIS Alliance of Small Island Developing StatesAPC Antigua Power CompanyAPUA Antigua Public Utilities AuthorityBAU Business as Usual (Scenario)CARIBSAVE Caribbean Sectoral Approach to Vulnerability and ResilienceCBH Central Board of HealthCCCCC Caribbean Community Climate Change CentreCH4 MethaneCO Carbon monoxideCO2 Carbon DioxideDCA Development Control AuthorityDoE Department of EnvironmentEIA Environmental Impact AssessmentEIMAS Environment Information Management and Advisory SystemEPMA Environmental Protection and Management ActGOAB Government of Antigua and BarbudaGDP Gross Domestic ProductGg GigagramGHG Greenhouse gasHa HectareHCFC HydrochlorofluorocarbonsHFCs HydrofluorocarbonsIPCC Inter-governmental Panel on Climate ChangeKg KilogramMEA Multilateral Environmental AgreementsMSW Municipal solid wasteNAMA Nationally Appropriate Mitigation ActionsN2O Nitrous Oxide
NOx Nitrogen OxidesNMVOC Non-methane volatile organic compoundsNOx Nitrogen OxidesNPDP National Physical Development PlanNSWMA National Solid Waste Management AuthorityOECD Organization for Economic Co-operation and DevelopmentPFC PerfluorocarbonsREGATTA Regional Gateway for Technology Transfer and Climate Change Action in Latin America and
the CaribbeanPPM Parts per millionSIDS Small Island Developing StateSIRMZP Sustainable Island Resource Zoning PlanSF6 Sulphur hexafluorideSNC Second National CommunicationSO2 Sulphur dioxideUNFCCC United Nations Framework Convention on Climate ChangeWIOC West Indies Oil Company
NATIONAL CIRCUMSTANCES
12
1 NATIONAL CIRCUMSTANCES
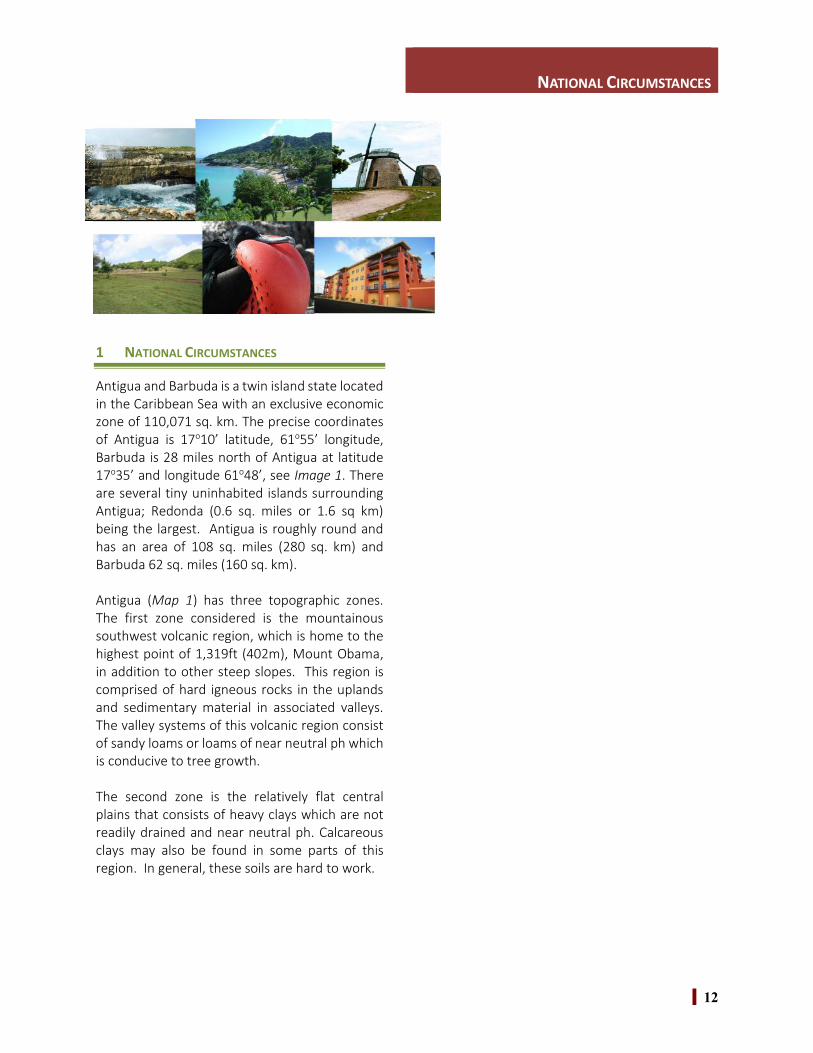
Antigua and Barbuda is a twin island state locatedin the Caribbean Sea with an exclusive economiczone of 110,071 sq. km. The precise coordinatesof Antigua is 17o10’ latitude, 61o55’ longitude,Barbuda is 28 miles north of Antigua at latitude17o35’ and longitude 61o48’, see Image 1. Thereare several tiny uninhabited islands surroundingAntigua; Redonda (0.6 sq. miles or 1.6 sq km)being the largest. Antigua is roughly round andhas an area of 108 sq. miles (280 sq. km) andBarbuda 62 sq. miles (160 sq. km).
Antigua (Map 1) has three topographic zones.The first zone considered is the mountainoussouthwest volcanic region, which is home to thehighest point of 1,319ft (402m), Mount Obama,in addition to other steep slopes. This region iscomprised of hard igneous rocks in the uplandsand sedimentary material in associated valleys.The valley systems of this volcanic region consistof sandy loams or loams of near neutral ph whichis conducive to tree growth.
The second zone is the relatively flat centralplains that consists of heavy clays which are notreadily drained and near neutral ph. Calcareousclays may also be found in some parts of thisregion. In general, these soils are hard to work.

NATIONAL CIRCUMSTANCES
13
Antigua and Barbuda - Non-Annex I PartyArea: 108 Sq. Miles 62 Sq.MilesCapital St. John’sPopulation: 86,000PopulationDensity
205 per sq. km
Head of State Queen Elizabeth IIPrimeMinister
Hon. Gaston Browne
GovernorGeneral
H.E. Dr. Rodney Williams
Annual GDP(2014)
US$1,200, 289,519
Currency Eastern Caribbean Dollars(EC$)
Language EnglishElectorateTerm
5 years
Highest Point Mount Obama (1,319ft)UNFCCCRatification
22nd February 1993
KyotoProtocol
November 1999
CopenhagenAccord
2009
Image 1: Antigua and Barbuda within the globalcontext. Source: Google Earth

NATIONAL CIRCUMSTANCES
14
The third zone can be described as the rollinglimestone hills and valleys of the North and East.The limestone areas in the North have high clay
content but possess good structure and have ahigh base structure and high base saturation witha ph of 8.2. Overall, these soils are generallyproductive. However, the limestone areas in theEast consist of complex shallow and deepcalcareous soils and the drier climate restrictsproductivity.
Barbuda is relatively flat with some low-lying hillsrising to just under 125ft (40m) in the Highlandsarea, see map 2. Slope gradients are often less
than 2 degrees which increases the island’svulnerability to climate induced coastalinundation. Barbuda is dominated by corallinelimestone rocks. On the western side of the island
Map 1: Antigua Geological Profile
Map 2: Barbuda topographic map

NATIONAL CIRCUMSTANCES
15
is the Codrington Lagoon averaging about oneand a half miles in width and separated from thesea by a narrow spit of sand. Barbuda’stopography is relatively uniform, sand dunes arepresent but the land is generally covered bylimestone and sand.
Barbuda can also be divided into threetopographic zones, although, they are not asmarked as those in Antigua. The first zoneconsists of highland limestone areas, whichconsists of hard limestone riddled with cavernsand sink holes.
The soil in this zone is a reddish clay loam. Thesecond zone is the Codrington limestone regionwhich comprises of sandy and fossiliferoussediments less crystalline than the Highlandlimestone. The soil is a brown clay loam. Thethird zone is the Palmetto Point Series thatoverlies the Highlands and Codringtonformations in coastal areas and is composed ofbeach sands and ridges with shelly horizons. Thesoil in this region is dark colouredmontmorillonitic clay.
1.1 ENVIRONMENTAL CONTEXT
Since the last report to the UNFCC, data is nowavailable up to 2010 on environmental resourcesincluding current land use patterns for thecountry.
Antigua and Barbuda’s economic and socialdevelopment is heavily dependent upon itsenvironmental resources and the inter-relatedecological functions. In Antigua and Barbuda, theinter-relationships of these ecological functionsand physical processes result in a number ofecosystems. These include:
1) Marine and Coastal Ecosystems - Sandybeaches, rocky shores, coastal lagoons,sea grass beds, coral reefs and oceanicislands and rocks.
2) Watersheds3) Salt pond Ecosystems
4) Evergreen forests5) Xerophytic (dry) forests6) Scrubland Ecosystems7) Grassland Ecosystems8) Mangrove forest Ecosystems9) Herbaceous swamp Ecosystems
Ecosystem variety is further enhanced by thepresence of caves in many sections of the island,and by natural seasonal drainage channels andponds.
The following sub-sections will highlight thestatus of key environmental resources andpotential impacts of climate change on theseresources.
1.1.1 MARINE RESOURCES
The key marine resources of the island includecoral reefs, mangroves, seagrass, and variousbeach types. These resources contribute to boththe tourism sector and food security of the island.
1.1.1.1 Coral ReefsCoral reefs are found around both islands ofAntigua and Barbuda and the estimate coveragevaries from a high of 25.4519 km2 to a low of15.820 km2. Antigua and Barbuda sits on ashallow rock-floored ‘shelf’ covered by a varietyof reefs. The edge of the ‘shelf’ is at depths of 90– 180 m where it drops to oceanic depths. Alongthe south coast of Antigua, the shelf is verynarrow; it drops to over 305 m within a mile (1.6km) of the shore. There are approximately 25.24sq. km of reef coverage around Antigua. On thewindward east coast there is better reefdevelopment due to the high wave energyproviding circulation of nutrients and flushingwith absence of fine muddy sediment. However,on the leeward west coast the reefs are poorlydeveloped because of lack of circulation andabundance of fine sediment.
There are four main types of coral reefs found inAntigua and Barbuda. The first type is the Barrierreef located on the Southern shore of Antigua

NATIONAL CIRCUMSTANCES
16
parallel to a steep slope at the edge of the narrowshelf. The second type is the Bank Barrier reefthat is predominant off shore Antigua and locatedon the North eastern and Southwestern flanks.The Fringing reefs are the third type and is foundprotecting the eastern, northern and southerncoast. Patch reefs are mainly found in Barbuda.
Coral reefs contribute to the formation andprotection of beaches. However, Antigua andBarbuda’s reefs are under continuous stress bothfrom natural and human forces. A largepercentage of the islands reefs are now deadparticularly due to the frequent passage ofhurricanes and storms. In addition to hurricanes,the improper discharge of untreated sewage intothe sea, sediment loading due to land erosion,fertilizers, dredging and boating activities havefurther added to the stress of coral reefs.
Photo 1: Dead and dying coral reefs along the North coast of theisland. Courtesy Chere Reade, 2007
The optimal temperature for reef growth is 29oC(Brown 1989). Presently sea surfacetemperatures of approximately 30oC have beenfound around Antigua and Barbuda. It is attemperatures of 30oC and above that bleachingof the corals takes place. Prolonged exposure tohigh temperatures can result in irreversiblebleaching of the corals.
1.1.1.2 SeagrassThere are extensive areas of sea grass beds inshallow waters around the coasts of Antigua and
Barbuda. Turtle grass (Thalassiatestudinum),manatee grass (Syringodiumfilforme) and shoalgrass (Halodulewrightii) are common in theseshallow coastal areas (less than 20 m deep). Thegrasses provide shelter for commerciallyimportant juvenile queen conchs(Strombusgigas) and spiny lobsters(Panulirusargus). Sea grasses also act as a sourceof food for some herbivores and also providesurfaces for epiphytic plants upon which otherspecies may graze. Calcareous algae(Halimedaspp) are found among sea grasses andare believed to be a major source of white sand.
The sea grass beds have many functions one ofwhich is to stabilize loose sand and retard coastalerosion. After intense storm surge fromhurricanes in the region it is not uncommon forsome of this sea grass to appear washed up onthe seashores. These systems are thought to beunder severe stress and will continue to be so asthe impacts of climate change increase as in thecase of Coral Reefs.
1.1.1.3 MangrovesAntigua and Barbuda has some of the mostextensive mangrove wetlands in the EasternCaribbean. During the 1980s through to 1991,mangroves occupied approximately 12 percent ofthe twin island’s total land mass with anestimated 4,900 hectares (ha) of mangrovesfound.
There are thirty-six (36) mangrove sites in Antiguaand nine (9) sites in Barbuda. In Antigua, the sitesrange from very small single layer stands of treesto large, complex swamps. In Barbuda, there isthe luxuriant 352 ha fringe mangrove ofCodrington Lagoon and narrow scrubby bordersof mangroves around salt ponds. Four kinds ofmangroves exist in Antigua and Barbuda. Theyare Rhizophora mangle (red), Avincenniagerminan (black), Laguncularia racemosa (white)and Conorcarpus erectus (buttonwood). It isestimated that in the 1980s approximately 11%of Antigua and Barbuda was covered with

NATIONAL CIRCUMSTANCES
17
wetlands. In 2001, a survey of sites estimatedthat mangrove wetlands covered only 3% of theland area in Antigua and 22% in Barbuda.
Mangroves are vital to maintaining healthy beachand reef systems. They act as natural breakersand buffer zones that protect the coastline fromerosion during storms. Additionally, themangroves act as sediment traps, protecting thereefs from being smothered by eroded soil andother geological material from upland. Finally,they act as nurseries, breeding and feedinggrounds that provide a habitat for both marineand terrestrial wildlife.
Figure 1 highlights the fluctuation of how thefrequency of extreme weather events impactsmangroves. Climate Change will significantlydisrupt the mangrove ecosystem, especially,since these areas are already under stress fromnatural (hurricanes, droughts) and anthropogenicsources (pollution & destruction caused bydredging and filling).
Recent work undertaken through a number ofprojects, including the SIRMM (Sustainable IslandResource Management Mechanism) and GEF
IWCAM (Integrating Watershed and CoastalAreas Management) projects have sought toexamine effective methods of addressing theimpacts of land based sources of pollution on themangrove systems particularly on the north westcoast of the island. In some cases, workcompleted over the last three to four years hasresulted in the reintroduction of mangroves insome critical sites such as the Mckinnons Pond.This on-going work, since the last report to theUNFCCC, is aimed at ensuring the countryundertakes activities geared towardsimprovements in resilience to climate change inthe most vulnerable areas; habitat/nursery sitesand the coastal zone.
Figure 1: Mangrove population trends

NATIONAL CIRCUMSTANCES
18
1.1.1.4 BeachesAntigua and Barbuda is known for the quantityand quality of its beaches. The island boasts 365beaches and is a prominent feature of its tourismindustry and culture for local communities. Thebeaches of Antigua and Barbuda remainattractive to hotel development and residentialrealty, increasing the contribution to the nation’sGDP.
Beaches and sand bars provide a major barrier tothe constant force of coastal erosion. Thebeaches provide a habitat for nesting turtles andother animals and plants. Unfortunately, thebeaches are illegally used as a source of fineaggregates in construction; therefore, sandmining is a significant concern in addition to thepotential impacts of Sea Level Rise and otherclimate influenced coastal erosion events.Another major source of coastal erosion is thebuilding of concrete structures too close to theshoreline and the use of poorly designed andunregulated sea defenses. Consequently, the
1 Fisheries Division. Analysis of Beach Changes in Antigua andBarbuda (2009)
island’s beaches are now under threat given boththe development challenges and climate changerelated events. An example of this can be seenbelow.
The photo above illustrates the levels of coastalerosion along the northwest coast. Beachmonitoring reports conducted by the FisheriesDivision show that between 2006 and 2008, theDickenson Bay shoreline experienced significantrates of erosion. The profile area had decreasedby 2.24m2 and the profiles were narrowing at anaverage rate of 1.09m/yr1.
Further along the north west coastline, theshoreline at Fort James also showed major
Photo 2: Concrete buildings previously built too close to the shoreline on the Northwest Coast,Antigua. Photo Courtesy of the EAG

NATIONAL CIRCUMSTANCES
19
erosion with both beach profile during 2006 -2008 with a decreased area - 17.86m2 and width(-3.39 m/yr). However, for the period 2004 –2006 corresponding values of + 19.65m2 and +4.10m were observed, respectively.
1.1.2 WATERSHED AND WATER RESOURCES
Antigua has 86 watersheds that were recognizedby the Halcrow study (Halcrow 1977). Thesewatersheds were later grouped by McMillan(1985) into 13 larger watershed groups, see map3. The two largest watersheds are Potworks (1)and Big Creek (2). The Potworks Watersheddrains the northern slopes of the southwestvolcanic region. The Big Creek Watershed drainsmain parts of the Central Plain to the east andwest. These six watersheds occupy 43 percent ofthe land area and contain 80 percent of thegroundwater supplies and 90 percent of surfacewater storage. Within these watersheds arefound 50 percent of the island's forestland, 90percent of its crop production, 60 percent oflivestock production and 70 percent of thepopulation (Fernandez, 1990). In Antigua, all thewatersheds are quite short, the largest being notmore than 11 km in length. The two largest haveareas of 4000 ha and 3,160 ha respectively.
Many of these watersheds are close to the coast,and saltwater intrusion is a major concern factorin the quality of surface storage and groundwater supplies in aquifers.There is also surface water storage in the form of10 medium to small reservoirs, 550 ponds andearth dams with the combined capacity of 6 Mm3(6000 acre-feet/1.6 billion imperial gallons).Most households have cisterns and other waterstorage containers. Additionally, there are twoDesalination Plants located on the northeastcoast and a recently commissioned ReverseOsmosis Plant in the southwest2. However, dueto the expensive nature of desalinated water it is
2http://www.apua.ag/ffryes-beach-reverse-osmosis-plant/
prioritized for domestic and tourism sectors,leaving the agricultural sector with an inadequatesupply. Additionally, during drought, desalinationaccounts for 60 to 95% of water supply.Moreover, there are growing concerns on sealevel rise and saltwater intrusion of fresh watersupplies.
Barbuda’s primary source of freshwater isshallow aquifers that underlie 650 ha of sand inthe Palmetto Point Area. However, the removalof sand deposits in the Palmetto Area has raisedthe effective water table by several feet andexposed part of the shallow fresh water aquiferand as a consequence some of the aquifer isdrying out.
Map 3: Watershed groupings in Barbuda
It should also be noted that the sand miningactivities have increased the vulnerability of theisland to saline intrusion and impacts of stormsurges. Recently, there has been a desalinationplant installed in Barbuda to meet the needs ofthe domestic and tourism sectors.

NATIONAL CIRCUMSTANCES
20
While there has been an observed increase indrought risk globally since the 1970s (Sheffieldand Wood, 2008), regional analysis of changes indrought characteristics as a result of climatechange have not been researched in great detail(Mishra and Singh, 2010). Further, datacollection on watershed and water resourcesonly began in 2001, which limits the scope oftemporal analysis.
1.1.3 LANDUSE CHANGES
In 2012, the Sustainable Island Resource ZoningPlan (SIRMZP), which serves as the NationalPhysical Development Plan (NPDP), was adoptedby Parliament for implementation. The SIRMZPnot only highlights anthropogenic and naturalforces that threaten the country’s resources butalso provides a framework to steer nationalsustainable development given the country’senvironmental situation.
The environmental situation in Antigua andBarbuda is of course directly related to itsgeographical location, its climate, its topographyas well as its geology and its economic history. Assuch, the country has acknowledged the currentand potential threats that climate change willhave on its natural resources. This is even moreimportant as the climatic parameters thatcombine with the topography of the islands arelargely responsible for the existing rich anddiverse biodiversity habitats that sustain theislands. Conversely, this increases the country’svulnerability to climate change impacts inaddition to existing developmental challenges.These challenges include:
▪ Unplanned housing,hotel and industrialdevelopment;
▪ UncontrolledLivestock grazing;
▪ Unsustainablefarmingpractices;
▪ Poor WatershedManagement
▪ Fires;▪ Pollution;▪ Dredging;▪ Sewage -
Disposal;▪ Sand Mining;▪ Boating
Activities;▪ Drought; and▪ Hurricanes
and stormsurges
Droughts and extreme weather events such asHurricanes have recently increased, becomingareas for national concern. Temperature risehave led to more severe drought conditions anddevastating hurricanes. The adjacent table nowhighlights the trends in land use types.As illustrated in the adjacent table 1, critical landusage pertinent to climate change adaptation inAntigua through food security are decreasing inpursuit of economic development. Because ofthis, the environment in Antigua and Barbudarequires a concerted effort and internationalsupport to both reduce impacts and reverseexisting negative trends. Recent land usepatterns have been captured in table 1.
Table 1:Land-use Trends in Antigua & Barbuda
Land usetype
1985 -1995
(Acres)
2010(Acres)
Trend
AntiguaAgriculturalcrops
5,501 -7,740
6,855 Decreasing
Agriculturalgrazing
26,252 -13,482
17,349 Increasing
Rural Areas 17,189 16,177 DecreasingSwamp &Mangrove
2,164 –2,142
2,161 Stationary
Invasive crop N/A 345 UnknownIndustrialdevelopment
584 778 Increasing

NATIONAL CIRCUMSTANCES
21
Recreationand HistoricAreas
1,558 400 Decreasing
Airport andMilitary
763 829 Increasing
BarbudaSettlement(and relateduses)
269 882 Increasing
Cropland,trip minequarries,gravel pits
N/A 269 Unknown
Dry Forests N/A 3,896 UnknownMangroveand Swamps
N/A 14,468 Unknown
1.1.4 CLIMATE PROFILE
Antigua and Barbuda experiences a moderatelyarid tropical maritime climate. There is a markedwet (July – November) and dry (December –April) season. There is little variation in dailyseasonal temperatures. Average monthlytemperatures are 29.6oC maximum and 23.9oCminimum. Over a thirty year period, the averagetemperatures of the coolest month (February)and the hottest month (August ) were comparedbut very little change was noted.
The 30-year average temperature for Antigua andBarbuda is 29.9oC (1981-2013). Trend analysis ofaverage temperatures by the Department ofMeteorological Services has shown a generallyupward projection, approximately +0.6oC.Additionally, in the 40-year timescale provided in
Map 4: Land use Patterns in Antigua
Map 5 Barbuda Land Use Patterns

NATIONAL CIRCUMSTANCES
22
the data, the ratio of above/below averagetemperature years was 15/25, but moreimportantly 11 of those years occurred within thelast twenty of the timescale, see Figure 2.
1.1.4.1 RainfallRainfall tends to be variable, with severedroughts occurring every 5 – 10 years.Evapotranspiration rates are high. The averagerainfall across the island in the direction ofprevailing northeast trade winds is about 33inches in the northeast to over 50 inches per yearin the southwest. The average rainfall per year(1961-1990) is approximately 46.30 inches. Panevaporation averages are about 77 inches peryear and open water evaporation is estimated at65 inches per year. Barbuda has a lower rainfallaverage. Recently, the country has been sufferingfrom the impacts of a chronic and intensifyingdrought for the last 24 months (June 2013 – June2015).
The Antigua Barbuda Meteorological Departmentuses an adjusted version of the decile (DI)method developed by Gibbs and Maher (1967).Rainfall periods of three months or more areassessed to determine whether they fall below
the 30th percentile of historical records. Thissystem of measurement is similar to that of theAustralian Drought Watch System.Drought severity indices will be captured later inthe chapter on vulnerability.
Based on Figure 3 and 4, it can be seen that thistwin island state has long been accustomed toinsufficient rainfall. However, the occurrences ofdrought are becoming more frequent. Heavyrains after periods of severe droughts lead toremoval of topsoil, formation and deepening ofgullies and general soil erosion.
Figure 2: Annual Temperature Anomaly for Antigua (1981 - 2013)

NATIONAL CIRCUMSTANCES
23
Theimpact isgreateston land previously cleared for humanconsumption. The resulting eroded material is inturn deposited downstream causing siltation andfurther degradation of coastal areas,watercourses, marine and aquatic breedingareas.
During thedroughts of 1983 –1985, less than1000mm of rainoccurred over 21months. All surfacereservoirs haddried up and thesupply of
groundwaterproduced only 1/6th
of nationaldemand, water hadto be importedfrom neighboring
islands. More recent droughts have been nearlyas severe but the availability of desalinized waterhas made the impact less visible.
Figure 4: Rainfall Anomaly for Antigua 1981 -2010
Figure 3: Monthly rainfall accumulation trends (1981 - 2015

NATIONAL CIRCUMSTANCES
24
1.1.4.2 Climate Hazards and DisastersDrought, tropical waves, depressions, storms andhurricanes are relatively common in this region.3,4
The storms form just off the coast of Africa duringthe Hurricane season (June – November) andusually pass somewhere through the leewardisland chain on a north westerly coursedepending on the atmospheric conditions. Evenif the islands do not receive direct hits the stormsurge is usually enough to create significantdamage to the coastal regions.
Antigua and Barbuda had a forty-five-yearreprieve of direct hits by dangerous storms. In1950, two severe hurricanes struck these islandsin the space of twelve days causing great damage.In 1995, Category 4 Hurricane Luis devastatedAntigua on the 4th - 5th Sept. to be followed tendays later by Category 1 Hurricane Marilyn. Thedamage was in the millions of dollars.
The forty-five year reprieve led to little attentionbeing paid to design standards and developmentin known hazardous areas. There was closure andloss of revenue in all major tourism facilities alongthe coast; 17% decreases in tourist stay overarrivals, see figure; and 7000 persons were leftunemployed. The total cost of damages was EC$346.54 million or 30.49% of the GDP at factor costin 1994. In 1998, Category 2 Hurricane Georgesstruck Antigua and Barbuda causing damageestimated atEC$200 million. In 1999, Category 2Jose hit Antigua in October andHurricane/Tropical Storm Lenny hit in November,the combined estimated damage was EC$ 247.43million.
Since 19995, Antigua and Barbuda has gone 12straight years without a hurricane makinglandfall. This, however, does not mean thatAntigua and Barbuda has been without its
3National Office of Disaster Services, Govt. of Antigua & Barbuda4 Cordell Weston, Hurricane the Greatest Storm on Earth,(Antigua Archives Committee) pp 4-85 Destin, D (2012) The Atlantic Hurricane Season Summary –2011 Special Focus on Antigua and Barbuda, Antigua andBarbuda Meteorological
challenges. In 2011, Antigua and Barbudaencountered 3 tropical storms, namely Irene,Maria and Ophelia. Although tropical storms donot bring substantial winds, the rainfall andcoastal erosion associated with them can at timeswreak significant damage. In recent years,tropical storm Omar (2008) cost US$18 million indamage6. Direct impact on the tourism arrivalhowever was minimal. The number of cruise shiparrivals was not as affected sinceaccommodations were not required and it wasless expensive for the supporting tourist relatedactivities to get off the ground again than for thehotels to be rebuilt.
Additionally, the mobility of cruise ships andhence their flexible routes allows them to avoidstorm warning zones and impacted destinationswhere the level of damage has compromisedexcursion facilities. Also note in Chart 3 thesudden drop off in both stay over and cruisevisitors that occurred just after the 9/11 Terrorattacks. In recent years however, this fragileindustry has seen some improvement with anincrease in stay over visitors for the year 2012when compared to 2011. As persons begintraveling again to the islands for vacation it iseven more important to ensure that the sun, seaand sand that they return for year after year, ispreserved as much as possible. Furtherdiscussions and analysis on the impact of climatechange on the country’s tourism industry ishighlighted in figure 5
Service.http:www.antiguamet.com/Climate/HURRICANESEASON/HurricaneSeason 2011.pdf6Antigua and Barbuda Meteorological Services (2008) The AtlanticHurricane Season Summary – 2008Special Focus on Antigua andBarbudahttp://www.antiguamet.com/Climate/HURRICANE_SEASONS/2008/Hurricane_Season2008.pdf

NATIONAL CIRCUMSTANCES
25
1.2 DEMOGRAPHIC PROFILE
The National Statistics Office conducts a nationalcensus every ten years. In 2001, the estimatedpopulation was 76,886 with a projected increaseof 9.7% by 2007 reaching a maximum of 84,330.However, following the 2011 Census, Antigua andBarbuda had a combined population of 87,774which shows a population growth of 15.6%between 2001 and 2011.
Individually, Antigua has 86,159 people while andBarbuda has a total of 1,615 people. In terms ofgender ratio, Barbuda maintained its uniquefeature of having 110 males to every 100 femaleson the island but cumulatively the gender ratio is91.4 males to every 100 females. Information onthe age structure of the population may be see inTable 2.
Table 2: Age Structure of national population
Age % of Population0 – 4years 7.7%5 -14 years 16.1%15 – 44 47.445 -64 21%Over 64 7.7%
Figure 5: Tourist arrival trends from 1985 -2005 indicating when Hurricanes occurred

NATIONAL CIRCUMSTANCES
26
As shown in Image 2, the urban Parish of St.John’s house the greatest totalpopulation (P) and households (H)while Barbuda has the leastnumber of people in the largestland area. Male (M) to female (F)ratio are also highlighted.
Image 2: Antigua Population and housing by Parish. Sourced from the Antigua and Barbuda 2011Population and Housing Census: book of statistical tables.
Image 3: Barbuda Population and households

NATIONAL CIRCUMSTANCES
27
1.2.1 SOCIO-ECONOMIC INDICATOR
Antigua and Barbuda has a labour force of 45,260people. There are more persons employed withinthe Tourism sector and its related services, thanany other sector. The estimates for this sectorvary seasonally based on industries such asyachting, which brings employment duringspecial yachting events and through seasonalusage of the docks. The Construction sector alsohas a high level of workers which would correlatewith the increase of the contribution to the GDPby this sector. Also, as expected, Agriculture hasone of the lowest numbers of workers. Thefollowing sections expand on the social indicatorsfor the country with emphasis on poverty levels,health care, education and other socialamenities.
1.3 POVERTY ESTIMATES
The indigent population was estimated at 5% ofthe population, constituting 4.4% of thehouseholds in the country. An indigent personwas defined as someone whose expenditure wasbelow EC$2,449 (US$917) per annum, since thisamount should provide an adult male with 2400kilocalories per day. The Poverty Line wasestimated at EC$6318 (US$2366) per annum(adjustments made for non-food expenditure).18.4% of the population fell below the povertyline, indicating that 18.4% of the population isunable to meet basic needs. However, it iscustomary to include into the poverty line, thepercentage of vulnerable persons, that is,persons who are likely to be at risk of falling intopoverty if there is a shock to the economy, whichmay occur with climate change.
7 http://www.who.int/gho/countries/atg.pdf?ua=1
Therefore, it is estimated that the cumulativetotal of 28.3% of the population is estimated tobe at risk. These results are amongst the lowerrange when compared to other Caribbeancountries. Spatial differentials in poverty are alsoevident in Antigua and Barbuda. The poorestdistricts are St. John’s City (22%) and St. John’srural (18%); followed by St. Philip (26%); St. Paul(16%); St. Peter (15%); St. Mary (14%); St. George(12%); and Barbuda (11%).
The Government of Antigua and Barbuda isdeveloping its social safety net but the burden ofthe fallout of the international economic crisisand rising debt that is over 100% of GDP makesthe situation worrying. It is obvious that majorsocial and economic transformation is required.Based on the current developments involvingclimate change and its impact on the country’smost vulnerable, such issues will have to beaddressed on the basis of current climate changediscussions.
1.4 HEALTHCARE
Antigua has one main public hospital with 164beds, which struggles to meet the growingdemands of the public. Barbuda also has onepublic hospital. However, the increases in publicprimary care clinics in many of the villages andrural parishes around the island are helping with
the load of patients requiring assistance. Antiguaalso has four private clinics that are able tohospitalize patients and at least two otheroutpatient clinics that can provide X-rays, MRIsand Cat Scans at a cost. WHO (2012)7 indicatesthat the average per capita total expenditure onhealth is approximately US$700. There are manyprivate doctors and specialist in a wide variety offields. Many medical laboratories exist that cancarry out a large number of diagnostic test andthe option to ship samples to specialized

NATIONAL CIRCUMSTANCES
28
laboratories overseas is always readily available.The variety of health care available to Antiguansand Barbudans has enabled this country to havea reasonable life expectancy rate at 72 years formales and 74 years for females. The top twocauses of death within the islands for the years2000-2004wereMalignantNeoplasmsand HeartDiseases. Inaddition todealing withhealthproblems, theGovernmentoperates apreventivemedicineprograms andpromoteshealthylifestyles
Studies haveshown that climate variability have a directimpact on the epidemiology of vector-bornediseases8. Mosquitoes are the primary agents forthe transmission of most vector borne diseases,and are sensitive to temperature changes.Increases in water temperature shortens thetime taken for mosquito larvae to mature andincreases the capacity of reproduction. Also, inwarmer climates, female mosquitoes digestblood more rapidly thereby increasing thefrequency for feeding and transmission.
Like the rest of the Caribbean islands9, Antiguaand Barbuda has seen an increased emergence ofvector borne diseases. Most recently, there hasbeen an increase in Chikungunya, and Denguecases on the island which has both economic andsocial ramifications.
8 WHO (2000) Climate Change and Vector Borne Diseases:regional analysis.http://www.who.int/bulletin/archives/78(9)1136.pdf
Within the last two years, outbreaks of vectorborne diseases have impacted the tourismindustry as health advisory warnings detervisitors from the island.
1.5 ECONOMIC PROFILE
The economy of Antigua and Barbuda is servicebased. Tourism and government servicesrepresent the key sources of employment andincome. Tourism accounted for more than half ofthe GDP in 2005 and is also the principle earnerof foreign exchange. The situation has notchanged much for 2011 to 2012. However, thetourism industry is significantly vulnerable toclimate hazards as previously mentioned. Assuch, with the forecasted increases in hurricaneintensity, the island’s economy is also vulnerableto both direct and indirect impacts of climatechange.
Antigua and Barbuda’s economic performancehas fluctuated significantly. In the 1980’s average
9http://carpha.org/Portals/0/articles/documents/CARPHAContinuesBattleDengueChikVZika.pdf
Figure 6: GDP Contribution 2001 -2009

NATIONAL CIRCUMSTANCES
29
growth was estimated at about 7%, while in the1990’s growth slowed to approximately 3.3% andthen between 2000-2004 it further decreased toabout 2%. This was as a result of severaldevastating hurricanes between 1995 – 1999,which led to a declined economic growth rate.However, the growth rate seems to be on anupward swing again. In 2005, Antigua andBarbuda had a GDP of US$ 874.9 million, with agrowth rate of 7.07 and an inflation rate of 2.10.
Between 2005-2008, growth averaged 7.1%primarily as a result of activities related to thehosting of the Cricket World Cup. From 2009-2011 with the onset of the global financial crisis,the economy experienced an average contractionof 7% per annum. In 201110 there was animprovement in the GDP which was USD$1.125billion, with a growth rate of (0.98)%. Theprojected GDP for 2012 by the ECCB was US$1.18billion with a growth rate of 4.03%. Efforts todiversify the economy by encouraging growth intransportation, communications, internetgambling and financial services may have acted asa catalyst to the renewed economic growth.
GDP per capita for 2011 was made up ofcontributions from various sectors as follows:Transportation and Communications (11.89%);Wholesale and Retail (14.17%); Construction(8.9%); Financial and Business Services (10.28%);and Hotels and Restaurants (13.49%).Comparatively, the Agriculture sectorcontributed only 1.15% to the value of GDP in2011continuing a steady increase since 2007. Themain direct and indirect contributor to GDP istourism which is the most significant economicdriver for the economy. Like many other SIDS inthe Caribbean, the economy of Antigua andBarbuda has transitioned from an agrarian to amore service oriented economy within the last 25years, but the economy lacks diversity andtherefore resilience. The projected growth for2012 is predicated on expected expansion insome key sectors such as construction,
10ECCB GDP data 2000-2014
transportation, and hotels and restaurants. Thehotels and restaurants sector, which contributes15.6% to the GDP, is expected to grow by about2.0% which correlates to an almost 3.0% increasein stay-over arrivals. Activity in the constructionsector is projected to increase by 1.6 percent in2012. One factor that has helped to improveperformance in this sector is the ConstructAntigua Barbuda Initiative (CABI), which offersconcessions and incentives for residentialconstruction.
As of May 2011, the Government mandated theelaboration of a Medium-Term StrategicDevelopment Plan (MTSDP) as an update to theNational Strategic Development Plan (NSDP). TheMTSDP will be underpinned by the followingstrategic objectives:
▪ Fiscal Balance▪ Education for All▪ Enhancing our Social Development
Agenda▪ Preserving our environment and
building a stronger physicalinfrastructure
▪ Economic sustainability▪ Antigua and Barbuda – the Best Brand
Despite all the challenges between 2005 to 2010however, in 2011, Antigua and Barbuda wasranked 60th on UNDP’s Human DevelopmentIndex making it the highest ranked in the OECS asSaint Kitts and Nevis which was ranked 54th in theprevious report has now fallen to the 72nd place.This high human development rank is based on alife expectancy at birth of 72.6 years and GDP percapita of US$15,521 in 2011. The country also hasa literacy rate of 99.0% based on a 2008 surveycompleted by the World Bank. Such a highstandard of living makes the twin island one ofthe three most attractive places for intra-regionalmigrants within the GEF SGP’s sub-regionalprogramme area, with the others being Barbadosand Saint Lucia.

NATIONAL CIRCUMSTANCES
30
1.5.1 TOURISM AND THE ECONOMIC GROWTH
Tourism is Antigua’s most important productivesector, and was in 2007 estimated to account for40 % of all employment, 85 % of foreign exchangeearnings, 52 % of total investment and 70 % ofGDP (directly and indirectly). In 2012, the IndexMundi showed that tourism accounted for almost60% of the country’s GDP and 40% ofinvestments. Total earnings, and tourist arrivalssaw a strong growth in 2007 (up 26.5% from2006), but has since declined with the economiccrisis. For Antigua and Barbuda, economic growthin the medium term will continue to depend onincome growth in their tourist markets, the USand UK. There are signs of recovery however.April 2012 saw the highest hotel occupancy rates(63.8%) since 2008 surpassing 2010 (58.4%) and2011 (61.3%) for the same period.
1.5.2 AGRICULTURE AND THE ECONOMY
Agriculture at one time was one of the majorcontributors to the GDP because of large scalesugar production along with its by-products,molasses and rum. Several factors caused itsdecline namely the shrinking internationalmarket, inadequate water (severe droughts),destructive hurricanes and the inability of thesector to lure labour forces away from thetourism sector which proved more immediatelylucrative. However, some agriculture productionstill occurs. Antigua and Barbuda's agriculturalsector accounted for 3.3% of GDP in 2007, in2010 this had decreased to between 2.5 and 3 %.
Agricultural production is focused on thedomestic market and is further constrained by ashortage in labour. A labour force survey from2004 found near full employment, atapproximately 4% unemployment. This haschanged however. Recent information on the
11 GATE: Government Assisted Technology Endeavour:http://gateantigua.ag/ictcadets_background.php
GATE11 website shows that The “Unemploymentfigures in Antigua and Barbuda currently stand atan estimated eleven percent (11%) and of thiseleven percent, 19.9% represent youth ages 15-24”. Not many of these individuals seeminterested in the agriculture sector however asthe tourism and construction sectors competewith higher wages. Furthermore, local productionhas not been able to meet local demand all yearround. There are less than 300 acres of sea islandcotton under production. The major cropsproduced are vegetables, food crops, vine fruitsand tree fruits. The Local Antigua Black Pineappleis one of the tourist favorites. However, themarket for most agricultural products isdomestic. Livestock production (5000 cattle,28,000 goats, 15,000 sheep)12 is difficult becauseof severe droughts and low international marketvalue of the animals even though they areorganically grown. Owners have taken toallowing their animals to stray unimpeded. Thispractice has lead to severe environmentaldamage; goats have debarked and destroyedtrees on hillsides and sheep have overgrazed. Thecombined effects have lead to land slippage andloss of top soil during heavy rains.
Fisheries make the greatest contribution to theagricultural sector with its Lobster and fishexports. The fishing sub-sector grew by almost 5% from 2006 to 2007, reflecting new facilities forfisheries in St. John. The sub-sector contributedalmost 52 % of the sector’s output. Barbudadepends significantly on its fishery sector as asource of income. In an effort to protect thissector and also address the issues affecting thesector as a result of climate change thegovernment has sought to integrate this sectorinto its biodiversity protection plan.
12Veterinary & Livestock Division, Ministry of Agriculture, Govt.of Antigua & Barbuda, June 2007

NATIONAL CIRCUMSTANCES
31
Box 1. Vulnerability and Adaptive Capacity Issueswithin the Fisheries Sector (adapted from Nurse,2008)
Pressure from fishing and other marine activities
Coastal development, particularly thedevelopment of hotels and marinas
Pollution both from land based and marinesources
Fluctuation within the global economy andmarket conditions
Increasing incidents of foreign vessels fishingwithin the EEZ without the necessarypermissions
Observed and projected negative impacts on thesector due mainly to stresses on critical habitatssuch as coral reefs, mangroves and sea grasses
Linkage between ocean warming, theproliferation of harmful algal blooms and variousdiseases
Dependence of fisher folk on the sector foremployment, revenue generation and humanwell-being
In Antigua and Barbuda, many fishers reside andoperate in vulnerable, low-lying coastal areaswhich exposes their physical assets (e.g. boats,gear, homes) to climate-related events such ashurricanes, storm surge and sea-level rise
While the fisheries sector has demonstratedconsiderable resilience to climate variability inthe past, factors such as lack of consistentgovernmental control, access to capital onreasonable terms, weak fisher folk organizationsand consequently low bargaining power willcompromise adaptation capacity in the future
Lack of insurance and other institutional supportto enable the sector to rebound in the aftermathof extreme events, which are projected tobecome more frequent and/or intense in thefuture.

NATIONAL CIRCUMSTANCES
32
1.5.3 MANUFACTURING AND THE ECONOMY
GDP statistics from the ECCB showed thatmanufacturing is declining. In 2010 this sectorcontributed 2.54% of GDP and 2.57% in 2011.However, in 2012 there was an estimateddecrease to 2.32% partly due to high cost ofproduction (mainly labour utilities and high portand shipping charges), small local market andintense regional and international competition.Most of the raw materials for manufacturing haveto be imported. However, paints, furniture,household fitting and garments are stillmanufactured along with soft drinks, water rum,and a nascent cottage agro processing sub sector.
1.5.4 FINANCIAL SERVICES SECTOR AND THEECONOMY
Antigua and Barbuda, like other Caribbeanislands, has a high financial sector ratio relative toits size (10 per 100,000 inhabitants, particularly inthe case of insurance)13. The sector contributesan estimated 10.28% of the GDP (2011). Thereare approximately 60 institutions that make upthe local sector. These institutions include banks,credit unions, insurance companies, pensionfunds, and any other firms whose main or partialoperations involve financial intermediation.Additionally, there are significant off-shorefinancial services through which Antigua andBarbuda domiciles over 4,20014companies.Although Antigua and Barbuda enjoys a verystable currency as a member of the EasternCaribbean Currency Union (ECCU) which isregulated by the Eastern Caribbean Central Bank(ECCB) there have been challenges recent yearswhich have put considerable strain on thenational economy and its growth projections.
13 IMF (2013) Caribbean small states: challenges of high debtand low growth.https://www.imf.org/external/np/pp/eng/2013/022013b.pdf14 Source: 2013 Budget Statement (2012), Ministry of Finance,Antigua and Barbuda15 Implementation Completion and Results Report (P108058) ona Grant to the Caribbean Catastrophe Risk Insurance Facility”(2012) World Bank
As is characteristic of SIDS, Antigua and Barbudaexperiences a disproportionate level of risk fromnatural disasters including those related toclimate change. To this extent the countries ofthe Caribbean along with the support of somedevelopment partners established theCatastrophe Risk Insurance Facility in 2007.Experiences by various SIDS have shown thatmajor catastrophic events can easily cause directlosses in excess of 100% of GDP (eg. HurricaneIvan cost Grenada 203% of GDP in 2004 andearthquake in Haiti cost 114% of GDP in 2010)15.
Globally, the financial services sector has seenrising additional costs brought on by extremeclimate events16. Private property and healthinsurance rates have increased globally due tothe negative effects of climate change such asflood damage, hurricane damage to property andland, storm surge damage to coasts andincreased temperatures causing health problemssuch as hyperthermia in both humans andanimals.
Nationally, research highlights that Antigua andBarbuda’s financial services sector is marginallyaware of climate change risks however, thesector is significantly vulnerable owing to the roleof reinsurance, risk assessment methodologiesand minimal government and politicalengagement17. An increase in insurancepremium levels is the usual response to anincreased frequency of extreme weather events.Specifically, in discussions with Sagicor18, one ofthe leading insurance companies in Antigua andBarbuda, between 1989 and 1995 when a seriesof hurricanes impacted the islands, rates wentfrom as low as EC$4/1000.00 for concrete
16 Barthel and NeuMayer (2011) A trend analysis of normalizedinsured damage from natural disasters. Climate Change, 113:215-22317 Andrew (2015) Analyzing the responses of the financialservices sector to climate change risks in the Caribbean: a casestudy of Antigua and Barbuda. MSc dissertation, University ofExeter, U.K.18 Telephone Interview with Mr. Keith Herbert, Manager SagicorGeneral Insurance Company

NATIONAL CIRCUMSTANCES
33
structures to EC8.00/1000.00. This increased toup to EC$18.00/1000.00 by 2000 for concretestructures and up to EC$28 for woodenstructures. However, during 1989 through to2005 when the island experienced a consecutiveseries of hurricanes, and storm surges, somereinsurers retracted coverage for the island,which led to the closure of some local insurers,and the inability of other insurers to meet claims.This not only left the sector vulnerable but alsoaffected the affordability and availability ofinsurance as local insurers adopted discriminatepolicies as a means of adaptation.
The country has not been in the direct path of anymajor hurricanes or natural events and as suchrates have actually decreased to an average ofEC$13/1000.00 currently. It is expected thatgiven the island’s annual threat to hurricanes,and storm surges, the cost of insurance couldbecome a serious impediment to investmentsand the financial sector.
1.6 POLITICAL STRUCTURE AND GOVERNANCE
Antigua and Barbuda is a constitutional monarchywith a British-style parliamentary system ofgovernment. The country has a bicameralparliamentary system comprising a Senate(Upper House) and a House of Representatives(Lower House). Modern Antigua and Barbudaachieved its full independent status in 1981. TheQueen of England like in many CommonwealthCountries is the Head of State and is representedby the Governor General who is a citizen of thecountry.
Presently there are 17 seats in the House ofRepresentatives with 14 (including 1 fromBarbuda) controlled by the ruling Antigua LabourParty, and 3 controlled by the leading oppositionparty, the United Progressive Party.
The island of Barbuda is governed by the BarbudaCouncil which takes its mandate from the
Barbuda Local Government Act CAP.44 of theLaws of Antigua and Barbuda.
The government has three branches, which arethe Legislative, the Executive and the JudicialBranch. The Legislative Branch consists of theHouse of Representatives and the Senate. TheHouse of Representatives has seventeenmembers and is responsible for introducinglegislation. The seventeen-member Senatereviews and gives assent to proposed legislation.The members of the House of Representativesare elected by popular vote (constitutionallymandated every five years, while the members ofthe Senate are appointed. The Governor Generalappoints the members of the Senate. Eleven ofthe members of the Senate are appointed underthe advice of the Prime Minister, who is theleader of the party that holds the majority ofsupport of members in the House ofRepresentatives. One of the eleven must be anative Barbudan. Four members of the Senateare appointed under the advice of the leader ofthe Opposition who is recognizedconstitutionally, one member of the Senate isappointed under the advice of the BarbudaCouncil, and one member of the Senate isappointed as an independent memberrepresenting business at the sole discretion of theGovernor General.
The Executive Branch is derived from theLegislative Branch. This branch consists of theCabinet headed by the Prime Minister. Themembers of Cabinet are appointed by the PrimeMinister and must be members of either theHouse of Representative or the Senate. TheJudicial Branch is independent of the other twobranches, with judges and appeal court judgesappointed by an independent judicialcommission as part of a sub-regional judiciaryserving all the members of the O.E.C.S. Themagistrates will shortly be appointed by thisregional commission replacing the presentarrangement of their appointment by theAttorney General who is a member of theExecutive Branch.
NATIONAL CIRCUMSTANCES
34
The judiciary consists of the Magistrates Court forminor offences and the High Court for majoroffences. Beyond the High Court is the EasternCaribbean States Supreme Court, whosemembers are appointed by the OECS. The finalcourt of appeal for Antigua and Barbuda is theJudicial Committee of the Privy Council, locatedin London. However, the Caribbean Court ofJustice has been proposed to replace the JudicialCommittee of the Privy Council as the final courtof appeal. The Court was created in 2003 underthe 2001 Revised Treaty of Chaguaramas of theCaribbean Community (CARICOM). The treaty isan instrument for the establishment of theCaribbean (CARICOM) Single Market andEconomy (CSME) and was signed by the variousCARICOM heads of government.
In addition to these formal governmentalstructures, Civil Society is represented by anumber of interest -based organizations, varyingfrom service clubs to Non- GovernmentalOrganisations and Community BasedOrganisations and in certain cases Faith BasedOrganisations. According to the records from theCommunity Development Division there are 129currently registered groups within Antigua andBarbuda. Of that number 47 are service clubs.This represents a significant increase in NGO/CBOactivity as in 2004 a survey conducted by theUniversity of the West Indies only identified 20groups.
At the regional and international level, Antiguaand Barbuda is a member of the Organisation ofEastern Caribbean States, the CaribbeanCommunity, the Eastern Caribbean's RegionalSecurity System, the Commonwealth of Nations,the United Nations, the Organization of AmericanStates, and the World Trade Organization.
Antigua and Barbuda is also party to severalConventions apart from the UN frameworkConvention on Climate Change (UNFCCC) and itsKyoto Protocol. These conventions are theUnited Nations Conventions to Combat
Desertification (UNCCD), the Convention onBiological Diversity (CBD), the Convention onInternational Trade in Endangered Species ofWild Fauna and Flora (CITES), the ViennaConvention and its Montreal Protocol onSubstances which deplete the Ozone Layer andthe Basal Convention on the TransboundaryMovements of Hazardous Wastes.
1.6.1 POLICY, LEGAL AND INSTITUTIONALFRAMEWORK
Technological changes and increasingglobalization require countries to review andupdate the legal and judicial framework neededto effectively compete internationally, meet therequirements of multilateral agreements andinspire the population to go beyond compliancetoward leadership. Since Johannesburg, thecountry has been moving towards developingoverarching coordinating legislation (instead ofrepealing current legislation and thus having todeal with the difficult situation of the institutionalfallout).
In the area of the Environment, prior to 2015, theexisting legislative framework consisted of overforty pieces of legislation, which governedvarious areas of sustainable development. Itnaturally follows that the institutionalarrangements were also fragmented. Anadditional factor of this design was that theinstitutional arrangements were such that inseveral key areas of natural resource usage thelegislation was designed to give power toagencies that are the major resource users toregulate themselves. This framework oflegislation did not provide any criteria thatconsiders sustainability, environmental,economic or social protection, by which theseresources should be exploited. Consequently,this compounds the vulnerability of the island toclimate change impacts in addition to itsdevelopmental challenges.

NATIONAL CIRCUMSTANCES
35
To resolve this issue, the Government decidednot only to keep current legislation andinstitutions in place but to create a newinstitution that will be responsible forcoordination. This creates a flexible and robustsystem that will allow for the integration of newpolicies both at the national and internationallevel into national plans and programs and moreimportantly into the national budgetary process.
The policy and legislative mandates wereintegrated into various policy documents. Theseinclude the SIRMZP and its enabling legislation,the NBSAP, National Environmental ManagementStrategy (NEMS), the Environmental Protectionand Management Act 2015, the SustainableIsland Resource Fund (SIRF) and the mediumterm economic development strategy. As itspecifically relates to the issue of Climate changeit is worth noting that this issue commands anentire section of the newly enacted EnvironmentProtection and Management Act (EPMA) 2015.
The SIRMZP is supported by the Physical PlanningAct (2003) and the NEMS by the EPMA 2015.These documents also contain provisions for theintegration and implementation of MEAs but areconditioned upon sustainable and adequateinternational financing, as is the case of thecountry’s Intended Nationally DeterminedContributions (INDCs) for the COP21 Parisagreements, which will be discussed later in thereport.
1.7 ECONOMIC AND POLITICAL CHALLENGES
The economic and political challenges are many,but the major ones can be identified as follows:
• The lack of economic resilience causedby the dependence on one primary driverfor the economy, i.e., tourism;
• The national debt as a percentage of GDPis well in excess of 100% and is way abovethe recommended level of 60%;
• The increase in violent crime;• The impacts of poverty;
• The rising occurrences of environmentaldeterioration in both the terrestrial andmarine environments;
• Vulnerability to natural disasters, inparticular annual hurricanes; and
• The unpredictability of sustainableinternational financing to implementMEAs.
• The need to build and nurture a strongerrelationship between the people ofAntigua and Barbuda.
These challenges though not insurmountable,can only be addressed with an aggressiveintegrated plan of action driven by a shared visionof development and a people centered approachto sustainable development.
1.8 STRATEGIC APPROACHES
Based on the existing economic and policy issuesas well as the growing problems with increasinglyscarce resources including land availability, thegovernment had decided to develop a strategythat optimizes resource usage for agricultural andforestry development. This forms part of itseconomic diversity efforts as well as a means toaddress climate change issues. Towards this end,an agro-forestry strategy to integrate agricultureand forestry as mutually compatible andcomplementary is being considered. It thereforeprovides a scope for joint development that canbring about mutual benefits. The approach willbring about a larger productive base foragriculture and forestry and allow for a widerrange of agro-forestry enterprise mix, optimizeland resource utilization, particularly land andenhance the income generating potential of agro-forestry investments. These approaches togetherwith the policy thrusts will provide the enablingenvironment to sustain and enhance the growthof the agricultural sector and become moreglobally competitive.

NATIONAL CIRCUMSTANCES
36
1.9 SUMMARY
Antigua and Barbuda, as a SID, is extremelyvulnerable to the impacts of climate change givenits topography, climate and existing state ofenvironmental resources. This vulnerability isfurther enhanced by the island’s challenges facedin its pursuit of economic and socialdevelopment. However, the country has madegreat strides in policy and institutionalarrangements for the protection of its naturalresources and in its social programs. But thesehave come at a significant price and the countryhas had to enter into an IMF program torestructure its finances. Consequently,international support is heavily relied upon tomeet the island’s adaptation and mitigationtargets, which will be highlighted later.
During the consultations for this report many ofthe participants see the way forward for thecountry as being via a low carbon approach. It’swell known however that the necessary financesand political will to get there will requiretremendous efforts from the internationalcommunity. Therefore, the country is looking tothe international community to honourcommitments made under the UNFCCCparticularly those made under the CopenhagenAccord, the recent INDC’s and other MEAs toassist Antigua and Barbuda (and other non-AnnexI parties) in obtaining the necessary resourcesthrough financial mechanisms and technologytransfers to achieve a resilient low-carboneconomy and sustainable development.
At the national level the Government continuesto work at ensuring that the relevant institutionalsupport required are in place to facilitate thenecessary legislative and policy initiatives.Activities undertaken to facilitate the country’sefforts in meeting its obligations under theconvention are discussed later in the report.
GHG INVENTORY
37
2 GHG INVENTORY
Part of the requirements of the UNFCCC for Non-Annex 1 countries, is to prepare regularGreenhouse Gas Inventories. The first and secondGHG inventories were carried out for the years1990 and 2000 respectively. The presentGreenhouse Gas (GHG) Inventory report hasbeen prepared for the year 2006. This GHGInventory was prepared using the 2006 IPCCGuidelines. The sectors reflected in this chapterare the energy sector, industrial sector,agriculture sector, forestry and other land usesector, and the waste sector.
Within the report, each sector was consideredseparately with a brief description of the sector,along with the methodology clearly delineatingthe methods of data collection and the relatedquantities of specific GHG emissions. The gasesreported on were CO2, CH4, N2O, NMVOC andHFCs.
The following section of this report includes KeyCategory Analysis. The purpose of the KeyCategory Analysis is to identify those areas thatcontribute greatly to the total GHG emissions.IPCC Guidelines suggest that it is good practice toconduct Key Category Analysis so as to focusresources on those areas that produce most GHG
emissions. Uncertainties were then consideredwithin each sector. Mainly qualitative uncertaintyanalysis was carried out on activity data andquantitative uncertainty analysis on defaultemission factors used.
Recommendations were made for each sector toimprove the quality of data collection for futureGHG inventories.
Finally, the policies that have been put in place toreduce GHG emissions by 2020 were noted.

GHG INVENTORY
38
2.1 ENERGY SECTOR
As previously captured, Antigua and Barbudaimports 100% of its petroleum requirements.Its only supplier of petroleum based fuel to thepopulous is West Indies Oil Company (WIOC),which is a company owned by 75% privateinterests and 25% by the government of Antigua& Barbuda. The majority of the fuel imported isused primarily for electricity generation andtransportation (vehicular and aviation) with avery small percentage allocated for domestic andcommercial consumption.
For the Energy Sector, GHG emissions areestimated using both the Reference Approach(based on import data) and the Sectoral approach(based on consumption). Energy sector activitiesin Antigua and Barbuda are exclusively due to fuelcombustion.Fugitive emissions (e.g., from primary andsecondary fossil fuel production) are null and voiddue to no refining activity.
2.1.1 METHODOLOGY –ENERGY SECTOR
Country-specific energy sector activity data wereprovided by the following agencies andbusinesses:
West Indies Oil Company (WIOC) providedinformation on the quantities of liquefiedpetroleum gas (LPG), motor gasoline, diesel,jet fuel and fuel imported.
Antigua Public Utilities Authority (APUA)provided fuel consumption data forelectricity generation including that fromAntigua Power Company (APC).
The National Statistics Division, Governmentof Antigua and Barbuda provided import datafor lubricants and products. This Divisionused to provide data on fuel imported buthave ceased to collect this data.
West Indies Oil Company provides fuel to allthe Marinas, all Gas Stations and the Airportbut has indicated that they do not have datathat is clearly defined for them. Interviewing,some Gas Station managers and Marinamanagers have shown that data of quantitiesof fuel sold by fuel type annually is not readilyavailable.
Data on charcoal consumption was obtainedfrom interviews with all known charcoalproducers.
Default values for emission and conversionfactors were taken from the 2006 IPCCGuidelines.
2.1.2 EMISSIONS
The carbon dioxide emissions by the referenceand sectoral approach may be seen in Table X.
Table 3: CO2 Emissions in Antigua and Barbuda from theEnergy Sector – Inventory Year 2006
Sectoral Approach(Gg CO2)
Reference Approach(Gg CO2)
875.780 856.798
The non-CO2 emissions from the Energy Sectormay be seen in Table 2-2.
Table 4: Non-CO2 Emissions from Antigua and Barbuda –Inventory Year 2006
Sectoral Approach(Gg CH4)
Reference Approach(Gg CH4)
0.036 0.007

GHG INVENTORY
39
2.2 INDUSTRIAL SECTOR
Antigua & Barbuda is a mass importer withlimited production of chemicals, as a result theindustrial sector is small and fragmented. There isno mineral or mining activity, save for buildingmaterials from several quarries. The refrigerationand air conditioning business are currently themost significant GHG contributors of this sector.It was found that there was limited recorded dataon sale activity and use by many providers in thisarea of the business. Consequently, line,supervisory and management staff inmaintenance departments or subject matterexperts from service providers supplied much ofthe information.
2.2.1 METHODOLOGY
Data specific to Antigua and Barbuda was takenfrom the following sources:
Estimated lime use from the Central Board ofHealth (CBH) because Antigua Gases Ltd thatactually produces lime as a byproduct wereunable to provide data as to the productionquantity.
Consumption of carbonates (limestone anddolomite) from ceramic and pottery makers
Quantity of lubricants (oil and grease) andparaffin wax imported from the NationalStatistics Division
Quantity of refrigerants imported was takenfrom the National Statistics Division.
Quantity of refrigerants used commercially,schools, hospitals etc.
Quantity of Nitrous Oxide used from MedicalPractices.
Bread and cake production from flourimporters and local bakeries.
Alcoholic beverage production from localalcohol manufacturers.
Detailed methodology may be found in theappendices. Default values were used from the2006 IPCC Guidelines and in the majority of casesthe Tier 1 method was used to estimateemissions.
2.2.2 EMISSIONS
The emissions are detailed in Table 5 andsummarised in Table 6.
Table 5: Detailed Emissions in Antigua and Barbuda fromthe Industrial Sector – Inventory Year 2006
Subsector & Content Type and Quantity ofEmission Gas (Gg)
Mineral IndustryHydraulic Lime CO2 – 0.0142Ceramics Limestone CO2 – 0.0017Ceramics Dolmite CO2 – 0.0003Total 0.0162
Non-Energy ProductsLubricant (Oil) CO2 – 0.5503Lubricant (Grease) CO2 – 0.0028Paraffin Wax CO2 – 0.0050Total 0.55811
Substitutes for OzoneDepleting substances- SolventsAerosols HFCs – 114.0337Other Product UseMedical Applications N2O – 0.0027Alcoholic Beverages NMVOC’s – 0.0311Bread Production NMVOC’s – 0.0035
GHG INVENTORY
40
Table 6: Summary Emissions in Antigua and Barbuda fromthe Industrial Sector - Inventory Year 2006
Type of Emission Gas Quantity of Emission Gas (Gg)CO2 0.5743HFC’s 114.0337N2O 0.0027NMVOC’s 0.0346
2.3 AGRICULTURE SECTOR
Within Antigua and Barbuda, the AgriculturalSector consists of mainly livestock productionalong with fruit and vegetable production. TheGreenhouse Gases of concern are mainlymethane, direct and indirect nitrous oxide, andcarbon dioxide.
Methane is the main greenhouse gas emissionthat is emitted from livestock. Ruminants,especially cattle have high methane emissionsdue to their high enteric fermentation rates.Carbon dioxide emissions from livestock areconsidered negligible and were therefore notincluded in the inventory.
Livestock manure is the source of twogreenhouse gases, mainly methane, direct andindirect nitrous oxide. However, methaneemissions are considerably smaller than thatfrom enteric fermentation and will varydepending on the type of livestock and manuremanagement systems used. In most cases as withthe ruminants (cattle, sheep, goats, deer) andlarge livestock (horses and donkeys) manure isleft in the open fields to decompose. However, inthe case of poultry and swine, these animals areintensively reared and the manure managementis different. In general for poultry, the manure(both liquid and solid) is placed in deep pits andleft open to dry and in some cases quicklime(calcium oxide and calcium hydroxide) issprinkled over the manure. In general for swine,the manure is washed out of the pens and left todry in the back of the structure in the sun.
Carbon dioxide, methane, direct and indirectnitrous oxide emissions are expected fromagricultural soils. But because soils in this countryare not limed, the expected carbon dioxideemissions were nil. However, urea fertilizers areused, therefore the carbon dioxide emissionswere considered in this area. Rice cultivation isnot practiced due to insufficient naturalresources; therefore this expected source ofmethane does not exist. Unfortunately,insufficient data was available to determinedirect and indirect nitrous oxide emissions frommanaged soils.
2.3.1 METHODOLOGY
The data used to determine GHG emissions camefrom the following sources:
The Veterinary & Livestock Division – Ministryof Agriculture provided all data regardingLivestock and Manure Management.
The Agricultural Extension Division, Ministryof Agriculture provided all data regardingagricultural soils, and;
The National Statistics Division provided dataon fertilizers imported. Specificmethodologies may be found in theAppendix. Default and emission factors weretaken from the 2006 IPCC Guidelines.
Specific methodologies may be found in theAppendix. Default and emission factors weretaken from the 2006 IPCC Guidelines.

GHG INVENTORY
41
2.3.2 EMISSIONS
The carbon dioxide, methane, direct and indirectnitrous oxide emissions from the agriculturalsector may be found in Table 7. The summarizedemissions may be found in Table 8.
Table 7: Detailed emissions in Antigua and Barbuda fromthe Agriculture Sector – Inventory Year 2006
Subsectors Type and Quantity ofEmission Gas (Gg)
Enteric Fermentation CH4 – 0.5069Manure Management CH4 – 0.0263Manure Management(Direct)
N2O – 0.0191
Manure Management(Indirect)
N20 – 5.75x10⁻⁶
Agricultural Soils withapplied Urea Fertilizer
1.67 x 10⁻⁴
Table 8: Summary Emissions in Antigua and Barbuda fromthe Agriculture Sector - Inventory Year 2006
Type of Gas Emission Quantity of GasEmission (Gg)
CH4 0.5332Direct N2O 0.0191Indirect N2O 5.75 x 10⁻⁶
CO2 1.67 x 10⁻⁴
2.4 FORESTRY AND OTHER LAND USES
As previously mentioned, most of the originalforest was cleared to establish sugar plantationsduring the early colonial settlement.
In 1990, the reporting year for the Initial NationalCommunications, it was reported that there was13.45 kilohectares (kha) of forest cover. Thisconsisted of Moist Tropical Forest (2.2 kha), DryTropical Forest (10.75 kha), Mangroves (0.50 kha).It was also reported that there was 0.01 kha ofOpen Savannah and 12,000 non-forest trees.
In 2003, the Forestry Division, Ministry ofAgriculture was able to provide some data forAntigua but not Barbuda. This data indicated thatAntigua has a forest cover of 5.60kha consisting of:
0.52 kha of Cactus Scrub, 1.09 kha of Deciduous Seasonal Forests, 0.57 kha of Evergreen Seasonal Forests, 0.044 kha of Littoral Woodland, 0.44 kha of Mangroves, 1.52 kha of Semi Evergreen, 1.09 kha of Thorn and; 0.33 kha of Citronella
The 2010 EIMAS data indicated that Antigua has aforest cover of 8,593.20 ha. Data derived fromexpert judgment from the National ForestryDivision shows that of this approximately 20% isTropical Moist deciduous Forest (1,718.64 ha),15% Tropical Forest dry scrubland (1,288.98 ha)and the remainder 65% is Tropical Dry Forest(5,585.58 ha).
2.4.1 METHODOLOGY (FORESTRY & OTHER LANDUSES)
The data used in this inventory comes from 2004and 2010. In 2009, the 2004 aerial photo imageryof Antigua and Barbuda was digitized into EIMASwhich is a GIS platform. EIMAS was later updatedusing the 2010 aerial photo imagery of Antiguaand Barbuda taken by the Survey Department.Updates to this specific data within the EIMASinvolved the collection of additional metadata andground truthing. The data derived from comparing2004 with 2010 was used in this GHG Inventorywhich only included the mainland of Antigua. Thisdata comparison could not have been done forBarbuda as no data was available for 2010.
Specific methodology may be found in theAppendix. Default and emission factors weretaken from the 2006 IPCC Guidelines.

GHG INVENTORY
42
2.4.2 EMISSIONS
The carbon dioxide emissions and removalswithin the forestry sector may be found in Table9. This information was determined by convertingthe carbon stocks (tonnes) to CO2 emissionsusing the ratio of molecular weights (44/12).
However, Carbon loss from buring or woodremoval could not be determined as that data isnot available.
Table 9: Detailed Forestry and Other Landuse CO2 Emissions and Removals
Carbon Stocks(Tonnes)
CO2 Emissions(Gg)
CO2 Removals(Gg)
Annual Change in Biomass Carbon Stocks (Forest Landremaining Forest Land) (3B1a)
10,734.8902 -39.3613
Annual Change in Carbon stocks in dead wood/litter (Landconverted to Forest Land) (3B1b)
57.7780 -0.2119
Annual Change in carbon stocks in biomass (Croplandremaining cropland) (3B2a)
-19,667.6640 72.1148
Annual Change in Carbon stocks in Mineral soils (Croplandremaining cropland) (3B2a) - 43.4037 0.1591
Annual Change in Carbon stocks in mineral soils (Grasslandremining Grassland) (3B3a) -9,341.9938 34.2540
Change in carbon stocks in biomass (Lands converted toSettlements) (3B5b)
-408.7360 1.4987
Change in carbon stocks in dead wood/litter (Landsconverted to Settlements) (3B5b)
142.9470 -0.5241
Change in carbon stocks in biomass (Lands converted toOther Lands) (3B6b)
-20.6120 0.0756
Total 108.1022 -40.0973Net Emissions 68.0049

GHG INVENTORY
43
2.5 WASTE SECTOR
For many years, commingled wastes weredumped the Cooks Disposal Site. This is an areaadjacent to an old sugar plantation approximatelytwo miles from the west bus station, on thewestern side of the island. It was monitored bythe CBH. Solid wastes disposed onto the sitewere burnt periodically, but this, understandablypresented numerous hazards to the communitiesand activities downwind.
Improvements to this method of waste handlingand management eventually saw thecommissioning of the National Solid WasteManagement Authority in 2005, with a mandatefor handling all forms of wastes generated inAntigua and Barbuda, as specified by the RevisedSolid Waste Act 2005, using sound wastemanagement practices. The Cooks Landfill wasthen transformed and re-branded as the CooksSanitary Landfill and Civic Amenities Site
As waste volumes increased and waste typesbecame more complex, the management of solidwastes had also become more challenging,thereby requiring more scientific approaches inorder to adequately keep pace. Waste receiptshad been reflecting an increase in wastequantities and also increase in wastecharacteristics. Consequently, a wastecharacterization study was undertaken in 2003with Euro-Columbus and again in 2006 withassistance from the Caribbean EnvironmentalHealth Institute CEHI. This was instrumental indetailing and recording data on wasteinformation. Since then, much effort, energiesand expenditure had been made toaccommodate all the incoming material, and anaccount was set up to monitor the masses of allmaterials moving in and out of the site.
2.5.1 METHODOLOGY
Information available for waste volumesproduced in 2006 to 2012 were provided by theNational Solid Waste Management Authority(NSWMA). However, 2010 data was used insteadof 2006 data because the national expertindicated that the data in the previous otheryears were not as reliable as in 2010 when therewere greater efforts to monitor the differentwaste categories.
Detailed methodology may be found in theappendices. Census data was taken from theNational Statistic Division. Default and emissionfactors were taken from the 2006 IPCCGuidelines.
2.5.2 EMISSIONS
The emissions are detailed in Table 10 andTable 11
Table 10: Detailed emissions in Antigua and Barbudafrom Waste sector – Inventory Year 2006
Subsectors Type and Quantity ofEmission Gas (Gg)
Biological treatmentof solid wastes
CH4 - 0.0701
Biological treatmentof solid wastes
N2O – 0.0497
Open Burning ofWaste
CO2 - 1.1848
Open Burning ofWaste
CH4 - 1.375x10⁻¹¹
Open Burning Waste N2O – 1.65x10⁻⁶
Table 11: Summary emissions in Antigua and Barbuda forthe Waste Sector - Inventory year 2006
Type of EmissionGas
Quantity of Emission Gas(Gg)
CO2 1.1848N2O 0.0497CH4 0.0701

GHG INVENTORY
44
2.6 KEY CATEGORY ANALYSIS
According to the 2006 IPCC Guidelines (pg 4.12,Vol 1, Chap 4), “it is good practice to identify key
categories by performing a quantitative analysisof the relationships between level and the trendof each category.
’s emissions and removals and total nationalemissions and removals”. The purpose of KeyCategory Analysis is that it emphasizes thoseareas that contribute most significantly to theGHG emissions. A Key Category Analysis wasperformed for the last GHG inventory of 2000(Table 12) for the present situation andperformed on the present GHG inventory 2006(Table 13) for future inventories.
Approach 1 was used in Key Category Analysis, asit was most suitable to the present nationalconditions. As estimates are available only for asingle year and not several consecutive years the
“Level Assessment” was carried out as seen inTable 12 for the 2000 GHG Inventory and in Table13 for the 2006 GHG Inventory.
Table 12: Approach 1 Level Assessment for GHG Inventory for 2000 (previous inventory) in Key Category Analysis – The KeyCategories are in bold*
A B C D E F GIPCCCategoryCode
IPCC CategoryGreen-houseGas
Latest YearEstimate
Absolute Valueof Latest YearEstimate
LevelAssessment F=E/SUM(E)
CumulativeTotal ofColumn F
1-1 Energy Sources (referenceapproach) CO2 412.14 412.14 0.314 0.314
1-2 International Bunkers –Source Categories CO2 199.44 199.44 0.152 0.466
1-1Energy Sources (referenceapproach) – Emissions fromInternational Bunkers
CO2 199.44 199.14 0.152 0.618
1-2 Transport – SourceCategories CO2 181.98 181.98 0.139 0.757
1-2 Energy Industries – SourceCategories CO2 176.57 176.57 0.135 0.891
5-2Forest and Grasslandconversion of C to CO2 fromBiomass
CO2 57.05 57.05 0.043 0.935
5-1 Change in Forest and otherwoody biomass stocks CO2 -45.82 45.82 0.035 0.970
1-3Fuel combustion – SourceCategory
CO 11.85 11.85 0.009 0.979
1-2Residential Sector – SourceCategory
CO2 7.36 7.36 0.006 0.984
1-2 Process Heat – Source CO2 5.52 5.52 0.004 0.988

GHG INVENTORY
45
6-1 Solid Waste Disposal Site CH4 5.43 5.43 0.004 0.993
1-4Energy Industries – SourceCategories SO2 2.45 2.45 0.002 0.994
1-3Fuel combustion – SourceCategory NOx 2.27 2.27 0.002 0.996
1-3Fuel combustion – SourceCategory
NMVOC 2.24 2.24 0.002 0.998
4-1Domestic Livestock EntericFermentation and ManureManagement
CH4 1.13 1.13 0.001 0.999
1-3Fuel combustion – SourceCategory- InternationalAviation Bunkers
NOx 0.7 0.7 0.001 0.999
2-13Bread and Other FoodProduction
NMVOC 0.39 0.39 0.000 1.000
1-4 Transport – Source Categories SO2 0.29 0.29 0.000 1.000
4-5Atmospheric Deposition ofNH3 and NOx
IndirectN2O
0.15 0.15 0.000 1.000
1-3Fuel combustion – SourceCategory CH4 0.04 0.04 0.000 1.000
2-13 Alcoholic Beverage Production NMVOC 0.028 0.028 0.000 1.000
6-4Emissions from HumanSewage N2O 0.004 0.004 0.000 1.000
2-15 Consumption of Halocarbons HFCs 0.00368 0.00368 0.000 1.000
1-3 Fuel combustion – SourceCategory
N2O 0.003 0.003 0.000 1.000
2-5 Road Paving with Asphalt NMVOC 0.00056 0.00056 0.000 1.000Total 1311.99924 1.000

GHG INVENTORY
46
Table 13 continued
Table 13: Approach 1 Level Assessment for GHG Inventory for 2006 in Key Category Analysis – The key categories are in bold*
A B C D E F GIPCCCategoryCode
IPCC Category GHG Latest YearEstimates
AbsoluteValue ofLatest YearEstimates
LevelAssessmentF= E/SUM(E)
CumulativeTotal ofColumn F
1A FuelComb 4 of4
Fuel CombustionActivities
CO2 875.78 875.78 0.44 0.44
1A RefApp. 3 of 3
Fuel CombustionActivities
CO2 856.80 856.80 0.43 0.87
2F
Product Uses asSubstitutes for OzoneDepleting Substances -Aerosols
HFC 114.03 114.03 0.06 0.92
3B2a
Cropland RemainingCropland: Annual changein carbon stocks inbiomass
CO2 72.11 72.11 0.04 0.96
3B1a
Forest Land RemainingForest Land: Annualincrease in carbon stocksin biomass (includesabove-ground andbelow-ground biomass) CO2 -33.64 33.64 0.01 0.98
3B5b
Land Converted toSettlements: Annualcarbon loss fromcultivated soils CO2 29.95 29.95 0.01 0.99
3B1b
Land Converted to ForestLand: Annual carbon lossfrom soils CO2 -7.47 7.47 0.00 0.99
3C6 Manure Management N2O 5.75 5.75 0.00 1.00
3B1b
Land converted to forestland: Annual change incarbon stocks in deadorganic matter due toland conversion
CO2 -1.92 1.92 0.00 1.00
3B3b
Land Converted toGrassland: Annual carbonloss from cultivated soils CO2 1.87 1.87 0.00 1.00
3B5b
Land Converted toSettlements: Annualchange in carbon stocks inbiomass CO2 1.50 1.50 0.00 1.00
4C Open Burning of Waste CO2 1.18 1.18 0.00 1.00
3B6b
Land Converted to OtherLand: Annual carbon lossfrom cultivated soils CO2 0.70 0.70 0.00 1.00
2D1Non-Energy Products fromFuels and Solvent Use CO2 0.55 0.55 0.00 1.00
3B5b
Land Converted toSettlements: Annualchange in carbon stocks indead wood/litter CO2 -0.52 0.52 0.00 1.00
3A1 Enteric Fermentation CH4 0.51 0.51 0.00 1.003C3 Urea fertilization CO2 0.17 0.17 0.00 1.00
3B6b
Land Converted to OtherLand: Annual change incarbon stocks in biomass CO2 0.08 0.08 0.00 1.00
4BWaste - BiologicalTreatment of Solid Waste CH4 0.07 0.07 0.00 1.00
4BWaste - BiologicalTreatment of Solid Waste N2O 0.05 0.05 0.00 1.00
Fuel Comb4 of 4 Fuel Combustion Activities CH4 0.04 0.04 0.00 1.00
2-13s1Industrial -AlcoholicBeverages
NMVOC 0.03 0.03 0.00 1.00
3A2 Manure Management CH4 0.03 0.03 0.00 1.003A21 Manure Management N2O 0.02 0.02 0.00 1.00
2A2Mineral Industry -LimeProduction CO2 0.01 0.01 0.00 1.00
Fuel Comb4 of 4 Fuel Combustion Activities N2O 0.01 0.01 0.00 1.00
2D2
Non-Energy Products fromFuels and Solvent Use -Paraffin Wax Use CO2 0.01 0.01 0.00 1.00
2-31s-2Industrial BreadProduction
NMVOC 0.00 0.00 0.00 1.00
2 G
Other ProductManufacture and Use -N2O from product uses N2O
2A4
Mineral Industry – OtherProcess uses ofCarbonates CO2 0.00 0.00 0.00 1.00

GHG INVENTORY
47

GHG INVENTORY
48
Table 13 continued
Good Key Category Analysis is usually preformedon a time series of data. It was expected that thiscould have been done for the period of 2006 –2010. But this was not the case as for the 2007 –2010 period very few sectors had good qualitydata available. The only category that had goodquality data for the period 2006 – 2010 was theEnergy Industry (reference approach only).
2.7 UNCERTAINTIES
The uncertainties in this inventory were from twomain areas; the emission factors and the activitydata itself. Antigua and Barbuda is not financiallyresourceful enough at this time to develop itsown national emission factors hence, its heavyreliance on the default emission factors providedby the 2006 IPCC Guidelines. With regards to theactivity data, uncertainties arose mainly wheredata was not available due to responsibleagencies not having the resources to collect andmanage the data. The specific sector relateduncertainties in activity data is discussed belowunder each sector.
Uncertainty analysis is essential as it can serve asa means to direct meager national resources inreducing the degree of uncertainty in future GHGinventories and also can guide future decisions inmethodology. The Approach 1 method ofUncertainty Analysis was used to estimateuncertainties. 2006 IPCC Guidelines suggest thatin inventories where the Tier 1 methodology is
2-13s2Industrial -Bread Prodn NMVOC 0.00 0.00 0.00 1.00
2G
OtherProductManufactureand Use -N2O fromProduct Uses N20 0.00 0.00 0.00 1.00
2A4
MineralIndustry -OtherProcess UsesofCarbonates CO2 0.00 0.00 0.00 1.00
4C2
OpenBurning ofWaste N2O 0.00 0.00 0.00 1.00
4C1
OpenBurning ofWaste CH4 0.00 0.00 0.00 1.00
Total 2871.654552 1*Key categories are those that, when summed together in descending order of magnitude, add up to 95
percent of the total in Column G (2006 IPCC Guidelines pg 4.15, Vol. 4, Chap 4).

GHG INVENTORY
49
predominant Approach 1 is the most suitable fitwhen estimating uncertainties.
2.8 ENERGY SECTOR – UNCERTAINTIES
Areas of uncertainty within the Energy Sector areas follows:
Reference Approach: Import data of alltypes of fuels is provided by one agency, WI O C. There is no way to verify this data asthe National Statistics Division has ceasedto collect fuel import data.
Sectorial Approach: The only agency thatcould provide accurate data was theNational Power Company (APUA) forElectricity Generation.
- Gas Stations and Marinas were notable to provide consistent data forthe specified period of 2006 – 2010.
- The Airport was also not able toprovide data.
- Regarding lubricant and paraffin waxuse, it was assumed that all thelubricants and paraffin was importedeach year were used in that year.
- Charcoal use was determined byinterviewing as many charcoalproducers as could be found. Theamount of charcoal producedannually was estimated, as theseproducers do not keep records. Itwas assumed that all the charcoalproduced in a year was used in thatyear and it was assumed thatquantity of charcoal producedremains the same from year to year.
2.9 INDUSTRIAL SECTOR - UNCERTAINTIES
Areas of uncertainty within the Industrial Sectorare listed below:
There was no available data on lime productionfrom the source provider of lime, as it is producedas a by-product of the lone gas producer on-island. Currently the by-product is currentlydumped in a pit with no recorded data oncollection. Information was collected from thelargest consumer of this waste product theCentral Board of Health, which uses this lime toclean drain and streets in the city. They estimateda use of 2 tonnes per month.
The ceramic and pottery makers do not keepaccurate data on quantity of base carbonatematerials used hence this information wasestimated from monthly use.
There was no available end usage data on thequantities of lubricants and paraffin waxesconsumed hence it was assumed that alllubricants and paraffin waxes imported wereused.
Regarding HFCs:- Foam Usage Data provided by the
National Fire Department could not beused as the exact HFC compositionblend could not be determined.However, this data was expected to benegligible.
- Data for sub-applications apart frommobile air conditioning units was notavailable.
- An estimation of the Emission stock (M)in the ‘lifetime’ emission equation wascalculated by adding available importfigures for 2006 from the NationalStatistics Division of refrigerant unittypes to the calculated countrywidestock. The assumption made was thatall imported units in 2005 and 2006were cycled into use.
- There was an assumption of a 50%usage between the two gases, R410aand R407a, identified by the refrigerant

GHG INVENTORY
50
service providers association as theyindicated these were the two mostprevalently used in the commercial andstationary sub-application categories.
- Regarding domestic refrigeration;figures were estimated using thenational census (2001) figures onhousing and assuming at least 95% ofhomes with refrigeration capacity, withone refrigerator, taking into accountthe National Poverty and VulnerabilityAssessment of 2007 which indicatedapproximately 18 % of persons were inpoverty or indigent and the fact thatthe country has 100% electricitycoverage.
- Data on quantity of HFC annual saleswas obtained from automotive servicesuppliers from their maintenancedepartments. No comprehensivedetailed records were kept by serviceproviders on the usage by most so anestimation of use on a weekly andmonthly basis was used to extrapolatethe usage per annum. Providersindicated that the sale numbers havebeen fairly consistent for the past fewyears, thus the calculated quantity wasused for target year 2006.
- Data on amount and type of severalrefrigerant gas types was collectedfrom several local supermarkets ofvarying sizes to verify assumptions.
- Regarding Stationary refrigerants; anestimation was done for banks,government buildings, Hospitals and allother large building complexes.
Regarding Bread production; an assumptionwas made that the weight of flour was usedas an estimate for the weight of breadproduced with negligible difference, asproducers did not keep the weight of final
product. The ratio of flour utilised for breadand cake production was obtained from thebakers’ estimation on their production.
2.10 AGRICULTURE SECTOR - UNCERTAINTIES
Areas of Uncertainty within the AgriculturalSector are listed below: The accurate number of some species of
livestock is not known in Antigua andespecially in Barbuda. Therefore estimationswere made based on expert judgment andexisting data.
In estimating the methane emissions fromenteric fermentation, the default emissionfactors that were used assumed that theaverage live weight for sheep and goats are45 Kg and 40 Kg respectively. However, theactual average live weights nationally are 30kg and 26kg respectively, this may lead to anincorrect estimation of methane emissionsfrom enteric fermentation.
In calculating the direct N2O emissions fromManure Management, default Nitrogenexcretion rate values were used for poultrythat assumed that 90% of the swinepopulation is market swine and 10% isbreeding swine. However, nationally ingeneral 50% of the swine population ismarket swine and the remaining 50% isbreeding swine. It is possible that this willaffect the accuracy of the N2O emissionscalculated.
The Typical Animal Mass (TAM) was neededfor the calculation of direct N2O emissions.Because this data was available readily,national figures were used. Since, thecalculations are based on default factors theuse of national figures may affect theaccuracy of the N2O emissions calculated.

GHG INVENTORY
51
As part of the calculation of direct N2Oemissions, the Fraction of total annualnitrogen excretion managed in MMS for eachspecies/livestock was determined usingdefault factors from countries that hadsimilar conditions. Additionally, no defaultfactors were provided for poultry, thereforean estimate was made. All this may affect theaccuracy of N2O emissions calculated.
With regards to direct and indirect N2Oemissions from managed soil, becausesufficient data is not available, thisinformation could not be calculated. This maylead to an overall inaccuracy of the actualemissions.
2.11 FORESTRY AND OTHER LAND USES -UNCERTAINTY
Areas of Uncertainty within the Forestry andOther Land Use Sector are listed below: The EIMAS data derived from comparing
2004 with 2010 was used in this GHGInventory only included the mainland ofAntigua. This data comparison could not havebeen done for Barbuda as no data wasavailable for 2010.
Additionally, more ground truthing isnecessary to identify land uses in bothAntigua and Barbuda. This data has usesother than in GHG inventories but forplanning and other essential services.
In calculating the changes in Carbon stocks,data such as the acreage of forest types wasrequired. The expert judgment of theForestry Staff was used in this case.
Emissions from Biomass burning in forestcould not be determined as the numbers ofacres burnt per year is not kept. The Firedepartment up until now had only kept dataon number of fires. This lack of data would
reduce the accuracy of calculated GHGemissions due to fires.
2.12 WASTE SECTOR - UNCERTAINTIES
Areas of Uncertainty within the Waste Use Sectorare listed below: The majority of waste is taken to the CooksLandfill, however, the private establishments thatdispose of their own waste were unable to givecomplete data as to the categories, quantitiesetc, therefore, it was assumed that all wastes aretaken to the Cooks Landfill.
As regards to composting; there is uncertaintyabout the moisture content, ph and actual typesof gases generated, as these factors are alsoinfluenced by the ambient conditions.
Regarding compacting and anaerobic digestionof food waste; significant uncertainty existswhere quantities of packaging accompany thewastes; this makes it difficult to give the exactweight of the wastes only.
Regarding open burning; this is not allowedwithout permission, but information such asquantities burnt and category of waste involvedare not generally collected, hence affectingreliable GHG emission data. The fraction of wasteopenly burnt, was taken as ten percent of theamount disposed at landfill (2010 data) [approx.mass of waste burnt/ total mass of wastecollected]. This assumption is based the discretepractices of some rural areas that may be locatedoff the scheduled collection services route.
Methane Emission Factor is assumed to be 5,the same as for bulk waste, due to the presenceof miscellaneous material and an assumedmoisture content of approximately 50%.
Nitrous oxide emission factor assumed thesame value as that for bulk waste decomposingunder ambient conditions, and on a dry weightbasis. The main waste-type burnt are Confidential

GHG INVENTORY
52
Documents in their packaged material, mainlycardboard boxes. This supervised activity is doneonly as requested.
Regarding the medical waste, the lowest rangewas used in the worksheets; it is likely that anymoisture from buried waste would percolatedeeply to the liquid collection drains while gasesthat rise would evolve via methane vents –chances are as the gases are buffeted the volumewould be significantly reduced.
2.13 QUANTIFIED UNCERTAINTY
Uncertainty is defined by the 2006 IPCCGuidelines as:“...lack of knowledge of the true value of avariable that can be described as a probabilitydensity function (PDF) characterising the rangeand likelihood of possible values. Uncertaintydepends on the analyst’s state of knowledge,which in turn depends on the quality and quantityof applicable data as well as knowledge ofunderlying processes and inference methods. “(pg 3.8, Section 3.1.3, Vol 1, 2006 IPCCGuidelines)
Approach 1 was used in quantifying uncertaintyand may be seen in Table 8-1. Explicit uncertaintycalculations may be found in the Appendix.Approach 1 requires use of base year emissions.In this case those of 2000 were used as best aspossible. The concern here is that, areasconsidered in the 2006 inventory were notnecessarily considered in the 2000 inventory.Additionally, in some areas the data is moredetailed. Therefore, it is difficult to compare bothinventories. One must remember that the 2000inventory was prepared using the Revised 1996Guidelines in which there are some differencescompared to the 2006 Guidelines used toprepare the 2006 inventory.
Table 14 indicates that the PercentageUncertainty in the total inventory is 26%. It mustbe borne in mind that not all of the uncertainties
clearly laid out previously can be quantified,therefore, 26% is not an absolute value but it isthe best statistical way of quantifyinguncertainties.
Although, Table 14 also shows Trend Uncertainty,the usefulness of this data may not be applicablein this case. This is because as stated previouslythe base data used are emissions from the 2000inventory which are sufficiently different fromthe 2006 inventory for comparisons to bedifficult. Therefore, the Trend Uncertainty willnot be taken into account and will be consideredas a byproduct of this process.

GHG INVENTORY
53
Table 14: Approach 1 –Calculation of UncertaintiesA B C D E F G H I J K L MIPCCCategory
Gas Base Yremissionsandremovals
Year temissionsorremovals
ActivitydataUncer-tainty
Emissionfactor /estimationparameteruncertainty
Combineduncertainty
Contribu-tion toVariancebyCategoryin Year t
TypeAsensi-tivity
Type Bsensi-tivity
Uncertaintyin trend innationalemissionsintroducedby emissionfactor /estimationparameteruncertainty
Uncertaintyin trend innationalemissionsintroducedby activitydatauncertainty
Uncertaintyintroducedinto thetrend intotalnationalemissions
Inputdata
Inputdata
InputdataNote A
Input dataNote A
NoteB
Gg CO2equiva-lent
Gg CO2equivalent
% % % % % % % %
EnergySectorReferenceApproach1
CO2 412.14 856.8 10 17 19.72308292 36.61920424 1.061916631 0 15.01776901 225.5333861
FuelCombustionActivities
CO2 371 875.78 50 4 50.15974482 247.457755 1.085440414 0 76.75222774 5890.904462
FuelCombustionActivities
CH4 0.00 0.036 50 100 111.8033989 2.07738E-06 4.46183E-05 0 0.003154993 9.95398E-06
EnergySector- FuelCombustion- SectoralApproach
N2O 0.003 0.007 50 275 279.5084972 4.90893E-07 8.67579E-06 0 0.000613471 3.76347E-07

GHG INVENTORY
54
Table 14
IndustrialSector -MineralIndustry -Other Processuse ofcarbonates
CO2 0.553 3 3 4.242640687 7.05867E-07 0.000685387 0 0.002907852 8.45561E-06
IndustrialSector -Lubricant Use
CO2 0.005 20 50 53.85164807 9.2969E-09 6.19699E-06 0 0.000175277 3.07222E-08
IndustrialSector -Paraffin WaxUse
CO2 114.034 20 100 101.9803903 17.34213017 0.141333568 0 3.997516973 15.98014195
EntericFermentation
CH4 22.7 0.51 20 40 44.72135955 6.58984E-05 0.000628251 0 0.017769624 0.00031576
ManureManagement
CH4 1 0.03 20 30 36.05551275 1.15658E-07 3.26458E-05 0 0.000923361 8.52596E-07
ManureManagement
N2O 0.02 38 100 106.976633 5.33119E-07 2.36229E-05 0 0.001269499 1.61163E-06
Forest LandRemainingForest Land:Annualincrease incarbon stocksin biomass(includesabove-groundand below-groundbiomass)
CO2 -33.64 10 40 41.23105626 0.246683797 0.041692374 0 0.589619206 0.347650808
LandConverted toForest Land:Annualcarbon lossfrom soils
CO2 7.47 10 40 41.23105626 0.012163744 0.009258059 0 0.130928724 0.017142331

GHG INVENTORY
55
Land Convertedto Forest Land:Annual change incarbon stocks indead organicmatter due toland conversion
CO2 -1.92 10 40 41.23105626 0.000805632 0.00238262 0 0.03369533 0.001135375
CroplandRemainingCropland: Annualcarbon loss fromcultivated soils
CO2 203.46 10 90 90.55385138 43.52947385 0.25217124 0 3.56623988 12.71806688
GrasslandRemainingGrassland: Annualcarbon loss fromcultivated soils
CO2 129.40 10 90 90.55385138 17.60754878 0.16038114 0 2.268131831 5.144422002
Land Convertedto Grassland:Annual carbonloss fromcultivated soils
CO2 1.87 10 90 90.55385138 0.003669957 0.002315444 0 0.032745327 0.001072256
SettlementsRemainingSettlements:Annual carbonloss fromcultivated soils
CO2 532.85 10 90 90.55385138 298.559253 0.660418322 0 9.339725475 87.23047195
Land Convertedto Settlements:Annual carbonloss fromcultivated soils
CO2 29.95 10 90 90.55385138 0.943259292 0.037120976 0 0.524969883 0.275593378
Land Convertedto Other Land:Annual carbonloss fromcultivated soils
CO2 0.70 10 90 90.55385138 0.000518928 0.000870677 0 0.012313238 0.000151616

GHG INVENTORY
56
Table 14 continued
LandConverted toOther Land:Annual changein carbonstocks inbiomass
CO2 0.08 10 75 75.66372975 4.19585E-06 9.36985E-05 0 0.001325097 1.75588E-06
Waste -BiologicalTreatment ofSolid Waste
CH4 0.07 10 700 700.0714249 0.000308831 8.68818E-05 0 0.001228695 1.50969E-06
Waste -BiologicalTreatment ofSolid Waste
N2O 0.05 10 100 100.4987562 3.19915E-06 6.15981E-05 0 0.000871129 7.58865E-07
Open Burningof Waste
CO2 1.18 50 40 64.03124237 0.000738031 0.001468439 0 0.103834341 0.01078157
Open Burningof Waste
CH4 0.000000000014 50 100 111.8033989 3.03051E-25 1.70417E-14 0 1.20503E-12 1.4521E-24
Open Burningof Waste
N2O 0.000001650000 50 100 111.8033989 4.36394E-15 2.04501E-09 0 1.44604E-07 2.09103E-14
Total 806.843 2792.542602 666.2622608 6239.813079Percentage Uncertaintyin the total Inventory 25.8120565
TrendUncertainty 78.99248749

GHG INVENTORY
57
NB: In all cases presented the uncertainties where known for each the emission factor and activity data separately, hence there is no correlation betweenthem. Therefore, Sensitivity A was not used.

GHG INVENTORY
58
2.14 RECOMMENDATIONS
The purpose of providing recommendations is to improve the quality of data collected for futureinventories. If recommendations are actually considered and executed areas of existing uncertainties maybe reduced as far as possible. This would allow for complete data sets to be collected annually and thereforemaking trend analysis possible.
Due to the significant lack of good data from the end users it is recommended that the following data becollected annually within the sectors by relevant agencies and housed at the National Statistics Division, asa central repository. Table X recommends the data type and relevant data collection agencies
Sector Data type & Additional Agencies
Energy Annual consumption of fuel according to fuel type by Gas Stations, Marinas andAirports
Annual consumption of fuel by the National Power Company (APUA and APC) Thiswould improve record keeping by end users of petroleum products.
Agencies such as the Bureau of Standards should be targeted to verify accuracy ofmeasuring instruments being used to determine consumption of fuel, lubricantsand charcoal.
It is recommended that indigenous energy resources should be developed, whichin this case would be primarily from wind and photovoltaic systems (PV) to reduceuse of fossil fuels and of course GHG emissions.
Industrial It is recommended that data collected by the National Statistic Division onimportations of HFC emitting products be categorized by type of HFC producedand not by weight as is done presently. This would allow for the data to be moreuseful.It was found that there was limited recorded data on sale activity and use of HFCemitting products by many providers in this area of the business.
It is recommended that consumption data of these HFC emitting products berecorded by distributors and collected by the National Statistics Division.
Agriculture The accurate number of some species of livestock is not known in Antigua andespecially in Barbuda. Therefore, it is recommended that the Ministry ofAgriculture institute measures to collect this data on an annual basis. Withregards to the situation in Antigua there is some draft legislation that considersthe annual registration of Livestock, this would provide somewhat accuratenumbers of livestock apart from the stray livestock population. The Veterinary &

GHG INVENTORY
59
Livestock Division is also working towards Good Agricultural Practice Certification;in this case the farmers are required to keep proper records of populationnumbers among other parameters. Therefore, once the legislation is completeand passed, then this problem may be on its way to be rectified. With regards tothe situation in Barbuda, getting accurate numbers of deer and wild pigs mayprove difficult without serious human resource input because of the timid natureof these animals especially the deer. However, advice may be obtained fromagencies such as WSPA (World Society of Protection of Animals) among others,who may have extensive experience in accurately estimating wild livestockpopulations.
In estimating emissions, in many cases the local situation is far different from thenorm, hence use of default emission factors may lead to incorrect estimations.The solution to this according to the IPCC would be to develop national emissionfactors. The resources may not exist nationally but it may be recommended thatregional emission factors be developed within the OECS.
Data is not sufficiently available in emissions from managed soils. It is therefore,recommended that more resources be put into the Forestry Unit and theAgricultural Extension Division to allow for scientific monitoring of managed soils.
Forestry andOther Land Use
It is recommended that aerial photos of Barbuda be taken so that data comparisonmay be done for Barbuda, but this of course depends on the availability of funding.It is essential that ground truthing be done annually to improve the quality of dataprovided by the EIMAS. It is recommended that the Forestry Unit carry out this task.Additionally, it is also recommended that the Forestry Unit be provided with thenecessary expert human resources necessary to carry out such an importantactivity.Emissions from Biomass burning in forest could not be determined as the numbersof acres burnt per year is not kept. The Fire Department up until now had only keptdata on number of fires. However, the Fire Department plans to start collectingnumber of acres burnt on an annual basis. Therefore, it is recommended that theFire Department commence with their plans to collect data on number of acresburnt according to land use category on an annual basis.
Waste It is recommended that private agencies that dispose of their own waste shouldkeep detailed records on quantities of wastes that are disposed by definedcategories on an annual basis. This recording and collection of data should beencouraged by the NSWMA and the NSWMA should store this data.The Fire Department issues licenses to the general public to carry out openburning activities. It is recommended that records be kept of waste quantitiesburnt by defined categories. This data should be stored by the NSWMA.

GHG INVENTORY
60
2.15 POLICIES
The Government of Antigua and Barbuda hasagreed to undertake nationally appropriate,measureable and verifiable actions aimed atreducing greenhouse gas emissions by 25%below 1990 levels by 2020, which will bepresented in the next chapter.
Presently, there is a National Energy Policy andStrategic Action Plan that attempts to do this viathe following methods:
Energy cost reduction Diversification and efficient use of
energy sources Electricity Reliability Environmental Protection Stimulate New Economic/Business
Opportunities
Additionally, there is an APUA (National PowerCompany) Interconnection Policy that allows upto 15% grid penetration of renewable energysources.
Specifically, for refrigerant gas usage, nationallythere is the prescribed usage of refrigerants HFC134a in automotive systems. There is currently aphasing in of 407a and 410a in building AC unitsto replace R-22 although a number of institutionsstill utilise some wall unit systems with R-22 likethe National Hospital. These new refrigerantgases are more efficient, hence less GHGemissions.
Regulations and policies for the disposal of usedoil in most OECD countries often restrict land-filling and dumping, and encourage the separatecollection of used oil. However, within Antigua &Barbuda there is limited recycling of waste oil asthere is currently only one small operation thathas recently begun.
2.16 SUMMARY
A summary of the national GHG emissions (Table0-1) are as follows:
Carbon Dioxide (CO2): 945.544 Gg, Methane (CH4): 0.639 Gg, Nitrous Oxide (N2O): 0.079 Gg, Non-methane volatile organic
compounds (NMVOC): 0.035 Gg, Hydrofluorocarbons (HFC): 114.034 Gg.
The overall uncertainty of the inventory is 26%.The Carbon Dioxide emissions have significantlyincreased compared to the 2000 GHG Inventory.In 2000, it was reported that there were 383Gg ofCO2 emitted; 3% from Land Use Change andForestry and the remaining 97% from FuelCombustion in the Energy Sector. In 2006,945.544 Gg of CO2 were reported; 7% from LandUse Change and Forestry and 92% from FuelCombustion in the Energy Sector. In2000, therewas very little data available for the Land UseChange and Forestry Sector but in 2006 there wassubstantially more data available hence theincrease in emissions from that sector.
Methane, Nitrous Oxide and Non-methaneVolatile Organic Carbon (NMVOC) emissionsdecreased when comparing 2000 and 2006 GHGInventories. In 2000, the methane emissionsreported were 6.6 Gg; Nitrous Oxide emissionswere 0.159 Gg; and NMVOC emissions were 2.7Gg.
However, Hydrofluorocarbon (HFC) emissionsincreased when the 2000 and 2006 GHGinventories were compared. In 2000, the HFCemissions reported were 0.0037 Gg comparedwith 114.034 Gg in the 2006 GHG Inventory. Inthe latter case, greater efforts were made incollecting data from that sector than in theprevious GHG inventory, hence the significantincrease.
It is important to note that there are efforts inplace to significantly reduce the GHG emissions

GHG INVENTORY
61
by 2020. This can be seen in the previous sectionof policies that are now in place to assist with thistarget.
Additionally, data from this Inventory may beused to provide evidence of the present daysituation so that solutions can be encouraged toreduce emissions and point the way forwardtowards Renewable Energy Sources and EnergyEfficiency.

MITIGATION : POLICY & MEASURES
62
3 MITIGATION: POLICY & MEASURES
As a Non-Annex I Party to the UNFCCC and itsKyoto Protocol, Antigua and Barbuda has noobligation to reduce its greenhouse gasemissions. This is because, it is universallyunderstood that the principle cause of dangerouslevels of anthropogenic climate change has beenattributed to the historical and modern actionstaken to achieve development by theindustrialised countries, which are all listed asAnnex-I Parties to the UNFCCC. However, theGovernment and people of Antigua and Barbudahave come to realize that although our GHGemissions have always been regarded as“negligible”, the dangers of climate change are sopresent and serious that it will take the combinedactions of all countries to achieve the necessarymitigation targets to ensure the safety of allpeoples on the planet. It also safeguards thestability of the environment while ensuring thesustainability of the entire planet and itsinhabitants for present and future generations.
Recognizing the ultimate need for global actionby all parties, Antigua and Barbuda hascontinuously pledged and undertaken efforts tomitigate green house gas emissions despite itsnegligible contribution. Along with 5619 otherdeveloping countries (non-annex I parties), thecountry has accepted voluntary emissions targetsin hopes of sufficiently changing the trajectory ofthe rate of global climate emissions. Thisvoluntary declaration of emissions targets isreferred to as the Nationally AppropriateMitigation Actions (NAMA). Antigua and Barbudamade this commitment as part of theCopenhagen Accord (see Figure 7).
Further, in preparation for COP21 Parisagreements, the country has recently launchedits Intended Nationally Determined Contributions
19 As of April 25th 2014, the UNFCCC website reported 57countries to have made voluntary NAMA commitments.(http://unfccc.int/focus/mitigation/items/7172.php)
(INDCs). The INDCs consists of both conditionaland unconditional targets as well as a greaterfocus on climate change adaptation that will behighlighted later in this chapter.

POLICY AND MEASURES
63
3.1 TOWARDS COPENHAGEN
The Government of Antigua and Barbuda hasagreed to undertake nationally appropriate,measureable and verifiable actions aimed atreducing greenhouse gas emissions by 25%below 1990 levels by 2020.
Presently, there is a National Energy Policy andStrategic Action Plan that attempts to do this viathe following methods:
• Energy cost reduction• Diversification and efficient use of
energy sources• Electricity Reliability• Environmental Protection• Stimulate New Economic/Business
Opportunities
Additionally, there is an APUA (National PowerCompany) Interconnection Policy that allows upto 15% grid penetration of renewable energysources.
Specifically, for refrigerant gas usage, nationallythere is the prescribed usage of refrigerants HFC
134a in automotive systems. There is currently aphasing in of 407a and 410a in building AC unitsto replace R-22 although a number of institutionsstill utilise some wall unit systems with R-22 likethe National Hospital. These new refrigerantgases are more efficient, hence less GHGemissions.
Regulations and policies for the disposal of usedoil in most OECD countries often restrict land-filling and dumping, and encourage the separatecollection of used oil. However, within Antigua &Barbuda there is limited recycling of waste oil asthere is currently only one small operation thathas recently begun.
With regards to the National Energy Policy andSustainable Energy Action Plan, it remainsunconfirmed as to what extent these two policydocuments will establish an enablingenvironment to achieve the key metric of Antiguaand Barbuda’s NAMA.
Notwithstanding the voluntary commitment toachieve national reductions, the Government ofAntigua and Barbuda has maintained the position
In accordance with decision 1/CP.15 and 1/CMP.5, the Government of Antigua and Barbuda communicatedits decision to:
(a) associate with the Copenhagen Accord, noted in Decision 2/CP.15 of the Conference of the Partiesat its fifteenth session in Copenhagen, Denmark;(b) pursue a low carbon, green growth development strategy during the period 2010-2015, and in thisregard is requesting so-called "fast track" financing envisaged under paragraph 8 of theaforementioned Accord to implement this strategy;(c) on the basis of financial and technical support from the international community, includingthrough those envisaged in paragraphs 8, 10 and 11 of the aforementioned Accord, voluntarilyundertake nationally appropriate, measurable and verifiable actions aimed at reducing further itsalready minuscule greenhouse gas emissions by twenty-five percent (- 25%) below 1990 levels by2020;(d) develop and implement nationally appropriate adaptation plans, programmes and projects andassociated capacity-building, on the basis of financial and technical support that is to be madeavailable in accordance with the relevant provisions of paragraphs 8, 10 and 11 of theaforementioned Accord; and(e) consistent with Article 12.1(b) of the Convention, communicate through its nationalcommunications, on the actions delineated in paragraphs (b), (c) and (d) above, on the basis ofguidelines to be adopted by the Conference of the Parties.
Figure 7: Excerpt of Copenhagen Pledge

POLICY AND MEASURES
64
that the solution to climate change is globalaction. To this end it has joined with SIDS andLDCs in noting with concern that the “uppersafety limit for atmospheric CO2 is 350 parts permillion (ppm)”20 and that this limit has alreadybeen passed thus demanding an urgent need toarrest emissions as closely as possible to maintainconcentration of CO2 at 400ppm with furtheractions to bring concentrations back to 350ppm.Further, it supports the AOSIS position that“Research clearly shows that unless we actimmediately, the opportunity to keep globalwarming below the crucial 1.5 degree Celsiusthreshold could be irrevocably lost.”21
Table 15: National Emission Reporting Source Categoriesin Gigagrams (Gg)
Year 199022
199423
200024
200625
CarbonDioxide (CO2)
288.22
334.13
383 945.544
Methane (CH4) 4.67 6.6 0.639Nitrous Oxide(N2O)
0.0051
0.159
0.079
NitrogenOxides (NOx)
2.3
CarbonMonoxide (CO)
11.9
Non-methanevolatileorganiccompounds(NMVOC)
0.65 2.7 0.035
SulphurDioxide (SO2)
2.83 3.25 2.8
Hydrofluorocarbons (HFC)
0.0037
114.034
The most recent GHG inventory of Antigua andBarbuda closely evaluated emissions from 2006
20 Hansen et al (2008)“Target Atmospheric CO2: Where ShouldHumanity Aim?”http://arxiv.org/ftp/arxiv/papers/0804/0804.1126.pdf21 http://aosis.org/press-release-aosis-and-ldcs-urge-focus-on-implementing-short-term-emissions-reductions/ (2013) PressRelease: AOSIS and LDCs Urge Focus on Implementing ShortTerm Reductions, June 3, 2013
as the reporting year. There were significantchanges in all emissions as compared to the 2000assessment. CO2 almost tripled; and HFCs wentfrom <1 to over 110Gg. On the decreasing sideCH4 reduced by around 90%, N2O by1/2; andNMVOCs went from 2.7Gg to 0.035Gg (see Table15).
As can be seen in the table, CO2 emissions in 2006are 328% greater than the 1990 baseline. Whilethe increases mainly represent slightimprovements in data collection, it also highlightsthe challenge that Antigua and Barbuda will facein maintaining its economic developmenttrajectory while ensuring the safe keeping andsustainability of the environment. It should alsobe noted that if only the CO2 emissions were tobe considered then for Antigua and Barbuda toachieve its NAMA commitment it would have tobalance all of its economic performance andfuture development on activities that wouldlimited to a net of 254.887Gg of CO2 orapproximately ¼ of current GHG emissions.
Antigua and Barbuda does not possess anyreservoirs of fossil fuels and as such relies almostentirely on the importation of fuel for electricitygeneration, transportation and cooking. Due toits relative flatness and ease of access of almostall areas, Antigua and Barbuda has electricitypenetration to 95.4% of the country. In fact, only1.2%26 of the households were identified as nothaving access to any form of lighting. Consideringalso that Domestic consumption accounts fromsome 40% of all national consumption thenpercentage of the population not consumingenergy would be the equivalent of 0.48%. tofurther underscore the reliance of Antigua andBarbuda on fossil fuels one need only considerthe sources of lighting and cooking fuel used by
22 Data taken from Antigua and Barbuda’s Initial Communicationto the UNFCCC23 Data taken from Antigua and Barbuda’s INC24 Data taken from Antigua and Barbuda’s Second NationalCommunication to the UNFCCC25 Data taken from Antigua and Barbuda GHG Emissions andRemovals 200626 2011 Population and Housing Census of Antigua and Barbuda

POLICY AND MEASURES
65
household which can be regarded at 95.3% and97.8% respectively.
3.1.1 ELECTRICITY PROFILE
The Utilities Act of 1973 gives the Antigua PublicUtilities Authority (APUA) the sole authority togenerate, distribute and sell electricity in Antiguaand Barbuda. The Act further gives the APUA theauthority to permit entities other than itself toproduce electricity for their own usage or providecommercially which APUA will purchase and thendistribute on its grid. As of 2012 there was some118 MW installed capacity with 93 MW of actualproduction capacity on Antigua and Barbuda. Arecent study determined that Antigua andBarbuda has maintained a relatively constantenergy demand of 232 GWh since 2010.Furthermore peak demand recorded in 2013 was49.2MW27.Electricity is almost entirely generatedfrom fossil fuel although there is currently a smallphotovoltaic grid-connected facility of 3 kW,installed in 2009 in Antigua, which supplies 4.8MWh of electricity. Additionally, the 2011 censusreports some 27 household units beingcompletely reliant on solar energy.
At present, the main island of Antigua makes upapproximately 99% of the total electricityconsumption. The distribution among the sectorsis roughly commercial with 46%, domestic 40%,government 11% and industrial 3%. On Barbuda,consumption is shared only among three sectors,namely domestic 71%, commercial 20% andgovernment 9%.
The NEP estimates that peak electricity demandwill increase to approximately 75MW by 2024another study projected 2028 peak demand toincrease to around 100 MW, with net generationincreasing to around 650 GWh (increase rate of3.9 % per year).
In the Second National Communications ofAntigua and Barbuda has identified four basic
27 United Nations (2013) An assessment of fiscal and regulatorybarriers to deployment of energy efficiency and renewable energy
scenarios for the inclusion of different energysources to meet the projected energy demand. Inscenario 1 there are no source alternatives. InScenario 2 renewable energy is introduced to thegrid in 2015, through 10MW of wind and 2.5MWof waste generation. Additionally, this scenarioalso identified 10MW of distributed photovoltaicbeing introduced between 2012 and 2030. Forthe purpose of table XXXX the PV was estimatedto be in place by 2020. Scenario 3 observedinterventions at the same time as those ofScenario 2 but was more aggressive. Specifically,a 3.5MW waste to energy plant in 2015 and a15MW distributed PV system in 2020 would bepursued. Additionally, the 10MW of wind in 2015and a further 5MW in 2025. A 15MWinterconnection was also identified in the SNC butthere was no political support for this idea so itwas not reflected in the table. As an alternative,because the global price of oil has made coal tobe considered as a viable alternative,consideration has also been given to installing10MW coal plants in 2020, 2023 and 2026.
3.2 TOWARDS COP21 PARIS AGREEMENTS
In preparation for COP21 Paris Agreements(2015), and in accordance with the relevantparagraphs of Decision 1/CP.19 and 1/CP.20,Antigua and Barbuda recently launched its INDCs.The country’s INDCs focuses on both climatechange adaptation and mitigation, and while itfeatures conditional targets which depend onsupport from the international community, itmaintains an unconditional thrust for enablingenvironments conducive to its targets.
The targets include:Unconditional Targets
Enhance the established enabling legal,policy and institutional environment for alow carbon emission developmentpathway to achieve poverty reductionand sustainable development.
technologies in Antigua and Barbuda by Sanguinetti, G. andGomes, C. Ref. LC/CAR/W.5

POLICY AND MEASURES
66
10) By 2020, update the Building Code tomeet projected impacts of climatechange.
Conditional Adaptation TargetsBy 2030, all buildings improved andprepared for extreme climate events,including drought, flooding andhurricanes.
By 2025, increase seawater desalinationcapacity by 50% above 2015 levels.
By 2030, 100% of electricity demand inthe water sector28 and other essentialservices (including health, food storageand emergency services) will be metthrough off-grid renewable sources.
By 2030, all waterways protected toreduce the risks of flooding and healthimpacts.
By 2030, an affordable insurance schemeis available for farmers, fishers, andresidential and business owners to copewith losses resulting from climatevariability.
Conditional Mitigation targets
By 2020, finalize the technical studieswith the intention to construct andoperationalize a waste to energy (WTE)plant by 2025.29
28 The water sector includes water generation (seawaterdesalination), distribution and usage, to ensure water deliverywhen grid electricity may be interrupted. Based on an informalassessment, water distribution and usage is equal toapproximately 15% of GHG emissions in the electricity sector.29 Waste-to-energy is not considered part of the 50 MWrenewable energy target.
By 2020, establish efficiency standardsfor the importation of all vehicles andappliances.
By 2030, achieve an energy matrix with50 MW of electricity from renewablesources both on and off-grid in the publicand private sectors.30
By 2030, all remaining wetlands andwatershed areas with sequestrationpotential protected as carbon sinks.
Pivotal to achieving its targets, the recentlyenacted EPMA 2015 establishes the legalplatform within which national adaptation andmitigation actions may be undertaken. Forinstance, the Act seeks the protection ofwatershed and wetlands, not only as possiblecarbon sinks but also to reduce the impacts offlooding within residential communities. It alsoaddress ghg emissions in which, once therelevant regulations have been implemented andenforced, businesses will be required to apply forpollution permits if emissions are beyond soon tobe prescribed emission levels. The full INDCdisclosure has been annexed to this report.
3.3 MAINSTREAMING CLIMATE CHANGE
The thrust for mainstreaming climate change inAntigua and Barbuda will be based on thenation’s ability to develop a well institutionalizedClimate Change Policy, included in which wouldbe mechanisms and targets to promote lowcarbon usage and to green the economy. In thepast, addressing climate change has been limited
30 This target includes distributive renewable energy capacity tobe used as backup energy by the commercial sector and someresidences. The assumption is that the commercial sector has fullbackup capacity at approx. 20 MW to continue operations whengrid electricity may be interrupted. Backup electricity generationis currently fossil fuel based.

POLICY AND MEASURES
67
primarily to the ability of the government toaccess multilateral financing allocations gearedspecifically to ‘climate only’ issues. This hascaused the general public to mentallycompartmentalize climate change as astandalone environmental occurrence asopposed to being an overarching concept anddriver of (or impediment to) sustainabledevelopment. In a 2008 Knowledge, Attitude andPractices study of Antigua and Barbuda, this wasevidenced by a marked lack of awareness of thenon-hydro-meteorological impacts of climatechange. It will only be through theinstitutionalized development of a vibrant greeneconomy that stakeholders and other nationalswill begin to make the mental linkages betweenclimate change, other sectors, the economy andsociety.
The Green Economy is defined by UNEP as “aneconomy in which income and employment aredriven by public and private sector investmentsthat reduce carbon emissions and pollution,enhance energy and resource efficiency, andprevent loss of biodiversity and ecosystemservices. A green economy, therefore, requires adifferent way of thinking of economic growth – itrequires replacing the focus on exploitation ofnatural capital with a focus on efficient andsustainable use, employment creation, andminimizing or reversing negative environmentalimpacts, albeit underscoring the economicdimensions of sustainability.”
In Antigua and Barbuda, transitioning to a greeneconomy is seen as an effective mechanismtoward climate change mainstreaming because:
• The majority of energy generation inAntigua and Barbuda is fossil fuel based,all of which is imported;
• Its location and climate is deemed to bewell suited to the use of a number ofrenewable energy options;
• The savings accrued from allowing REand EE technologies to comprise anincreasing portion of the national energyand transportation sectors willsignificantly reduce the national deficit asall fossil fuel is imported and also provideincreased capital for investment;
• Present, water produced fromdesalination ranges from 62% - 95% ofdemand. Establishing a green economywill increase the capacity and usage ofsurface water storage, which issignificantly cheaper than desalination(US $3.00/m3 from surface water versus$4.70/m3 from desalination);
• The type of employment associated witha green economy will support sustainablelivelihoods and should increase the sizeof the job market and encourage levels oflocal entrepreneurship;
• The environmental benefits associatedwith a green economy will enhance andensure the sustainability of the tourismsector, to which Antigua and Barbuda isheavily dependent.
As a means of allowing the citizenry to gain a first-hand awareness of addressing climate changeissues and the green economy, the Governmentthrough the APUA has eased restrictions anddeveloped an interconnection policy whichallows residents to generate up to 50 KW fromrenewable energy sources. However, thismechanism in mainly utilized by the affluent andsome sections of the corporate sector but lacksthe level of infiltration (in rural communities) tosignificantly reduce GHG emissions. What isneeded is for government to source the capitalinvestment to establish large-scale projects thatwill benefit the wider population.

VULNERABILITY AND ADAPTATION
68
4 VULNERABILITY, ASSESSMENTS, CLIMATECHANGE IMPACTS AND ADAPTATIONMEASURES
Vulnerability to climate change is identified as“the degree to which a system is susceptible to orunable to cope with, adverse effects of climatechange, including climate variability andextremes”. It is the propensity or predispositionto be adversely affected by climate impacts.Vulnerability encompasses a variety of conceptsincluding sensitivity or susceptibility to harm andlack of capacity to cope and adapt31. Accordingly,many factors are involved in its assessment andas a result, particular areas or communities maydemonstrate differing degrees of vulnerability.
Determining the degree to which a country orcommunity is vulnerable to climate relatedevents and the extent of their capacity to adaptand/or cope is important in order to ensure thatinvestments in adaptation measures achievedesired outcomes. The results of a VulnerabilityAssessment should be used to guide the decisionmaking process in prioritizing appropriate stepsthat ought be taken to adapt to climate change.If the country/community is already highlyvulnerable and does not have the financial,technical or human resource capacity toimplement and sustain adaptation practices, it isless likely to adapt to the impacts of climatechange.
31 IPCC, 2014. Working Group II Fifth Assessment Report Glossary.England: Cambridge Univeristy Press.
In 2013, the Department of Environment (DoE),formerly the Environment Division (ED,) incollaboration with the Antigua Public UtilitiesAuthority (APUA) organized a nationalconsultation where key stakeholders were giventhe opportunity to discuss and assess the actualand projected vulnerabilities of Antigua andBarbuda as it relates to climate change32. It wasunanimously agreed during the consultation thatthe water sector should be given the highestpriority with respect to its vulnerability to climatechange and direct impacts. Notwithstanding, thisassessment also assesses the effects of climatechange on the agriculture and health sectors.
As a small island developing state, Antigua andBarbuda is on the front lines of vulnerability toclimate change. Higher sea surface andatmospheric temperatures, a rise in sea level,inland flooding, drought and increased hurricaneintensity and storm surge have threatened thelives, property, and livelihoods of the Antigua andBarbuda’s population. Without appropriateadaptation measures, climate change will have anextremely harmful impact on people, propertyand ecosystems in Antigua and Barbuda. With theincreasing level of extreme weather events, andincreasing water demand, adaptation strategiesfor the water sector will be of long-termimportance. In this Chapter, the following areconsidered: governance structures (institutionalframework and policy); security of the quality andquantity of water sources; protection of
32 ED, 2013. Report on the Climate Change & Policy and ModelWater Act Project Consultation.
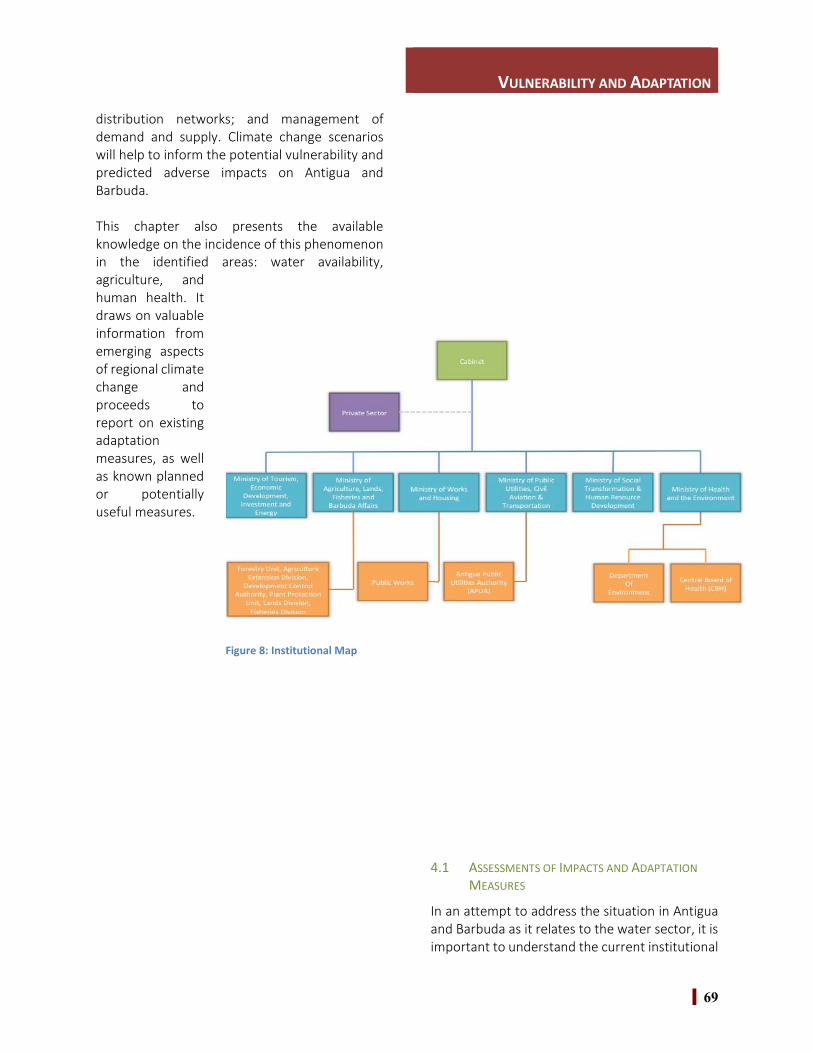
VULNERABILITY AND ADAPTATION
69
distribution networks; and management ofdemand and supply. Climate change scenarioswill help to inform the potential vulnerability andpredicted adverse impacts on Antigua andBarbuda.
This chapter also presents the availableknowledge on the incidence of this phenomenonin the identified areas: water availability,agriculture, andhuman health. Itdraws on valuableinformation fromemerging aspectsof regional climatechange andproceeds toreport on existingadaptationmeasures, as wellas known plannedor potentiallyuseful measures.
4.1 ASSESSMENTS OF IMPACTS AND ADAPTATIONMEASURES
In an attempt to address the situation in Antiguaand Barbuda as it relates to the water sector, it isimportant to understand the current institutional
Figure 8: Institutional Map

VULNERABILITY AND ADAPTATION
70
and legislative framework. Based on projectedclimate variability, the institutions will have toposition themselves to adapt new stressors andneeds that will result from projected impacts.Gaps are addressed here through the revision ofthe existing relevant policies, plans andlegislation that guide these institutions.
The institutional map depicted in Figure 8 showsagencies with a mandate related to water supplyand management. Notably, no single authorityhas an explicit mandate for watershedmanagement, however several institutions havea degree of responsibility for coastal zonemanagement (Table 16). The Extension Divisionin the Ministry of Agriculture, Lands, Fisheriesand Barbuda Affairs allocates state lands foragriculture. The Lands Division in the sameMinistry handles parcels of more than 2 hectares.The lack of coordination among agenciesfrequently leads to disputes arising as to who hasbeen allocated which land.
Antigua and Barbuda, in 2012, passed theSIRMZP, however its effective implementationhas been affected due to inadequate resourceswithin the Government system, previouslycaptured in Section 1.1.3. This plan would helpguide the proper uses of land in a rational way.
A large number of agencies are involved inactivities associated with watersheds, waterharvesting and treatment, management of themarine and coastal zone. These institutionsinclude government ministries, statutory bodies,NGO’s and community groups. The recentenactment of the EPMA 2015 provides animproved legal status for watersheds, includingthe establishment of a multi-stakeholderWatershed and Wetland ManagementCommittee, and the designation of criticalwetlands and watersheds. The national publicutility company (APUA) has legal rights over allwater resources but has no legal obligationsregarding watershed protection or maintenance.

VULNERABILITY AND ADAPTATION
71
Table 16: Summary of Agencies/ Responsibilities
AGENCY RESPONSIBILITY
Non-Government Organisations (NGOs) and Community Based Organisations (CBOs)
There are a number of NGOs and CBOs that play a major role in environmental awareness, training,advocacy, poverty alleviation and community development. They collaborate on many occasionsamongst themselves and with government agencies to pool resources and address key issuesaffecting communities and the environment, including water resources.
Ministry of Tourism, Economic Development, Investment and Energy
The Ministry of Tourism, Economic Development, Investment and Energy has portfolioresponsibility for beach protection, heritage sites, the Botanical Gardens, the National ParksAuthority, the National Economic & Social Council, Tourism Corporation, St. John's DevelopmentCorporation, A&B Hospitality, Investment Authority, and the National Energy Council.
Ministry of Agriculture, Lands, Fisheries and Barbuda Affairs
Forestry Unit Management of the country’s forest and woodland areas andtheoretically for reforestation. In recent years, the Forestry Unit has takenon activities more related to biodiversity conservation and eco-tourismdevelopment. The Unit is also the authority regarding the issuance ofpermits to import or export any form of wildlife.
DevelopmentControl Authority
The Authority regulates built development through the Physical PlanningAct of 2003, which provides for the granting or refusing of permission todevelop land. Implementing a Physical Development Plan with cleardirectives on further development of natural resources.
Fisheries Division Has some responsibility for coastal zone management, includingmangroves/wetlands that are included in the marine protected areas. TheDivision is given powers under the Marine Areas Act (1972), to restrictfishing in certain areas and to preserve habitats, flora and fauna, naturalbeauty or shipwrecks in marine areas. The Division also undertakesregular monitoring of major beaches for erosion.
Land Division Responsible for the management and control of Government lands,including land reclamation, land use and the sub-division of land.
AgriculturalExtensionDivision
Major responsibility for training and assisting farmers and the allocationof state lands to farmers for agricultural purposes. Plots of up to 2hectares (5 acres) can be leased out under the authority of the ChiefExtension Officer. Theoretically it is also responsible for control of strayanimals however, it is the Livestock Division that has responsibility, undernew legislation for the operation of the animal pound.
Plant ProtectionUnit
Responsibility for plant protection and recommendations as well asplaying an important role in the Pesticide Control Board. This Boardgoverns the pesticides that are approved for importation for use inAntigua and Barbuda. It is also responsible for plant quarantine at Portsof Entry

VULNERABILITY AND ADAPTATION
72
AGENCY RESPONSIBILITY
Ministry of Works and Housing
Public Works Responsible for roads and drainage structures throughout the country. Ithas considerable influence on sedimentation management as part of roadconstruction and maintenance as well as the management offloodwaters. The Director of Public Works is also responsible for theenforcement of the Beach Protection Act, which is supposed to preventthe unauthorized removal of material from beaches or foreshores and forgranting permits, where permission is approved.
Ministry of Public Utilities, Civil Aviation and Transportation
Water Division ofAPUA
Legal control over all water resources in the country and is mandated toprovide supplies of water to meet the municipal needs of the country. Itis also responsible for water quality testing, hydrological surveys, planning& digging of wells and construction of dams
Ministry of Social Transformation and Human Resource Development
The Ministry of Social Transformation and Human Resource Development has portfolioresponsibility for social welfare, community development, social improvement, povertyeradication, disaster preparedness, gender affairs, the civil service, establishment department,training division, human resource development & management services, youth empowerment andlocal government.Ministry of Health and the Environment
Central Board ofHealth
Responsible, among other things, for enforcement of the environmentalsanitation regulations, preventing the spread of infectious diseases,operating a mosquito control program and for the handling of liquid andsolid waste
National SolidWasteManagementAuthority
Responsible for the practical aspects of solid waste management and wasset up as part of a sub-regional program to improve management of solidwaste in the OECS and to provide facilities for the onshore disposal of thegrowing amount of cruise ship generated waste as required under theMARPOL Agreement
Department ofEnvironment(DoE)
Established with the primary role of coordinating the nationalenvironmental program. Since its formation as a Division in 1996, its rolehas expanded in response to environmental issues related to theDevelopment Control Authority (DCA) and the processing ofEnvironmental Impact Assessments (EIA’s). The DoE is responsible for theimplementation of Environmental Protection Orders, development andimplementation of national and international projects related torehabilitation and protection of environment; coordinates commitmentsto the MEAs; develops environmental legislation and any other dutiesassigned by the Ministry or the Cabinet of Antigua and Barbuda, asdefined in the Environmental Protection and Management Act of 2015. Italso collaborates with Forestry Unit to address issues of land degradationthrough the national urban reforestation programme.

VULNERABILITY AND ADAPTATION
73
AGENCY RESPONSIBILITY
Cabinet of Antigua and BarbudaThis is the executive branch of the Government of Antigua and Barbuda and includes therepresentative Ministers and Ministers of State from the various Ministries

VULNERABILITY AND ADAPTATION
74
4.2 CLIMATE VARIABILITY AND CHANGE
The combination of Antigua and Barbuda’s size,location and low-lying topography results in:
The island’s climate being influenced bythe ocean,
High temperatures, Low diurnal and seasonal variation in
temperature, and Vulnerability to tropical storms and
hurricanes.
Throughout the year, the country’s climate isstrongly modulated by the migration of the northAtlantic subtropical high, the eastward spreadingof the tropical Atlantic warm pool, the fairlysteady easterly trade winds and the passage oftropical waves, depressions, storms andhurricanes. As a result, the climate regime ischaracterized by a dry winter-wet summerpattern together with high and fairly uniformtemperatures year-round. Inter-annual climatevariability is strongly influenced by the El NiñoSouthern Oscillation. El Niño events bring warmerand drier conditions during the late, wet seasonand La Niña events bring colder and wetterconditions at this time.
A study was commissioned in 2014 under theRegional Gateway for Technology Transfer andClimate Change Action in Latin America and theCaribbean (REGATTA), implemented by theUnited Nations Environment Programme:Regional Office for Latin America and theCaribbean (UNEP-ROLAC) to conduct climatechange vulnerability, impact and adaptation (VIA)analysis in Antigua and Barbuda. That VIA analysiscomplemented and reinforced ongoing researchand planning processes in the country. It alsocontributed to this document by providing thefollowing analyses:
33Simpson, M. C., Clarke, J. F., Scott, D. J., New, M., Karmalkar, A.,Day, O. J., Taylor, M., Gossling, S., Wilson, M., Chadee, D., Stager,H., Waithe, R., Stewart, A., Georges, J., Hutchinson, N., Fields, N.,Sim, R., Rutty, M., Matthews, L., and Charles, S. 2012. CARIBSAVE
a. Standardized Precipitation Index (SPI)calculated from monthly precipitationtime series;
b. Remotely sensed Normalized DifferenceVegetation Index (NDVI) time series fromJanuary 2001 to late December 2014;
c. Monthly precipitation time series fromJanuary 1979 to October 2014, and;
d. National and regional wet and dry seasonanalysis.
In summary, detailed climate modelingprojections for Antigua and Barbuda indicate anincrease in average atmospheric temperatureand reduced average annual rainfall, and anincrease in rainfall variability leading to exposureto both flooding and drought conditions33. In thatVIA, the authors present findings of an analysis bySimpson et. al. (2012) 34 whereby observed andgeneral circulation models (GCM) projectedchanges in temperature and precipitation for thecountry are summarized. This information ispresented below (tables 17 and 18).
Climate Change Risk Atlas (CCCRA) - Antigua and Barbuda. DFID,AusAID and The CARIBSAVE Partnership, Barbados, West Indies.34Ibid.

VULNERABILITY AND ADAPTATION
75
Table 17: Observed and GCM Projected Changes in Temperature for Antigua and Barbuda
Antigua and Barbuda: Country Scale Changes in TemperatureObserved
Mean1970-99
ObservedTrend1960-2006
Projected changedby the 2020s
Projected changesby the 2050s
Projected changesby the 2080s
Min Median Max Min Median Max Min Median Max(°C) (change
in °C perdecade)
Change in °C Change in °C Change in °C
A2 0.2 0.7 0.8 0.9 1.4 1.8 1.7 2.3 3Annual 26.3 0.13* A1B 0.2 0.7 1 0.9 1.5 1.7 1.1 2.1 2.8
B1 0.3 0.7 0.8 0.5 1.1 1.3 0.8 1.4 2A2 0.3 0.7 0.9 1 1.4 1.8 1.7 2.4 3
DJF 25.2 0.10* A1B 0.2 0.7 1 0.9 1.5 1.7 1.2 2.1 3B1 0.3 0.7 0.8 0.5 1.1 1.4 0.8 1.4 2.1A2 0.2 0.6 0.8 0.7 1.2 1.7 1.5 2.2 2.8
MAM 25.7 0.11* A1B 0.1 0.6 1 0.9 1.4 1.7 0.9 2 2.6B1 0.1 0.6 1 0.4 1 1.3 0.6 1.3 1.9A2 0.1 0.7 0.8 0.8 1.3 1.7 1.6 2.2 2.9
JJA 27.3 0.16* A1B 0.2 0.7 0.9 0.9 1.4 1.7 1 1.9 2.7B1 0.2 0.6 0.8 0.4 1 1.2 0.8 1.3 2A2 0.3 0.8 1 1 1.4 1.9 1.8 2.4 3.2
SON 27.1 0.17* A1B 0.3 0.7 1.2 1 1.5 2 1.3 2 3.1B1 0.3 0.7 1.1 0.6 1.1 1.4 0.9 1.4 2.1
(Source: Replicated from the CARIBSAVE Climate Change Risk Atlas (CCCRA) - Antigua and Barbuda. DFID,AusAID and The CARIBSAVE Partnership, Barbados, West Indies; Simpson, et. al., 2012)

VULNERABILITY AND ADAPTATION
76
Table 18: Observed and GCM Projected changes in Precipitation for Antigua and Barbuda
Antigua and Barbuda: Country Scale Changes in PrecipitationObserved
Mean1970-99
ObservedTrend1960-2006
Projected changedby the 2020s
Projected changesby the 2050s
Projected changesby the 2080s
Min Median Max Min Median Max Min Median Max(mm permonth)
(changein mm
perdecade)
Change in mm permonth
Change in mm permonth
Change in mm permonth
A2 -8 -2 3 -17 -3 10 -31 -6 8Annual 172 -2.8 A1B -5 -1 7 -9 -3 8 -21 -5 13
B1 -8 -2 9 -10 -2 5 -12 -4 8A2 -8 0 8 -10 -2 3 -8 -1 6
DJF 138.9 2.9 A1B -6 0 4 -5 0 6 -22 0 3B1 -8 0 5 -7 -1 4 -15 0 7A2 -8 -1 9 -17 -1 10 -25 -2 3
MAM 133.4 -5.9 A1B -4 0 6 -11 0 7 -17 -1 6B1 -2 0 11 -10 0 3 -8 0 5A2 -18 -3 8 -27 -9 11 -64 -16 4
JJA 176.9 -4.2 A1B -12 -2 11 -21 -10 14 -44 -9 12B1 -18 -3 20 -26 -6 0 -22 -10 10A2 -17 -3 10 -20 -4 24 -48 -11 26
SON 235.3 -3.6 A1B -13 0 13 -22 -3 21 -32 -2 41B1 -24 -1 14 -28 -1 20 -22 -3 23
(Source: Replicated from the CARIBSAVE Climate Change Risk Atlas (CCCRA) - Antigua and Barbuda. DFID,AusAID and The CARIBSAVE Partnership, Barbados, West Indies; Simpson, et. al., 2012)

VULNERABILITY AND ADAPTATION
77
4.3 INCREASED CLIMATE VARIABILITY
The risks of higher temperatures, sea levelrise, flooding, drought, and increasedhurricane intensity and storm surge areexamined this section.
4.4 CHANGES IN MEAN CLIMATE: RAINFALL
Most rainfall stations in Antigua reflect a bi-modal pattern. This has been characterizedby maxima in May and October, with thelatter exhibiting the higher records (Image 4).Rainfall observations from the V.C. BirdAirport reveal however, that the bi-modalpattern is less well defined. Furtherexamination of the rainfall periods bydecades (1970-2011) from this particular
station suggest a shift in seasonality with twopeaks occurring between August andNovember, though still exhibiting a bi-modaldistribution (Figure 9).
The V.C Bird Airport station also records anaverage of 12.0 - 12.7 rain days per month forJuly-December, which correlates to theactive part of the hurricane season. TheCodrington station in Barbuda (image 5)shows a single primary peak in averagemonthly rainfall around October where anaverage of 200 mm is recorded.
Image 4: Monthly rainfall Climatology stations in Antigua

VULNERABILITY AND ADAPTATION
78
The percentage contribution of monthlytotals to annual rainfall amounts suggests
that the seasons over Antigua may bedescribed as early dry (January-March), earlywet (April-June) and late wet (July-December). Most of the stations in Antiguagenerally exhibit similar seasonal patterns.The rainfall pattern over Antigua is largelyconditioned by the North Atlantic High (NAH)pressure system, this is a large, subtropical,semi-permanent centre of high atmosphericpressure typically found south of the Azoresin the Atlantic Ocean between 30° N and 35°N. Codrington in Barbuda exhibits a singlerainfall season July to December.
Image 5: Monthly Rainfall Climatology for Barbuda

VULNERABILITY AND ADAPTATION
79
The primary source of rainfall from June toNovember is the passage of easterly wavesthat traverse the Atlantic Ocean from thewest coast of Africa to the Caribbean. Thewaves are themselves a source of convectionand can develop into depressions, stormsand tropical cyclones under conduciveconditions. Near July, a temporary southwardmovement of the NAH is associated withdiminished rainfall and the occurrence of amid summer drying. Enhanced rainfall occurswith the return of the NAH to the north andthe passage of the Inter TropicalConvergence Zone (ITCZ) northward. Whenthe NAH treks south again at the end of theyear, it marks the onset of the dry season.Another atmospheric feature important torainfall variations during the rainfall season(s)
35 Gomes J., 2008. Antigua and Barbuda Red CrossBackground Document: Impacts of Climate Change and
is the Tropical Upper-level TroposphericTrough (TUTT); a trough situated in the upperlevel (200 hPa) tropics.
4.5 CHANGES IN MEAN CLIMATE:TEMPERATURE
Due to the small size of Antigua and Barbudaand limited downscaling of climatic models, itis not easy to provide projections for thecountry’s climate with any detailed certainty;however, the trend towards a warmerclimate in Antigua is however wellestablished.
It is anticipated that air temperature withinthe insular Caribbean will increase by 1.8 –4.0°C by 2099, while air temperaturesspecifically in Antigua and Barbuda areexpected to increase by as much as 1.3°C by2050 and by up to 3.5 °C by the end of thecentury35. In recent years, both maximum
Disaster Risk Reduction in Antigua and Barbuda. Antiguaand Barbuda: Antigua and Barbuda Red Cross.
Figure 9: Average monthly rainfall by decades. Data recorded from VC Bird International Airport
20406080100120140160180
Jan Feb Mar Apr May Jun July Aug Sept Oct Nov Dec
Raifa
ll/m
m
Months
Monthly Rainfall Averages 1970-2011
1970-19791980-19891990-19992000-20111970-2011

VULNERABILITY AND ADAPTATION
80
and minimum temperatures in Antigua andBarbuda have increased, providingobservational evidence that the temperaturein Antigua and Barbuda is increasing. It is alsoanticipated that the warming trend willcontinue, which will increase the frequencyof hot days and reduce the frequency of coolnights36.
The average monthly maximum andminimum temperature range is 5°C and 4°Crespectively with temperatures peakingduring summer months. Maximum
temperatures may reach 31.2°C in Augustand September, while minimum temperaturevalues dropped to 22°C in January/February(Figure 10). The 1990’s was the hottestdecade on record with the year 1998 beingthe hottest year, likely linked to El NinoSouthern Oscillation events and the positivephase of the Atlantic Multi-decadalOscillation (AMO). This is illustrated in Figure11.
36 Gomes J., 2008. Antigua and Barbuda Red CrossBackground Document: Impacts of Climate Change and
4.6 CHANGES TO MEAN CLIMATE: EXTREMEWEATHER
A significant number of extreme events ofdifferent categories and strikes haveimpacted Antigua and Barbuda between1971 and 2012. These events tend to beaccompanied with heavy rainfall. Forexample, May 1979 showed heavy rainfalland this is closely linked with Hurricane
Claudette. Similarly, September 1995 hadanomalously high rainfall, due to HurricaneLuis. November 1999 showed anomalouslyhigh rainfall and this correlates withHurricane Jose.
Disaster Risk Reduction in Antigua and Barbuda. Antiguaand Barbuda: Antigua and Barbuda Red Cross.
Figure 10: Monthly variation in average daily maximum, minimum, and mean temperature 1995 -2014
20212223242526272829303132
Tem
pera
ture
◦ C
Months
Variation in average daily maximum, minimum andmean temperature
Average Daily MaxTempAverage DailyMean Temp

VULNERABILITY AND ADAPTATION
81
The period assessed from 1970 to 2011 islargely during the low phase of the AMO withthe exception of the late 1990’s.Anomalously high rainfall events wererecorded during the positive phase of theAMO. During this period a total of 10 tropicaldepression, 16 tropical storms, 6 category Ihurricanes, 2 category II hurricanes, 3category III hurricanes and 4 category IVhurricanes affected Antigua and Barbuda invarying degrees. These range from directlyhitting the country to passing up to 105nautical miles [minds] off shore. In all casesstorm conditions were felt with the mostdevastating being from impacts and/or directhits to the country.
The most devastating system to affectAntigua and Barbuda was Hurricane Luis(1995) resulting in 17% decrease in touristarrivals that year, 7000 being unemployed,90% of buildings damaged or destroyed anddamages amounting to 30.49% of the GDP.Other significant storms were HurricaneGeorges (1998), Hurricane Jose (1999) andLenny (1999) and Hurricane Earl (2010), (seeTable 19).
Table 19: Economic Loss/Damage of events between1995 - 2010
Year EventEconomic
Loss/Damages($XCD)
1995 HurricaneLuis
346.55 million
1998 HurricaneGeorges
200 million
1999 HurricanesJose & Lenny
247.43 million
2008 HurricaneOmar
48.6 million
2010 HurricaneEarl
slightly > 52million
During the passage of Hurricane Earl in 2010,7.78 inches of rain was recorded within 24hours and this resulted in significant damagesto the Agriculture sector including Fisheries,
Figure 11: Average monthly mean daily temperature by decades. Data recorded from VC Bird InternationalAirport
23.5024.0024.5025.0025.5026.0026.5027.0027.5028.0028.5029.00
Jan Feb Mar Apr May Jun July Aug Sept Oct Nov
Tem
pera
ture
(°C)
Months
Monthly Mean Temperature Averages (1970-2011)
1970-19791980-19891990-19992000-20111970-2011

VULNERABILITY AND ADAPTATION
82
road networks, utilities and infrastructural
damage to hotels37.
It was observed that after a near thirty-yearlull (1961-1989) in direct hits, the countryexperienced the effects of eight hurricanes(direct hits or near brushes) between 1995and 2000 (Figure 12). In general, NorthAtlantic hurricane frequency is influenced bythe AMO, which yields active and inactivephases lasting 10 or more years38. Since 1995,the North Atlantic has swung into an activehurricane phase. Since 2000 there has againbeen a lull in hurricane impact on thecountry. This is in spite of the fact that thecurrent active hurricane phase continues inthe north tropical Atlantic.
37 Gore-Francis, J. (2013). Antigua and Barbuda SIDS 2014Preparatory Progress Report. Antigua and Barbuda: Ministryof Agriculture, Housing, Lands and the Environment.38Goldenberg, S., C. Landsea, A. Mestas-Nuñez, W. Gray(2001) The Recent Increase in Atlantic Hurricane Activity:Causes and Implications Science 20 July 2001:Vol. 293. no.5529, pp. 474 – 479.
4.7 CHANGES IN MEAN CLIMATE: SEA LEVELRISE AND STORM SURGE
Using proxy and instrumental data, it isvirtually certain (i.e. with 99-100%probability) that the rate of global mean sealevel rise has accelerated during the last twocenturies, marking the transition fromrelatively low rates of change during lateHolocene (order tenths of mm/year-1) tomodern rates (order mm/year-1). Rates andabsolute changes in global mean sea levelpressure obtained from the IPCC (2013)39 areincluded in the table 20.
39IPCC, 2013: Summary for Policymakers. In: Climate Change2013: The Physical Science Basis. Contribution of WorkingGroup I to the Fifth Assessment Report of theIntergovernmental Panel on Climate Change [Stocker, T.F.,D. Qin, G.-K. Plattner, M. Tignor, S.K. Allen, J. Boschung, A.Nauels, Y. Xia, V. Bex and P.M. Midgley (eds.)]. CambridgeUniversity Press, Cambridge, United Kingdom and New York,NY, USA.
Figure 12: Category of cyclones and their number of strike types for Antigua and Barbuda (1971 - 2012)
012345
1971 - 1980 1981 - 1990 1991 - 2000 2001 - 2010
Num
ber
of e
vent
s
Years
Types of events and number of strikes between 1971 -2010
Tropical DepressionTropical StormHurricane Cat1Hurricane Cat2Hurricane Cat3Hurricane Cat4
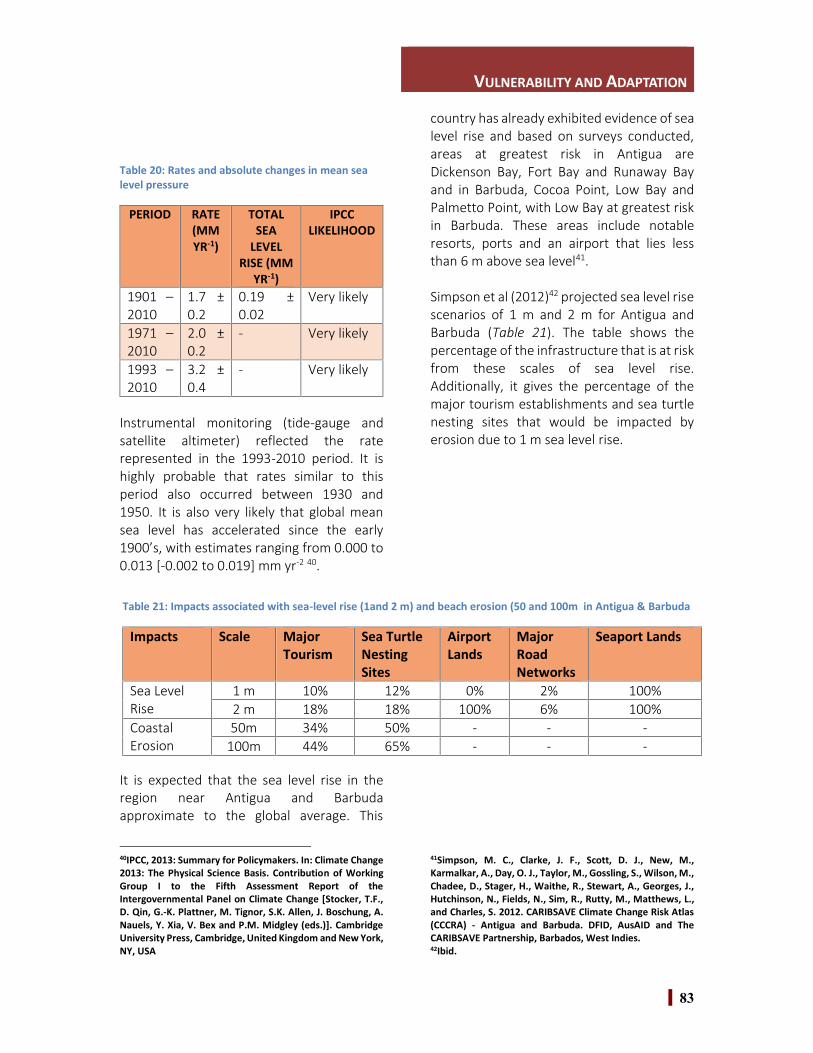
VULNERABILITY AND ADAPTATION
83
Table 20: Rates and absolute changes in mean sealevel pressure
PERIOD RATE(MMYR-1)
TOTALSEA
LEVELRISE (MM
YR-1)
IPCCLIKELIHOOD
1901 –2010
1.7 ±0.2
0.19 ±0.02
Very likely
1971 –2010
2.0 ±0.2
- Very likely
1993 –2010
3.2 ±0.4
- Very likely
Instrumental monitoring (tide-gauge andsatellite altimeter) reflected the raterepresented in the 1993-2010 period. It ishighly probable that rates similar to thisperiod also occurred between 1930 and1950. It is also very likely that global meansea level has accelerated since the early1900’s, with estimates ranging from 0.000 to0.013 [-0.002 to 0.019] mm yr-2 40.
It is expected that the sea level rise in theregion near Antigua and Barbudaapproximate to the global average. This
40IPCC, 2013: Summary for Policymakers. In: Climate Change2013: The Physical Science Basis. Contribution of WorkingGroup I to the Fifth Assessment Report of theIntergovernmental Panel on Climate Change [Stocker, T.F.,D. Qin, G.-K. Plattner, M. Tignor, S.K. Allen, J. Boschung, A.Nauels, Y. Xia, V. Bex and P.M. Midgley (eds.)]. CambridgeUniversity Press, Cambridge, United Kingdom and New York,NY, USA
country has already exhibited evidence of sealevel rise and based on surveys conducted,areas at greatest risk in Antigua areDickenson Bay, Fort Bay and Runaway Bayand in Barbuda, Cocoa Point, Low Bay andPalmetto Point, with Low Bay at greatest riskin Barbuda. These areas include notableresorts, ports and an airport that lies lessthan 6 m above sea level41.
Simpson et al (2012)42 projected sea level risescenarios of 1 m and 2 m for Antigua andBarbuda (Table 21). The table shows thepercentage of the infrastructure that is at riskfrom these scales of sea level rise.Additionally, it gives the percentage of themajor tourism establishments and sea turtlenesting sites that would be impacted byerosion due to 1 m sea level rise.
41Simpson, M. C., Clarke, J. F., Scott, D. J., New, M.,Karmalkar, A., Day, O. J., Taylor, M., Gossling, S., Wilson, M.,Chadee, D., Stager, H., Waithe, R., Stewart, A., Georges, J.,Hutchinson, N., Fields, N., Sim, R., Rutty, M., Matthews, L.,and Charles, S. 2012. CARIBSAVE Climate Change Risk Atlas(CCCRA) - Antigua and Barbuda. DFID, AusAID and TheCARIBSAVE Partnership, Barbados, West Indies.42Ibid.
Table 21: Impacts associated with sea-level rise (1and 2 m) and beach erosion (50 and 100m in Antigua & Barbuda
Impacts Scale MajorTourism
Sea TurtleNestingSites
AirportLands
MajorRoadNetworks
Seaport Lands
Sea LevelRise
1 m 10% 12% 0% 2% 100%2 m 18% 18% 100% 6% 100%
CoastalErosion
50m 34% 50% - - -100m 44% 65% - - -

VULNERABILITY AND ADAPTATION
84
In addition to sea leave rise, another majorimpact to the coastal zone is storm surges.These have resulted in severe sand lossaffecting many of the beaches in the country.For example, between 1996 and 2001, PalmBeach in Barbuda experienced erosion at analarming rate of 0.8 m/year and can expectincreased rates of erosion in the future43.
The high density of tourism development onthe coast increases vulnerability to climatechange and sea level rise as well as the risk ofdegradation of coastal and marinebiodiversity. A reduction in the width of thebeach buffer zone due to sea level rise andstorm surge will increase the vulnerability ofcoastal infrastructure to erosive wave actionand can contribute to the loss of critical fishlanding sites in Antigua and Barbuda. Inaddition, impacts of sea level rise and stormsurge on beaches increases the vulnerabilityof species of marine turtles, shore birds andother species that depend on the coastalzone for survival.
4.7.1.1 DroughtA drought can be classified as an extendedperiod of deficiency in precipitation (relativeto what is considered normal), which is theninsufficient to meet economic, social andenvironmental demands. According to theU.S National Drought Mitigation Center,there are three main types/definitions ofdrought: 1)meteorological, 2) agriculturaland 3) hydrological drought. Given therelatively small size of Antigua and Barbuda
43 Simpson, M., Scott, D., Harrison, M., Silver, N., O’Keeffe,E., Harrison, S., et al., 2010. Quantification and Magnitudeof Losses and Damages Resulting from the Impacts ofClimate Change: Modelling the Transformational Impactsand Costs of Sea Level Rise in the Caribbean. Barbados:United Nations Development Programme (UNDP)..44 CARIBSAVE, 2014. Vulnerability, Impact and AdaptationAnalysis in the Caribbean (VIAAC). National VulnerabilityAnalysis for Antigua and Barbuda. Prepared with funding
drought effects are felt island-wide and are arecurrent feature of the climate.Owing to the country’s geographic positionand topographic features, the islands ofAntigua and Barbuda are two of the driestislands in the Caribbean region. The lowlevels of rainfall combined with porouslimestone geology make the islandsvulnerable to hydrological drought44. Antiguaand Barbuda has a long history of droughts.Overall rainfall has decreased significantlyfrom historical records, evaporation rates arehigh and therefore the impact of drought hasbecome more severe recently in thecountry45.
Previously, meteorological drought forAntigua/Barbuda was defined using aprecipitation level of 80% or less of yearlyaverage rainfall (or <30.74 inches in Antiguaand < 27.79 inches in Barbuda) for a droughtyear. However, given the variability in rainfalldistribution, the Antigua BarbudaMeteorological Department started using anadjusted version of the decile (DI) methoddeveloped by Gibbs and Maher (1967).Rainfall periods of three months or more areassessed to determine whether they fallbelow the 30th percentile of historicalrecords. Drought levels are based on themaximum consecutive three-month deficit ofhistorical records and are defined in Table 22:
from the United Nations Environment Programme: RegionalOffice for Latin America and the Caribbean (UNEP:ROLAC).45Simpson, M. C., Clarke, J. F., Scott, D. J., New, M.,Karmalkar, A., Day, O. J., Taylor, M., Gossling, S., Wilson, M.,Chadee, D., Stager, H., Waithe, R., Stewart, A., Georges, J.,Hutchinson, N., Fields, N., Sim, R., Rutty, M., Matthews, L.,and Charles, S. 2012. CARIBSAVE Climate Change Risk Atlas(CCCRA) - Antigua and Barbuda. DFID, AusAID and TheCARIBSAVE Partnership, Barbados, West Indies.
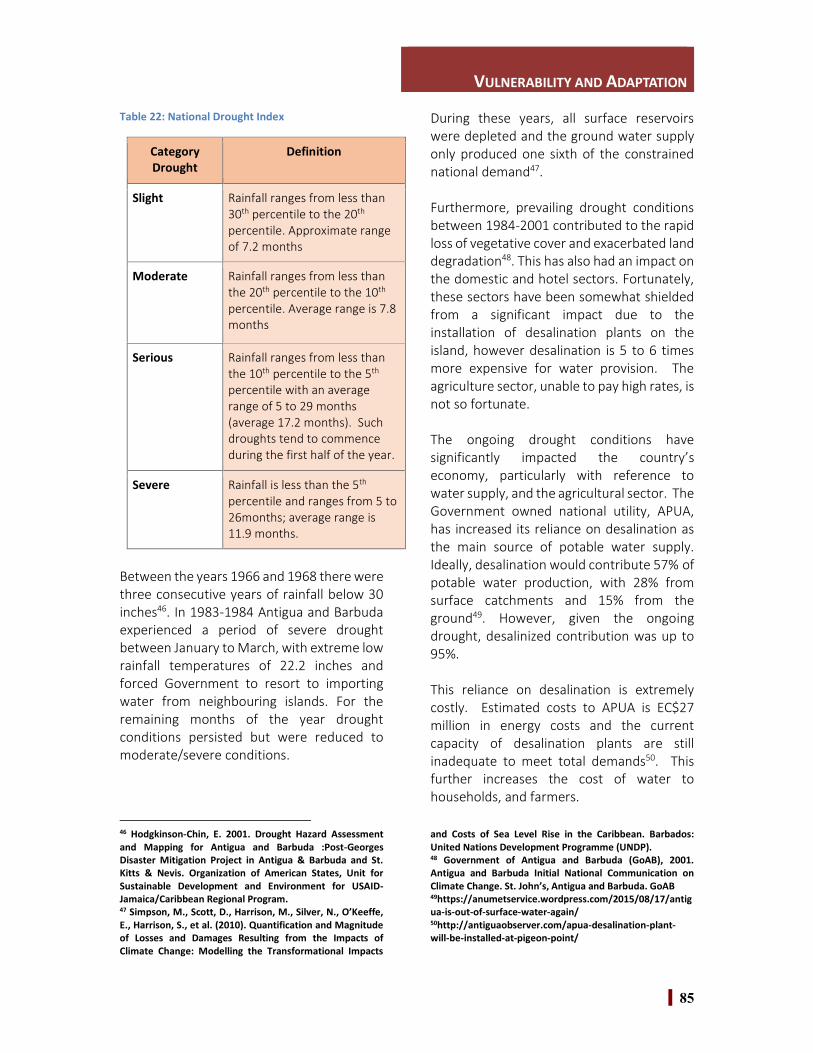
VULNERABILITY AND ADAPTATION
85
Table 22: National Drought Index
CategoryDrought
Definition
Slight Rainfall ranges from less than30th percentile to the 20th
percentile. Approximate rangeof 7.2 months
Moderate Rainfall ranges from less thanthe 20th percentile to the 10th
percentile. Average range is 7.8months
Serious Rainfall ranges from less thanthe 10th percentile to the 5th
percentile with an averagerange of 5 to 29 months(average 17.2 months). Suchdroughts tend to commenceduring the first half of the year.
Severe Rainfall is less than the 5th
percentile and ranges from 5 to26months; average range is11.9 months.
Between the years 1966 and 1968 there werethree consecutive years of rainfall below 30inches46. In 1983-1984 Antigua and Barbudaexperienced a period of severe droughtbetween January to March, with extreme lowrainfall temperatures of 22.2 inches andforced Government to resort to importingwater from neighbouring islands. For theremaining months of the year droughtconditions persisted but were reduced tomoderate/severe conditions.
46 Hodgkinson-Chin, E. 2001. Drought Hazard Assessmentand Mapping for Antigua and Barbuda :Post-GeorgesDisaster Mitigation Project in Antigua & Barbuda and St.Kitts & Nevis. Organization of American States, Unit forSustainable Development and Environment for USAID-Jamaica/Caribbean Regional Program.47 Simpson, M., Scott, D., Harrison, M., Silver, N., O’Keeffe,E., Harrison, S., et al. (2010). Quantification and Magnitudeof Losses and Damages Resulting from the Impacts ofClimate Change: Modelling the Transformational Impacts
During these years, all surface reservoirswere depleted and the ground water supplyonly produced one sixth of the constrainednational demand47.
Furthermore, prevailing drought conditionsbetween 1984-2001 contributed to the rapidloss of vegetative cover and exacerbated landdegradation48. This has also had an impact onthe domestic and hotel sectors. Fortunately,these sectors have been somewhat shieldedfrom a significant impact due to theinstallation of desalination plants on theisland, however desalination is 5 to 6 timesmore expensive for water provision. Theagriculture sector, unable to pay high rates, isnot so fortunate.
The ongoing drought conditions havesignificantly impacted the country’seconomy, particularly with reference towater supply, and the agricultural sector. TheGovernment owned national utility, APUA,has increased its reliance on desalination asthe main source of potable water supply.Ideally, desalination would contribute 57% ofpotable water production, with 28% fromsurface catchments and 15% from theground49. However, given the ongoingdrought, desalinized contribution was up to95%.
This reliance on desalination is extremelycostly. Estimated costs to APUA is EC$27million in energy costs and the currentcapacity of desalination plants are stillinadequate to meet total demands50. Thisfurther increases the cost of water tohouseholds, and farmers.
and Costs of Sea Level Rise in the Caribbean. Barbados:United Nations Development Programme (UNDP).48 Government of Antigua and Barbuda (GoAB), 2001.Antigua and Barbuda Initial National Communication onClimate Change. St. John’s, Antigua and Barbuda. GoAB49https://anumetservice.wordpress.com/2015/08/17/antigua-is-out-of-surface-water-again/50http://antiguaobserver.com/apua-desalination-plant-will-be-installed-at-pigeon-point/

VULNERABILITY AND ADAPTATION
86
The agriculture sector is highly vulnerable toclimate related events and due to droughtconditions it has suffered extensive croplosses. For example, in 2010 onion andtomato crops in Antigua and Barbudadecreased by 25 and 30% respectively due towater stressed conditions51.
A drought risk map created in the DroughtImpact Assessment Report52 identifies thenortheast and southeast watersheds as themost vulnerable areas to drought in Antigua.The drought vulnerability zones weredetermined based on environmental,meteorological, hydrological, infrastructureand land use parameters (Map 6 and 7).
51 Roberts, D., 2013. Status of Disaster Risk Management:Plans for Floods, Hurricanes and Drought in the AgricultureSector: A Caribbean Perspective. Bridgetown, Barbados:Food and Agriculture Organisation (FAO) Sub RegionalOffice.
Using the criteria of the drought map, withthe presence of wells, it clearly shows thatthe watersheds of Cades Bay, Claremont,Christian Valley and Body Ponds are notaffected by drought as the watersheds in thenorth and east. The agricultural zone forcrops and grazing to some extent coincideswith the location of groundwater wells, withareas of high rainfall and low drought risk The
GoAB (2001)53 cited that, based on thedrought vulnerability zones, the northeastand southwest of Antigua are the mostvulnerable to drought. It went on to statethat the most vulnerable area to drought onthe island was the southeast of Antiguabetween English Harbour and St. James.
52 Hodgkinson-Chin. 2001. Drought Hazard Assessment andMapping for Antigua and Barbuda53 Government of Antigua and Barbuda (GoAB), 2001.Antigua and Barbuda Initial National Communication onClimate Change. St. John’s, Antigua and Barbuda. GoAB
Map 6: Drought Risk map based on watershed groupings
Source: replicated the Drought Hazard Assessment and Mapping for Antigua and Barbuda; Hodgkinson-Chin, 2001)

VULNERABILITY AND ADAPTATION
87
In Barbuda, most of the developmentoccurred within the zone of high droughtvulnerability to include the town ofCodrington and the entire south coast fromRiver Port to Cocoa Point. However,agriculture and tourism development withinPalmento in Barbuda were located within thezone of low drought vulnerability. Theaverage annual rainfall between 1965 and2000 was 34.74 inches (Met Office, 2001) inBarbuda. During this period, if < 27.79inches/year of rain is used to definemeteorological drought, then drought yearswere experienced in 1966, 1967, 1968, 1971,1977, 1983, 1990, 1991, 1994 and 2000.
4.7.1.2 FloodingFlooding in most SIDS is due to the effect ofshort duration, high intensity rainfallassociated primarily with hurricanes andtropical storms. Although Antigua andBarbuda is prone to severe droughts,flooding is a growing and critical concern forthe country. In Antigua and, to a lesserextent, Barbuda, flooding has beenresponsible for significant social andeconomic loss, and even drowning fatalities.Some of the major hurricanes that haveaffected the island and caused major damagefrom flooding are: Hurricane Lenny(November, 1999), Hurricane Omar(October, 2008) and Hurricane Earl (August,2010).
Hurricane Lenny is noted for the level offlooding which directly affected Antigua andBarbuda when an estimated 20 to 33 inchesof rain fell over a 48-hour period. Thenorthwest and southern tips of Antigua wereaffected the most with severe landslides andmajor flooding was recorded. An estimated
Map 7: Agricultural zones by watershed groups

VULNERABILITY AND ADAPTATION
88
65% of Barbuda went under water. The eyeof Hurricane Omar passed some 126 milessouth west of Antigua and Barbuda; however,during its passage 6 inches of rainfall wasrecorded at the V.C Bird Station. The countryreceived a tropical storm effect that causedmassive flooding and landslides54. HurricaneEarl hit the island recording 7.78 inches in aperiod of 24 hours. The impact of thehurricane resulted in flooding of somecommunities, damages to roads, bridges,drains, culverts and the generalinfrastructure. The road networks in the ruralareas and crops were also damaged55.
In addition to the passage of the tropicalcyclones, other reasons for the increase inflood risk include poor developmentpractices, blockage of natural and man-madewatercourses and poor maintenance ofvegetation growth and increased soildeposits in and around waterways.
Cooper (2001)56 identified areas in Antiguaand Barbuda prone to flooding as thosehaving mild slopes (0.2% to 0.5%). This 2001study indicated that most of the flood proneareas are located in areas of low slope <5%and elevations <135m. Lithologically, theflood zones range from volcanic,volcanoclastics in the Southwest watershed(SWW) to the alluvium and limestone in thenorth. There is insufficient data on the typeof flooding but from the rainfall dataavailable, the types of drainage and lithologysuggest that the island gets both surface andgroundwater flooding.
According to the National Office of DisasterServices, the flood prone areas in Antigua andBarbuda include:
54 National Office of Disaster Services, 2008. Hurricane OmarPreliminary Summary Report. Government of Antigua andBarbuda.55 National Office of Disaster Services, 2010. Hurricane EarlPreliminary Report. Government of Antigua and Barbuda.
Table 23: Flood Prone villages in Antigua andBarbuda
Airport Road All Saints (MackPond)
Lightfoot McKinnonsBolans Bath LodgeBendals Road BethesdaOld Parham Road SwetesCassada Gardens Cedar GroveCobbs Cross FreetownPigotts (BurmaRoad)
Jennings
Grays Farm Paynters (east &west)
John Hughes(Folly Gut)
Liberta
Picadilly Yorks villageVilla & Point
Lagoon & Marl Hole area in Barbuda
In Antigua, surface water flooding could bethe type seen in the southwest area wherehigh run-off from storms and hurricanescauses water settling on the downstream endof the watersheds. Groundwater floodingwould be more common in the east andnorth due to the presence of limestoneallowing for higher subsurface infiltration. InBarbuda, run-off tends to be rapid as a resultof very thin soil depths that provide very littleinfiltration and relatively low flowretardation. The run-off tends to accumulatein depressions or flow through Codrington onits way to be discharged in the salt ponds andthe sea.
The flood zones have been categorized asvery high, high, moderate and very low.However, this categorization does notattempt to provide water levels at various
56 Cooper, B. and Brown, V. 2001. Integrating Managementof Watersheds & Coastal Areas in Small Island DevelopingStates of the Caribbean. National Report for Antigua andBarbuda.

VULNERABILITY AND ADAPTATION
89
places within the flood plain, but is ratherbased on the maximum volume of waterexpected to be ponded within the plain fromthe 24 hour, 100 year return period. Duringsuch a rainstorm the extent of the hazardzone may be larger than the actual areainundated and water depths are likely to begreater in areas close to waterways and indepressions.
In Antigua, surface water flooding could bethe type seen in the southwest area wherehigh run-off from storms and hurricanescauses water settling on the downstream endof the watersheds. Groundwater floodingwould be more common in the east andnorth due to the presence of limestoneallowing for higher subsurface infiltration. InBarbuda, run-off tends to be rapid as a result
of very thin soil depths that provide very littleinfiltration and relatively low flowretardation. The run-off tends to accumulatein depressions or flow through Codrington onits way to be discharged in the salt ponds andthe sea.
The flood zones have been categorized asvery high, high, moderate and very low.However, this categorization does notattempt to provide water levels at various
places within the flood plain, but is ratherbased on the maximum volume of waterexpected to be ponded within the plain fromthe 24 hour, 100 year return period. Duringsuch a rainstorm the extent of the hazardzone may be larger than the actual areainundated and water depths are likely to begreater in areas close to waterways and indepressions.
Figure 13: Major Flood prone areas

VULNERABILITY AND ADAPTATION
90
4.8 VULNERABLE SECTORS
Stakeholder consultations and variousstudies identified key vulnerability sectorsrequiring urgent intervention as: biodiversita water resources agriculture and health
The following subsections will provide a morein-depth discussion of issues currectly facedwithin those sectors.
4.8.1 BIODIVERSITY
The threats to biodiversity within the countryare well documented in the country’sNational Biodiversity Strategy and ActionPlan (NBSAP)57. These are similar to manyother Caribbean SIDS and includeunsustainable management of the naturalresources exacerbated by the effects ofextreme weather patterns that are beingexperienced more frequently than in thepast. The degraded integrity andfunctionality of the island’s ecosystem hasreduced its capacity to cope with the variableweather patterns.
In Antigua and Barbuda, the agriculturesector has suffered due to continuedpractices of indiscriminate cutting, setting offires and uncontrolled grazing. This hascontributed to severe degradation,accelerated erosion and reducedproductivity of the land58. In addition tothese, poor farming practices have negativelyaffected biodiversity and have contributed tothe overall decline in ecosystem healthacross the islands59.
57 ED, 2014. Antigua and Barbuda National BiodiversityStrategy and Action Plan (NBSAP).58 Government of Antigua and Barbuda (GoAB), 2009.Antigua and Barbuda Second National Communication onClimate Change. St. John’s, Antigua and Barbuda. GoAB).59 Mitchell, 2009. Wallings Forest Conservation AreaManagement Plan. Volume II Annex. St. John’s Antigua andBarbuda. Prepared for the OECS Secretariat.
Specifically, certain species of flora and faunaexperience different levels of threats to theirsurvival. For example, the sea turtlepopulations (Chelonia mydas, Eretmochelysimbricata and Dermochelys coriacea) havebeen affected by the destruction of criticalnesting and foraging habitats because ofcoastal construction, sand mining, pollutionand over fishing60. Similarly, the florabiodiversity of the important forest reservearea of Wallings is threatened by theintroduction of invasive species such as thelemon grass. As mentioned earlier in thesection on National Circumstances, thelemon grass was noted as one of the mostcritical invasive species in 2010 because itcovered over 345 acres of land creating aserious problem for farmers. Other speciesthat threaten the biodiversity of the Wallingsarea include the Indian Mongoose, the BlackRat (Rattus rattus) and roaming goats.
Barbuda has experienced less developmentpressure, however, coastal erosion and saltwater intrusion threaten the biodiversity onthat island as well.
The barriers to Biodiversity protection aremany; the most important however is thetransition of lands from natural uses tohousing which results in permanent loss. TheSystems Plan for Protected Areas61 is the firststep in the identification of the systematicapproach to reduce the loss of biodiversity.The plan, while highlighting the financialchallenges for its implementation, does nothowever identify any ways to meet the costsassociated.
60 Government of Antigua and Barbuda (GoAB), 2009.Antigua and Barbuda Second National Communication onClimate Change. St. John’s, Antigua and Barbuda. GoAB).61 Environmental Advisors Inc., 2010. A Systems Plan forProtected Areas in Antigua and Barbuda. Funded by theOECS Protected Areas and Associated Livelihoods (OPAAL)Project.

VULNERABILITY AND ADAPTATION
91
4.8.2 WATER
Antigua has 86 small watersheds that, for thepurpose of land use and water resourceplanning, can be categorized into 13 largerwatershed management units (Map 8). Ofthese 13 watersheds, 6 of them (Body Ponds,Potworks, Fitches Creek, Parham, Bethesdaand Christian Valley) have been identified asmajor catchments based on socio-economicand agro-ecological conditions. These 6watersheds occupy 43% of the land area andcontain 80% of the groundwater supplies and90% of the surface water storage62.
The two largest watershed units Body Ponds(44.74km2) and Potworks (38.1km2) drain thenorthern slopes of the south west volcanicregion and the main parts of the Central Plainto the east and west respectively63.
62Cooper, B., & V. Bowen, 2001. Integrating Management ofWatersheds and Coastal Areas in Small Island DevelopingStates of the Caribbean: National Report for Antigua andBarbuda. St. John, Antigua and Barbuda: Environment
With respect to the geology of the country,Antigua is divided into three main geologicalregions running roughly parallel, from thenorth-west to south-east. The southwestregion is categorized as a volcanic regioncomprising of consolidated pyroclastics, lavaflows and hard igneous rocks in the uplandsand sedimentary material in the associatedvalley. The central plain is also considered asvolcanic origin, however in this case itconsists of a mixture of agglomerates, tuffsand conglomerates, together with somecherts and limestone. The northeastern partof the country on the other hand is composed
of a
mixture of hard limestone and softer marldeposits of the Antigua formation. The slopesin the southwest region range from 100-200,in the central plain regions are generally are<100, while the northeast has mainly flatlands.
Division, Ministry of Tourism and Environment, Governmentof Antigua and Barbuda.63ED, 2005. Draft National Action Plan for Antigua andBarbuda for the United Nations Convention to CombatDesertification.
Map 8: Antigua's Geology and Hydrology

VULNERABILITY AND ADAPTATION
92
In Antigua, Hill (1966) 64 produced a detaileddescription identifying 33 soil series that canbe conveniently grouped into 5 broadcategories according to depth and texture65.In the southwest volcanic region deepalluvial/colluvial soils can be found in thevalley systems while shallow soils are presentin the mountainous part. The central plain isdominated by deep kaolinitic clay soils.Shallow calcareous clay soils are distributedin the north of the limestone area while in theeastern part there is a complex of shallowand deep calcareous soils.
The combined effect of rainfall, geology andsoils accounts for the concentration ofresources. The majority of the wells andponds in Antigua are found within the sixmajor watersheds that were describedabove. Due to the nature of the groundwatersupply in water being described as a lens offresh water floating above salt water only tobe replenished by rainfall, the country hashad to rely heavily on desalination to providethe country with a constant supply of potablewater.
Currently, there are three (3) desalinationplants being operated in Antigua, twogovernment-owned and one privatelyowned. The largest desalination plant isprivately owned by SembCorp/Eneserve andprovides approximately 3.1MIG/Dp (60-75%of Antigua’s drinking water). The other twogovernment operated reverse osmosisdesalination plants located at APUA’s CampBlizzard site, and Ffryes Beach each produce600,000 Imperial Gallons per day. The cost of
64Hill, I., 1966. Soil and Land Use Surveys No. 19A & 19B:Antigua and Barbuda, Regional Research Centre, UWI, St.Augustine, Trinidad.65CEP., 1991. Country Environmental Profile: Antigua andBarbuda. Caribbean Conservation Association; 212 pp.66 Fernandes, 2011 in Environment Solutions Ltd. (ESL), 2014.Vulnerability and Capacity Assessment in the South WestCoast and Watershed Area of Antigua. EU-GCCA CaribbeanSupport Project.67Global Water Partnership Caribbean. (2013). Antigua andBarbuda: National Stakeholder Consultation on Water
producing water by desalination (US$4.70per m3) is significantly more expensive thanthat for groundwater (US$2.50 per m3) andsurface water (US$3.00 per m3)66. Between70% and 100% of Antigua’s daily water supplyduring the wet years and the very dry periodsrespectively is obtained from desalinationwater, with the remainder supplied byground and surface water67.
Less information is available on Barbuda withrespect to mapped watersheds units anddrainage lines. However, Barbuda does have10 watersheds68 and categorised as an aridisland with the absence of permanentstreams and a few seasonal lakes and inlanddepressions. Similarly to Antigua, it is alsodivided into three geological regions. Theseinclude the Highlands limestone area, theCodrington limestone area and the PalmettoPoint Series composed of beach sands andridges with shelly horizons. In Barbuda, threemain soil series correspond to the threegeological regions: (i) reddish kaolinitic clayloam in the highland limestone area, (ii)brown clay loam found at lower elevationsover hard limestone and (iii) dark colouredmontmorillonitic clay found on more recentterraces of hard limestone. There are alsoextensive areas of very young soilsdeveloping on stabilized beach sands anddunes where water holding capacity is verylow and drainage is excessive.
Barbuda also has two ponds that are locatedin the southern section of the island along thecoastline. Drainage from all other watersheds
Supporting the Post-2015 Developing Agenda: Priorities onWater Resources and Issues on WRM Monitoring andReporting. Port of Spain, Trinidad and Tobago: Global WaterPartnership Caribbean.68Cooper, B., & V. Bowen, 2001. Integrating Management ofWatersheds and Coastal Areas in Small Island DevelopingStates of the Caribbean: National Report for Antigua andBarbuda. St. John, Antigua and Barbuda: EnvironmentDivision, Ministry of Tourism and Environment, Governmentof Antigua and Barbuda.

VULNERABILITY AND ADAPTATION
93
originates in the highlands69. In Barbuda, thenature of the soil and topography makessurface run off minimal70. Therefore, its mainwater supply is based on ground water,which was increasingly threatened by salineintrusions71. Available data on Barbuda’swater resources identifies 7 wells located inthe lowlands in the western end of the island.It has been suggested that the freshgroundwater reserves are extensive inBarbuda but poorly managed72 Map 9. Thereare no records on the number of privatehousehold wells and pumping is unregulated.
Map 9: Barbuda Water Resources
As stated on numerous occasions previously,the health of the watersheds is directlyrelated to the quality and quantity of thewater being supply. Unfortunately, thewatersheds in Antigua and Barbuda have
69Hodgkinson-Chin, E. 2001. Drought Hazard Assessmentand Mapping for Antigua and Barbuda: Post-GeorgesDisaster Mitigation Project in Antigua & Barbuda and St.Kitts & Nevis. Organization of American States, Unit forSustainable Development and Environment for USAID-Jamaica/Caribbean Regional Program.70Cooper, B., & V. Bowen, 2001. Integrating Management ofWatersheds and Coastal Areas in Small Island DevelopingStates of the Caribbean: National Report for Antigua andBarbuda. St. John, Antigua and Barbuda: EnvironmentDivision, Ministry of Tourism and Environment, Governmentof Antigua and Barbuda.
been subjected to various stresses stemmingprimarily from increased agriculture andsettlements in critical areas. This createsfurther degradation of the watersheds, whichin turn affects the water supply and rechargerates of the aquifers. The indiscriminateactivities that occur within the upperwatershed areas are the primary causes ofthe increased siltation that is seen in thereservoirs today. Furthermore, the effects ofthese stresses on the water sector areexacerbated by other factors to includechallenges faced by the water utility such asinsufficient storage capacity,deterioration/damages to dams and limitednumber and conditions of distribution pipesand treatment plants. Another factor thatneeds to be considered would be theinefficient use of water by consumers.
The changes that have been seen in theclimate during the past few decades alsoimpact the viability of the water sector.Effects include a reduction in wateravailability due to decreased rainfall, salineintrusions in the fresh water aquifers incoastal areas, increased evaporation fromsurface water storage and increasedvulnerability due to increasing droughtconditions.
Providing a safe and adequate supply ofwater for agriculture has increasingly been asignificant challenge for Antigua andBarbuda. With an increase in populationgrowth, consumption patterns and food
71Gomes, J. (2008). Antigua and Barbuda Red CrossBackground Document: Impacts of Climate Change andDisaster Risk Reduction in Antigua and Barbuda. Antiguaand Barbuda: Antigua and Barbuda Red Cross.72Hodgkinson-Chin, E. 2001. Drought Hazard Assessmentand Mapping for Antigua and Barbuda: Post-GeorgesDisaster Mitigation Project in Antigua & Barbuda and St.Kitts & Nevis. Organization of American States, Unit forSustainable Development and Environment for USAID-Jamaica/Caribbean Regional Program.

VULNERABILITY AND ADAPTATION
94
demands, it is clearly predicted that thefuture water demands of the country will alsoincrease. The combined inputs of ground,surface and desalinated water will need tomeet this supply.
In terms of reporting on GDP contributions,the Agriculture sector is divided into two sub-sectors; one for crops, livestock and forestrywhile the other reports on fisheries. From1970 to 2008 there has been a decrease in itsshare of contributions from 14 to 3%73 with afurther decline to 2% being recorded in 2013.Nonetheless, there has been an increaseseen in the agricultural output by an averageof 6.4% per annum over the 5-year period2009 – 2013. Evidently, at one timeagriculture was one of the major contributorsto the GDP and this was primarily due to anactive large-scale sugar production inclusiveof its by-products, molasses and rum.However, more recently the agriculturalproduction has become a small contributorto the country’s GDP in any one year. In 2011,it accounted for approximately 2.8% of theworkforce (Table 23).
The challenges that the agriculture sector isfaced with are considered both institutionaland natural. The main challenges being thedissemination of knowledge and monitoringof sustainable farm practices to avoidindiscriminate land clearing. Additionally,wells become unusable during the dry seasonbecause of saltwater intrusion, an impactwhich will be exacerbated by climate change.It is noteworthy to mention that in the drierseasons fires in watershed areas can be verydevastating. It is not unlikely to see theoccurrence of three per week on average
73Environmental Solutions Antigua Limited (ESAL), 2008.Integrated Watershed Management. St. John’s, Antigua:Environment Division, Government of Antigua and Barbuda.74Cooper, B., & V. Bowen, 2001. Integrating Management ofWatersheds and Coastal Areas in Small Island DevelopingStates of the Caribbean: National Report for Antigua andBarbuda. St. John, Antigua and Barbuda: Environment
during this time. In addition to this, majorwater resources such as Potworks Dam arenot maintained and lose their retentioncapacity. Unfortunately, funding is often notreadily available to execute projects withinthese areas and when they do appear thereis no succession plan to ensure its sustainableinterventions.
Data analysis suggest that the root of thesechallenges lies in the health of thewatersheds. This is seen as critical to thesustainable development of the sectorparticularly as it relates to food security.Overgrazing of pastures and upperwatershed areas by livestock has led to theover-exposure of topsoil, which results inerosion and downstream sedimentation.Such occurrences have caused dams,streams, and ponds to lose effective storagecapacity and therefore increased thelikelihood of downstream flooding andpollution.
Furthermore, the water availability has beena contributing factor. Its limited supply hasbeen the cause of stunted plant growth andfruit sizes. Antigua’s average evaporation hasbeen significantly higher than the annualaverage rainfall and as such, has requiredsupplemental irrigation to sustain yields.Even during the wet season, the frequent dryperiods have been sufficiently serous toimpact crop production. It has beenpredicted that irrigation will become morecritical with the anticipated increase intemperature extremes due to climatechange74. In addition to all this, thebiodiversity has also been impacted whichhas further contributed to a decline inecosystem health75.
Division, Ministry of Tourism and Environment, Governmentof Antigua and Barbuda.75Mitchell, A. H. (2009). Wallings Forest Conservation AreaManagement Plan Volume II Annex. St, John, Antigua andBarbuda: Government of Antigua and Barbuda;Organisation of Eastern Caribbean States (OECS) Secretariat.

VULNERABILITY AND ADAPTATION
95
4.8.3 AGRICULTURE
In terms of reporting on GDP contributions,the Agriculture sector is divided into two sub-sectors; one for crops, livestock and forestrywhile the other reports on fisheries. From1970 to 2008 there has been a decrease in itsshare of contributions from 14 to 3%76 with afurther decline to 2% being recorded in 2013.Nonetheless, there has been an increaseseen in the agricultural output by an averageof 6.4% per annum over the 5-year period2009 – 2013. Evidently, at one-timeagriculture was one of the major contributorsto the GDP and this was primarily due to anactive large-scale sugar production inclusiveof its by-products, molasses and rum.However, more recently the agricultural
production has become a small contributorto the country’s GDP in any one year. In 2011,it accounted for approximately 2.8% of theworkforce (Table 24).
The Fisheries sub-sector makes the greatestcontribution of agriculture in GDP. In 2011 itaccounted for 51.5% or EC$26.3 milliondollars. A release from the Fisheries Divisionindicates that there is 1500 registered fisher-folk. Fishing is undertaken within the 34,000sq.km of the Exclusive Economic Zone, one ofthe largest fisheries within the Organizationof the Eastern Caribbean States (OECS).
This sub-sector is vulnerable to hurricanes,high winds and extreme wave action but also
76Environmental Solutions Antigua Limited (ESAL), 2008.Integrated Watershed Management. St. John’s, Antigua:Environment Division, Government of Antigua and Barbuda.
indiscriminate actions such as pollution,wetland destruction and unplanneddevelopment. Despite the fact that it wasthriving economically, there has been threatsto the biodiversity of the resource and entiremarine environment and ecosystem. Thesetake the form of resource depletion(overfishing, use of destructive fishingmethods and invasive alien species),increased coastal development, pollution(land and marine-based sources), changes tohabitats (modification and destruction) andfinancially motivated (changes to globaleconomy and market conditions).
4.8.4 HEALTH
The health sector in the Caribbean is faced
with challenges that can be accredited to theregion’s geography, culture, size anddevelopment. Specifically, in the LesserAntilles, these challenges include the rapiddevelopment of chronic non-communicablediseases that plague the world but also, thehistorical presence and periodic recurrenceof the communicable diseases such asmalaria. These are made more difficult toavoid because of the increasing movement ofpersons due to tourism-related activities anda legacy of low income and relativelyvulnerable agricultural based economies.
As a result of climate change, changes inprecipitation have affected the availability ofwater for consumption and other domestic
2011 %GDP % of TotalWater
Demand
%of TotalWater
Customers
Growth Rateover 2010
Contributionto total
EmploymentAgriculture &
Fishing2.10% 0.803% 0.656% -12.168% 2.8%
Table 24: Agriculture and Fishing- Relationship to the Water Sector

VULNERABILITY AND ADAPTATION
96
and agricultural uses. This in turn has had animpact on the health and nutrition levels ofthe population. On one hand, droughtconditions have contributed to watershortages, which have resulted in increasedrisk of the transmission of diseases such ascholera, typhoid and bacterial dysentery. Inaddition to intensifying the prevalence ofwind-borne contaminants, droughtconditions can also exacerbate theappearance of communicable diseases. Onthe other hand, increased precipitation thatresult in flooding contributes to increasedpest populations and contamination ofsurface and groundwater. This contributes tobiological contamination of water sourcesand an expansion of the habitat of vectorssuch as the Aedes aegypti mosquito.
The increase in temperature ofapproximately 1.5 – 2.0oC by 2030 and 2050due to climate change could also have animpact on the health sector. Heat stressgenerated by altered average temperaturescould serve as a major source of morbidity ormortality for high-risk groups such as theelderly, persons with cardiac and respiratoryproblems, among others. Highertemperatures create more conduciveenvironment for the growth anddevelopment of various bacteriological andepidemiological agents77. Specific vectorsparticularly rodents and mosquitoes arecapable of adapting and even thriving inwarmer conditions, therefore increasing thepossibility of the spread of variouscommunicable and infectious diseases. Forexample, it is projected that transmission ofdengue fever in the Caribbean will increaseapproximately threefold. Increasedtemperatures reduced the time for theparasite to incubate in mosquitoes, resultingin more rapid transmission of the disease78.
77 Government of Antigua and Barbuda (GoAB), 2009.Antigua and Barbuda Second National Communication onClimate Change. St. John’s, Antigua and Barbuda. GoAB).
In Antigua and Barbuda, the Central Board ofHealth (CBH) has the mandate to regulate allmatters concerning public health. Theconcerns that the CBH have relating to thewater sector can be linked to infrastructureand public health practices. One of the moreprevalent challenges stem from the poorconditions of most drains in the country.They are not paved and are not properly sizedor cleaned regularly. During periods of heavyrains this leads to serious drainage problemsand flooding occasions. There is a notableincrease of diarrhea cases during the rainyseasons. Likewise, during the dry seasonthere is an occasional increase in scabies(‘water rash’ disease). Although thesediseases are not water borne they areconsidered water-related.
Most homes in the flood-prone areas have‘soak-aways’ or septic tanks, which becomeinundated with floodwaters during the rainyseason. It is not infrequent for water cisternsto get contaminated and test extraordinarilyhigh for Escherichia coli during these periods.Overall, the actions taken by the CBH can beconsidered epidemiologically focused inrelation to monitoring and prevention. Thatagency is presently working on drafting astrategic action plan for health and climatechange with the assistance of the Pan-American Health Organization (PAHO).
4.9 SUMMARY OF VULNERABILITYASSESSMENTS
Table 25 summarizes projected impacts andadaptation measures. The importance ofeach impact is also rated and is reported interms of vulnerability. Using the definition of
78ECLAC, 2011. Caribbean Development Report: Theeconomics of Climate Change in the Caribbean. Port ofSpain, Trinidad and Tobago. ECLAC.

VULNERABILITY AND ADAPTATION
97
the IPCC Fifth Assessment Report79,vulnerability is the degree to which a systemis susceptible to or unable to cope with,adverse effects of climate change includingclimate variability and extremes.Vulnerability is a function of climatevariation, the degree to which the systemresponds to this variation, and its adaptivecapacity. This is often relatively difficult toassess as it depends on a range of factors butit is of key importance for policy implicationsand society’s perception of climate change.
It is important to note that three levels ofvulnerability can be defined:– High: means that this impact may havesevere consequences and that it is notcertain whether affordable adaptationmeasures can be found;– Moderate: means that severe impacts areunlikely but significant impacts are likely,even after implementation of simpleadaptation measures;– Limited: means that no severe impact isprojected, the issue will probably beunimportant, at least when simple, low-costadaptation measures are implemented.
When rating vulnerability, we take possibleadaptation measures into account, asexplained below, because the existence (ornot) of such measures is an essential part ofthe problem. According to IPCC (2014)80,adaptation is “the process of adjustment toactual or expected climate and its effects. Inhuman systems, adaptation seeks tomoderate or avoid harm or exploit beneficialopportunities. In some natural systems,human intervention may facilitateadjustment to expected climate and itseffects”.
It involves anticipating the adverse effects ofclimate change and taking appropriate actionto prevent or minimize the damage they can
79 IPCC, 2014. Working Group II Fifth Assessment ReportGlossary. England: Cambridge Univeristy Press.
cause, or taking advantage of opportunitiesthat may arise. Well-planned, earlyadaptation action has been shown to savemoney and lives later. Adaptation measurescould include: using scarce water resourcesmore efficiently; adapting building codes tofuture climate conditions and extremeweather events; building flood defenses andraising the levels of dykes; developingdrought-tolerant crops; choosing treespecies and forestry practices less vulnerableto storms and fires; and setting aside landcorridors to help species migrate.The timelines for implementing theadaptation measures are noted belowaccording to the following scale:
- Immediate: signifies that the actionneeds to be implemented at thepresent moment;
- Short-term: signifies that the actionneeds to be implemented in thenext 1-3 yrs;
- Medium-term: signifies that theaction needs to be implemented inthe next 3-5 yrs;
- Long-term: signifies that the actioncan be implemented in a timeperiod of more than 5 yrs.
80 IPCC, 2014. Working Group II Fifth Assessment ReportGlossary. England: Cambridge Univeristy Press.

VULNERABILITY AND ADAPTATION
98
Table 25: Summary of Climate Change Impacts, Adaptation, and Vulnerability
Sectors Stressors Vulnerability Adaptation1. Water I. Low annual rainfall with high
inter-annual variabilityModerate:Projected Stresses from CC-Increasingly drier conditions.-Heavy rainfall events decrease.-Increase in annual temperaturesProjected impact of changes without action:More frequent drought events; increasedevaporation resulting in greater pathogendensity in water leading to a lack of potablewater
Needs:Immediate- To develop the appropriate regulations andsystems as contained within the EnvironmentalManagement and Protection Act 2015 (EPMA) forenforcement.- To establish the Watershed and WetlandManagement Committee- To develop and implement a water qualitymonitoring system, targeting educationalinstitutions.-To fund community rainwater harvesting projects- To upgrade existing water supply infrastructure tominimize leakages
Short-term-To increase desalination capacity- To develop water-budgets for each majorwatershed- To develop an improved methodology foracquiring meteorological and hydrological data andestablish a knowledge and data sharing platform- To develop and enforce a Meteorological Act toenhance the functions and budgetary allocations ofthe Meteorology Department, particularly inclimate monitoring and forecasting- To prepare and implement Local Area Plansincluding sub-watershed hydrologic modeling, to
II. Annual exposure tohurricanes and tropical storms(which reduces the nationalintake ability of desalinationplants through electricaloutages)
Moderate:Projected Stresses from CC-Hurricane intensity expected to increase(not necessarily frequency)Projected impact of changes without action:Increased flooding in certain areas and highrisk of exposure to debris and sediment;damage to water sector infrastructure
III. Over extraction of wellsresulting in saline intrusion
High:Projected Stresses from CCIncrease in sea levelProjected impact of changes without action:Water quality problems may arise

VULNERABILITY AND ADAPTATION
99
Sectors Stressors Vulnerability AdaptationIV. Balancing increaseddemand for water and reducedrainfall as well as increasedcosts for desalinations
Moderate:Projected Stresses from CCReduction in annual average rainfall- moredroughtsProjected impact of changes without action:Reduction of water supply from rain fedsources (groundwater and surface waterstorage areas)
prevent development in areas that compromisewater resources.
To update the Building Code to enhance climateresilience.
Short-medium term- Additional and upgraded water storagecatchment systems- To develop Watershed Master, and local Plans- To develop and implement a Water Policy thattakes into account climate change considerations- To conduct a feasibility study to create a WaterResource Regulatory Agency-To develop climate change adaptation andmitigation policy-To equip the water sector with renewable energyincluding off-grid back up energy storage.
Long-term- To utilize renewable energy for desalinationplants- To carry out a study to create a centralizedsewage system for St. John’s City-To implement wastewater reuse and recycling
V. Desertification andwatershed deterioration
Moderate:Projected Stresses from CCIncreasing drought conditionsProjected impact of changes without action:Increase in risk of forest fires resulting in areduction of protective tree cover andreduced water infiltration.
VI. Inadequate water captureand storage infrastructure
Moderate:Projected Stresses from CCReduction in annual average rainfall- resultsin reduction in surface flows and reducedground water recharge and ground waterresourcesProjected impact of changes without action:Inadequate capture of rainfall with growingpopulation resulting in reduced supplyand/or heavier dependence on desalination.

VULNERABILITY AND ADAPTATION
100
Sectors Stressors Vulnerability Adaptation2. Agriculture I. The sector relies significantly
on rainwaterModerate:Projected Stresses from CCReduction in annual average rainfall- moredroughtsProjected impact of changes without action:More frequent drought events resultingreduced crop yield.
Needs:Immediate-Pilot climate-smart agriculture technology
Short-term- To continue the development of trainingprograms in improved farming practices to includewater conservation measures, as well as to provideincentives to farmers who incorporate thesepractices on their farms
- To develop expertise in the Ministry of Agriculturein matters related to international and regionaltrading in agricultural commodities, particularlythose that are resilient to climate change
- To continue to encourage the use of drylandfarming techniques around the island, particularlyin the drier sections of Antigua
- To increase technological options and solutionsfor production and post- harvest handling inAgriculture that offer resilience to climate changeand make available the resources necessary forthese options.
Short-medium term- To diversify away from low yield/low returnagricultural production.- To establish a framework and policy for wateraccess and drainage system- Redesigned and improved drainage system
II. Poor dryland farmingtechniques
Moderate:Projected Stresses from CCIncrease in annual temperature and drierconditionsProjected impact of changes without action:Increased evaporation combined with drierconditions and poor farming practicesresulting in reduced yield.
III. Damage from heavyrainfall/storm events
Moderate:Projected Stresses from CCHurricane intensity expected to increase(not necessarily frequency)Projected impact of changes without action:Loss of crops, reduction in crop yield

VULNERABILITY AND ADAPTATION
101
Sectors Stressors Vulnerability Adaptation3. Health I. Increases in pathogens (e.g.,
E. coli) present in cisterns &pollution of groundwater.
II. Increases in vector bornediseases
Moderate:Projected Stresses from CCReduction in annual average rainfall- moredroughtsIncreases in atmospheric temperatureProjected impact of changes without action:Water Quality Issues
Needs:Immediate- To develop plan for water quality monitoringprogram
Short-term- To develop climate change adaptation andmitigation policy- To Revise the Public Health Act-To develop vector control programmes- To build capacity for the National Office ofDisaster Services in several aspects of disastermanagement
Long-term- To carry out a study to create a centralizedsewage system, for St. John’s City
III. Heavy rainfall events resultin flooding and the overflow ofseptic systems
Moderate:Projected Stresses from CCHurricane intensity expected to increase(not necessarily frequency)Projected impact of changes without action:Water quality and health issues
(Source: Adapted from the “National Adaptation Strategy and Action Plan to address Climate Change in the Water Sector in Antigua and Barbuda 81” and the“Vulnerability and Capacity Assessment in the South West Coast and Watershed Area of Antigua82”: Environmental Solutions Ltd., 2014)
81 Environmental Solutions Ltd., 2014. National Adaptation Strategy and Action Plan to address Climate Change in the Water Sector in Antigua and Barbuda. Prepared for the Caribbean Community ClimateChange Centre (CCCCC) and the Government of Antigua and Barbuda under the European Union Global Climate Change Alliance (EU-GCCA) Caribbean Support Project.82 Environmental Solutions Ltd., 2014. Vulnerability and Capacity Assessment in the South West Coast and Watershed Area of Antigua. Prepared for the Caribbean Community Climate Change Centre (CCCCC)and the Government of Antigua and Barbuda under the European Union Global Climate Change Alliance (EU-GCCA) Caribbean Support Project.

VULNERABILITY AND ADAPTATION
102
4.10 COOPERATION ON ADAPTATION
The islands of Antigua and Barbuda areexposed to natural phenomena such asfrequent droughts and occasional tropicalstorms. These have negatively affected thehabitats and populations of a wide range ofspecies. It has already been explained abovehow these events have affected the mainislands and also the near shore marine andcoastal ecosystems. While there is little thatcan be done nationally to reduce theoccurrences of these events, the country hasattempted to address climate changethrough strategic and systematic planning.Although its contribution to greenhouse gasemissions is not large compared to globalemissions, the country is not immune to theconsequences that are caused.
The Government of Antigua and Barbuda hasimplemented a number of environmentalprojects in the past that are some way or theother linked to identifying vulnerabilities andaddressing adaptation to climate change.One of the most recently concluded projectis the Global Environment Facility funded –Sustainable Island Resource ManagementMechanism (GEF-SIRMM) Project. In additionto implementing small-scale adaptationinterventions throughout the country, theSIRMM project also collected baselineinformation required for the accurateassessment and general idea of costs ofelements in the National EnvironmentManagement Strategy (NEMS). That projectrecommended the establishment of the SIRFFund to provide a consistent and dedicatedsource of funds for all areas of MultilateralEnvironmental Agreement (MEA)implementation83.
83 ED, 2008. Project Document: Sustainable Island ResourceManagement Mechanism (SIRMM) Project.84 ED, 2013. Project Identification Form: Building climateresilience through innovative financing mechanisms for
Presently the country has a TechnicalAdvisory Committee (TAC) which is a nationalmulti-stakeholder peer review group madeup of technical officers from 15 governmentagencies, 3 community representatives andnongovernment organizations, and 1 privatesector coalition representative. The TACplays a crucial role in quality control, inter-agency coordination, and ensuring projectinterventions represent multiple interests.Presentations are made to the TAC on allnational and regional projects, and input isintegrated into project design andimplementation.
To facilitate the implementation of MEAs, thecountry is actively pursuing the preparationof several projects that will be submitted tointernational donor agencies. One suchupcoming project is the GEF Special ClimateChange Fund – Building Climate Resiliencethrough Innovative Financing Mechanismsfor Climate Change (SCCF) project. The SCCFproject is aimed at increasing the climateresilience of vulnerable communities andsectors in Antigua and Barbuda by improvingaccess to innovative financing mechanismsfor climate change adaptation, andimplementing cost-effective adaptationinterventions focused on ecosystems84.Another such project is the GEF SustainablePathways, Protected Areas and RenewableEnergy (SPPARE) Project. While the SPPAREhas more a biodiversity and sustainableforestry management focus, it also has arenewable energy component that willaddress the provision of alternative energy inorder to ensure the nation’s energydiversification85.
climate change adaptation (SCCF) Project. Submitted to theGlobal Environment Facility.85 ED, 2014. Project Document – Sustainable Pathways,Protected Areas and Renewable Energy (SPPARE) project.Submitted to the Global Environment Facility.
VULNERABILITY AND ADAPTATION
103
As mentioned earlier in this chapter, anational consultation was held in 2013 wherethe Department of Environment (DoE) incollaboration with APUA brought keystakeholders together to discuss and assessthe actual and projected vulnerabilities ofAntigua and Barbuda as it relates to climatechange86. At that consultation the consensuswas to rank the water sector with the highestpriority with respect to its vulnerability toclimate change and direct impacts.Subsequent to that meeting, the country hasparticipated in regional projects that haveprovided funding to conduct vulnerabilityand adaptation analyses. These areelaborated on in the following section.
4.11 REGIONAL COOPERATION
Antigua and Barbuda is participating in theREGATTA project being implemented by theUNEP-ROLAC. REGATTA supports countries inthis region to address climate changethrough the exchange of knowledge,development of pilot projects and provisionof advisory services in adaptation andmitigation. This project is currently funding aVIA analysis in Antigua and Barbuda, which isbeing conducted by the Caribbean SectoralApproach to Vulnerability and Resilience(CARIBSAVE) Partnership87. Some findings ofthis study have informed this chapter.
Another regional project that the country isparticipating in is the European Union funded– Global Climate Change Alliance (EU-GCCA)Caribbean Support Project implemented by
86 ED, 2013. Report on the Climate Change & Policy andModel Water Act Project Consultation.87 CARIBSAVE Partnership, 2014. First Draft: VulnerabilityImpact And Adaptation Analysis In The Caribbean (VIAAC)National Vulnerability Analysis For Antigua And Barbuda.Prepared with funding from the UNEP-ROLAC.88 CCCCC, 2010. Project Document – European Union funded– Global Climate Change Alliance (EU-GCCA) CaribbeanSupport Project.89 Environmental Solutions Ltd., 2014a. Vulnerability andCapacity Assessment in the South West Coast andWatershed Area of Antigua. Prepared for the Caribbean
the Caribbean Community Climate ChangeCentre (CCCCC). The overall objective of thisproject is to support the sustainabledevelopment of the Caribbean region andpreserve the progress of the countriestowards the Millennium Development Goals(MDGs) 88. Two outputs of this project were,(i) Vulnerability and Capacity Assessment inthe South West Coast and Watershed Area ofAntigua (VCA)89 and a National AdaptationStrategy and Action Plan to address ClimateChange in the Water Sector in Antigua andBarbuda (NASAP)90. Both these documentswere consulted during the preparation of thischapter.
The NASAP identifies several adaptationstrategies for the country based on findingsfrom that study and past studies assessingthe existing water sector of Antigua andBarbuda. It requires that, within the Ministryof Health and Environment, the Departmentof Environment (DoE) be responsible forensuring that the action items set out arecarried out by the respective lead andpartner agencies. A recommendation comingforward is to increase awareness raising andcapacity building programmes at the nationallevel. Furthermore, integration into existingand proposed cooperation programmes ofAntigua and Barbuda’s bi-lateral and multi-lateral partners are encouraged. Onerequirement is that the implementation ofthe NASAP be monitored and evaluated toensure that the activities are successfully ontrack, and to ensure transparency andaccountability. This will entail the monitoring
Community Climate Change Centre (CCCCC) and theGovernment of Antigua and Barbuda under the EuropeanUnion Global Climate Change Alliance (EU-GCCA) CaribbeanSupport Project.90 Environmental Solutions Ltd., 2014b. National AdaptationStrategy and Action Plan to address Climate Change in theWater Sector in Antigua and Barbuda. Prepared for theCaribbean Community Climate Change Centre (CCCCC) andthe Government of Antigua and Barbuda under theEuropean Union Global Climate Change Alliance (EU-GCCA)Caribbean Support Project.

VULNERABILITY AND ADAPTATION
104
of the actual implementation of the NASAP,and also evaluating and assessing the causeof any changes, both external and internal tothe NASAP, to determine what correctiveactions, if any, are needed. More informationon this is readily available in the actualdocument (Environmental Solutions Ltd.,2014a).
More recently, the country has signed on tothe European Union funded - Climate ChangeAdaptation and Sustainable LandManagement Project in the EasternCaribbean under the GCCA launched by theEuropean Commission in 2007. The OECS isimplementing the GCCA project and theprimary purpose is to improve the region’snatural resource base resilience to theimpacts of climate change through policy andcapacity building, as well as demonstration ofphysical adaptation interventions. Thecountry is presently collaborating with theOECS to implement a land managementadaptation activity in the vulnerable CashewHill sub-watershed, in addition to policy andtraining for adaptation.
4.12 BUILDING AWARENESS
Through events and other sensitizationactivities (e.g. national workshops andconsultations), the Antiguan Government willcontribute to the public’s awareness of theproblem of climate change. The DoE hasmade appearances on national media (i.e.radio and television talk shows) andmaintains a website and social mediaaccounts where current information isuploaded to inform the public of initiativesthat are being implemented. Moreover, theDoE continues to work in close collaborationwith NGOs and CBOs to take advantage oftheir existing networks to raise awareness.This is primarily achieved through itsTechnical Advisory Committee (TAC) whichinitiates training workshops, project designand development and subsequent reviews.
The committee is comprised ofrepresentatives across all ministries as well asrepresentatives of NGOs, CBOs and the GEFSGP.
Another goal is to increase the participationof students and/or researchers in the debateon climate change. One possibility that isbeing considered is to support theirparticipation in regional and internationalconferences and events.

OTHER INFORMATION
105
5 OTHER INFORMATION
As a Party to the UNFCCC, Antigua andBarbuda is obligated to cooperate in climatechange and related research, exchange ofinformation, education, training, publicawareness and report such activities to theConvention. In previous Communications tothe UNFCCC, this has generally focused onhighlighting Antigua and Barbuda is involvedin a series of regional projects coordinated bythe Caribbean Community Climate ChangeCentre (CCCCC) and the routine meteorologywork conducted by the Department ofMeteorological Services located at the V.C.Bird International Airport. In the SNC, somepreliminary work on renewable energyresearch was reported.
The ability of Non-Annex I parties to conductregular research and monitoring and buildtheir internal capacity to carry out suchresearch is not only vital to theimplementation of the convention but alsovital to the ability of said countries towardachieving and maintaining sustainabledevelopment goals. Antigua and Barbuda,like many SIDS, is recognized withoutquestion to be in the category of countriesdeemed most vulnerable to the negativeimpacts of climate change; however beinglabeled as ‘most vulnerable’ does not providepolicy makers, international developmentpartners and other stakeholders with theinformation and tools necessary to developeffective programmes and projects toaddress issues of mitigation or adaptation. Itis therefore imperative that Antigua andBarbuda take a more practical approach toresearch, including the development of thecapacity to conduct research. Also, capacityin the ability to measure people’s GHGemissions, and increase public awareness tounderstand the varied manifestations andimpacts of climate change will ensure that
appropriate and significant measures formitigation and adaptation goals are achieved.
5.1 RESEARCH AND SYSTEMATIC OBSERVATION
In recent years, the Department ofMeteorological Services (DMS) has been ableto expand the menu of services offered.Previously, the DMS had been limited toproviding daily meteorological forecasts,archiving of meteorological data andsupporting hydro-meteorological hazardimpacts (droughts, storm surges andhurricanes) predictions. Throughparticipation in projects such as theCaribbean Agro-meteorological Initiative (seebelow); and Enhancing Resilience to ReduceVulnerability in the Caribbean (ERC) Projectthe DMS has been able to further enhance itsabilities to conduct climate research andpredictions and translate it into informationusable by key sectors such as agriculture,water and disaster management, they assistin forecasting for potential flash floodconditions and wildfire risk and issuingwarnings.
5.1.1 EIMAS
The GEF funded Sustainable Island ResourceManagement Mechanism (SIRMM) projectassisted with the creation of a GeographicalInformation Systems (GIS) based platform tomap not only all environmental resources butalso socio-economic amenities. TheEnvironmental Information Managementand Advisory System (EIMAS) was legislatedunder the Environmental Protection andManagement Act of 2015 and is currentlyused by five key government agencies,namely the DoE, Lands Division, SurveysDivision, National Office of Disaster Servicesand the National Parks Authority. Withregard to climate change, the EIMAS is a datamanagement platform and providesinformation related to hydro-meteorological,

OTHER INFORMATION
106
health, disaster and tourism data, which canthen be used for sustainable developmentplanning and land use management. It isenvisioned that the EIMAS will eventuallyinclude energy consumption informationwithin its database.
The EIMAS also ensures that environmentalinformation is regularly uploaded to regionaland international databases ofenvironmental indicators such as thosemanaged by CARICOM, UN-ECLAC, UNSD andUNEP. EIMAS will continue to develop as avital tool by the DoE for planning sustainabledevelopment within Antigua and Barbuda.
5.1.2 RESEARCH IN RENEWABLE ENERGY
Antigua and Barbuda has made thecommitment under the Copenhagen Accordand has accepted the SIDS DOCK Challenge(i.e. to achieve a 25% reduction of 1990emissions by 2020). This target wascomplemented more recently by Antigua andBarbuda’s communication of IntendedNationally Determined Contributions (INDC)to the UNFCCC. This included severalrenewable energy related targets, including:50MW of on-and-off grid renewables, as wellas critical services supported by off-gridrenewable energy with battery storage91.
One of the primary means through whichsuch targets can be achieved is through theadoption of renewable energy, to this end itbecomes essential that Antigua and Barbudaevaluate its potentials to successfully andefficiently adopt and transition into greaterrenewable energy usage. Through thecombined efforts of the Energy Unit in theOffice of the Prime Minister, the AntiguaPublic Utilities Authority and others, directresearch has and is currently being done to
91 Antigua and Barbuda’s INDC:http://www4.unfccc.int/submissions/INDC/Published%20
determine the potentials for solar, wind andbio-digestion as viable sources of alternativeenergy. According to a GIZ report for Antiguaand Barbuda, the country has beenestimated to have potentials equivalent to27MW for solar and 400MW for wind.
The APUA and the Energy Unit, along with thesupport of the Caribbean Renewable EnergyDevelopment Programme (CREDP) and theagency for German Technical Cooperation(GIZ) recently completed a “Pre-FeasibilityStudy for a grid-parallel Wind Park at CrabbsPeninsula, Antigua” The study concludedwith a strong recommendation that an18MW wind park be established at the testsite, which would meet 15-20% of currentelectrical demand at an estimated generationcost of US $75-80 per MWh as compared tothe US$230 per MWh (based on an oil priceof 112 USD/barrel).
Pivotal to the effectiveness of any RE and EEinitiatives is the development of standardizedbaselines to assess and monitor the impactsand benefits of implementing RE and EEinitiatives. The DoE serves as the DesignatedNational Authority of the Clean DevelopmentMechanism (CDM). Through the CDM, effortsare ongoing to gather relevant data that willfacilitate the development of such baselinesmost notably the national grid emissionfactor.
5.1.3 COASTAL MONITORING
The Fisheries Division has expanded theirclimate related research from sea level riseand beach profile analysis to include reef, seagrass and mangrove monitoring andevaluation. Coral reefs around the world arebeing stressed by a number of climatechange-related factors, namely sea level rise,
Documents/Antigua%20and%20Barbuda/1/INDC_Antigua_Barbuda.pdf

OTHER INFORMATION
107
rising sea temperatures, ocean acidification,pollution from land-based sources and otherhabitat-species imbalances. Considering thatAntigua and Barbuda has extensive coral reefhabitats, it needs to develop the capacity todetermine the level of contribution of anyand all causal factors to reef damage andthen develop and apply the appropriatesolutions to allow reefs the best opportunityto withstand and adapt to the stresses ofclimate change.Healthy seagrass and mangrove habitatshave also been recognized as being able toassist in climate resilience both in their rolesas carbon sinks and through their potentialsto support adaptation. The Fisheries Division,and by extension Antigua and Barbuda,recognizes the need for robust research,monitoring and where necessarydevelopment projects addressing reefs,seagrass beds, mangroves and beaches andtheir extensive rolls in ensuring the healthand vibrancy of Antigua and Barbuda’smarine environment inclusive of theirabilities to promote climate changeadaptation, resilience and mitigation.
5.1.4 DATA COLLECTION
Environmental management and decisionmaking has suffered considerably due topoor data collection as evidenced throughoutthis report. Through the EPMA 2015, anEIMAS has been legislated for and will bemaintained by the Department ofEnvironment to address gaps in datacollection and provide for more accurate andup to date information. The EIMAS will alsoprovide for public, private, and NGO access.
Through the Sustainable Financing andmanagement of the Eastern CaribbeanMarine Ecosystem Project, the Departmentwill purchase a small Unmanned Aerial
Vehicle (UAV) or drone. The drone will beprogrammed to a select path in order togather environmental information at afraction of the cost, and requires less labour.It will also enhance data collection on landuse cover and land use change related toGHG emissions in addition to other naturalresources, biodiversity monitoring, andclimate impact assessments.
Further, as a means of efficient management,standardization and verification, theDepartment has taken steps to support thedevelopment and implementation of aNational Spatial Data Infrastructure (NSDI).
5.1.5 MODEL DOWNSCALING
Under the leadership of the CCCCC and incollaboration with partners INSMET and theClimate Studies Group (CSG) of the Universityof the West Indies, advances have been madein the downscaling of global climate modelsto provide outputs that have been utilized inthe conduct of sector-based vulnerability andimpact assessments. The assessments havebeen used to develop sector adaptationstrategies which have since been utilized bynational governments to inform theirdevelopment plans and to mobilize resourcesfor the execution of specificrecommendations. Antigua and Barbuda willbe participating in regional downscalingthrough the Global Climate Change Alliance(GCCA) project. It is hoped that the trainingmade available and the results of thedownscaling will allow each sector and levelto better evaluate and understand howclimate change impacts upon themseparately and collectively.

OTHER INFORMATION
108
5.2 TECHNOLOGY TRANSFER
5.2.1 MET AND CLIMATOLOGY
The DMS has benefitted from the provision ofa number of automatic meteorologicalstations through various projects. Theprovision of these stations have allowed theDMS to significantly enhance and improve itsability to provide quality and trustedmeteorological data regarding the variousmicroclimates around Antigua and Barbuda.These stations have also allowed the DMS tocontribute to agriculture, water sector anddisaster planning. In addition to new weatherstations, the DMS has also begun to utilizethe DEWETRA platform, which is a real-timeintegrated system for hydro-meteorologicaland wildfire risk forecasting, monitoring andprevention. The platform allows the DMS toeffectively combine different types of data soas to develop up-to-date and reliable riskscenarios.
5.2.2 RENEWABLE ENERGY AND ENERGYEFFICIENCY
The Government of Antigua and Barbuda hasagreed to undertake nationally appropriate,measureable and verifiable actions aimed atreducing greenhouse gasemissions by 25% below 1990 levels by 2020.This is further supported by the country’srecently submitted INDCs. To date, there is aNational Energy Desk and a a NationalEnergy Policy and Strategic Action Plan. TheNEP and Strategic Action Plan attempt toreduce energy costs by:
Diversifying and enabling efficientuse of energy sources
Ensure reliable supply of electricity Environmental Protection Stimulate new economic/business
opportunities.
In conjunction there is an APUAInterconnection Policy that allows up to 15%
grid penetration of renewable energysources.
As Antigua and Barbuda moves closer to alow carbon and green economy there isrecognition that key to achieving this goal willbe the adoption of renewable energy (RE)and energy efficient (EE) technologies. Anumber of demonstration projects havealready been initiated to show the ease ofadoption, success and benefits of RE and EEas well as to raise awareness and publicsupport for such a transition.
The National Energy Policy also recognizesthe potential benefits of adopting moreenergy efficient transport technologieshowever to do such would require significantinvestment in national infrastructure so as togive residents the option of accessing suchtechnologies. It should also be noted that afew local businesses have invested in the useof biofuels as alternatives to diesel.However, the capital investments needed tofacilitate the transition to RE and EE is costintensive (or prohibitive) and remains achallenge for national budgetary allocations.This increases the reliance on internationalfunding to mobilize large scale transitions.
To this end, however, national efforts andregional collaboration are underway toenabling are low carbon economy in thecountry. As previously mentioned, throughthe regional CDM body, RCC, a nationalemission factor is being developed and willbe included in future communications. TheOECS/GIZ Eastern Caribbean Energy LabellingProject (ECELP) with co funding from theEuropean Union, has begun implementationof an energy efficient standards and publiceducation programme to reduce energycosts in the region. Through the NationalBureau of Standards, the project identified avariety of household appliances and workedwith retailers and importers to establishenergy efficiency standards and labels. The

OTHER INFORMATION
109
project also deployed a variety of publicawareness paraphernalia in active centres asone of many means to public education.
5.3 EDUCATION, TRAINING AND PUBLICAWARENESS
The Caribbean Institute for Meteorology andHydrology (CIMH) in partnership with theCaribbean Agricultural Research andDevelopment Institute (CARDI) WorldMeteorological Organization (WMO)received a grant from the European Unionthrough the African Caribbean and PacificGroup of States (ACP) Science andTechnology (S&T) Programme for theCaribbean Agrometeorological Initiative(CAMI). This grant allowed the NationalMeteorological and Hydrological Services(NMHSs) of ten Caribbean member States toutilize improved dissemination andapplication of weather and climateinformation to increase and sustainagricultural productivity at the farm level inthe Caribbean region. The CAMI is a three-year project launched in 2010. In Antigua andBarbuda, a notable output of this project hasbeen the production of a MonthlyAgrometeorological Bulletin.The CAMI is described as having the followingoutputs:
Improved ability of policy makers andextension agencies in exploiting therainy season potential fully throughstrategic decisions and betterpreparedness strategies in case of ahigh probability of occurrence ofextreme events.
Better informed farming communityregarding the climate situationbefore and during the crop growingseason More efficient irrigation
scheduling and quantifying,especially for domestic food cropsand important export crops.
Conservation-effective soil and cropmanagement practices to reduceland degradation and improve long-term crop productivity.
Greater farm incomes, improvedcrop quality and enhancedenvironmental benefits for smallfarmers through more effective pestand disease management.
Increased interactions between themeteorological services, agriculturalresearch and extension agencies andthe farming community resulting inthe provision of better services tofarmers.
Availability of regular feedback to themeteorological services on thenature of services and productsneeded by the farmers resulting inthe preparation of user-friendlyproducts from the meteorologicalservices.
Enhanced capacity of Meteorologicaland Agricultural Services, CARDI andCIMH to perform the tasks relevantto the goals of this action.
Information developed through the CAMIand other regular functions of the DMS aremade widely available through the internet,social networking and more conventionalmulti-media formats. Staff at the DMS havealso been afforded various levels of trainingand certification through the support ofvarious projects.
OTHER INFORMATION
110
Under the National Energy Policy theGovernment of Antigua and Barbuda hasdeveloped the following points to beachieved to ensure that renewable energyand energy efficient technologies areadopted:
• Institutionalize educationalprograms to educate students indifferent energy topics, e.g. betterways to manage energy-usage,
• bringing about attitudinal changetowards responsible energy use,energy responsibility, among manyothers.
• Establishing awareness programs onenergy in the school curriculum.
• Promote the use of renewables inschools and universities. This couldbe done by placing solar energygenerating equipment on roofs atschools and universities.
• Establish a National EnergyEducation Program with the aim ofpromoting energy awareness bycreating effective networks amongstudents, educators, business,government and community leadersto design and deliver objective,multi-sided energy educationprogram’s activities.
• Transforming Antigua & Barbuda’senergy systems will require a level ofexpertise, innovation andgenerational effort. Antigua &Barbuda needs major investments incapacity building. To achieve that, aNational Energy Education Act is
needed to provide directinvestments to retool local andregional academic institutions ascenters for research, education andworkforce training in energy-relatedfields, both at professional andtechnical levels.
There are a number of agencies, public andnon-governmental, within Antigua andBarbuda which have developed sophisticatedenvironmental and sustainable developmenteducation and public awarenessprogrammes. These agencies have nationalmandates which far exceed climate changeto address varying facets of sustainabledevelopment and utilize a variety ofmechanisms through which to achieveeducation, awareness and training. Theseare:
▪ The Department of Environment(DoE) – Through a variety of projectsand programmes, the DoE, a focalagency in addressing a number ofenvironment and sustainableconventions and issues hasdeveloped a comprehensive systemof disseminating climate changeinformation, training and awareness.Specific work in schools wasachieved through the EnvironmentalCadet Programme, EcoZone SummerCamp and interschool events. TheDepartment has also participated incurriculum development fromprimary through to tertiary levels. Ithas even provided internships forstudents from around the CaribbeanRegion to conduct research and gainpractical experience in climate

OTHER INFORMATION
111
change and other environmentalissues. The Government of Antiguaand Barbuda has mandated that allthe environment and sustainabledevelopment projects undertakencarry public awareness as anessential component and wherepossible training. A number ofprojects such as the SIRMM andGCCA have facilitated training inGeographical Information Systems,downscaling climate models,developing climate projectionscenarios and climate modeling.
▪ National GEF Small GrantsProgramme (GEF SGP)
Antigua and Barbuda has recentlyestablished its own National SGP tofacilitate the development ofcommunity projects designed toaddress global environmentalchallenges through communitybased actions under the GEF. TheGEF has highlighted key focal areasincluding climate change mitigationand adaptation which not onlyeducates community groups butenables them to explore andimplement of climate mitigation andadaptation strategies. Many civicand community groups haveparticipated in tree planting andbeach cleanup activities. Morerecently community groups as wellas NGOs have taken on a moresubstantive role by becominginvolved in efforts to improvecommunity management of coastal
natural resources, providing trainingto stakeholders in practices thatconserve reefs, off-shore islandecosystems and mangrove wetlandswhich are all essential to climateresiliency. Additionally, somecommunity groups have alsoundertaken sustainable agricultureand organic farming projects to assistin enhancing national food security.
▪ The National Office of DisasterServices -NODS has beenincorporating Climate Change into itsCDM education activities andpresentations in all of the country'sprimary schools, community visitsand presentation with civil, privateand public sectors. Practically allschools have been covered and awide cross section of the privatesector, particularly Hotels/tourismsector. NODS has also beenpartnering with other public sectoragencies (e.g. Government TrainingDivision) and NGOs (such as theAntigua & Barbuda Red Cross) in thedevelopment of CommunityEmergency Response Teams (CERTs)beginning with high priority hazardprofile communities such as Pigotts,Yorks and Bendals. The CERTs havealso been involved in traininginitiatives that focus on many of theissues tackled under Climate ChangeMitigation and Adaptation.
▪ The Environmental AwarenessGroup or EAG is the oldest non-

OTHER INFORMATION
112
profit, non-governmentalenvironmental organisation inAntigua and Barbuda, established in1989. The EAG’s vision is for a worldwhere we are environmentallyconscious, coexisting in harmonywith a healthy natural environment,through respect for our biodiversityand sustainable development. Someof its achievements include:
rescuing the Antiguan Racerfrom the brink of extinction,
ecosystem restoration onoffshore islands (which ledto the establishment of theNorth East MarineManagement Area),
the inclusion ofenvironmental education inthe national schoolcurriculum,
ground breaking work onplant conservation, thepublication of the Red List ofthreatened plant speciesand also the Wild Plants ofAntigua & Barbuda.
Currently, the EAG manages ninemain projects, none of whichspecifically focuses on climatechange. However, realising that thisis an issue that affects every aspectof environmental conservation, eachproject’s educational componentaddresses climate change, and itsnegative impacts on our naturalheritage. Educational campaigns
such as the Endangered SpeciesPresentations and the FloatingClassroom aim to bring residents,especially school students, teachersand parents in direct contact withour local biodiversity and the threatsthat they currently face. In additionto these initiatives, the EAG also runa school reading programme,publishes books, brochures,educational calendars and hostsmonthly environmental fieldtrips.
The monthly field trips oftenemphasize climate changevulnerabilities when visiting sitesaround Antigua and Barbuda,whether terrestrial or marine,highlighting ways of mitigating suchvulnerabilities where possible. TheEAG works with several localpartners including the Ministry ofAgriculture, and the GilbertAgricultural and Rural DevelopmentCenter (GARD). The EAG and GARDhave collaborated to execute asuccessful summer camp, CampGROW, Gaining a Respect for theOutdoors and our World.
▪ The Gilberts Agricultural and RuralDevelopment (GARD) Centre - anon-profit NGO specializing incertified technical, vocational andenterprise development training forvulnerable youth and women. Itsoriginal mandate was to encourageyouth to select agricultural and itsrelated ventures as worthyoccupations and not view it asdrudgery and having a slave image.

OTHER INFORMATION
113
Over the 23 years of existence theGARD Center has beendemonstrating that agriculture is abusiness and must be competitivewith other sectors and meet theglobal challenges and requirementsof safety, sustainability and,traceability through the use of GoodAgricultural Practices (GAP). TheCenter has collaborated with anumber of partners to strengthenthe response to climate issuesaffecting the country. The Centerhas partnered with the Departmentof Environment, Forestry Divisionand Agricultural Extension; and theEnvironmental Awareness Group inprojects to protect the nation'swatersheds and plant biodiversity.
GARD Center's training programs includedintroduction to agro-ecological, agro-forestryand organic farming practices for farmers.The Center has been involved in publicawareness activities with the production ofvideos for public media, brochures and flyersfor distribution, demonstrations for schools,agricultural producers and the general publichighlighting climate change effects onbiodiversity, increased risk of droughts,disasters and the preparation. Camp Growwas introduced in collaboration with theEnvironmental Awareness Group as asummer vacation camp for young childrenbetween the ages of 8 to 11 years to sensitizethe youth of the importance of preservingtheir environment and to create anappreciation of the role of agriculture and itsinterrelationship with the environment.
5.4 SUMMARY
Over the years, Antigua and Barbuda hascontinued and in some cases improved thequality and variety of research andinformation aimed at understanding thedrivers, vulnerability and exposure to theimpacts of climate change. However, withsmall scalability and limited human, technicaland financial resources, there is a wide andincreasingly complex range of climateresearch to which Antigua and Barbuda haslimited capacity to access and engage. Keyamong the areas which still requiredevelopment if Antigua and Barbuda is to beable to fully assess and address the impactsof climate change are:
A comprehensive State of theEnvironment Report, which detailsall habitats and ecosystems theirhealth and status and opportunitiesfor resilience;
Ocean acidification; Sea level rise monitoring; Rates of coastal erosion and
accretion; In depth assessment of the impacts
of climate change on environmental,cultural, social and economicactivity;
Comparative assessment on thecosts of climate change adaptationand mitigation actions and targets;
Regional specific default values forsome monitoring and assessmenttools such as GHG emissioncalculations and methodologies forrecognizing sea grass beds as carbonsinks should also be included
A National Climate Change Policy; Operationalize the SIRF Fund;

OTHER INFORMATION
114
Technology Road Map for achievingclimate adaptation and mitigationtargets; and
Workforce Training for Adaptationand Mitigation.
Additionally, both a comprehensive and acoordinated national climate changeresearch and observation are key. A numberof agencies are interested or activelyinvolved in actions to address climatechange, however the level of cooperationamong agencies could be enhanced andtechnical expertise on the most cost-effective climate monitoring and datacollection methods are needed.
Areas for improving public awareness andgeneral information sharing include:
the integration of climate changeinto formal education syllabi.Considering that Antigua andBarbuda participates in a regionaleducation system, CaribbeanExamination Council (CXC),integration may be more readilyachieved through a regional or sub-regional (OECS) project to betterintegrate and advanceenvironmental issues, includingclimate change. Such an exercise canensure that information is providedat levels appropriate to subject andgrade. Additionally, it will allowstudents to more readily appreciatethe different facets of climatechange; especially as such aprogramme would expectantlycontain regional examples of climatechange impacts, adaptation andmitigation. Additionally, as CXC is
beginning to incorporate tablets andmobile applications into the syllabi aregional project such as this coulddevelop multimedia andmultiplatform content andapplications which can used beyondthe classroom.
Alignment of financial incentives forconsumers purchasing energyefficient appliances and renewableenergy, and a Public AwarenessProgramme on energy efficiency andrenewable energy, specificallyappropriate energy saving practicesand technologies and possibly thedevelopment of EE testing facilities.Such an action will assist the generalpublic to see the real benefits ofenergy efficient practices andtechnologies and as consumers makethe necessary behavioural changeswhich could translate intomeasurable mitigation.
Establishing a Farmer’s ComputerAccess Centre at the ExtensionDivision. This would allow farmerswho may not have access tocomputers or may be computerilliterate, to go over the MonthlyAgrometeorological Bulletins andother forecasting data produced bythe DMS with the support ofExtension Division staff. Such afacility can also be supportive ofschools agricultural courses.

GAPS & CONSTRAINTS
115
6 GAPS AND CONSTRAINTS
Throughout this report a number of areashave been highlighted as limitations in theeffective reporting, and exercising ofsufficient measures to mitigate as well asadapt to climate change. This concludingchapter provides a summary of the gaps andconstraints needed to nationally addressclimate change.
6.1 DATA COLLECTION
As highlighted throughout the variouschapters, data availability continues to be amajor constraint. This is evidenced not onlyin the GHG Inventory but also in reference todata collection in Barbuda which is still verynegligible. This limitation of data availabilityimpacts environmental monitoring, anddecision making needed to effectively steerthe country towards sustainability.
6.2 INADEQUATE INFRASTRUCTURE
Like many SIDS, the Government of Antiguaand Barbuda is unable to provide adequateinfrastructure and institutional support inaddition to generating the revenues to fundthese needs. Chief among these are thenecessary tools and capacity for research,data collection, analysis, and management ashighlighted in the chapters on GHGInventory, and Policy and Measures,
Additionally, although there is an enablingenvironment for renewable energy (RE),economic and financial barriers limit thedistribution of RE. As previously captured, itis mainly the more affluent populations andcorporate sector that are able to install REtechnology. To gain a larger penetration ofRE, particularly in rural and impoverishedcommunities, the Government must securecapital investments, if national emissions areto be reduced.
While the willingness of the country existsthrough policy development,implementation is slow due to the limitedavailability of finance. Although there havebeen many international support initiativesand programmes, many of these are gearedtowards regional bodies and multiplecountries. This minimizes national impact asnational projects must conform to stringentmethodologies and approaches that may notbe applicable based on cultural norms, andother variables.
6.3 FINANCIAL SERVICES SECTOR
While Antigua and Barbuda has a relativelyhigh financial sector ratio to its size (10 to100,000 inhabitants), the premiumgenerated for reinsurance when comparedto disaster claims is relatively negligible. Thisis also unattractive for the reinsurancemarket as Antigua and Barbuda falls withinone of the most disaster prone regions. Theperformance and rates of reinsurersthroughout the region will undoubtedlyincrease, threatening the financial viabilityand availability of local insurances. Thisincreases the risk burden borne by vulnerablepopulations through higher deductibles andpremiums, and in some instances theunavailability of insurance coverage based oncoastal locations. This also has implicationsfor banking institutions as studies haveshown that extreme weather events affectclient behavior namely, default onmortgages. This increase the portfolio of nonperforming loans
6.4 PRIVATE AND PUBLIC SECTORENGAGEMENT
As highlighted previously, there is no nationalclimate change strategy or nationaladaptation plan. Consequently, climate

GAPS & CONSTRAINTS
116
change has not been effectivelymainstreamed across all sectors, particularlythe private sector, which includes thefinancial services sector. As such, approachesto climate change adaptation and mitigationwithin the private sector have been sporadicand uncoordinated. Further, while the DoEinformally established a Technical AdvisoryCommittee for the supervision of projectsand implementation of MEAs, there stillexists inadequate cross sectoralcollaboration to ensure that climate changerelated issues are mainstreamed into workprograms and budgets.
6.5 TRANSPORTATION SECTOR
Data on the local transportation sector isnegligible owing to improper data collectionand management protocols. However, theTransport Board Authority has recentlyembarked on a database management of allmotorized vehicles on the island. Oncecompleted, this data will be a primary featurein subsequent communications.
Given the lack of data on motorized vehiclestype, and fuel, efficient fuel within thetransport sector has not yet been pursued.Additionally, transitioning to more fuelefficiency is currently not financially feasibleor practical given the exorbitant costs andskills requirements. This stems from the factthat the Sea island jetty, the sole importationsource of fuel, possesses only two offshorepipes that brings fuel to the island.Transitioning to more efficient fuel wouldrequire construction and installation ofadditional submerged pipes, vehicle andservice station retrofitting island wide. Thiswould also require enhancing national skillscapacity to undertake the retrofitting of allvehicles. However, it must be noted thatwhile the international communityimplements measures to ensure the use ofefficient fuels in motorized vehicles (land orsea), developing states, like Antigua and
Barbuda, are marginalized from advances inthis sector. For instance, for many years,Antigua has been a docking and fuel stationfor many international yachts. However,given the unavailability of efficient fuel, therehas been a decline in the yachting sector asyachts make their way to other islands,notably St. Maarten, for fuelling.

ANNEX: UNCERTAINTY CALCULATIONS
117
7 ANNEX: UNCERTAINTY CALCULATIONS
Uncertainty Calculations
Uncertainty: Lack of knowledge of the true value of a variable that can be described as a probabilitydensity function (PDF) characterising the range and likelihood of possible values. Uncertaintydepends on the analyst’s state of knowledge, which in turn depends on the quality and quantity ofapplicable data as well as knowledge of underlying processes and inference methods.
(pg 3.8, Section 3.1.3, Vol 1, 2006 IPCC Guidelines)
ENERGY SECTORWorksheet 1A Reference Approach
Activity Data Uncertainty: Experts believe that uncertainty resulting from errors in the activity dataof countries with well-developed statistical systems is probably in the range of ±5% for a given fuel.For countries with less well-developed energy data systems, this could be considerably larger,probably about ±10% for a given fuel (pg. 6.13, Section 6.10.1 Vol 2 Chap 6). It was decided thatthe uncertainty used in this case would be the higher value of ±10%.
Emission Factor Uncertainty:
The Tables UC-1 and UC-2 show how uncertainty was calculated.
Table UC-1 showing calculations of uncertainty for the Net calorific value needed to determine CO2 emissions
A B C D E F G
Fuel Type
Net calorificvalue (TJ/Gg)[Table 1.2,Vol2 Chap1]
Lower limitof 95%ConfidenceInterval
Upperlimit of95%Confidence Interval
Calculation ofUncertainty oflower limit[((C-D)/C)*100]
Calculation ofUncertainty ofupper limit[((C-E)/C)*100]
Motor gasoline 44.3 42.5 44.8 4 1Jet Gasoline 44.3 42.5 44.8 4 1Other Kerosene 43.8 42.4 45.2 3 3Gas / Diesel Oil 43 41.4 43.3 4 1LPG 47.3 44.8 52.2 5 10Lubricants 40.2 33.5 42.3 17* 5
*Highest Uncertainty is taken as the uncertainty for the Net Calorific Value ±17%
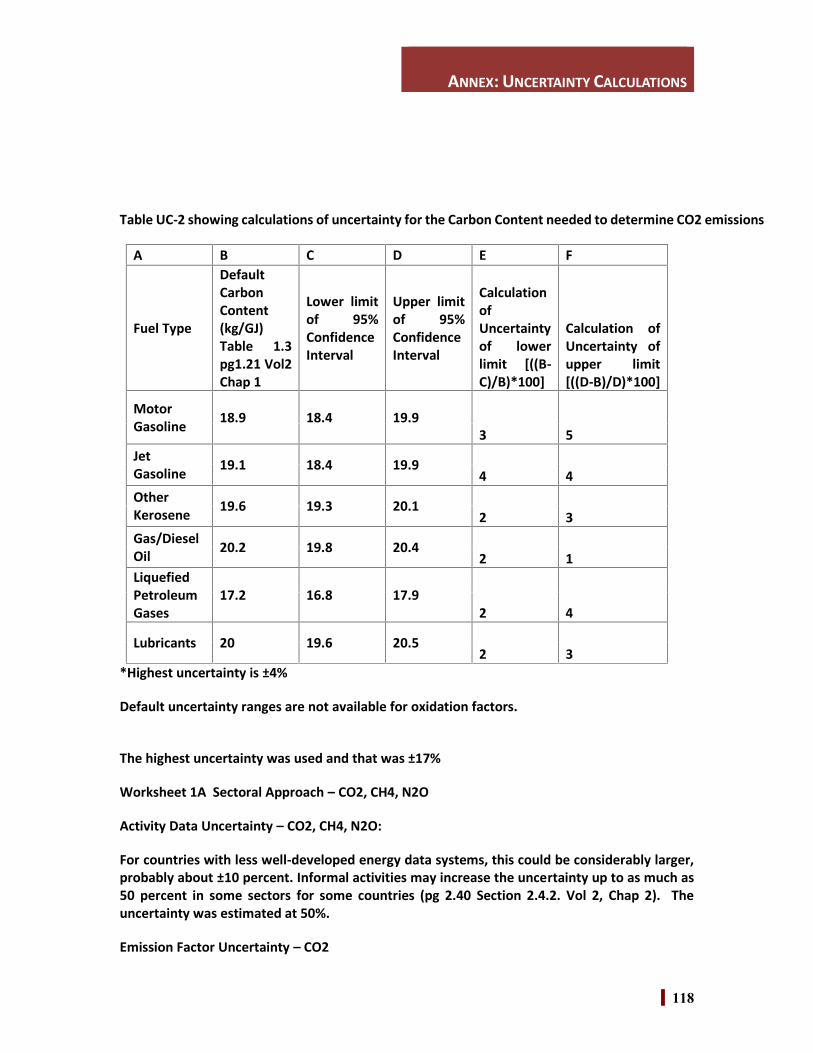
ANNEX: UNCERTAINTY CALCULATIONS
118
Table UC-2 showing calculations of uncertainty for the Carbon Content needed to determine CO2 emissions
A B C D E F
Fuel Type
DefaultCarbonContent(kg/GJ)Table 1.3pg1.21 Vol2Chap 1
Lower limitof 95%ConfidenceInterval
Upper limitof 95%ConfidenceInterval
CalculationofUncertaintyof lowerlimit [((B-C)/B)*100]
Calculation ofUncertainty ofupper limit[((D-B)/D)*100]
MotorGasoline 18.9 18.4 19.9
3 5JetGasoline 19.1 18.4 19.9
4 4OtherKerosene 19.6 19.3 20.1
2 3Gas/DieselOil 20.2 19.8 20.4
2 1LiquefiedPetroleumGases
17.2 16.8 17.92 4
Lubricants 20 19.6 20.52 3
*Highest uncertainty is ±4%
Default uncertainty ranges are not available for oxidation factors.
The highest uncertainty was used and that was ±17%
Worksheet 1A Sectoral Approach – CO2, CH4, N2O
Activity Data Uncertainty – CO2, CH4, N2O:
For countries with less well-developed energy data systems, this could be considerably larger,probably about ±10 percent. Informal activities may increase the uncertainty up to as much as50 percent in some sectors for some countries (pg 2.40 Section 2.4.2. Vol 2, Chap 2). Theuncertainty was estimated at 50%.
Emission Factor Uncertainty – CO2

ANNEX: UNCERTAINTY CALCULATIONS
119
For fossil fuel combustion, uncertainties in CO2 emission factors are relatively low. Theseemission factors are determined by the carbon content of the fuel and thus there are physicalconstraints on the magnitude of their uncertainty (pg 2.8, Section 2.4.1, Vol 2, Chap 2).Therefore the uncertainty is taken from Table UC-2 which would be ±4%
Emission Factor Uncertainty – CH4 & N2O
Emission factors for CH4 and especially N2O are highly uncertain (pg 2.8, Section 2.4.1, Vol 2,Chap 2). According to Table 2.12 (pg 2.8, Section 2.4.1, Vol 2, Chap 2, 2006 IPCC Guidelines),CH4 uncertainties may be estimated as between 50 – 150%. In the case of Antigua and Barbudaan average was used which was 100%.
Table UC-3 Calculations of Uncertainty for the N2O Emission Factor
A B C D E F
Fuel Type
N2OEmissionFactor(kg/TJ)Table 2.2pg2.16 Vol2Chap 2
Lower limitof 95%ConfidenceInterval
Upper limitof 95%ConfidenceInterval
CalculationofUncertaintyof lowerlimit [((B-C)/B)*100]
Calculation ofUncertainty ofupper limit[((D-B)/D)*100]
MotorGasoline 0.6 0.2 2 67 233JetGasoline 0.6 0.2 2 67 233OtherKerosene 0.6 0.2 2 67 233Gas/DieselOil 0.6 0.2 2 67 233LPG 0.1 0.03 0.3 70 200Lubricants 0.6 0.2 2 67 233ParaffinWaxes 0.6 0.2 2 67 233Charcoal 4 1.5 15 63 275*
*The highest Uncertainty was ±275%
The uncertainty for N2O emission factor was taken as 275% (Table UC-3).
INDUSTRIAL SECTOR
Worksheet 2A2
The uncertainty in Activity data could not be scientifically determined.

ANNEX: UNCERTAINTY CALCULATIONS
120
The Uncertainty for the emission factor of lime was found in Table 2.5, pg. 2.25, Section 2.3.2,Vol 3, Chap 2, 2006 IPCC Guidelines and it is 15%.
Worksheet 2A4
Activity Data Uncertainty:
Activity data uncertainties are greater than the uncertainties associated with emission factors.Assuming that carbonate consumption is allocated to the appropriate consumingsectors/industries, the uncertainty associated with weighing or proportioning the carbonates forany given industry is 1-3 percent. The uncertainty of the overall chemical analysis pertaining tocarbonate content and identity also is 1-3 percent (pg. 2.39, Section 2.5.2.2, Vol.3, Chap 2, 2006IPCC Guidelines). It can be assumed then that the uncertainty is 3% but it is most likely to be higher.
Emission Factor Uncertainty:
The Emission factor for carbonates is low and is assumed to be 1 – 5% according to 2006 IPCCGuidelines (pg 2.39, Section 2.5.2.1, Vol 3 Chap 2). An average will be used in this case of 3%.
Worksheet 2D1
Activity Data Uncertainties:
Much of the uncertainty in emission estimates is related to the difficulty in determining thequantity of non- energy products used in individual countries, for which a default of 5 percent maybe used in countries with well developed energy statistics and 10-20 percent in other countries,based on expert judgement of the accuracy of energy statistics (pg. 5.10, Section 5.2.3.2, Vol 3,Chap 5).
The highest uncertainty of 20% was used as it is believed that there is much uncertainty in thisdata.
Emission Factor Uncertainties:
The default ODU factors developed are very uncertain, as they are based on limited knowledge oftypical lubricant oxidation rates. Expert judgment suggests using a default uncertainty of 50percent (pg. 5.10, Section 5.2.3.1, Vol 3, Chap 5).
The carbon content coefficients are based on two studies of the carbon content and heating valueof lubricants, from which an uncertainty range of about ±3 percent is estimated (U.S.EPA, 2004)(pg. 5.10, Section 5.2.3.1, Vol 3, Chap 5).
The highest uncertainty of 50% was used.
Worksheet 2D2
Activity Data Uncertainties:
According to 2006 IPCC Guidelines, an uncertainty of 10 – 20 % should be used in countries

ANNEX: UNCERTAINTY CALCULATIONS
121
without well developed energy statistics (pg 5.13, Section 5.3.3.2, Vol 3. Chap 5). The upperlimit of 20% uncertainty is used because of local conditions.
Emission Factor Uncertainties:
According to 2006 IPCC Guidelines if an Oxidized During Use (ODU) Factor, if a value of 0.2 is usedit should exhibit an uncertainty of about 100% (pg 5.13, Section 5.3.3.1, Vol 3. Chap 5). Therefore,an uncertainty of 100% was used.
Worksheet 2F4 - Aerosols
According to 2006 IPCC Guidelines, Inventory compilers should seek industrial advice onuncertainties, using the approaches to obtaining expert judgments. Because the industrial sectoris so small in this country, experts could not be found to assist with this (pg 7.58, 7.5.3, Vol 3, Chap7). Therefore the uncertainty was not calculated for this emission.
Worksheet 2G3 N2O Use
Activity Data Uncertainties: According to 2006 IPCC Guidelines uncertainty estimates should beobtained from manufacturers and distributors (pg.5.38, Section 8.4.3.2, Vol 3, Chap 8). This datawas not readily available, therefore no uncertainty determination was made for this emission.
Emission Factor Uncertainties: According to 2006 IPCC Guidelines, the uncertainty should be verysmall (pg.5.37, Section 8.4.3.1, Vol 3, Chap 8).
Worksheet 2-13
No data was available to determine the uncertainties for both alcoholic beverage production andBread production. Therefore, no uncertainties were determined for this emission.
AGRICULTURAL SECTOR
Worksheet 3A1 – Enteric fermentation
Activity Data Uncertainties: The uncertainty associated with populations will vary widely dependingon source, but should be known within +20% (pg. 10.23, Section 10.2.3, Vol 4, Chap 10). Thereforean uncertainty of 20% was used.
Emission Factor Uncertainties: The emission factors have an uncertainty of 30 – 50% according tothe 2006 IPCC Guidelines ( pg 10.28, Vol 4, Chap 10). An average uncertainty was used in this caseof 40%.
Worksheet 3A2 – Manure Management CH4
Activity Data Uncertainties: The uncertainty associated with populations will vary widely dependingon source, but should be known within +20% (pg. 10.23, Section 10.2.3, Vol 4, Chap 10). Thereforean uncertainty of 20% was used.

ANNEX: UNCERTAINTY CALCULATIONS
122
Emission Factor Uncertainties: Default Emission factors are estimated to have an uncertainty of30% (pg. 10.48, Section 10.4.4, Vol 4, Chap 10).
Worksheet 3A2 – Manure Management N2O
Activity Data Uncertainties:
The uncertainty associated with populations will vary widely depending on source, but should beknown within 20% (pg. 10.23, Section 10.2.3, Vol 4, Chap 10).
The uncertainty for countries where there is a wide variety of management systems used withlocally different operating practices, the uncertainty in management system usage data can bemuch higher, in the range of 25% to 50%, depending on the availability of reliable andrepresentative survey data that differentiates animal populations by system usage (pg 10.67, Vol4, Chap 10). The average uncertainty will be used, which is 38%.
The highest of both uncertainties (20% and 38%) was chosen which was 38%.
Emission Factor Uncertainties:
Uncertainty ranges for the default N excretion rates are estimated at about +50% (Source:Judgement by IPCC Expert Group). There are large uncertainties associated with the defaultemission factors for direct N2O emissions (–50% to +100%).
The highest of the uncertainties was chosen which was 100%.
Worksheet – Urea Fertilization
Insufficient information available to calculate uncertainties.
FORESTRY AND OTHER LAND USE SECTOR
Worksheet 3B1a - Biomass
Activity Data Uncertainties:All the activity data should have the same uncertainty as it was allderived in the same manner (aerial photos and some ground truthing – Approach 3 – Table 3.7, pg3.20, Vol 4, Chap 3). This uncertainty is estimated to be 10%.
Emission Factor Uncertainties: FAO (2006) provides uncertainty estimates for forest carbon factors;basic wood density (10 to 40%); annual increment in managed forests of industrialized countries(6 %); growing stock (industrialized countries 8%, non- industrialized countries 30%); combined

ANNEX: UNCERTAINTY CALCULATIONS
123
natural losses for industrialized countries (15%); wood and fuelwood removals (industrializedcountries 20%) (pg 4.19, Section 4.2.1.5, VOl 4 Chap 4).
The highest uncertainty will be used, which would be 40%.
Worksheet 3B1b – Dead Organic Matter (Forest Land)
Activity Data Uncertainties: All the activity data should have the same uncertainty as it was allderived in the same manner (aerial photos and some ground truthing – Approach 3 – Table 3.7, pg3.20, Vol 4, Chap 3). This uncertainty is estimated to be 10%.Emission Factor Uncertainties: This should be similar as in the worksheet previously. Therefore, theuncertainty used will be 40%.
Worksheet 3B1b – Soil (Forest Land)
Activity Data Uncertainties: All the activity data should have the same uncertainty as it was allderived in the same manner (aerial photos and some ground truthing – Approach 3 – Table 3.7, pg3.20, Vol 4, Chap 3). This uncertainty is estimated to be 10%.Emission Factor Uncertainties: This should be similar as in the worksheet previously. Therefore, theuncertainty used will be 40%.
Worksheet 3B2a – Biomass (Crop Land)
Activity Data Uncertainties: All the activity data should have the same uncertainty as it was allderived in the same manner (aerial photos and some ground truthing – Approach 3 – Table 3.7, pg3.20, Vol 4, Chap 3). This uncertainty is estimated to be 10%.
Emission Factor Uncertainties: According to IPCC Guidelines (pg 5.12, Section 5.2.1.5., Vol 4, Chap5), default uncertainty level of +75% of the parameter value has been assigned based on expertjudgment. Therefore, 75% will be used as the uncertainty.
Worksheet 3B2a – Soils (Crop Land)
Activity Data Uncertainties: All the activity data should have the same uncertainty as it was allderived in the same manner (aerial photos and some ground truthing – Approach 3 – Table 3.7, pg3.20, Vol 4, Chap 3). This uncertainty is estimated to be 10%.
Emission Factor Uncertainties: According to 2006 IPCC Guidelines (Table 5.6, pg 5.19, Vol 4, Chap5), the uncertainty for the emission factor for cultivated organic soils is 90%. Therefore, anuncertainty of 90% is used.
Worksheet 3B3a – Soils (Grass land)
Activity Data Uncertainties: All the activity data should have the same uncertainty as it was all

ANNEX: UNCERTAINTY CALCULATIONS
124
derived in the same manner (aerial photos and some ground truthing – Approach 3 – Table 3.7, pg3.20, Vol 4, Chap 3). This uncertainty is estimated to be 10%.
Emission Factor Uncertainties: According to 2006 IPCC Guidelines (Table 6.3, pg 6.17, Vol 4, Chap6), the uncertainty for the emission factor for cultivated organic soils is 90%. Therefore, anuncertainty of 90% is used.
Worksheet 3B3b – Soils (Land converted to Grassland)
Activity Data Uncertainties: All the activity data should have the same uncertainty as it was allderived in the same manner (aerial photos and some ground truthing – Approach 3 – Table 3.7, pg3.20, Vol 4, Chap 3). This uncertainty is estimated to be 10%.
Emission Factor Uncertainties: According to 2006 IPCC Guidelines (Table 6.3, pg 6.17, Vol 4, Chap6), the uncertainty for the emission factor for cultivated organic soils is 90%. Therefore, anuncertainty of 90% is used.
Worksheet 3B5a – Soils (Settlements)
Activity Data Uncertainties: All the activity data should have the same uncertainty as it was allderived in the same manner (aerial photos and some ground truthing – Approach 3 – Table 3.7, pg3.20, Vol 4, Chap 3). This uncertainty is estimated to be 10%.
Emission Factor Uncertainties: According to 2006 IPCC Guidelines (Table 5.6, pg 5.19, Vol 4, Chap5), the uncertainty for the emission factor for cultivated organic soils is 90%. Therefore, anuncertainty of 90% is used.
Worksheet 3B5b – Biomass (Land converted to Settlements)
According to 2006 IPCC Guidelines, assessment of uncertainty is not required, because the changein living biomass is set to zero (pg 8.12, Vol 4 Chap 8).
Worksheet 3B5b – DOM (Land converted to Settlements)
According to 2006 IPCC Guidelines (pg 8.23, Section 8.3.2.4, Vol 4, Chap 8), Dead Organic Matter(DOM) changes are subsequently assumed to be zero, and no associated uncertainty is needed atTier 1 after the initial transition.

ANNEX: UNCERTAINTY CALCULATIONS
125
Worksheet 3B5b – Soils (Land converted to Settlements)
Activity Data Uncertainties: All the activity data should have the same uncertainty as it was allderived in the same manner (aerial photos and some ground truthing – Approach 3 – Table 3.7, pg3.20, Vol 4, Chap 3). This uncertainty is estimated to be 10%.
Emission Factor Uncertainties: According to 2006 IPCC Guidelines (Table 5.6, pg 5.19, Vol 4, Chap5), the uncertainty for the emission factor for cultivated organic soils is 90%. Therefore, anuncertainty of 90% is used.
Worksheet 3B6b – Biomass (Land converted to Other Lands)
Activity Data Uncertainties: All the activity data should have the same uncertainty as it was allderived in the same manner (aerial photos and some ground truthing – Approach 3 – Table 3.7, pg3.20, Vol 4, Chap 3). This uncertainty is estimated to be 10%.
Emission Factor Uncertainties: Using Tier 1, a default uncertainty level of +75% of the estimatedmean CO2 emission may be assumed (pg 9.6, Section 9.3.1.4, Vol 4, Chap 9). Therefore theuncertainty used is 75%.
Worksheet 3B6b – Soils (Land converted to Other Lands)
Activity Data Uncertainties: All the activity data should have the same uncertainty as it was allderived in the same manner (aerial photos and some ground truthing – Approach 3 – Table 3.7, pg3.20, Vol 4, Chap 3). This uncertainty is estimated to be 10%.
Emission Factor Uncertainties: According to 2006 IPCC Guidelines (Table 5.6, pg 5.19, Vol 4, Chap5), the uncertainty for the emission factor for cultivated organic soils is 90%. Therefore, anuncertainty of 90% is used.
WASTE SECTORWorksheet 4B CH4
Determination of Activity Data Uncertainty : According to Table 3.5 pg 3.27 Vol 3 Chap 3 WasteIPCC Guidelines, in cases where wastes are weighed every time the uncertainty may be estimatedas 10%.
Determination of Emission Factor Uncertainty according to 2006 IPCC Guideline rules from Vol1Chap 3
CH4 Emission Factor Range (0.03 – 8) Table 4.1 Pg 4.6 Vol 4 Chap 4

ANNEX: UNCERTAINTY CALCULATIONS
126
Using Emission Factors chosen by field expert the following calculations were carried out and thehighest Uncertainty chosen:
(4-0.03/4 *100), (4-8/4 *100) = 99%, 100%(6-0.03/6*100), (6-8/6*100) = 99.5%, 25%(1-0.03/1*100), (1-8/1*100) = 97%, 700%(5-0.03/5*100), (5-8/5*100) = 99%, 60%(2-0.03/2*100), (2-8/2*100) = 98.5%, 300%
The Highest Uncertainty is 700% for the Emission factor for CH4
Worksheet 4b N2O
Determination of Activity Data Uncertainty : According to Table 3.5 pg 3.27 Vol 3 Chap 3 WasteIPCC Guidelines, in cases where wastes are weighed every time the uncertainty may beestimated as 10%.
Determination of Emission Factor Uncertainty according to 2006 IPCC Guideline rules from Vol1Chap 3
N2O Emission Factor Range (0.03 – 8) Table 4.1 Pg 4.6 Vol 4 Chap 4
Using Emission Factors chosen by field expert the following calculations were carried out andthe highest Uncertainty chosen:
(0.3-0.06/0.3 *100), (0.3-0.6/0.3*100) = 6%, 100%(0.6-0.06/0.6*100), (0.6-0.6/0.6*100) = 90%, 0%
The highest Uncertainty factor for N2O is 100%
Worksheet 4C2– CO2
Activity Data Uncertainties: The conversion of waste amounts from wet weight to dry weightadds additional uncertainty. Depending on the frequency and the accuracy of the dry weightdetermination, this uncertainty varies substantially. The uncertainty of the dry matter contentmay therefore range between ± 10 percent up to ± 50 percent and even more (pg 5.24, Section5.7.1. Chap 5). The higher range of 50% was chosen for activity data uncertainty.
Emission Factor Uncertainties: A default value of ± 40 percent is proposed for countries relyingon default data on the composition in their calculations (pg 5.23, Section 5.7.1. Chap 5).
Worksheet 4C2 – CH4Activity Data Uncertainties: The conversion of waste amounts from wet weight to dry weightadds additional uncertainty. Depending on the frequency and the accuracy of the dry weight

ANNEX: UNCERTAINTY CALCULATIONS
127
determination, this uncertainty varies substantially. The uncertainty of the dry matter contentmay therefore range between ± 10 percent up to ± 50 percent and even more (pg 5.24, Section5.7.1. Chap 5). The higher range of 50% was chosen for activity data uncertainty.
Emission Factor Uncertainties: Since default values for N2O and CH4 emission factors are used,uncertainty ranges have been estimated to be ± 100 percent or more (pg 5.23, Section 5.7.1.Chap 5).
Worksheet 4C2 – N2OActivity Data Uncertainties: The conversion of waste amounts from wet weight to dry weightadds additional uncertainty. Depending on the frequency and the accuracy of the dry weightdetermination, this uncertainty varies substantially. The uncertainty of the dry matter contentmay therefore range between ± 10 percent up to ± 50 percent and even more (pg 5.24, Section5.7.1. Chap 5). The higher range of 50% was chosen for activity data uncertainty.
Emission Factor Uncertainties: Since default values for N2O and CH4 emission factors are used,uncertainty ranges have been estimated to be ± 100 percent or more (pg 5.23, Section 5.7.1.Chap 5).
ANNEX: STATEMENT OF INDC
128
8 STATEMENT OF INDC
ANTIGUA AND BARBUDAINTENDED NATIONALLY DETERMINED CONTRIBUTION (INDC)
Communicated to the UNFCCC on 7 October, 2015
Introduction
The Government of Antigua and Barbuda is committed to the successful conclusion ofnegotiations under the Ad-Hoc Working Group on the Durban Platform for Enhanced Action (ADP)in order to adopt, at COP21 in Paris, a new legally-binding agreement under the United NationsFramework Convention on Climate Change (UNFCCC) appropriate to all Parties, which will comeinto effect and be implemented from 2020 onwards.
Antigua and Barbuda hereby communicates its Intended Nationally Determined Contribution(INDC), in accordance with the relevant paragraphs of Decisions 1/CP.19 and 1/CP.20, towardsachieving the objective of the Convention to stabilize greenhouse gas (GHG) concentrations to“prevent dangerous anthropogenic interference with the climate system” (Article 2), and towardsthe Convention’s commitment for all Parties to take “measures to facilitate adequate adaptationto climate change” (Article 4).
As agreed in Decision 1 CP/20 para 11, “Small island developing states may communicateinformation on strategies, plans and actions for low greenhouse gas emission developmentreflecting their special circumstances in the context of intended nationally determinedcontributions.” Mitigation and adaptation targets in this INDC are presented in an up-front formatto facilitate clarity and transparency, and are a mix of conditional and unconditional contributions,contingent upon receiving international support for technology transfer, capacity-building andfinancial resources.
Antigua and Barbuda reserves the right to revise this INDC prior to finalization and/or ratificationunder a new global climate agreement.Intended Nationally Determined Contribution (INDC)
Conditional Adaptation Targets1. By 2030, all buildings improved and prepared for extreme climate events, including
drought, flooding and hurricanes.

ANNEX: STATEMENT OF INDC
129
2. By 2025, increase seawater desalination capacity by 50% above 2015 levels.3. By 2030, 100% of electricity demand in the water sector92 and other essential services
(including health, food storage and emergency services) will be met through off-gridrenewable sources.
4. By 2030, all waterways protected to reduce the risks of flooding and health impacts.5. By 2030, an affordable insurance scheme is available for farmers, fishers, and residential
and business owners to cope with losses resulting from climate variability.
Conditional Mitigation Targets1. By 2020, finalize the technical studies with the intention to construct and operationalize
a waste to energy (WTE) plant by 2025.93
2. By 2020, establish efficiency standards for the importation of all vehicles and appliances.3. By 2030, achieve an energy matrix with 50 MW of electricity from renewable sources both
on and off-grid in the public and private sectors.94
4. By 2030, all remaining wetlands and watershed areas with carbon sequestration potentialprotected as carbon sinks.
Unconditional Targets1. Enhance the established enabling legal, policy and institutional environment for a low
carbon emission development pathway to achieve poverty reduction and sustainabledevelopment.
2. By 2020, update the Building Code to meet projected impacts of climate change.
Support for Implementation
The conditional adaptation and mitigation targets presented in this INDC are contingent uponAntigua and Barbuda receiving international support for capacity building, technology transferand financial resources, including through the Green Climate Fund (GCF), the Global EnvironmentFacility (GEF), the Adaptation Fund and multilateral agencies and bilateral agreements. The costof implementing the adaptation targets is estimated at approximately $20M USD per year for thenext ten years, and the cost of mitigation is estimated at approximately $220M USD, howeverthese figures require further analysis.
National contributions include establishing an enabling legal, policy and institutional environmentto facilitate an efficient and effective transfer of resources to support implementation andachievement of the INDC targets. This enabling environment includes enactment of theRenewable Energy Act of 2015 and the Environmental Protection and Management Act (EPMA)of 2015, in addition to policies in energy and the environment such as the National Energy Policyand the Sustainable Energy Action Plan. National efforts have contributed to an enabling financing
92 The water sector includes water generation (seawater desalination), distribution and usage, toensure water delivery when grid electricity may be interrupted. Based on an informal assessment,water distribution and usage is equal to approximately 15% of GHG emissions in the electricitysector.93 Waste-to-energy is not considered part of the 50 MW renewable energy target.94 This target includes distributive renewable energy capacity to be used as backup energy by thecommercial sector and some residences. The assumption is that the commercial sector has fullbackup capacity at approx. 20 MW to continue operations when grid electricity may beinterrupted. Backup electricity generation is currently fossil fuel based.

ANNEX: STATEMENT OF INDC
130
environment through the Sustainable Island Resource Framework Fund (SIRF Fund), which wasestablished under national environmental law. The Fund’s executing agency, the Department ofEnvironment, has achieved accreditation to the Adaptation Fund as a National ImplementingEntity, and the Department is seeking direct access to the GCF through a fast-track application.
INFORMATION TO FACILITATE CLARITY AND TRANSPARENCY
Parameter InformationPeriod of implementation Pre 2020 and 2020 – 2030Type of commitment We recognize that contributions from developed
countries may be absolute economy-wideemission reduction targets relative to a base year,and that contributions from developing countriesmay be policies, measures and actions departingfrom business as usual. As a developing country, asmall island developing state, and one of thelowest emitters in the world, Antigua and Barbudapresents conditional and unconditional policies,measures and actions (non-GHG target).
Reference point Greenhouse Gas Emissions and Removals (Gg) for2006
Scope andcoverage
Emissions impact Contributions will reduce GHG emissions in theenergy sector, reduce dependence on fossil fuels,reduce the cost of energy and help alleviatepoverty through increasing access to affordableand sustainable energy.
Sectors Sectors addressed in the adaptation andmitigation targets include: Energy, Tourism,Agriculture, Waste, Water, Transportation,Forestry and Land Use Change.
Greenhouse Gases (GHGs) The national GHG inventory covers Carbon Dioxide(CO2), Methane (CH4), Nitrous Oxide (N2O), andHydrofluorocarbons (HFC).
Geographical boundaries Entire countryIntention to use market-basedmechanisms to meet target
Antigua and Barbuda considers the establishmentof an international market mechanism as animportant complimentary option to reduce totalcosts associated with limiting GHG emissions andto assist global efforts limiting temperature to 1.5degrees Celsius above pre-industrial levels.Antigua and Barbuda acknowledges the potentialfor a renewed and reformed Clean DevelopmentMechanism to fulfill this roll through its existingstructure. The final mechanism should be a robustsystem that guarantees transparency andenvironmental integrity, and delivers real,

ANNEX: STATEMENT OF INDC
131
permanent and verified emission reductions andensures that double counting is avoided.
Planning processThis initial draft INDC was developed through a Cabinet mandate, where the Cabinet ofAntigua and Barbuda also reviewed the adaptation and mitigation targets. The TechnicalAdvisory Committee (TAC), was the primary drafting and review committee in thedevelopment of this initial INDC. The TAC is an inter-agency, multi-stakeholder advisorycommittee that includes fifteen government agencies, three NGOs and community interestgroups, and one private sector coalition representative.
Additional consultations were arranged with public, private, and civil society stakeholders,through meetings, workshops, public awareness and online publication.
Antigua and Barbuda recognizes the importance of Principle 10 of the Rio Declaration ontransparency, access and accountability in environmental matters through participation ofall concerned citizens, at the relevant levels, as well as to involve the community byencouraging public awareness and participation by making information readily available.
Antigua and Barbuda’s INDC is a working document and will be updated periodically, asappropriate. This initial draft INDC will be supported by a technical road map and additionaltechnical assessments to facilitate the drafting of policies, regulations, and standards forimplementation.
Assumptions and Methodological ApproachesThe full implementation of Antigua and Barbuda’s INDC is made on the assumption of anambitious and equitable multilateral agreement being reached among Parties that providesthe means of implementation to enable Antigua and Barbuda to access international supportthrough climate finance, and an agreement that stimulates investments, technology transferand capacity building.
The methodologies used to estimate GHG emissions in relevant sectors correspond to the2006 IPCC Guidance for Conducting National Greenhouse Gas Inventories and assume GlobalWarming Potential (GWP) values for a residence period in the atmosphere of 100 yearspertaining to the Second Assessment report of the IPCC.
Consideration on Fairness and AmbitionAntigua and Barbuda’s INDC is fair, ambitious, and science-based, and is therefore aresponsible contribution toward the global efforts of meeting the objectives of the UNFCCCto limit the average temperature rise to 1.5 degrees Celsius above pre-industrial levels, andto enable and support the implementation of adaptation actions aimed at reducingvulnerability and building resilience in vulnerable countries.
The ambitious adaptation and mitigation targets presented in this INDC represent a nationalcommitment towards addressing the global climate change challenge. Antigua and Barbuda’semissions are negligible in a global context (less than 0.002% of global GHG emissions), andas a small island developing state (SIDS) the country is highly vulnerable to climate trends
ANNEX: STATEMENT OF INDC
132
and impacts. Antigua and Barbuda aspires to increase national resilience to climate changethrough implementing integrated mitigation and adaptation actions.
Antigua and Barbuda reaffirms its commitment to the AOSIS position that, “Research clearlyshows that unless we act immediately, the opportunity to keep global warming below thecrucial 1.5 degree Celsius threshold could be irrevocably lost.” The country believes in theprinciple of common but differentiated responsibilities and respected capabilities (CBDR) toaddress the global climate challenge.
ACCOMPANYING INFORMATION ON ANTIGUA AND BARBUDA’S INDC
General Information
Antigua and Barbuda is a small island developing state (SIDS) in the Caribbean Sea with apopulation of 90,000, of which 1,200 people reside in Barbuda. The country’s economy is heavilydependent on natural resources, low-lying coastal zones, and favorable climate conditions tosupport the tourism sector, which accounts for about 80% of output gross domestic product(GDP), about 70% of direct and indirect employment and 85% of foreign exchange earnings.Antigua and Barbuda is exposed economically, environmentally and socially to projected climatechange impacts.95
Climate models for the Caribbean highlight the need for downscaled climate data. Temperatureprojections from a Regional Climate Model (RCM) indicate more rapid increases in temperaturesover Antigua and Barbuda compared to the Global Climate Model (GCM), as the improved spatialresolution in the RCM allows the land mass of the larger Caribbean islands to be represented,whilst the region is represented only by ‘ocean’ grid boxes at GCM resolution. RCM projectionsindicate increases of 2.4 ̊C to 3.2 ̊C in mean annual temperatures by the 2080s.96 Analysis ofclimate change for the island also projects accelerated coastal erosion and inundation, loweraverage annual rainfall, increased rainfall intensity causing flooding and a likely increase in tropicalstorm intensity.
Accompanying Information on Adaptation Actions
Antigua and Barbuda’s development strategy is guided by a national physical development plan,a requirement under the Physical Planning Act of 2003, and is periodically updated. In 2012,Cabinet approved the Sustainable Island Resource Management and Zoning Plan (SIRMZP) toserve as the updated national physical development plan, which presents a forward‐lookingstrategic, national spatial development framework that addresses current development issues,and provides a platform for feasible private and public sector development initiatives, reflectinglocal cultural values and aspirations over the next twenty years. While complementing the SIRMZPstrategy, adaptation targets presented in this INDC are incremental efforts to the national physicaldevelopment plan as the targets elevate ambition beyond development, to build resiliencethrough adaptation interventions in preparation for projected climate impacts.
95 CARIBSAVE 2015, Draft National Vulnerability Analysis for Antigua and Barbuda.96 CARIBSAVE 2012, Climate Change Risk Atlas Profile for Antigua and Barbuda (CCCRA), p. 14.

ANNEX: STATEMENT OF INDC
133
Since the year 2001, Antigua and Barbuda has been up to date with its commitments to report tothe UNFCCC and is now in the process of preparing its Third National Communication to theUNFCCC, to be presented by the end of 2015. Antigua and Barbuda has presented two NationalCommunications, the first in 2001 and the second in 2011, which highlight climate change presentand future impacts. The National Communications elaborate in detail the impact that climatechange will have on weather- and climate-sensitive sectors. Antigua and Barbuda is currentlydeveloping its biennial update report (BUR), which will be submitted to the UNFCCC by the end of2016.
Drought is a major concern for the country. Historically, the water sector in Antigua and Barbudahas been vulnerable to shortages as a result of droughts every 5 to 10 years coupled withcontamination from saltwater intrusion that threatens groundwater supplies. Some wells havealready been capped to address the issue of saltwater intrusion.97 Antigua and Barbuda lie in azone that is expected to receive 30-50% less average annual rainfall by 2090 compared to late 20th
century norms,98 and in the Caribbean, sea level rise has been observed at between 1.5 and 3 mmper year, which is projected to accelerate in the future.
Climate impacts will exacerbate freshwater scarcity, and adaptation interventions in the watersector are of national priority. Desalination reliance has already grown to account for 60% ofnational water supply, and this ratio is the most viable option for enhancing water resources.99
During times of drought, desalination can account for up to 90% of freshwater supply. Antiguaand Barbuda have the goal to, by 2025, increase seawater desalination capacity by 50% above2015 levels, from approximately 5.4 million to over 8 million US gallons per day (GPD) tocounteract freshwater scarcity in Antigua and Barbuda.
Given that desalination is the primary adaptation solution to Antigua and Barbuda’s freshwaterchallenges, and that its ability to meet demand is contingent on a stable and uninterrupted energysupply, implementing resilience in energy systems for water resources is a critical adaptationmeasure. Off-grid renewable energy resources can enhance resilience in the water sector. By2030, 100% of electricity demand in the water sector – and other essential services includinghealth, food storage and emergency services – will be met through on and off-grid renewablesources to enhance resilience to drought and hurricanes.The need for adaptation in the water sector is not limited to freshwater supply. In recent years,the impact of floods in Antigua and Barbuda have become particularly acute, in part due to climatevariability affecting the frequency and severity of storms and rainfall extremes, and todevelopment that has increased impervious surface cover and constricted drainage.100 The healthsector is exposed to climate impacts through vector borne diseases and the spread of water-borneillnesses, where trends suggest increases in Antigua and Barbuda.101 By 2030, all waterways willbe protected to reduce the risks of flooding and health impacts.
97 CARIBSAVE 2012, Climate Change Risk Atlas Profile for Antigua and Barbuda (CCCRA), p. 36.; Environment Solutions Limited(ESL) 2014, National Adaptation Strategy and Action Plan to Address Climate Change in the Water Sector in Antigua and Barbuda,p. 11.98 CARIBSAVE 2015, Draft National Vulnerability Analysis for Antigua and Barbuda, p. 9.99 ESL 2014, National Adaptation Strategy and Action Plan to Address Climate Change in the Water Sector in Antigua and Barbuda,p. 174.100 UNHABITAT 2011, Antigua and Barbuda: National Urban Profile, p. 23.101 CARIBSAVE 2012, Climate Change Risk Atlas Profile for Antigua and Barbuda (CCCRA), p. 189.

ANNEX: STATEMENT OF INDC
134
Climate models projecting hurricane trends have generally determined that there will be anincrease in intensity, if not frequency, of hurricanes in the Atlantic and Caribbean.102 As such,hurricanes will pose an increasing threat to Antigua and Barbuda’s economy. Over 15 years,between 1995 and 2010, six hurricanes resulted in economic losses and damages on the twinisland state totaling US $335 million (Hurricane Luis in 1995, Hurricane Georges in 1998,Hurricanes Jose and Lenny in 1999, Hurricane Omar in 2008, and Hurricane Earl in 2010).103
Physical infrastructure in Antigua and Barbuda must be adapted to the dynamic threats of waterscarcity, heavy rainfall events, and more intense storms and hurricanes. By 2030, all buildings willbe improved and prepared for extreme climate events, including drought, flooding andhurricanes.
Physical adaptation measures will not always be enough to prevent significant loss and damageto the infrastructure and economy of Antigua and Barbuda. As a coastal economy, one-meter sealevel rise (SLR) would impact 10% of major tourism resorts, all seaports, and 2% of major roadnetworks in Antigua and Barbuda. The fisheries sector sustains significant losses duringhurricanes, and will be negatively impacted by ocean acidification, SLR, and increasing sea surfacetemperatures. The recent annual influx of Sargassum seaweed to Antigua and Barbuda’swindward shores, which may be a result of climatic factors, is an unanticipated slow onset eventwith significant economic repercussions in tourism and fisheries. The agricultural sector is alsoparticularly vulnerable to climate impacts. A drought in 2010 resulted in an overall loss of cropsby 15%, with some crops sustaining losses up to 50%, while later that year excessive rain incurredlosses to the crop sector totaling US $1 million.104 A loss and damage mechanism is integral tobuilding resilience to climate change in Antigua and Barbuda. By 2030, an affordable insurancescheme will be available for farmers, fishers, and residential and business owners to cope withlosses resulting from climate variability.
Accompanying Information on Mitigation Actions
Without any known fossil fuel resources, Antigua and Barbuda relies almost exclusively onimported fossil fuels for energy: heavy fuel oil in electricity generation; gasoline and diesel intransport; and liquefied petroleum gas (LPG) for cooking. This has resulted in high emissions andhigh fuel costs. In 2006, Antigua and Barbuda’s national emissions totaled 945.5 Gg CO2, of which92% were derived from fuel combustion in the energy sector.105 In addition, the cost of fossil fuelimports, valued at US $165.4 million in 2013, or equivalent to 13.7% of the country’s GDP, is afinancial burden on the country’s economy. The cost of electricity has risen to over US $0.40 perkWh,106 and consumers in Antigua and Barbuda pay among the highest electricity prices in theworld. High electricity rates inhibit adaptation strategies, such as seawater desalination; theprovision of essential services; small businesses and low- and middle-income households; andeconomic growth.
However, in recent years, Antigua and Barbuda has made important strides in its sustainableenergy policy. A National Energy Policy (NEP) was approved in November 2011, serving as the
102 CARIBSAVE 2012, Climate Change Risk Atlas Profile for Antigua and Barbuda (CCCRA), p. 28.103 CARIBSAVE 2015, National Vulnerability and Impact Assessment, p. 44.104 CARIBSAVE 2012, Climate Change Risk Atlas Profile for Antigua and Barbuda (CCCRA).105 Antigua and Barbuda’s GHG Inventory for the Third National Communication to the UNFCCC.106 IRENA Renewables Readiness Assessment (RRA) Background Paper, Working Draft, Antigua and Barbuda.

ANNEX: STATEMENT OF INDC
135
main policy for renewable energy (RE) and energy efficiency (EE) development. The NEP sets outthe national approach to achieving its vision that, “By 2030 Antigua and Barbuda will meet theneeds of the present generation while safeguarding the environment and enabling futuregenerations to meet their own energy needs. All citizens and residents will have access toaffordable, efficient, socially responsible and reliable forms of energy”. This strategic planproposes to exploit local energy resources and reduce fossil fuel dependence.
In March 2013, Antigua and Barbuda released a Sustainable Energy Action Plan (SEAP), to fosterenergy conservation and efficiency, diversification of energy sources, sustainable energyconsumption and generation as well as the utilization of renewable energy sources. In 2015,Parliament enacted the Renewable Energy Act of 2015, to establish a legal, economic andinstitutional basis to promote the use of renewable energy resources. Towards this end, Antiguaand Barbuda will, by 2030, achieve an energy matrix with 50 MW of electricity from renewablesources both on and off-grid in the public and private sectors.
Domestic and industrial waste is a growing environmental concern in Antigua and Barbuda,whereas technological assistance could reverse this trend and create new opportunities. Apreliminary review of annual waste streams to the sanitary landfill suggests that some 80,000tonnes annually of feedstock could be available for conversion to energy if an appropriate facilitywere available, mitigating CO2, N2O and CH4 emissions. Antigua and Barbuda’s goal is to, by 2020,finalize technical studies with the intention to construct and operationalize a waste to energy(WTE) plant by 2025.
Land use change and forestry contribute seven percent of national emissions, which can bemitigated through GHG emissions removal by carbon sinks. The Environmental Protection andManagement Act of 2015 establishes the legal backing such that, “Where the area is protected asa carbon sink it shall follow the principles developed by the UNFCCC.”107 By 2030, all remainingwetlands and watershed areas with carbon sequestration potential protected as carbon sinks.
In 2014, the transport sector consumed over one quarter of the country’s fossil fuel imports, 20%of which were gasoline and 11% diesel.108 The NEP addresses this emissions sector by inter aliarecommending the use of vehicles with higher fuel efficiency and lower emissions, and supportfor hybrid, flex-fuel for electric vehicles as national targets. Antigua and Barbuda aims to, by 2020,establish efficiency standards for the importation of all vehicles and appliances.
Consideration of INDC Mitigation/Adaptation Co-benefits
Antigua and Barbuda recognizes the co-benefits of adaptation and mitigation in the area of lowcarbon development as an efficient and cost-effective strategy for sustainable development.National circumstances highlight the country’s exposure and vulnerability to climate impacts, andthe ways in which mitigation actions, namely on and off-grid renewable energy, can increaseresilience in critical sectors such as energy, water, health, and emergency services. Similarly,mitigation actions can have adaptation co-benefits. For example, expanding the protection of
107 Section 53(8) of the Environmental Protection and Management Act of 2015 of Antigua andBarbuda.108 IRENA Renewables Readiness Assessment (RRA) Background Paper, Working Draft, Antigua andBarbuda, p. 9.

ANNEX: STATEMENT OF INDC
136
wetlands and watersheds to sink GHG emissions also serves as an adaptation strategy byenhancing water retention and reducing the risks of climate impacts, namely flooding and stormsurge.
Additional Information on Support for Implementation
Antigua and Barbuda requires international support from multilateral and bilateral sources,including through the Green Climate Fund (GCF), the GEF and the Adaptation Fund, for capacitybuilding, climate finance and technology transfer to be able to strengthen its current programs,policies and regulations, to develop and implement new initiatives, and to fully assess and addressthe impacts of climate change, as defined in the adaptation and mitigation targets. Additionalactivities requiring support for implementation include, inter alia:
Technology, human resources and financial capacity assessment and road map; Support for the development of a Technology Strategy and Road Map that includes
repurposing, decommissioning, and disposing of stranded assets; Comprehensive assessment on the national costs of adaptation and mitigation to climate
change; Elaboration of a National Adaptation and Technology Plan; Enhancing Measurement, Reporting and Verification (MRV) processes; Development of standardized baselines to assess and monitor the impacts and benefits
of implementing the INDC adaptation and mitigation initiatives; Support for data collection, storage and management; and Support for education, training, public awareness, public participation, public access to
information, and international cooperation throughout implementation of the INDCtargets.
Antigua and Barbuda expresses that this INDC is provisional and an updated version will besubmitted as necessary. Antigua and Barbuda reserves the right to adjust this INDC, includinginformation and parameters, before finalization under a new global agreement.