increased automobile fuel efficiency and synthetic fuels: alternatives for reducing oil imports
TRANSCRIPT

8/14/2019 Increased Automobile Fuel Efficiency and Synthetic Fuels: Alternatives for Reducing Oil Imports
http://slidepdf.com/reader/full/increased-automobile-fuel-efficiency-and-synthetic-fuels-alternatives-for 1/292
Increased Automobile Fuel Efficiency and Synthetic Fuels: Alternatives for Reducing
Oil Imports
September 1982
NTIS order #PB83-126094

8/14/2019 Increased Automobile Fuel Efficiency and Synthetic Fuels: Alternatives for Reducing Oil Imports
http://slidepdf.com/reader/full/increased-automobile-fuel-efficiency-and-synthetic-fuels-alternatives-for 2/292
Library of Congress Catalog Card Nu mb er 82-600603
For sale by the Sup erintend ent of Docum ents,
U.S. Government Printing Office, Washington, D.C. 20402

8/14/2019 Increased Automobile Fuel Efficiency and Synthetic Fuels: Alternatives for Reducing Oil Imports
http://slidepdf.com/reader/full/increased-automobile-fuel-efficiency-and-synthetic-fuels-alternatives-for 3/292
Foreword
This report presents the findings of an assessment requested by the Senate Com-mittee on C om me rc e, Sc ience, and Transportation. The stud y assesses and c om pa resincreased automobile fuel efficiency and synthetic fuels production with respect to theirpo tential to reduc e c onventional oil c onsump tion, and their c osts and imp ac ts. Con-servation and fuel switching as a means of reducing stationary oil uses are also con-sidered , but in co nsiderably less de ta il, in order to ena b le estima tes of p lausible futureoil imports.
We a re g rate ful for the a ssistanc e o f the p rojec t a dvisory pa nels and the m any o ther
people who provided advice, information, and reviews. It should be understood, how-ever, that OTA assumes full responsibility for this report, which does not necessarilyrepresent the views of individual members of the advisory panels.
Director
8/14/2019 Increased Automobile Fuel Efficiency and Synthetic Fuels: Alternatives for Reducing Oil Imports
http://slidepdf.com/reader/full/increased-automobile-fuel-efficiency-and-synthetic-fuels-alternatives-for 4/292
Automobile Fuel Efficiency Advisory Panel
Maudine R. Cooper*National Urban League, Inc.
John FerronNational Automobile Dealers Association
Michael J. Rabins, Chairman Wayne State University
Donald FriedmanMinicar, Inc.
Herbert FuhrmanNational Institute for
Automobile Service Excellence
James M. GillThe Ethyl Corp.
R. Eugene Goodson**Hoover Universal, Inc.
Charles M. Heinen***Chrysler Corp.
Synthetic Fuels Advisory
Harvey O. BanksCamp Dresser McKee, Inc.
Ellen BermanConsumer Energy Council of America
Leslie BurgessFluor Corp.
Frank CollinsOil, Chemica l and Atom ic Workers
International Union
Thomas F. EdgarUniversity of Texas
Louis FrickE. 1. du Pent d e Ne mo urs & C o., Inc .
Bernard GillespieMobil Research and Development Co.
John B. HeywoodMassachusetts Institute of Technology
John HoldenFord Motor Co.
Maryann N. KellerPaine, Webber, Mitchell, & Hutchins
Paul LarsenGMC Truck and Coa ch Division
Robert D. NellConsumers Union
Kenneth OrskiGerma n Ma rshall Fund of the United States
Howard Young*United Auto Workers
PanelHans Landsberg, Chairman
Resources for the Future
Robert HowellRefinery ConsultantChairman, Synfuels SubcommitteeSierra Club
Sheldon LambertShell Oil Co.
John L. McCormickEnvironmental Policy Center
Edward MerrowRand Corp.
Richard K. PefleySanta Clara University
AlIan G. PulsipherTennessee Valley Authority
Robert ReillyFord Motor Co.
Fred WilsonTexac o, Inc.
NOTE: The Advisory Panels provide d ad vice and comment throug hout the assessment, but the memb ersdo not nec essarily a pprove , d isapp rove, o r end orse the rep ort for w hich OTA assume s full responsibility.
q Resigned from panel.q q Formerly with Institute for Interdisciplinary Engineering Stud&, Purdue University.
* q q Retired from ChryslercOrp.
ICurrently with LTV Corp.
iv

8/14/2019 Increased Automobile Fuel Efficiency and Synthetic Fuels: Alternatives for Reducing Oil Imports
http://slidepdf.com/reader/full/increased-automobile-fuel-efficiency-and-synthetic-fuels-alternatives-for 5/292
OTA Increased Automobile FuelSynthetic Fuels Project Staff
Efficiency and
Lionel S. Johns, Assista nt Direc to r, OTA
Energy, Mate ria ls, and Inte rnat iona l Sec urity Division
Richard E. Rowberg, Energy Program Manager
Synthetic Fuels and Project Coordination Increased Automobile Fuel Efficiency
Thomas E. Bull, Project Director John A. Alic , Autom ob ile Tec hnology
Paula J. Sto ne, Assistant Project Director Marjory S. Blumenthal, Cost Analysis and
Steven E. Plotkin, Environmental Analysis Econom ic and Soc ial Imp ac ts
and Execu tive Summ ary Larry L. Jenney, Automob ile Tec hnology
Richard W. Thoreson, Eco nomic Impac ts Richard Willow, Electric Vehicles
Contributors
David Strom Franklin TugwellDavid Sheridan, Editor
Administrative Staff
Lillian Quigg Edna Saunders Marian Grochowski Virginia Chick
Contractors
E. J. Bentz & Associates, Inc., Springfield, Va.Wright Water Engineers, Inc., Denver, Colo.Michael Chartock, Michael Devine, and Martin Cines,
University of Oklahoma, Norman, Okla.
Ge neral Resea rch Corp., San ta Barbara , Ca lif.
OTA Publishing Staff
John C. Holmes, Publishing Officer
John Berg ling Kathie S. Boss Debra M. Datc her Joe Henson

8/14/2019 Increased Automobile Fuel Efficiency and Synthetic Fuels: Alternatives for Reducing Oil Imports
http://slidepdf.com/reader/full/increased-automobile-fuel-efficiency-and-synthetic-fuels-alternatives-for 6/292
Acknowledgments
OTA thanks the following p eople who took time to p rovide information or review p art or a ll of the study.
John AcordMontana Department of Natural Resources
and Conservation
David AlberswerthWestern Organization of Resource Councils
Louis E, AllenWyoming State Engineer’s Office
Mo rris AltshulerU.S. Environmental Protection Agency
Marty AndersonTransportation Systems CenterDepartment of Transpo rtation
Ray BaldwinPlanning Department, Garfield County, Colo.
Craig BellWestern States Water Council
Martin J. Bernard, IllCenter for Transporta tion Resea rchArgonne National Laboratory
Don BischoffCalifornia Energy Commission
William BoehlyNat iona l Highw ay Traffic Safety Administrat ion
Charles BrooksU.S. Department of Energy
A. L. BrownEXXON Co a l Resourc es, USA, Inc .
George ByronTransportation Systems CenterDepartment of Transpo rtation
James ChildressNationa l Counc il on Synthe tic Fuels Produc tion
George ChristopulosWyoming State Engineer
David ColeOffice for the Study of Automotive Transpo rtationUniversity of Michigan
George Davis
U.S. Nationa l Committee for Internat ionalHydrology Program
Clarence DitlowCenter for Auto Safety
C. Gilmore DuttonAppropriations and Revenue CommitteeKentucky Legislative Research Commission
Vernon FahyNorth Dakota Sta te Engineer
Jack FitzgeraldU.S. Environmental Protection Agency
Ga ry FritzMontana Department of Natural Resources
and Conservation
Jack GilmoreDenver Research InstituteUniversity of Denver
Harris GoldWater Purification Associates
David Gushee
Congressional Research ServiceJack HannonE. 1. du Pent de Nemo urs & Co ., Inc .
Richard HildebrandU.S. Department of Energy
Frank von HippelCenter for Energy a nd Environmenta l Stud iesPrinc eton University
Edward HoffmanConsultant
Harriet Holtzman
Environmental Policy Institute
Darrell HowardTennessee Valley Authority
Richard HowardSouth Dakota Department of Water
and Natural Resources
Charles HudsonArgonne National Laboratory
James JohnDepartment of Mechanical EngineeringOhio State University
Arvid Joupi
Joseph KanianthraNational Highway Traffic Safety Administration
vi

8/14/2019 Increased Automobile Fuel Efficiency and Synthetic Fuels: Alternatives for Reducing Oil Imports
http://slidepdf.com/reader/full/increased-automobile-fuel-efficiency-and-synthetic-fuels-alternatives-for 7/292
Sarah La BelleArgonne National Laboratory
Jonathan LashNatural Resources Defense Council
Minh-Triet LethiOffice of Scienc e a nd Tec hnology Policy
Kevin MarkeyFriends of the Earth
David MarksDepartment of Civil EngineeringMassachusetts Institute of Technology
J. P. MatulaEXXON Research & Engineering Co.
Dennis McElwainAFL-CIO
C. E. McGeheeBattlement Mesa, Inc.
Gary McKenzieNationa l Sc ience Found at ion
Ron McMahanAbt/West
Gene MeyerShell Oil Co .
Carl NashNat iona l Highway Traffic Safety Adm inistrat ion
Christopher PalmerNationa l Audob on Soc iety
Laszlo PastorDRAVO Corp.
E. Pipe r
Energy Development Consultants, Inc.James PosewitzMontana Department of Fish, Wildlife,
and Parks
Frank RichardsonNat iona l Highw ay Traffic Safety Adm inistrat ion
Richard D. RidleyOccidental International Corp.
H. RobichaudANG Coal Gasification
Phil Scha rreTennessee Valley Authority
William SchriverU.S. Departme nt o f Lab or
Roger ShunU.S. Department of Energy
Tom SladekColorado School of Mines Research Institute
Catherine SlesingerGeneral Accounting Office
John H. SmithsonU.S. Department of Energy
Earl StakerUtah Dep uty Sta te Enginee r
Dick StrombotneNat iona l Highwa y Traffic Safety Adm inistrat ion
George Tauxe
Sc ience a nd Public Policy ProgramUniversity of Oklahoma
David TundermannU.S. Environmental Protection Agency
Wallac e TynerDepartment of Agricultural EconomicsPurdue University
Richard A. WaldeGulf Research and Development Co.
David WalkerColorado Water Conservation Board
George WangBechtel Group, Inc.
R. M. WhamOak Ridge National Laboratory
Mary Pat WilsonWESTPO
Edward P. YarmowichU.S. Department of Energy
vii

8/14/2019 Increased Automobile Fuel Efficiency and Synthetic Fuels: Alternatives for Reducing Oil Imports
http://slidepdf.com/reader/full/increased-automobile-fuel-efficiency-and-synthetic-fuels-alternatives-for 8/292
Contents
Chapter Page
I. Executive Summary . . . . . . . . . . . . . . . . . . . . . . . . . . . . . . . . . . . . . . . . . . . . . 3
2.introduction . . . . . . . . . . . . . . . . . . . . . . . . . . . . . . . . . . . . . . . . . . . . . . . . . . . 29
3. Policy . . . . . . . . . . . . . .. .. .. .. ... . . $........ . . . . . . . . . . . . . . . . . . . . . . 35
4. issues and Findings. . . . . . . . . . . . . . . . . . . . . . . . . . . . . . . . . . . . . . . . . . . . . . 67
5. Increased Automobile Fuel Efficiency . . . . . . . . . . . . . . . . . . . . . . . . . . . . . . . 105
6. Synthetic Fuels . . . . . . . . . . . . . . . . . . . . . . . . . . . . . . . . . . . . . . . . . . . . . . . . . 157
T. Stationary Uses of Petroleum . . . . . . . . . . . . . . . . . . . . . . . . . . . . . . . . . . . . . . 183
8. Regional and National Economic Impacts . . . . . . . . . . . . . . . . . . . . . . . . . . . 195
9. Social Effects and Impacts . . . . . . . . . . . . . . . . . . . . . . . . . . . . . . . . . . . . . . . . 219
10. Environment, Health, and Safety Effects and Impacts . . . . . . . . . . . . . . . . . . 237
11. Water Availability for Synthetic Fuels Development . . . . . . . . . . . . . . . . . . . 279
Index . . . . . . . . . . . . . . . . . . . . . . . . . . . . . . . . . . . . . . . . . . . . . . . . . . . . . . . . . . . . 291

8/14/2019 Increased Automobile Fuel Efficiency and Synthetic Fuels: Alternatives for Reducing Oil Imports
http://slidepdf.com/reader/full/increased-automobile-fuel-efficiency-and-synthetic-fuels-alternatives-for 9/292
Chapter 1
Executive Summary

8/14/2019 Increased Automobile Fuel Efficiency and Synthetic Fuels: Alternatives for Reducing Oil Imports
http://slidepdf.com/reader/full/increased-automobile-fuel-efficiency-and-synthetic-fuels-alternatives-for 10/292
Contents
Page
Introduction. . . . . . . . . . . . . . . . . . . . . . . . . . . . . . . . . . . . . . . . . . . . . . . . . . . . 3
Conclusions and Comparisons . . . . . . . . . . . . . . . . . . . . . . . . . . . . . . . . . . . . . . . . 3Import Reductions . . . . . . . . . . . . . . . . . . . . . . . . . . . . . . . . . . . . . . . . . . . . . . . . 3costs . . . . . . . . . . . . . . . . . . . . . . . . . . . . . . . . . . . . . . . . . . . . . . . . . . . . . . . . . . . 5Technological and Economic Risks . . . . . . . . . . . . . . . . . . . . . . . . . . . . . . . . . . 6Additional Bases for Comparison-Environmental Social and
Economic Effects . . . . . . . . . . . . . . . . . . . . . . . . . . . . . . . . . . . . . . . . . . . . . . . . 7
policy . . . . . . . . . . . . . . . . . . . . . . . . . . . . . . . . . . . . . . . . . . . . . . . . . . . . . . . . . . . . 8Stimulating Oil Import Reductions . . . . . . . . . . . . . . . . . . . . . . . . . . . . . . . . . . . 8Dealing With Other Effects . . . . . . . . . . . . . . . . . . . . . . . . . . . . . . . . . . . . . . . . . 10
Overview of the lmport Reduction Options . . . . . . . . . . . . . . . . . . . . . . . . . . . . . 10Increased Automobile Fuel Efficiency . . . . . . . . . . . . . . . . . . . . . . . . . . . . . . . . 10Synthetic Fuels . . . . . . . . . . . . . . . . . . . . . . . . . . . . . . . . . . . . . . . . . . . . . . . . . . . 16Reducing Stationary Uses of Oil. . . . . . . . . . . . . . . . . . . . . . . . . . . . . . . . . . . . . 22Electric Vehicles . . . . . . . . . . . . . . . . . . . . . . . . . . . . . . . . . . . . . . . . . . . . . . . . . . 24
TABLES
Table No.
I. Projec ted Average Fuel Economy, 1985-2000 . . . . . . . . . . . . . . . . .2. Domestic Investment for Increased Fuel Efficiency . . . . . . . . . . . . . . . . . . . . .3. Consumer Costs for increased Automobile Fuel Efficiency, Without
Discounting Future Fuel Savings, Moderate Shift to Smaller Cars . . . . . . . . .4. Price of Synthetic Fuels Required To Sustain Production Costs . . . . . . . . . . .5. Two Comparisons of the Environmental impacts of Coal-Based Synfuels
Produc tion a nd Coa l-Fired Elec tric Generation . . . . . . . . . . .6. Summary of Annual Energy Requirements To Displace 2.55
Stationary Fuel Oil Use . . . . . . . . . . . . . . . . . . . . . . . . . . . . . .
FIGURES
Figure No.
l. Potential Oil Savings Possible by the Year 2000 . . . . . . . . . .
. . . . . . . . . . . . .MMB/D of. . . . . . . . . . . . .
. . . . . . . . . . . . .2. Estimated Investment Costs for the Oil Import Reduction Options . . . . . . . .
Page
11
13
1417
20
23
Page
4
6
8/14/2019 Increased Automobile Fuel Efficiency and Synthetic Fuels: Alternatives for Reducing Oil Imports
http://slidepdf.com/reader/full/increased-automobile-fuel-efficiency-and-synthetic-fuels-alternatives-for 11/292
Chapter 1
Executive Summary
INTRODUCTION
In 1981, U.S. oil imports averaged 5.4 millionbarrels per day (MMB/D)–approximately 34 per-c ent o f its oil c onsump tion and 15 pe rc ent o f itstotal energy use. This is potentially a serious riskto the ec onomy and sec urity of the United States.
Furthermore, recovery from the current recessionwill inc rea se d emand for oil and , although c ur-rently sta b le, do me stic oil prod uc tion is likely toresume a stea dy d ec line in the nea r future.
Several options exist for reducing oil imports.However, even with moderate increases in auto-mobile fuel efficiency, moderate success at de-veloping a synthetic fuels industry and the ex-pected reduction in stationary use of fuel oil, U.S.
oil imp orts c ould still be ove r 4 MMB/ D b y 2000,if the U.S. ec ono my is hea lthy and has not under-
go ne unforeseen struc tural c hang es tha t m ightreduce oil demand well below projected levels.
Only with vigorous promotion of all three op-tions and technological success can the Nationhope to eliminate oil imports before 2010.
Congress faces several decisions on how to re-duc e the U.S. dep ende nce on imported p etro-leum. Two op tions, inc reased autom ob ile effi-c ienc y and synthet ic fue ls, are p artic ularly likelyto be subjects of congressional debates. First,Cong ress ma y wa nt to c onside r new inc entivesto increase auto fuel efficiency beyond that man-
dated by the 1985 CAFE (Corporate Average Fuel
Efficiency) standards. Second, Congress will haveto d ec ide whether to co ntinue into the sec ondphase of the program to accelerate synfuels devel-
op me nt und er the Synthet ic Fue l Corp . (SFC). Thepurpose of this report is to assist Congress in mak-
ing these decisions and comparing these optionsby exploring in detail the major public and private
costs and benefits of increased automobile fuelefficiency and synthetic fuels production. A third
op tion for reduc ing imp orts-inc rea sed efficien-cy and fuel switching in stationary (nontranspor-ta tion) o il uses—is exam ined b riefly to a llow anassessment of potential future levels of oil im-ports. Finally, elec tric -po we red a utom ob iles areexamined.
CONCLUSIONS AND COMPARISONSImport Reductions
In the judg me nt of the Office o f Tec hnologyAssessment, increased automobile fuel efficiency,
synthetic fuels production, and reduced station-ary (nontransportation) use of oil can significantlydecrease U.S. dependence on oil imports dur-ing the next two to three decades. indeed, reduc-
ing oil imports as quickly as possible requires that
all three options be pursued. Electric cars areunlikely to play a significant role, however.
Although a precise forecast of the future contri-butions of the import reduction options is not fea-sible now, it is possible to draw some general
conclusions about their likely importance and toestimate what their contributions could be under
spe c ific c irc umsta nc es (see fig. 1).
First, increases in auto fuel efficiency will con-tinue, driven by market demand and foreign
competition. OTA b elieve s tha t, with strong andconsistent demand for high fuel efficiency, there
is a good chance that actual average new-car fueleffic iencies wo uld be greate r than O TA’ s low sc e-nario in which average new-car fuel economy*was projected to be:
30 miles per gallon (mpg) . . . . . . . in 198538 mpg . . . . . . . . . . . . . . . . . . . . ., in 199043 mpg . . . . . . . . . . . . . . . . . . . . ., in 199551 mpg . . . . . . . . . . . . . . . . . . . . . . in 2000
with a moderate shift in demand to smaller cars.Although this scenario is based on modest techni-
cal expectations, it is dependent on favorablemarket conditions. Domestic automakers are un-likely to commit the capital necessary to continue
*EPA values, based on 55 percent city, 45 percent highway. On-the-road fuel economy is expected to average about 10 percent less.
3
8/14/2019 Increased Automobile Fuel Efficiency and Synthetic Fuels: Alternatives for Reducing Oil Imports
http://slidepdf.com/reader/full/increased-automobile-fuel-efficiency-and-synthetic-fuels-alternatives-for 12/292
4 q Increased Automobile Fuel Efficiency and Synthetic Fuels: Alternatives for Reducing Oil /reports
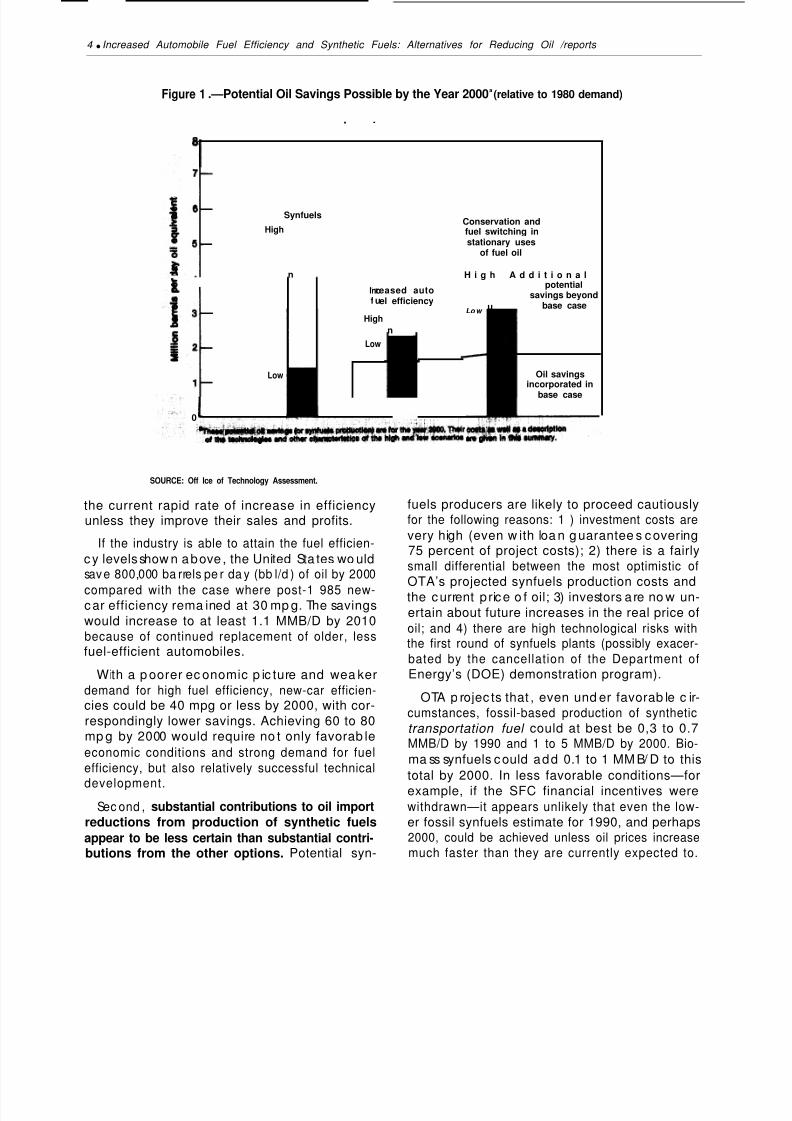
Figure 1 .—Potential Oil Savings Possible by the Year 2000a(relative to 1980 demand)
. .
Synfuels
High
n
Conservation andfuel switching instationary uses
of fuel oil
H i g h A d d i t i o n a l
Incf u
High
Low
‘- reased auto
u
potential
el efficiencysavings beyond
base case
n
Low Oil savingsincorporated in
base case
0
Lo w
SOURCE: Off Ice of Technology Assessment.
the current rapid rate of increase in efficiencyunless they improve their sales and profits.
If the industry is able to attain the fuel efficien-
c y levels show n a bove , the United Sta tes wo uldsave 800,000 ba rrels pe r da y (bb l/d ) of oil by 2000
compared with the case where post-1 985 new-c ar efficiency rema ined at 30 mp g. The savingswould increase to at least 1.1 MMB/D by 2010because of continued replacement of older, lessfuel-efficient automobiles.
With a p oorer ec onomic p ic ture and wea kerdemand for high fuel efficiency, new-car efficien-cies could be 40 mpg or less by 2000, with cor-respondingly lower savings. Achieving 60 to 80mp g by 2000 would require no t only favorab leeconomic conditions and strong demand for fuelefficiency, but also relatively successful technical
development.Sec ond , substantial contributions to oil import
reductions from production of synthetic fuelsappear to be less certain than substantial contri-butions from the other options. Potential syn-
fuels producers are likely to proceed cautiouslyfor the following reasons: 1 ) investment costs are
very high (even w ith loa n g uarantee s c overing75 percent of project costs); 2) there is a fairlysmall differential between the most optimistic ofOTA’s projected synfuels production costs andthe c urrent p ric e o f oil; 3) investors a re no w un-ertain about future increases in the real price ofoil; and 4) there are high technological risks withthe first round of synfuels plants (possibly exacer-bated by the cancellation of the Department ofEnergy’s (DOE) demonstration program).
OTA p rojec ts that , even und er favorab le c ir-cumstances, fossil-based production of synthetic
transportation fuel could at best be 0,3 to 0.7MMB/D by 1990 and 1 to 5 MMB/D by 2000. Bio-
ma ss synfuels c ould add 0.1 to 1 MM B/ D to thistotal by 2000. In less favorable conditions—forexample, if the SFC financial incentives werewithdrawn—it appears unlikely that even the low-er fossil synfuels estimate for 1990, and perhaps2000, could be achieved unless oil prices increasemuch faster than they are currently expected to.

8/14/2019 Increased Automobile Fuel Efficiency and Synthetic Fuels: Alternatives for Reducing Oil Imports
http://slidepdf.com/reader/full/increased-automobile-fuel-efficiency-and-synthetic-fuels-alternatives-for 13/292
Ch. 1—Executive Summary q 5
Ac hieving m uc h mo re tha n 1 MMB/ D of syn-fuels production by 2000 would require fortuitous
tec hnic al succ ess and either: 1 ) unamb iguousec onom ic profitability or 2) c ontinued financialincentives req uiring authoriza tions considerab lylarger than those currently assigned to SFC.Achieving production levels near the upper limits
for 2000 are likely to be de layed, p erhaps by a smuch as a decade, unless there is virtually a “warmobilization’ ’-type effort.
Third, there are likely to be large reductionsin the stationary use of fuel oil (currently 4.4MMB/D) in the next few decades. With just cost-effective conservation measures, stationary fueloil use could be reduced significantly. Additionalconservation measures by users of electricity andnatural gas could make enough of these fuelsavailable to replace the remaining stationary fueloil use by 2000. Total elimination of stationaryfuel oil use by 2000 is unlikely, however, becausesite-specific factors and differing investor paybackrequirements will mean that a significant fractionof the numerous investments needed for elimina-
tion will not be made.
Fourth, even a 20-percent electrification of theauto fleet—a market penetration that must beconsidered improbable within the next severaldecades—is unlikely to save more than about0.2 MMB/D. Electric cars are most likely to re-place small, low-powered–and thus fuel-efficient —conventional automobiles, minimizing poten-
tial oil savings.Plausible projections of domestic oil production
—expec ted by O TA to drop from 10.2 MMB/ Din 1980 to 7 MM B/D or lower by 2000—suggestthat oil imports could still be as high as 4 to 5MM B/D or more by 2000 unless imports are re-duc ed by a sta gna nt U.S. eco nomy o r by a re-sumption of rapidly rising oil prices. * Achievinglow levels of imports-to perhaps less than 2MM B/D within 20 to 25 years–is likely to requirea de gree o f suc c ess in the three ma jor op tionsthat is greater than can be expected as a result
of current policies.
*Rapidly rising oil prices are unlikely to occur simultaneously with
a stagnant U.S. economy unless the economies (and oil import re-quirements) of Europe and others are thriving at the same time.
costs
Except for stationary fuel oil reductions, eco-nomic analysis of the options for reducing oil im-ports involves a comparison of tentative cost esti-ma tes for mostly unproven technologies that will
not be deployed for 5 to 10 years or more. Even
if costs we re p erfec tly estimated for toda y’s mar-ket (and the estimates are far from perfect), dif-ferent rates of inflation in the different economic
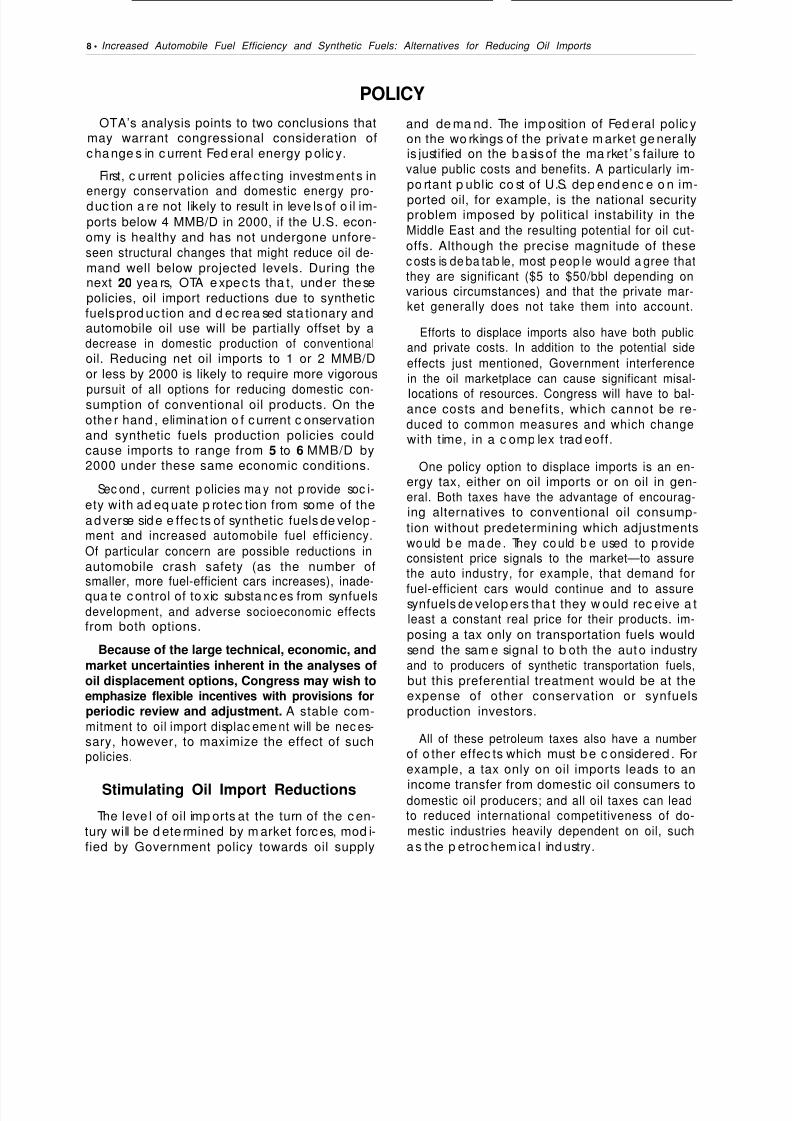
sectors affecting the options could dramaticallyshift the comparative costs by the time technol-ogies are actually deployed. Figure 2 presentsOTA’s estimates for the investment costs for alloptions except electric cars. The costs are ex-pressed in dollars per barrel per day, which is theamount of investment needed to reduce petro-leum use a t a rate of 1 bb l/d . * In OTA’s judgment,
the estimated investment costs (in dollars perbarrel per day) during the 1990’s of automobileefficiency increases, synthetic fuels production,and reduction of stationary uses of oil are essen-tially the same, within reasonable error bounds.If Congress wishes to channel national invest-ments preferentially into one of these options,differentials in estimated investment costs can-not provide a compelling basis for choice.
On the other hand, investments during the1980’s to reduce stationary oil use (from the cur-
rent 4.4 to 3 MM B/D or less by 1990) and in-crease automobile fuel efficiency (to a 35 to 45mpg new-car fleet average by 1990) are likely to
cost less than the 1990-2000 investments in anyof the options.
Electric vehicles are likely to be very expensiveto the c onsume r—c osting p erhap s $3,000 mo reper vehicle than similar, conventional auto-mobiles or $300,000 to $400,000/bbl/d of oilsaved , (The la tter is not stric tly co mp arab le to in-
vestment costs for the other options. ) If batteriesmust be rep lace d a t mo de rate intervals, whic his necessary today, the total costs of electric carswould escalate.
*This measure was chosen in order to avoid problems that arisewhen comparing investments in projects with different lifetimes and
for which future oil savings may be discounted at different rates.

8/14/2019 Increased Automobile Fuel Efficiency and Synthetic Fuels: Alternatives for Reducing Oil Imports
http://slidepdf.com/reader/full/increased-automobile-fuel-efficiency-and-synthetic-fuels-alternatives-for 14/292
6 Increased Automobile Fuel Efficiency and Synthetic Fuels: Alternatives for Reducing Oil Imports
Figure 2.—Estimated Investment Costs for the Oil Import Reduction Options
Increased automobilefuel efficiency
I 45-80 mpgby 2000a
40-65 mpg , ,by 1995a-
Synfuels Reduction in stationaryuses of fuel oil
in the 1990’s
35-50 mpgby 1990a
Estimated 1985 cost ofconventional oil and gas
exploration anddevelopment in the United States
SOURCE: Office of Technology Assessment.
Technological and Economic Risks
The g eneral pe rce ption of the tec hnologica land ec onom ic risks of the imp ort red uc tion op-tions is: 1 ) that the reduction of stationary oil usehas comparatively predictable costs and few tech-nological risks; 2) that synthetic fuels have severeeconomic and technological risks; and 3) that in-creased auto fuel efficiency has moderate eco-nomic and tec hno log ica l risks. OTA’ s ana lysis in-
dic ates that these p ercep tions are c orrec t onlyto a limited extent.
Ž Although the costs and technology of fuelswitching are well known and involve little risk,the success of retrofitting a given building toincrease its energy efficiency often cannot be
q
q
q
accurately predicted because of site-specific
considerations that cannot be adequatelyquantified.
The d ifferenc es in risks betwe en synfue ls devel-opment and increased automobile fuel efficien-
cy are less a matter of overall magnitude thanof timing.Synfuel produc tion involves c onsiderab le tec h-nica l and ec ono mic risks for the first round ofcommercial-scale facilities, but once full-scaleprocess units have been demonstrated the risk
for future plants should drop substantially.Some increases in automobile fuel efficiencycan be implemented with negligible technolog-
ical and small economic risks, but increasesto very high efficiencies do involve significant

8/14/2019 Increased Automobile Fuel Efficiency and Synthetic Fuels: Alternatives for Reducing Oil Imports
http://slidepdf.com/reader/full/increased-automobile-fuel-efficiency-and-synthetic-fuels-alternatives-for 15/292
Ch. l—Executive Summary Ž 7
technical and economic risks. Also, as thenumber and rate of changes in automobiles in-
creases, there is increased risk that consumerswill not accept the automobiles and that insuffi-
cient development and testing will lead to pooron-the-road performance and/or product re-
calls.
Additional Bases for Comparison—Environmental, Social, and
Economic Effects
Increased auto fuel efficiency may reduce ve-hicle safety as cars are made smaller and lighter.But in all but extreme cases of vehicle size reduc-
tion, improvements in vehicle design and in-c reased passeng er use of sa fety restraints havethe p otential to o ffset a ny effec ts of reduc ed sizeand weight on the vehicle’s protection of its oc-
cupants in a crash.Continued pressure for increased fuel efficien-
cy will dictate new plant investments which willreinforce the ongoing restructuring of the U.S.auto industry. This restructuring involves a shiftin manufacturing away from the traditional pro-duc tion c ente rs to the Sun Belt and oversea s, andstronger industry ties with foreign manufacturers.The c om position a nd size of the ma nufac turingwork force may evolve towards a greater propor-
tion of skilled workers but fewer workers overall.Increased sophistication and capital investment
may be required for vehicle maintenance. A re-duction in the number of suppliers to the autoindustry may also result.
Large-scale synthetic fuels production wouldgenerate significant amounts of toxic sub-stances, posing risks of health damage to work-ers and possible risks to the public through con-tamination of ground waters or by smallamounts of toxics left in the fuels. There shouldnot be any technological barrier to adequatecontrol of these substances, but OTA concludesthat there are substantial reasons to be con-cerned about the adequacy both of proposedenvironmental protection systems and of the ex-isting regulatory structure.
Other important effects of synfuels produc-tion stem from the very large scale of both theindividual projects and, potentially, the industryas a whole. These m ay o verwhe lm the soc ial and
ec onom ic resources of nea rby po pulation ce n-ters, especially in sparsely populated areas of theWest. At national production levels of a few mil-lion barrels per day, impacts from coal and shale
mining and population pressures on wildernessareas and other fragile ecosystems can be sub-stantial even in comparison with major industriessuch as coal-fired power generation. On the other
hand , co nventional air pollution p rob lems fromsuch plants are likely to be considerably less than
those associated with similar amounts* of coal-fired power generation.
Finally, although water requirements for syn-fuels are a small fraction of total national con-sumption, growth of a synfuels industry could
either create or intensify competition for water,depending on both regional and local factors.Suc h com petition is of spe c ial conc ern in the a ridWest. Unfortunately, a reliable determination ofboth the cumulative impacts on other water usersand, in some instances, the actual availability ofwa ter for synfuels de velopm ent is prec lude d byphysical and institutional uncertainties, changingpublic attitudes towards water use priorities, andthe analytical shortcomings of existing studies.
However, in areas where there are relativelyfew obstacles to transferring water rights (e.g., as
is currently the case in Colorado), developersshould be ab le to obta in the wa ter they needbecause their consumption per barrel of oil pro-duced is small enough to enable them to pay arelatively high price without significantly affect-ing the final cost of their products.
Electric vehicles, if they are ever produced inlarge quantities, could have an important posi-tive environmental effect-the reduction ofautomobile exhaust emissions and resulting im-provements in urban air quality.
*On a “per unit of coal used” basis.
9a-2 e 1 ~ - a 2 - 2 : I: II J 3
8/14/2019 Increased Automobile Fuel Efficiency and Synthetic Fuels: Alternatives for Reducing Oil Imports
http://slidepdf.com/reader/full/increased-automobile-fuel-efficiency-and-synthetic-fuels-alternatives-for 16/292
8 • Increased Automobile Fuel Efficiency and Synthetic Fuels: Alternatives for Reducing Oil Imports
POLICY
OTA’s analysis points to two conclusions thatmay warrant congressional consideration ofchange s in c urrent Fed eral energy p olic y.
First, c urrent policies affec ting investments in
energy conservation and domestic energy pro-duc tion a re not likely to result in leve ls of o il im-ports below 4 MMB/D in 2000, if the U.S. econ-omy is healthy and has not undergone unfore-seen structural changes that might reduce oil de-mand well below projected levels. During thenext 20 yea rs, OTA expec ts tha t, under thesepolicies, oil import reductions due to syntheticfuels prod uc tion and d ec rea sed sta tionary andautomobile oil use will be partially offset by adecrease in domestic production of conventionaloil. Reducing net oil imports to 1 or 2 MMB/Dor less by 2000 is likely to require more vigorous
pursuit of all options for reducing domestic con-sumption of conventional oil products. On theothe r hand , eliminat ion o f current c onservationand synthetic fuels production policies couldcause imports to range from 5 to 6 MMB/D by2000 under these same economic conditions.
Sec ond , current p olicies ma y not p rovide soc i-
ety with ad eq uate p rotec tion from some of theadverse side e ffec ts of synthetic fuels de velop -ment and increased automobile fuel efficiency.
Of particular concern are possible reductions inautomobile crash safety (as the number ofsmaller, more fuel-efficient cars increases), inade-
qua te c ontrol of toxic substanc es from synfuelsdevelopment, and adverse socioeconomic effectsfrom both options.
Because of the large technical, economic, andmarket uncertainties inherent in the analyses ofoil displacement options, Congress may wish toemphasize flexible incentives with provisions forperiodic review and adjustment. A stable com-mitment to oil import displac eme nt will be nec es-sary, however, to maximize the effect of suchpolicies.
Stimulating Oil Import ReductionsThe leve l of oil imp orts at the turn of the c en-
tury will be d ete rmined by m arket forces, mod i-fied by Government policy towards oil supply
and de ma nd. The imp osition of Fed eral polic yon the wo rkings of the private m arket ge nerallyis justified on the basis of the ma rket ’ s failure tovalue public costs and benefits. A particularly im-po rtant p ublic co st of U.S. dep end enc e o n im-
ported oil, for example, is the national securityproblem imposed by political instability in theMiddle East and the resulting potential for oil cut-offs. Although the precise magnitude of thesec osts is de ba tab le, most p eop le would a gree thatthey are significant ($5 to $50/bbl depending onvarious circumstances) and that the private mar-ket generally does not take them into account.
Efforts to displace imports also have both publicand private costs. In addition to the potential side
effects just mentioned, Government interferencein the oil marketplace can cause significant misal-
Iocations of resources. Congress will have to bal-ance costs and benefits, which cannot be re-duced to common measures and which changewith time, in a c omp lex trad eoff.
One policy option to displace imports is an en-ergy tax, either on oil imports or on oil in gen-eral. Both taxes have the advantage of encourag-ing alternatives to conventional oil consump-tion without predetermining which adjustmentswo uld b e ma de . They co uld b e used to p rovideconsistent price signals to the market—to assurethe auto industry, for example, that demand for
fuel-efficient cars would continue and to assuresynfuels de velop ers tha t they w ould rec eive a tleast a constant real price for their products. im-posing a tax only on transportation fuels wouldsend the sam e signal to b oth the auto industryand to producers of synthetic transportation fuels,
but this preferential treatment would be at theexpense of other conservation or synfuelsproduction investors.
All of these petroleum taxes also have a numberof o ther effec ts which must be c onsidered . Forexample, a tax only on oil imports leads to an
income transfer from domestic oil consumers todomestic oil producers; and all oil taxes can leadto reduced international competitiveness of do-mestic industries heavily dependent on oil, such
as the p etroc hemica l industry.

8/14/2019 Increased Automobile Fuel Efficiency and Synthetic Fuels: Alternatives for Reducing Oil Imports
http://slidepdf.com/reader/full/increased-automobile-fuel-efficiency-and-synthetic-fuels-alternatives-for 17/292
Ch. I—Executive Summary q 9
po lic ies c an a lso b e d irec ted spe c ifica lly at the
auto mo bile o r synfue ls industries. The m ost effec -tive of these options will be those that directlyaddress the factors that shape, direct, and limitthe contributions that the automobile and syn-fuels industries can make to import displacement.
The c ritical fac tors that d etermine the pa c e ofincreased automobile fuel efficiency are con-sumer demand for fuel efficiency and the finan-cial health of the domestic auto industry. If theindustry is uncertain about demand, it will be re-luctant to make the expensive investments. And
with continued poor sales, the industry will beless ab le to afford them.
Aside from ene rgy ta xes, Cong ress c an ma in-tain and stimulate consumer demand for fuel ef-ficiency by a variety of measures that would raise
the rela tive c osts to c onsume rs of o wning ineffi-
cient cars. For example, registration fees (onetime o r annua l) and purcha se ta xes or subsidiesare incentives that can be directly linked to fuel
efficiency. However, fuel-efficiency incentivestha t d o no t d isc rimina te w ith respec t to c a r sizewould tend to increase sales of small cars at theexpense of larger cars. Such discrimination mighthurt domestic manufacturers, which have been
most vulnerable to foreign competition in thesma ll-ca r market.
Cong ress c an also c hoose p olic ies aimed atauto production such as continuing to requiremanufacturers to improve fuel efficiency bymeans of stricter CAFE or similar standards thatwould ensure increased fuel efficiency even if de-
mand for this automobile attribute is low. Thisregulatory route might reduce some risks to auto-makers by requiring all to make similar invest-ments. On the other hand, car sales may sufferif the costs of the fuel savings—either in highersticker prices or reductions in some desirable ve-hicle attributes–are higher than consumers arewilling to pay. Fuel-economy requirements arelikely to be perceived by the industry as exceed-ingly risky unless the requirements are accom-
pa nied by m ea sures to stimulate d ema nd o r toease the resulting financial burden on the auto-makers.
To help ensure that the fuel-efficient cars areactually bought and that the automakers can ac-
quire the capital needed for increasing fuel effi-
ciency, Congress may also wish to directly pro-mote sales of fuel-efficient cars. A low-interest-rate loan program (with interest rates tied to fuel
efficiency) is one potentially effective mechanism.Congress may also wish to consider awarding di-rect grants or loan guarantees for qualifying in-
vestments in auto manufacturing facilities.
The fac tors that d etermine the pa ce of synfuels
development are the high degree of technical un-
ce rtainty and the c ontinuing uncertainty ab outfuture oil prices. Both areas of uncertainty con-tribute to doubts about profits.
Current Federal policy maintains the valuableincentives associated with SFC, but reemphasizesDOE’s research, development, and demonstra-
tion prog rams. The loan g uarantee me c hanismoffe red b y SFC signific antly imp rove s the p rob a-
bility of financial success for a developer andprobably will be necessary to ensure even a fewhundred thousand barrels per day of synfuels pro-
duction by the early 1990’s. Several major risksto synfuels investors remain, however. Cost over-runs couId nuIlify any potential profits becausedevelopers must base their product prices on themarket prices of competing fuels rather than on
synfuels production costs. It is also probable that
several first generation commercial-scale unitswill function p oorly, and rap id expa nsion o f theindustry ma y thereb y be d elayed .
Sinc e the SFC p rog ram ap pe ars to b e a ttrac t-ing the c ap ital needed to b uild and dem onstratea series of first generation commercial-scale pro-duction units, cancellation of DOE’s programsma y not turn out to b e p artic ularly harmful to syn-fuels development if the first plants performwell. However, cancellation of the demonstra-tion p rogram probab ly will mean that fewe r tech-nologies reach the stage where SFC support ispossible. Reemphasis of development programsmay also delay findings that would be useful infixing the technical problems that are likely toa rise in the first c om me rcia l-sc a le units. To he dge
against the possibility of poor operation delay-ing expansion, Congress may wish to support de-
velopment programs intended to demonstrate thetechnical feasibility of a variety of processes andto g ain ba sic knowledge of a nd e xperience with

8/14/2019 Increased Automobile Fuel Efficiency and Synthetic Fuels: Alternatives for Reducing Oil Imports
http://slidepdf.com/reader/full/increased-automobile-fuel-efficiency-and-synthetic-fuels-alternatives-for 18/292
10 q Increased Automobile Fuel Efficiency and Synthetic Fuels: Alternatives for Reducing Oil Imports
these processes. Although these demonstrationprog ram s supp ort sec ond and third g ene rationprocesses, they w ill also p rovide eng ineering in-formation that may be useful for correcting tech-nical faults and reliability problems that may arisein first generation plants.
Dealing With Other EffectsAn important e ffect of increa sing autom ob ile
fuel efficiency is the potential for decreased auto-motive safety due to size and weight reduction.There ma y also b e m ajor emp loyment-relatedside effects associated with the restructuring ofthe auto industry and the accompanying acceler-
ated rates of capital investment by the industry.There a re familiar policy instruments that c an d ea lwith both of these effects. For the safety effects,Congress can choose among safety standards fornew cars, educational programs, and support of
sa fety R&D. Emp loyment effec ts ma y be e asedby minimizing plant relocations (through taxbreaks or direct assistance to the industry), or by
am eliorating the effects of em ployment reduc -tions through aid to c omm unities and affec tedworkers and other individuals.
potential environmental and worker-relatedproblems associated with synfuels developmentare substantial, and there is c ause fo r co nc ernab out the ad eq uac y of future reg ulation of thesynfuels industry. The Government can help to
assure that the private sector takes account ofthese prob lems. Spe c ific area s wo rthy of cong res-
sional attention include: the environmental re-sea rc h a nd reg ulatory prog ram s of t he Environ-mental Protection Agency (EPA), DOE, the Officeof Surfac e Mining, a nd the O cc upa tional Safetyand Health Administration, in light of recent
budget cuts and changes in program direction;the dismantling of DOE’s demonstration programfor synfuels technologies; and the progress of SFCin demanding appropriate consideration of siting,monitoring, pollution controls and occupationalsafety as a condition for financial assistance. Con-
gressional options range from holding oversighthearings to increasing the resources of the envi-ronmental regulatory agencies and shifting theirprog ram em pha ses by leg islation.
To mitiga te the soc ioeconomic e ffec ts on com-
munities from synfuels development, Congressmay wish to consider several forms of growthmanagement assistance, including loan guaran-
tees, grants, and technical assistance. Any newFederal initiatives in this area will be complicated,
however, by continuing arguments about relative
responsibilities of Federal, State, and local govern-ments and private industry. And new initiativesneed to be sensitive to the substantial differencesfrom location to location in the severity of im-pacts and the resources already available for miti-
gation.
OVERVIEW OF
Increased Automobile Fuel
Automo bile fuel effic ienc y ca n
THE IMPORT REDUCTION OPTIONS
Efficiency Projections of Fuel Economy
be increased Future oil savings from increased automobile
throug h a variety o f me asures, inc luding: fuel efficiency depend, first, on the magnitudeand character of future auto sales. In the past few
q
q
q
q
q
q
q
reductions in vehicle weight;improvements in conventional engines,transmissions, and lubricants;be tter c ontrol of engine ope rating pa ram -eters;
new engine and transmission designs;reduced aerodynamic drag;improvements in accessories; anddec reases in rolling resistanc e.
years, consumer preferences for such fuel-econ-omy-related characteristics as vehicle size andperformance have fluctuated while new car saleshave d rop pe d signific ant ly. Both the long-termsales average and consumer preference for fuel
efficiency will be critical determinants of the rateof p enetration o f fuel effic ienc y tec hnolog y.
Second, in response to changing consumerpreferences and foreign competition, the rate of

8/14/2019 Increased Automobile Fuel Efficiency and Synthetic Fuels: Alternatives for Reducing Oil Imports
http://slidepdf.com/reader/full/increased-automobile-fuel-efficiency-and-synthetic-fuels-alternatives-for 19/292
Ch. I—Executive Summary 11
change of vehicle technology has accelerated andold rules about how long it takes to put a newtec hnology into p lac e* a re no longer valid. Thepresent rapid rate of replacement of capital equip-ment puts a great strain on the do mestic a uto in-dustry. During the next several years, competitive
forces will push toward continued rapid techno-logical change, but the financial weakness of the
domestic auto industry will pull toward slowertec hnologica l cha nge . The strength of future for-eign c omp etition a nd co nsumer percep tions ofthe future price and availability of gasoline anddiesel fuel, among other factors, will influencethe balance of these opposing forces, and, conse-
quently, whether rapid increases in fuel efficiencyof domestically produced cars continue.
Third, t he efficienc y increa ses are not fully p re-dicta ble. There ca n be d iscrepanc ies be tween test
resuIts and the results obtained in actual use.Tec hnic al c omp rom ises that affec t ultima te p er-formance have to be made to allow better inte-gration with existing equipment, easier andcheaper production and assembly, and resistance
to extreme operating conditions and incorrectma intenance proced ures. Developm ent p rob-lems are not always solved satisfactorily; suchproblems could occur more frequently if techno-logical change accelerates.
OTA deve lope d p rojec tions (tab le 1) of plausi-ble ranges of average new-car fuel economy
based on varying expectations of the relative de-mand for different-sized cars and the effectivenessand rate of development and introduction of new
fuel-economy improvements. As reflected inthese projections, both technology and vehiclesize are critical factors for future fuel savings. Mar-ketplac e unc ertainty is reflecte d even a s ea rly asthe 1985 projections—manufacturers’ plans andthe technology are already established, but the
*For example, previous assumptions were: 5 years to move frominitial production decision to introduction of a technology in amodel line; 5 to 10 years to diffuse the technology throughout the
new car fleet; and 10 to 15 years of production to pay for the invest-ment. The estimate of 5 years to move from initial production deci-sion to introduction may now be a bit too low, while increasedrate of change of vehicle technology would necessarily reduce theother two estimates.
Table 1 .- Projected Average New-Car FuelEconomy,a1985.2000 (mpg)
1985 1990 1995 2000
No further shift towards smallercars beyond 1985 . . . . . . . . . . 30-34 36-45 39-5443-62
Moderate further shift tosmaller cars . . . . . . . . . . . . . . . 30-34 38-48 43-5951-70
Rapid shift to small cars . . . . . . 33-37 43-53 49-6558-78aBased on EPA city/highway (55/45 percent) cycle. Each of the mileage ranges(e g., 3034) reflects relative expectations of the performance and rate of develop-ment and deployment of new technologies. The lower value represents OTA’S
“low estimate” scenario, the upper value represents a “high estimate” scenario.
SOURCE: Office of Technology Assessment
Note on Table 1: Can We Do Better?
The projections in table 1 do not represent the t ec lmo /og i ca / limitof what could be achieved in this century. The most efficient auto-mobiles in each size class are likely to achieve considerably betterfuel economy than the average; for example, technologies are avail-able that probably can allow a new-car fleet average of 60 mpg by themid-1990’s with the same mix of vehicle sizes as today’s and adequatevehicle performance (compared with the table’s 1995 “same size mix”projection of 39 to 54 mpg). This ignores co nsume r preferenc es for veh ic /e features that cor) f / i c t with fue l economy maximization, how- ever. By the same argument, the 1981 new-car fleet average COUM have been 33 mpg if consumers had consistently chosen the most efficient
vehicle in each of the nine EPA size classes and producers had beenable to meet the demand. Instead, the actual 1981 model average toJanuary 1981 was 25 mpg.
Interestingly enough, if consumers had chosen only the most fuel-
efficient gasoline-powered automobiles in each size class, over 90percent of the vehicles would have been U, S.-manufactured cars orcaptive imports. The market problems of U.S. manufacturers in 1981cannot be traced primarily to an inability of U.S. manufacturers to pro-duce fuel-efficient cars, but depend on factors such as differencesin perceived value between American and imported automobiles.
The difference between average fuel efficiency, which is a func-tion of consumer preference, and potential fuel efficiency, whichassumes that every car in the fleet embodies the most fuel-efficientchoice of technologies available, is critical to understanding whyOTA’S projections may differ from other projections that apply a sin-gle choice of technologies to the entire fleet. The latter assumptionis realistic only if future consumers value fuel economy, relative toother automobile attributes, much higher than they do today.
projec tions still range from 30 to 37 mpg* (c om-pared to the 1981 level of 25 mpg).
How m uch fuel can b e saved by improved fueleconomy? Assuming 30 mpg as a base and using
the projections in table 1, continued develop-ments in automobile fuel efficiency could save0.6 to 1.3 MMB/D of oil by 2000. The lowervalue represents pessimistic expectations aboutthe advance of automobile technology and theshift towards smaller cars; the higher value repre-sents optimistic technological expectations and
continued substantial shifts to small cars. Contin-
* Based on a weighted average of 55 percent EPA city test cycleand 45 percent EPA highway cycle, the formula used to measurecompliance with currently mandated CAFE requirements.

8/14/2019 Increased Automobile Fuel Efficiency and Synthetic Fuels: Alternatives for Reducing Oil Imports
http://slidepdf.com/reader/full/increased-automobile-fuel-efficiency-and-synthetic-fuels-alternatives-for 20/292
12 q Increased Automobile Fuel Efficiency and Synthetic Fuels: Alternatives for Reducing Oil Imports
ued diffusion of these technologies into theoverall fleet could save 0.8 to 1.7 MMB/D by2010 with no further technological advances be-
yond 2000. *
costs
OTA’ s c ost a na lysis of auto fuel-efficienc y im-provements concentrates on investment costs in
total d olla rs as we ll as dolla rs per ba rrel pe r da yof oil saved. Estimates of the costs for associatedtechnology and product development are in-cluded in the investment costs,** because they
are part of the normal outlays needed to put anynew vehicle in production and represent a sizablefraction of the fixed costs (i.e., costs independent
of production levels).
It is not possible to ma ke highly ac c urate esti-mates of the investment costs (per barrel per day
of o il save d), d ue to the unc ertainty assoc iatedwith predic ting ac tual effic ienc y inc rea ses thatwill be achieved. In addition, the cost of develop-ing technologies to the point where they can be
reliably mass-produced has been highly variable
and is difficult to predict.
Accurate cost estimation also is complicated bythe difficuIty of separating the cost of increasingfuel efficiency from the other costs of doing busi-ness. Increases in fuel efficiency are inextricablyintertwined with other changes in the car. For ex-
ample, the engine redesign for fuel efficiency may
incorporate other changes, to improve otherauto mob ile attribute s, at little ad ditional co st. De-sign changes that increase efficiency may improve
or d eg rad e o ther a ttribu tes suc h a s em issions orperformance.
If it is the industry’s judgme nt that c onsume rsdo value fuel efficiency, the normal cycle of cap-
ital turnover and vehicle improvement would re-
sult in an increase in fuel efficiency automatical-ly. Unfortunately, the “ normal” rate o f fuel effi-ciency increase is not really predictable because
*Assuming 1.26 trillion vehicle miles (automobile only) traveledannually in 2000, 1.31 trillion in 2010, and an on-the-road fuel ef-ficiency 10 percent less than EPA rated fuel efficiency.
**In this context, development means all of the engineering activ-ities needed to prove a design concept and determine how it canbest be integrated into the vehicle system and mass-produced.
it depends on marketplace preferences and cor-porate strategies.
Because of the difficulty of separating out themarginal fuel efficiency investments from the“normal” investments, OTA’s investment costestima tes (in dollars per ba rrel pe r day) in tab le
2 are the total investments (including develop-me nt c osts) allocated to increasing fuel efficien-cy, divided by the total fuel savings rate expected.
(See footnote c of ta ble 2 for the d eta ils of thec ost a l loc at ion.) These investme nt rates ma y besome wha t lower than the m arginal rates wo uldbe be c ause, in designing their “ normal” invest-ment programs, manufacturers probably will se-lect those investments with the highest potential
payoff in efficiency increase per dollars spent.
In any c ase, the rang e o f investment rates forincreased fuel efficiency for each time period
overlap the rates for investments in synfuels plants(see Synthetic Fuel section below), although the1985-90 fuel-efficiency rates would be lower than
the synfuels rates if widespread expectations foroverruns in early synfuels investments are provedcorrect,
The total domestic capital investment associ-ated with increased fuel efficiency would beabout $25 billion to $70 billion between 1985 and2000, or less than $2 billion to $5 billion annu-ally during the period. This level of investmentcan be compared with recent and projected capi-
tal investment by the industry* remembering thatpa rt of the fuel-effic iency investment c ould b e in-
cluded in “normal” capital expenditures if con-sumer d ema nd for fuel efficiency is high enoug h.For the period 1968-77, annual capital investmentby General Motors (GM), Ford, and Chrysler aver-aged $6.68 billion in constant 1980 dollars. In-vestments by these companies rose to $10.4 bil-
lion in 1979 and $10.8 billion in 1980, and areprojec ted by som e a na lysts to rise to $12 billionper year during 1980-84. The ability of thedomestic industry to maintain their expectedschedule of capital expenditures is dependent on
*The two sets of figures are not fully analogous. A portion of thedomestic industry’s costs are for overseas investments, while a por-
tion of the 1985-2000 fuel efficiency costs will be borne by outsidesuppliers rather than the major manufacturers.
8/14/2019 Increased Automobile Fuel Efficiency and Synthetic Fuels: Alternatives for Reducing Oil Imports
http://slidepdf.com/reader/full/increased-automobile-fuel-efficiency-and-synthetic-fuels-alternatives-for 21/292
Ch. I—Executive Summary q 1 3
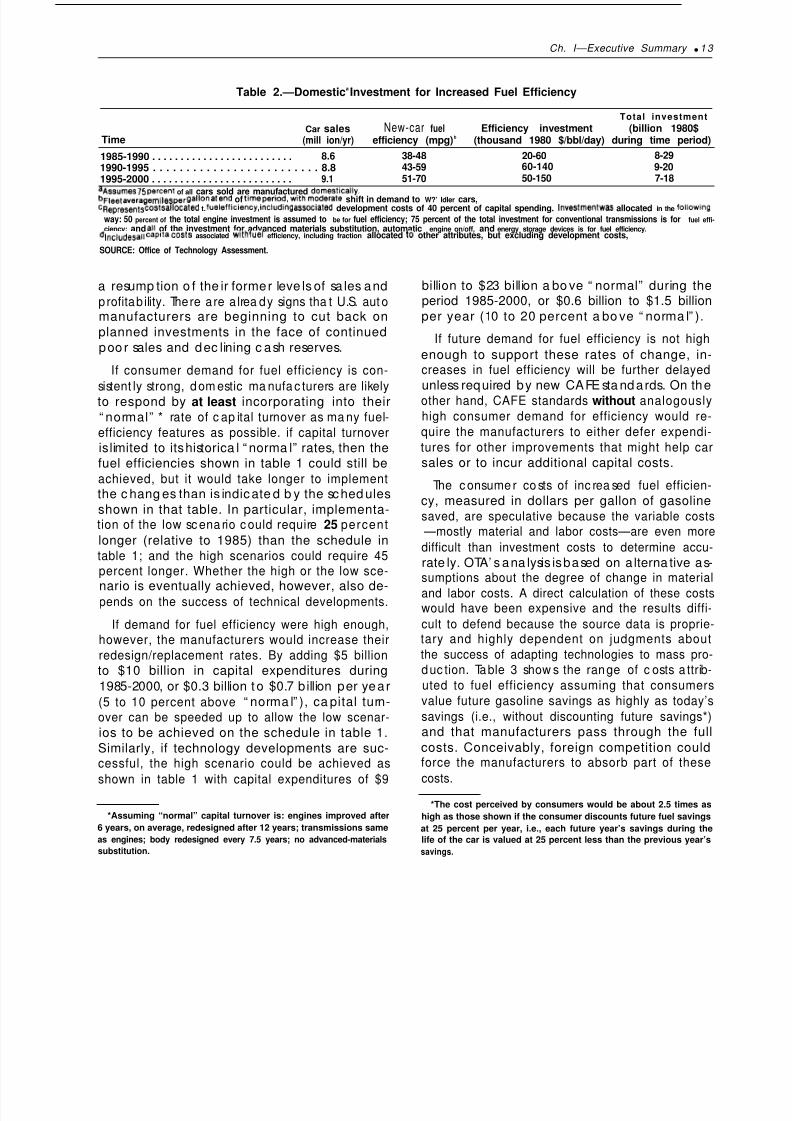
Table 2.—Domestica Investment for Increased Fuel Efficiency
Total investmentCar sales New-car fuel Efficiency investment (billion 1980$
Time (mill ion/yr) efficiency (mpg)b (thousand 1980 $/bbl/day) during time period)
1985-1990 . . . . . . . . . . . . . . . . . . . . . . . . . 8.6 38-48 20-60 8-291990-1995 . . . . . . . . . . . . . . . . . . . . . . . . . 8.8 43-59 60-140 9-201995-2000 . . . . . . . . . . . . . . . . . . . . . . . . . 9.1 51-70 50-150 7-18
aASSUrneS 75 percent of all cars sold are manufactured domestically.
bFleet average m~les per gallon at end of time per iod, wi th mode ra t e shift in demand to W?’ Idler cars,CRepresents costs allocated t. fuel efficiency, including associated development costs of 40 percent of capital spending. lnVW3tm(3nt WaS allocated in the fOliOWing
way: 50 percent of the total engine investment is assumed to be for fuel efficiency; 75 percent of the total investment for conventional transmissions is for fuel effi-
ciency; and all of the investment for advanced materials substitution, automatic engine on/off, and energy storage devices is for fuel efficiency.dlncludes all capital costs associated with fuel efficiency, including fraction allocated tO other attributes, but excluding development costs,
SOURCE: Office of Technology Assessment.
a resump tion o f the ir former leve ls of sa les andp rofitab ility. There are a lrea dy signs tha t U.S. aut omanufacturers are beginning to cut back onplanned investments in the face of continuedpoo r sales and dec lining c ash reserves.
If consumer demand for fuel efficiency is con-
sistent ly strong, dom estic ma nufa c turers are likelyto respond by at least incorporating into their“ normal” * rate of c ap ital turnover as ma ny fuel-efficiency features as possible. if capital turnoveris limited to its historica l “ norma l” rates, then thefuel efficiencies shown in table 1 could still beachieved, but it would take longer to implementthe c hang es than is indic ate d b y the sc hed ulesshown in that table. In particular, implementa-tion of the low sc ena rio c ould require 25 percent
longer (relative to 1985) than the schedule intable 1; and the high scenarios could require 45percent longer. Whether the high or the low sce-
nario is eventually achieved, however, also de-pends on the success of technical developments.
If demand for fuel efficiency were high enough,however, the manufacturers would increase theirredesign/replacement rates. By adding $5 billionto $10 billion in capital expenditures during1985-2000, or $0.3 billion to $0.7 b illion per year(5 to 10 percent above “ norma l” ), ca pital turn-over can be speeded up to allow the low scenar-
ios to be achieved on the schedule in table 1.Similarly, if technology developments are suc-cessful, the high scenario could be achieved as
shown in table 1 with capital expenditures of $9
*Assuming “normal” capital turnover is: engines improved after6 years, on average, redesigned after 12 years; transmissions sameas engines; body redesigned every 7.5 years; no advanced-materials
substitution.
billion to $23 billion a bo ve “ normal” during theperiod 1985-2000, or $0.6 billion to $1.5 billionper year (10 to 20 percent a bo ve “ norma l” ).
If future demand for fuel efficiency is not high
enough to support these rates of change, in-creases in fuel efficiency will be further delayedunless required by new CAFE sta nd ards. On theother hand, CAFE standards without analogouslyhigh consumer demand for efficiency would re-quire the manufacturers to either defer expendi-tures for other improvements that might help carsales or to incur additional capital costs.
The c onsume r co sts of inc rea sed fuel efficien-cy, measured in dollars per gallon of gasolinesaved, are speculative because the variable costs
—mostly material and labor costs—are even more
difficult than investment costs to determine accu-
rate ly. OTA’ s ana lysis is based on a lterna tive as-sumptions about the degree of change in material
and labor costs. A direct calculation of these costswould have been expensive and the results diffi-
cult to defend because the source data is proprie-tary and highly dependent on judgments aboutthe success of adapting technologies to mass pro-duc tion. Table 3 show s the range of c osts a ttrib-uted to fuel efficiency assuming that consumersvalue future gasoline savings as highly as today’s
savings (i.e., without discounting future savings*)and that manufacturers pass through the fullcosts. Conceivably, foreign competition couldforce the manufacturers to absorb part of these
costs.
*The cost perceived by consumers would be about 2.5 times ashigh as those shown if the consumer discounts future fuel savingsat 25 percent per year, i.e., each future year’s savings during thelife of the car is valued at 25 percent less than the previous year’ssavings.

8/14/2019 Increased Automobile Fuel Efficiency and Synthetic Fuels: Alternatives for Reducing Oil Imports
http://slidepdf.com/reader/full/increased-automobile-fuel-efficiency-and-synthetic-fuels-alternatives-for 22/292
14 . Increased Autobile Fuel Efficiency and Synthetic Fuels: Alternatives for Reducing Oil Imports
Table 3.—Consumer Costs for Increased Automobile Fuel Efficiency, WithoutDiscounting Future Fuel Savings, Moderate Shift to Smaller Cars
Average new-car fuel Consumer costa ($/gal saved)
efficiency at end of No variable cost High variableTime period time period (mpg) increase costb increase
1985-1990 . . . . . . . . . . . . . . . . . . . . 38-48 0.15-0.40 0.40-1.101990-1995 . . . . . . . . . . . . . . . . . . . . 43-59 0.35-0.85 1.10-2.60
1995-2000 . . . . . . . . . . . . . . . . . . . . 51-70 0.30-0.95 0.90-2.80aA~~Urn~~ a ~aPltal recovew factor per year of 0,15 times the capital investment allocated to fuel efficiencybAssumes variable cost increas~ IS twice the capital charges associated with the capital investments allocated tO fuel efficiency.
SOURCE: Office of Technology Assessment.
The consumer costs of fuel efficiency rangefrom values that are easily competitive with to-day’s gasoline prices to values that are consider-ably higher, dep ending on the efficiency ga insactually achieved, the success of developing pro-duction techniques that can hold down variablecost increases, and the value consumers placeon future fuel savings. Investments for increased
efficiency for the 1990-2000 model years will lookparticularly risky if the current soft petroleummarket continues for a few more years, or if automanufacturers have difficuIty holding down theirlabor and materials costs.
Another important measure of the cost to con-
sumers of increased fuel efficiency is the increasein the pric e of ne w c ars req uired to rec over theindustry’s increased production costs. If themarket demand for fuel efficiency is strongenough to ensure that as much as possible of thecapital investment for fuel efficiency increases is
incorporated into the normal capital turnover,and if the variable costs of production can be held
c onstant, then the c ost* of ac hieving OTA’ s fuel-efficiency scenarios can be as low as $60 to $130per car during the 1985-2000 time period. Underthese conditions, an average of 35 to 45 mpgcould be achieved by 1990 without increasingnew-car costs.
If ac tual ma rket dem and for fuel effic ienc y isnot this high, automakers would be unlikely toincorporate a very high level of fuel efficiency in-
vestments into their normal capital turnover. Also,
the va riable c osts of p rod uct ion are likely to risesomew hat. The “ uppe r bound” for ad ded c osts —assuming large increases in variable costs and
*Assumes a capital recovery factor of 0.15.
no market-driven investme nt for fuel efficienc yincreases beyond 1985—is $800 to $2,300 per carduring the 1985-2000 period, and $250 to $500pe r ca r to ac hieve 35 to 45 mp g b y 1990. There-fore, the cost per car of increased fuel efficiencybeyond 1985 ranges from “clearly competitive”to “probably unacceptable. ”
Economic Impacts
The domestic automobile industry is in themidst of a massive investment program aimed atimproving the competitiveness of American auto-
mo biles. These expe nd itures are a ssoc iated with
important structural changes in the industry; andaccelerating the rate of capital turnover (for in-c rea sed fuel effic iency o r other rea sons) ma y ac -
celerate some of these trends.
Manufacturers are closing older, inefficientplants and building new ones that incorporate
extensive use of robots and other labor-savingtec hnology to inc rea se p rod uct ivity. For a num-be r of reasons, inc luding lowe r lab or and otherc osts, many of the new fac ilities ma y be built inthe Nation’s Sun Belt or overseas rather than inthe current North-Central auto manufacturingcenters, although recent labor concessions mayc hange this pic ture. Bec ause o f a shift in U.S. de -mand to smaller cars, which can be marketedmore universally, the incentive to produce in the
United States is diminishing. Finally, because rap-id c apita l turnove r is raising p roduc tion c osts a ta time when consumer demand for automobiles
has been sluggish, manufacturer profits havediminished and it ha s be c om e ha rde r for the firmsto secure capital at affordable costs.
American companies are forging more exten-sive ties with foreign manufacturers to design,

8/14/2019 Increased Automobile Fuel Efficiency and Synthetic Fuels: Alternatives for Reducing Oil Imports
http://slidepdf.com/reader/full/increased-automobile-fuel-efficiency-and-synthetic-fuels-alternatives-for 23/292
Ch. l—Executive Summary q 1 5
produce, and market fuel-efficient cars, and aremoving towards producing more nearly standard-ized automobiles that can compete in internation-
al markets. Current trends seem to be toward few-
er separate automotive manufacturing and supplyfirms worldwide; only GM and Ford appear tobe reasonably certain of remaining predominant-
ly American-owned.
Certain regions such as the industrial Midwest —and the Nation as a whole—will lose jobs ifthese structural changes continue. Job losses also
would occur, however, if the process is inter-rupted, because the restructuring represents theindustry’s response to the conditions that causedits present market problems, and it clearly isaimed at regaining sales.
Social Impacts
As auto manufacturing and supply activities be-co me m ore efficient and autom ated , there willbe important changes in the workplace environ-ment. Robots and other automated equipmentwill increasingly be used for the more routine and
dangerous jobs, and skilled workers such as engi-
neers and maintenance technicians should be-come a greater percentage of the smaller totalwo rk force . Shifting ma nufa c turing ove rsea s willred uc e U.S. emp loyme nt in p rima ry m anufa c tur-ing as well as in supplier companies. Althoughemployment losses may be larger in the supplierindustries, the effects in these industries will be
distributed over a larger geographical area. Em-ployment in related activities such as repair and
service will cha nge to a cc omm od ate the newauto characteristics—e.g., repairs of plastic bodycomponents require adhesives, not welding—andthe increasing sophistication and capital invest-ment required for vehicle maintenance will placenew de ma nds on shop s and de alers.
Fuel efficiency increases also affect automobile
ow ners by c hang ing the p hysic al a ttributes of the
vehicle and the ec onom ics of ow ning c ars. Forexample, a continued reduction in car size could
lead to increasing use of rentals for longer tripsor for occasional requirements for increased car-go-carrying capacity. Increases in the initial cost
of b uying a ca r are likely to lead to a co ntinua-tion of current trends of keeping cars longer,
resulting in a slower growth or reduction in new-car sales.
Environment, Health, and Safety
Increasing automobile fuel efficiency appearslikely to have a relatively benign effect on the nat-
ural environment and public health, becausemost of the efficiency measures have few adverse
effects on auto emissions, emissions associatedwith vehicle manufacturing, etc. An important ex-
ception may be any shift to widespread use ofdiesel engines, which could cause problems withvehicle particulate and nitrogen oxide (NO X)emissions. Also, the increased production of light-
weight materials—particularly aluminum—maycause additional impacts, such as increasedenergy consumption in processing and increasedde ma nd for ba uxite. On the o ther hand , signifi-c ant do wnsizing o f auto mo biles c ould a llow ei-
ther lower vehicle emissions or lower controlcosts to maintain current emission levels.
In contrast to their expected small effect on pol-
lution levels, fuel conservation measures thatstress reducing vehicle size may have a signifi-c an t a dverse e ffec t on vehic le sa fety. This is be-
cause of the important role in crash survivalplayed by “crush space”* and other size- andweight-related factors. Even a relatively small de-
c line in vehicle safe ty c ould c ause hund red s oreven thousands of additional deaths and seriousinjuries per year.
There is no w idely ac c ep ted estimate of thema gnitude of t his effec t. The Na tional Highw ayTraffic Safety Administration has projected a10,000 per year increase in traffic deaths fromvehicle size reductions by 1990, but this is basedon a limited data set and a number of simplifyingassumptions. And a net increase in traffic deathsis not inevitable, since increased usage of passen-ger restraints and improvements in vehicle design
could more than offset the effect of moderate sizereductions.
*With a smaller “crush space” (thus, more rapid deceJerat;on
of occupants in a crash), factors such as seatbelt and shoulder re-straint usage, better driver training and traffic control, and othersafety measures, become more important determinants of trafficsafety.

8/14/2019 Increased Automobile Fuel Efficiency and Synthetic Fuels: Alternatives for Reducing Oil Imports
http://slidepdf.com/reader/full/increased-automobile-fuel-efficiency-and-synthetic-fuels-alternatives-for 24/292
16 q Increased Automobile Fuel Efficiency and Synthetic Fuels: Alternatives for Reducing Oil Imports
Synthetic Fuels
Production of a variety of fossil fuel-based syn-thetic fuels is planned or under development.
q Oil shale can be heated to release a liquidhydrocarbon material contained in the shale.After further upg rad ing a synthetic crude oilsimilar to high-quality natural crude oil can beproduc ed . This c an be refined into ga soline,diesel and jet fuels, fuel oils, and other prod -ucts.
q Coal can be partially burned in the presenceof steam to produce a so-called “synthesis” gasof carbon monoxide and hydrogen, fromwhich gasoline, methanol, diesel and jet fuel,and other liquid fuel products (“indirect lique-faction” ) or synthetic natural gas (SNG) c a nbe produced.
q
Coal also can be reacted directly with hydro-gen (which is itself generated from a reaction
of steam and coal) to produce a syntheticcrude oil (“ d irec t liquefa c tion” ). This oil c anbe c onverted to gasoline, jet fuel and otherproducts in specially equipped refineries.
Projection of Synfuels Development
The p rinc ipa l technica l deterrent to rap id d e-ploym ent of a synfuels industry is the lac k of p rov-en commercial-scale synfuels processes in theUnited States. Shale oil, indirect coal liquefaction,and SNG processes currently are sufficiently de-veloped that the demonstration of commercial-scale process units or modules is being pursued,but these first units are likely to require consider-
able modification before they can operate satis-factorily. Once these commercial-scale moduleshave been adequately demonstrated, full-sizec omme rc ial fac ilities c an b e c onstruc ted (fromseveral modules). in contrast, direct coal liquefac-
tion requires further development before com-me rc ialization a nd proba bly will not c ontributesignificantly to the synfuels industry before themid to late 1990’s. A ma jor tec hnic al ob stac le,the ha nd ling of high levels of solids in the p roc -ess streams, is not now und erstoo d we ll eno ughto allow developers to move directly to commer-cial- from small-scale units now in operation.
Normal planning, permitting, and constructionma y ta ke 7 to 8 yea rs for a la rge synfuels p lant,with the last 5 years or so devoted to construc-tion. Consequently, a first round of commercial-scale plants conceivably could be operating bythe late 1980’s, although these w ould b e quitevulnerable to delays and cost overruns. Beginning
a sec ond round of c onstruc tion be fore the firstset of plants has been fully demonstrated wouldrisk additional costly revisions and delays.
In addition to scheduling constraints caused by
technological readiness, shortages of experiencedmanpower (primarily chemical engineers andprojec t ma nage rs) c ould co nstrain the pa ce ofsynfuels development. On the other hand, prob-lems stemming from shortages of skilled crafts-men, construction materials, or specializedequipment probably can be averted because ofthe long Ieadtime before they are needed in large
numbers. However, some metals needed for cer-ta in stee l alloys a re ob ta ined almo st e xclusivelyfrom foreign sources.
Many variables affect the rate of development,and predictions are extremely speculative. It isOTA’ s judg me nt tha t under favorable circum-stances, fossil fuel-based production of synthetictransportation fuels could be 0.3 to 0.7 MMB/Dby 1990, growing to 1 to 5 MMB/D by 2000,de pe nding o n the succ ess of t he first round ofsynfuels plants and the fraction of those plantsthat produce transportation fuels as opposed to
fuel gases or fuel oils. Achievement of 0.3 MMB/Dby 1990 assume s tha t a sizab le c om me rcializa -tion program, such as that being pursued by the
Synthetic Fuels Corp., is c arried out, but tha ttechnical problems limit total production; 0.7MMB/D would require an increased number ofplant commitments within the next year or so,a virtually complete emphasis on liquid transpor-tation fuels, and a high level of tec hnic al succ esswith the first plants.
It must be stressed that even the “low” 0.3MMB/D production level maybe considered asoptimistic in light of c urrent e xpe c tat ions of a tleast short-term stability in oil prices, as well asremaining technical and environmental uncer-tainties. In addition, the dismantling of DOE’sdemonstration program may increase the per-ceived and actual technological risks of synfuels

8/14/2019 Increased Automobile Fuel Efficiency and Synthetic Fuels: Alternatives for Reducing Oil Imports
http://slidepdf.com/reader/full/increased-automobile-fuel-efficiency-and-synthetic-fuels-alternatives-for 25/292
Ch. l—Executive Summary q 1 7
development. Thus, the goals of the NationalSynfuels Production Program, created by Con-gress in 1980—0.5 MMB/D by 1987 and 2MMB/D by 1992—appear unattainable withouta crash program that would involve extraordi-nary technical and economic risks and exten-
sive Government intervention.
costs
The costs of synfuels are uncertain. First, thefac tors that limit rapid de ployment of the industrya lso a ffec t its c osts. Tec hnica l unce rtainties c om -
plicate cost evaluation, and long shakedowntimes and potential construction delays would bevery expensive at prevailing interest rates. Sec-ond, synfuels’ relatively high capital costs meanthat their total costs are especially sensitive to thetype of financing used, the level of interest rates,
and the rate of return req uired by the investo rs.The p resent high level of unc ertainty in c ap italmarkets therefore translates into a high level ofc ost unc ertainty. In a dd ition, the long c onstruc -tion t imes assoc iated with synfuels p lants makethem vulnerable to hyperinflat ion. *
OTA ha s p rojected synthet ic fue l co sts ba sedon the best available cost estimates in the publicliterature and OTA’s previous oil shale study.1
These sources indicate that, if the potential forcost overruns is not considered, the capital invest-ment (in 1980 dollars) for a 50,000 bbl/d (ratedcapacity) synthetic fuels plant will range from $2.1
b illion to $3.3 billion, or $47,000 to $73,000/b b l/dof p rod uc tion (assuming the p Iant prod uce s at90 pe rc ent of rated da ily c ap ac ity). Tota l plantinvestments for a 5 MMB/D synfuels industrywo uld thus be a bout $250 b illion to $400 b illion.Based on past experience, however, there is avery high probability that final costs will begreater than these ranges.
For examp le, an extrap olation from rec ent c ost
overruns in the chemical industry widens the sin-gle plant (50,000 bbl/d) range to $2.3 billion to
“Hyperinflation in construction costs of major capital projectsis a relatively recent phenomenon, however, and some industryanalysts consider it a temporary aberration.
1 U.S. Congress, Office of Technology Assessment, An Assessmentof Oi/ Sha/e Technologies, OTA-M-1 18 (Washington, D. C.: U.S.Government Printing Office, June 1980).
$4.7 billion (excluding direct liquefaction, forwhic h c ost e stima tes are less reliab le), or ab out$50,000 to $110,000/ bb l/d . Othe r related invest-ments (e.g., coal mining) raise the total to $50,000
to $125,000/ bb l/d . The investme nt c osts per bar-rel per day of production may be further inflated
by performance levels below the 90-percent de-sign factor, although presumably this will be aproblem only with first generation plants.
The actual selling price of synthetic fuels willbe determined in the marketplace by the pricesof competing fuels regardless of the costs of pro-duction. Using the projected synfuels productioncosts, however, OTA calculated the price thatservice stations would have to charge in orderfor the synfuels producer to attain a required re-
turn on investment. Table 4 displays these“prices” for a few alternative combinations of fi-nancing and real* return on investment.
Based on these estimates, it is clear that com-panies that must bear the full investment burdenof a new synfuels plant are unlikely to invest insynthetic fuels production unless: 1) they viewthis investment as one of low risk and worthyof a low expected return on investment, 2) theyexpect fuel prices to rise very sharply in the fu-ture, or 3) they are willing to take a loss or lowreturn to secure an early market share. The firstalternative is not credible for the first genera-tion of commercial plants.
With the large (75 percent of project costs)loan guarantees that are possible under the En-
*The real rate of return is the nominal rate of return minus theinflation rate.
Table 4.—Price of Synthetic Fuels Required ToSustain Production Costsa (1980 $/gal of
gasoline equivalent)
Real returnPrice (pretax) Financing equity investment
$0.80-$1 .10... 100% equity 50/0$1.30-$1.60, . . 1000/0 equity 10%0
$1.70-$2 .40... 100% equity 15 ”/0$0.80-$ 1.10... 25°/0 equity, 75°/0 debt 10 ”/0aA~~umPtiOns: no cost Overruns, $1 .20/million Btu coal, 5 percent real interest
rate on debt financing, $.20/gallon distribution cost including retailer profit. Formore details, see ch. 8, table
SOURCE: Office of Technology Assessment.

8/14/2019 Increased Automobile Fuel Efficiency and Synthetic Fuels: Alternatives for Reducing Oil Imports
http://slidepdf.com/reader/full/increased-automobile-fuel-efficiency-and-synthetic-fuels-alternatives-for 26/292
18 . Increased Automobile Fuel Efficiency and Synthetic Fuels: Alternatives for Reducing Oil Imports
ergy Security Act, * however, investments in syn-
thetic fuels appear to be attractive even at 1981fuel prices, but only if current capital cost esti-mates for synfuels plants are correct and thereare no cost overruns. Most industry experts,however, consider the chances of substantialcost overruns to be high. A cost overrun in plant
investment of so percent would increase the nec-essary price of synfuels by 20 to 30 percent, orelse reduce the return on investment.
OTA’s cost analysis implies that significant lev-els of investment in synfuels production are un-likely at this time without the kinds of financialincentives offered by SFC. Of course, a further—and currently unexpected—rapid escalation in oil
pric es c ould c hang e this c onc lusion.
Uncertainties associated with the cost estimatesare too large to allow in-depth comparison of the
costs of the various synfuels. Also, in OTA’s opin-ion, significant reduction of these uncertaintiescannot be achieved by further study but will re-
quire actual plant construction. There are indica-tions, however, that shale oil and methanolfrom coal could be the least expensive optionsfor producing transportation fuels. Shale oilplants are less c omplex tec hnic ally tha n o thersynfuels processes and shale oil is relatively easyto refine, thereby suggesting a lower cost. Metha-
nol’s high octane and burning characteristicsmake it more efficient than gasoline in specially
designed eng ines. But materials-hand ling p rob-
lems for oil shale, eng ine tec hnology d evelop -ments that could offset methanol’s efficiency ad-vantage, and unforeseen requirements for proc-ess changes could negate these apparent advan-tages.
Economic Impacts
Development of a fossil fuel-based syntheticfuels industry could create a major new economic
ac tivity in the United Sta tes, pa rticula rly in a rea swith large reserves of c oa l or oil sha le. There are
po tential drawb ac ks, though. For exam ple, be-
*The loan guarantees not only allow synfuels developers to bor-row money at somewhat lower interest rates than without them,but the 75 percent debt level is considerably higher than the in-dustry average of about 30 percent. Also, in some cases, the loanguarantee may be necessary to secure any debt capital at all.
cause of synfuel plants’ long lifetimes and con-struction Ieadtimes, a liquid fuel supply industrybased largely on synfuels would be less able thana natural petroleum-based industry to respondquickly to changing market conditions. Rapidsynfuels deployment would create a risk that un-foreseen market changes could leave the United
States with an outdated, idle, capital-intensiveindustry.
Development of the industry will have otherimportant consequences. For instance, because
of the large capital, technical and marketing re-quireme nts, and the high risks, sma ll c om pa niesare unlikely to e nter the ma rket e xc ep t a s pa rtsof c onsortia . This c ontrasts sha rply with t he la rgenumber of small-scale producers currently in-volved in oil and gas development, althoughownership concentration in the oil and gas indus-
try will grow in any case as the more easily recov-
ered resources are depleted.
Rapid deployment of a synfuels industry couldlead to temporary shortages of equipment, mate-
rials, and personnel, which in turn can lead toconstruction bottlenecks and local inflation.However, long-term inflationary effects are notexpecte d to b e large bec ause, in general, theIeadtime is sufficient to expand production capac-
ity and labor supply. An important exception may
be the supply of experienced chemical engineers
and project managers. If shortages of these per-sonnel develop, poor project management or im-
proper plant design could lengthen constructionschedules, delay plant startup, and increase costsfor chemical plants and oil refineries as well assynfuels plants.
The financ ial req uirem ents for rap id g row th a revery large. For example, the rate of investmentrequired to achieve 5 MMB/D of synfuels by 2000is likely to be greater than $30 billion per year*afte r the first few years, ab out a s muc h c ap ita las was spent for all U.S. oil and gas explorationand development in 1979. Making this large acommitment to synfuels would likely divert someinvestment capital away from conventional oiland gas exploration and development; and this
*OTA’S analysis of reducing stationary uses of fuel oil was doneprimarily to provide a reference point and was less extensive thanits analysis of synfuels and increased automotive fuel efficiency.

8/14/2019 Increased Automobile Fuel Efficiency and Synthetic Fuels: Alternatives for Reducing Oil Imports
http://slidepdf.com/reader/full/increased-automobile-fuel-efficiency-and-synthetic-fuels-alternatives-for 27/292
Ch. 1—Executive Summary q 1 9
could reduce conventional domestic oil produc-tion below the 7 MMB/D assumed for 2000.
Social Impacts
The princ ipal soc ial c onseq uenc es of d evelop-ing a synthetic fuels industry stem from shiftinglarge numb ers of w orkers and their fam ilies in andout of local areas as development proceeds.These po pula tion shifts disp rop ortionate ly affec t
sma ll, rural c om munities suc h a s those tha t p re-dominate in the oil shale and some of the coalareas. High population growth rates can lead todisruptions and breakdowns in social institutions;
systems for planning, managing, and financingpublic services; local business activities; and la-bor, capital, and housing markets. Whether thegrowth rates can be accommodated depends on
both community fac tors (e.g ., size, loc a tion, ta x
base, management skills, and availability of devel-opable land), and technology-related factors(e.g., the typ e o f synfuels fac ilities, the t iming o fdevelopment, and labor requirements).
On the other hand, communities should realize
soc ial be nefits from synfuels deve lopm ent , e.g.,increased wages and profits and an expanding
tax base. A significant portion of these benefitsmay not be realized, however, until after the plant
is built. In the meantime, the community mustmake significant expenditures and the overall im-pact depends substantially on the existence of ef-fective mechanisms to provide the “front end”resources needed to cope with rapid growth.
Environment, Health, and Safety
The p roduc tion of large q uantities (2 MMB/ Dor more) of liquid synthetic fuels carries a signif-icant risk of adverse environmental and occupa-tional health effects, some of which are quite de-pendent on the effectiveness of as yet unprovenc ont rol measures.
The industry will ca use m any of the same kinds
of mining, a ir qua lity, solid waste d ispo sal, wa teruse, and population effects as are now associatedwith coal-fired electric power generation andother forms of conventional coal combustion.Tab le 5 show s the a mo unt of new c oa l-fired po w-er generation that would produce the same ef-
fects as a 50,000-bbl/d coal-based synthetic fuelsplant, a nd a lso d irec tly c ompa res the effec ts ofthis plant with a 3,000-MWe coal-fired power-plant. In ge neral, the emissions of combustion-related pollutants, especially the acid rain pre-cursors sulfur dioxide (SO2) and NOX, and thewater use of the synfuels plant are significantlylower than for a powerplant processing thesame amount of coal.
To p lace these e ffec ts into p erspe c tive, ac tualco al-fired generating c ap ac ity in the United Statesis about 220,000 megawatts (MW), and about200,000 MW are expected to be added by 1995.
In comparison, SO 2 and NOX emissions from a2 MMB/D coal-based synfuels industry would beequivalent to emissions from less than 25,000MW of po we r ge neration, and wa ter use wo uldbe equivalent to that of 30,000 MW or less if con-servation prac tices we re followed .
On the other hand, a 2-MMB/D industry(equivalent in coal consumption to 110,000 to160,000 MW of coal-fired electric generatingcapacity) would mine hundreds of millions oftons of coal each year, with attendant impactson acid drainage, reclamation, subsidence andoccupational health and safety, and would havesubstantial population-related impacts such assevere recreational and hunting pressures onfragile Western ecosystems.
Oil shale development using aboveground re-torts has the a dd ed problem of d ispo sing of large
quantities of spent shale. Although successfulshort-term stabilization of shale piles has beenac hieved on a sma ll sc ale, unce rtainty remainsabout the long-term effects of full-scale develop-ment. The major concern about shale disposalas well as in-situ shale processing is the poten-tial for contamination of ground waters.
Despite the relatively moderate level of emis-sions per unit of production, an intense concen-tration of synfuels development within relative-ly small areas may yield air quality problems andviola tions of e xisting a ir qua lity reg ulat ions. Suc hconcentration is more likely with oil shale, be-cause of the concentrated resource base. As aresult, air quality restrictions may limit oil shaledevelopment to under 1 MMB/D unless there arechanges in the restrictions or improvements in

8/14/2019 Increased Automobile Fuel Efficiency and Synthetic Fuels: Alternatives for Reducing Oil Imports
http://slidepdf.com/reader/full/increased-automobile-fuel-efficiency-and-synthetic-fuels-alternatives-for 28/292

8/14/2019 Increased Automobile Fuel Efficiency and Synthetic Fuels: Alternatives for Reducing Oil Imports
http://slidepdf.com/reader/full/increased-automobile-fuel-efficiency-and-synthetic-fuels-alternatives-for 29/292
Ch. I—Executive Summary q 21
the risks from toxics yielded by oil shale processes
probably are no worse than those of indirect,high-temperature coal processes.
There is little doubt that it is technically feasi-ble to moderate a synfuels industry’s adverse im-pacts to the satisfaction of most parties-of-interest.
in OTA’ S judgme nt, how eve r, despite substan-tial industry efforts to minimize adverse im-pacts, the environmental risks associated withtoxic substances generated by synthetic fuelsproduction are significant and warrant carefulGovernment attention.
Current development plans and existing legisla-
tion c all for strong m ea sures to red uce ma ny ofthe potential adverse environmental impacts from
synfuels plants through intensive application ofemission controls, water treatment devices, pro-
tective clothing for workers, monitoring for fugi-tive emissions, and other measures. Virtually allof these measures have been adapted from con-trols used with some success in the petroleumrefining, p etroche mica l, coa l-tar p roc essing, a ndelectric power-generation industries. Synfuels in-dustry spokesmen are confident that the plannedcontrols will adequately protect worker and pub-lic health and safety as well as the environment.
Spo kesmen for lab or and environme ntal orga -
nizations are far less confident, however, andthere remain important areas of doubt concern-ing the adequacy of environmental management.The full range of synfuels impacts–especially
those associated with the toxic substances createdor released in the conversion processes—may notbe effectively regulated. Existing regulations donot c over ma ny of the se toxic substa nc es, andextending regulatory controls to provide full cov-
erage will be difficult. Critical stumbling blocksare the large number of separate compounds thatmust be controlled, and the recent reductions in
the budgets of Federal environmental agenciesand reemphasis of their synfuels research pro-grams. Detecting synfuels environmental dam-ages and tracing them to their sources—a key re-quireme nt in esta blishing and enforcing c ontrolstandards—may be difficult because many of thedamages will occur slowly and the relationshipbetween cause and effect is complex.
Another important concern is the possibilitythat the industry’s environmental control effortsmay not be sufficient to avoid environmental sur-prises. Fed eral Go vernme nt p ersonne l are c on-cerned that many developers are focusing theircontrol programs on meeting immediate regula-tory requirements and are reluctant to commit
resources to studying and controlling currentlyunregulated pollutants. Also, despite pollutioncontrol engineers’ optimism that all synfuelswaste streams are amenable to adequate cleanup,
the re are still doub ts ab out t he reliability of p ro-po sed c ontrol system s. These do ub ts a re ag gra-vate d by differenc es in p roc ess c ond itions andwa ste streams betw een synfuels p lants and therefineries, c oke ove ns, a nd other fa c ilities fromwhich the proposed controls have been bor-rowed, and also by a lack of testing experiencewith integrated control systems.
Water Availability for Synfuels Development
When aggregated nationally, water require-me nts for synfuels de velop me nt a re sma ll (pro-ducing 2 MMB/D oil equivalent requires onlyabout 0.2 percent of estimated total current na-tional freshwater consumption). Nevertheless,these requirements may have significant impacts
on competing water uses. In each of the riverbasins where major coal and oil shale resourcesare located, there are hydrologic as well aspo litica l, institutional, and lega l co nstraints andunc ertainties involving w a ter use (e .g., conflic tsove r the use of Fed eral storage , Fed eral reservedwater rights including Indian water rights claims,
interstate and international compacts and treaties,
Sta te wa ter laws). In a ddition, existing w a ter re-source studies vary in the extent they considerwater availability factors and cumulative impacts.
Given the uncertainties that surround the ques-tion of water availability generally, only limitedconclusions about possible constraints on futuresynfuels deve lopm ent c an be d rawn. This is espe-cially true in areas where institutional rather thanmarket mechanisms play a dominant role in ob-
ta ining and transferring wa ter rights. Where effi-cient markets do exist, however, water is not like-ly to constrain synfuels development because de-

8/14/2019 Increased Automobile Fuel Efficiency and Synthetic Fuels: Alternatives for Reducing Oil Imports
http://slidepdf.com/reader/full/increased-automobile-fuel-efficiency-and-synthetic-fuels-alternatives-for 30/292
22 “ Increased Automobile Fuel Efficiency and Synthetic Fuels: Alternatives for Reducing Oil Imports
velopers can afford to pay a relatively high pricefor water rights.
In the major Eastern river basins where c oalreserves are loc a ted (the O hio, Tennessee , andUpper Mississippi River Basins), water should beadequate on the main rivers and large tributar-ies, without new storage, to support planned syn-fuels development. In the absence of appropriatewater planning and management, however, lo-
calized water shortages could arise during ab-normally dry periods or from development onsmaller tributaries.
In the West, competition for water already ex-ists and is expected to intensify with or withoutsynfuels development. In the coal-rich UpperMissouri River Basin, the magnitude of the legaland political uncertainties, together with the needfor major new wa ter storage projects to a verage-out seasonal and yearly streamflow variations,
make it impossible to reach an unqualified con-clusion as to the availability of water for syn-fuels development.
In the Upper Colorado River Basin, whereboth oil shale and coal are located, water could
be made available to support initial synfuels de-velopment—as much as a few hundred thou-sand barrels per day of synfuels production by1990—but political and legal uncertainties in the
basin make it difficult to determine which sourceswould be used and the actual amount of waterthat w ould b e m ad e a vailab le. Wate r ava ilab il-
ity after 1990 will depend both on how these un-certainties are resolved and on the expected con-
tinuing growth in other uses of water.
Reducing Stationary Uses of Oil
Sta tionary uses of o il include spac e heat ing andcoo ling of b uild ings, electric ity gene ra tion, pro-duction of industrial process heat, and use as achem ica l feed stoc k. These c urrently ac c ount fornea rly ha lf of the oil used in the United Sta tes—about 8.1 MMB/D out of a total of 16.8 MMB/Din 1980. Of this, about 4.4 MMB/D are fuel oils—
midd le d istillates and residua l oil. The rema inderinclude liquefied petroleum gas, asphalt, petro-leum coke, refinery-still gas, and petrochemicalfeedstocks.
Only reductions in the fuel oil portion of thesta tiona ry oil uses are likely to lea d to a c tua l re-ductions in imports. The other oil products aredifficult to upgrade to premium fuels or use di-rectly in transportation applications and, conse-quently, a reduction in their use probably wouldhave little effect on the supply of transportation
fuels. On the o ther hand , the c rude o il frac tionsnorma lly used to p rod uce residual a nd d istillatefuel oils can instead be converted profitably intotransportation fuels by refining.
Reductions in fuel oil use can be accomplishedby fuel switching and conservation. In the build-ings sector, natural gas and electricity can replace
distillate oil, and insulation, furnace improve-ments, and other conservation measures can re-duc e fuel use in ge nera l. For utilities, conserva-tion in all sectors that use electricity can reducegeneration requirements, coal and nuclear can
replace residual oil for baseload operation, andna tural gas c an replac e d istillate o il in p ea kingturbines. ind ustria l oil use c an be reduc ed by in-c reases in proc ess effic ienc y and fuel switc hingto c oa l, * na tural ga s, and e lec tricity.
Projection of Oil Savings
The Energy Informa tion Ad ministrat ion projec tstha t the fuel oil c onsumed in sta tiona ry uses willdec line from tod ay’s 4.4 MM B/ D to 2.6 MM B/ Din 1990, assuming a 1990 price of $41/bbl of oil(1979 dollars). This 2.6 MMB/D is the target for
further sta tiona ry use red uc tion O TA ha s assume dfor this study.**
OTA has evaluated two ap proac hes to e liminat-ing the remaining 2.6 MM B/D stationary fuel oiluse by 2000. One approach involves total reli-ance o n fuel switc hing. Tab le 6 show s the e nergyneeded to displace the 2.6 MMB/D, substitutingcoal for residual oil and natural gas and/or elec-tricity for distillate oil.
*The Energy Information Administration has predicted that, by1990, most of the industrial processes that can use coal (primarilylarge boilers) will have been converted. Therefore, OTA’S calcula-
tions of post-1990 fuel-switching opportunities do not include coalswitching in the industrial sector.
* “If oil prices continue to decline in real dollars or stabilize atcurrent levels, 1990 stationary oil use is likely to be greater thanprojected.

8/14/2019 Increased Automobile Fuel Efficiency and Synthetic Fuels: Alternatives for Reducing Oil Imports
http://slidepdf.com/reader/full/increased-automobile-fuel-efficiency-and-synthetic-fuels-alternatives-for 31/292
Ch. l—Executive Summary 23
Table 6.—Summary of Annual Energy Requirement To Displace2.55 MMB/D of Stationary Fuel Oil Use
Oil Coal or Electricityreplaced by (106 tons)Sector (M MB/D) plus (tfc) (10’ kWh)
Buildings . . . . . . . . . . 1.2 — 2.4 425Industry . . . . . . . . . . . 0.3 — 0.6 120
Utilities. . . . . . . . . . . . 0.9 (resid.) 100 — —
0.15 (dist.) . . — 0.3 —Total . . . . . . . . . . . . 2.55 100 3.3 545
SOURCE: Office of Technology Assessment.
The technical capability to accomplish this level
of switching depends on two factors. First, if natu-ral gas is to play a major fuel-switching role, pro-
duc tion of unco nventional ga s sources* w ill beneeded. A key to this is the future price of gas.Sec ond , prod uc tion of a dd itiona l electric ity andswitching to coal in utility boilers depends pri-marily on the utility industry’s ability to solve its
current financial problems and gain access to cap-ital. Either of these potential constraints couldseverely restrict fuel switching.
A second approach combines fuel switchingwith m ea sures to c onserve o il, natural ga s, andelectricity. If conservation measures can saveenough natural gas and electricity to replace the(reduced) oil requirement, additional gas andelec tricity prod uction may not b e need ed. Ananalysis by the Solar Energy Research Institute(SERI) indicates that conservation measures in thebuildings sec tor alone c ould save ab out 1.5 timesas much natural gas and electricity as would berequired to replace all remaining stationary uses
of distillate and residual fuel oil by 2000.** Thiscombined approach has fewer technical con-straints than the “fuel switching only” approach.In OTA’S judgment, a significant fraction of the2.6 MMB/D of stationary fuel oil use expectedin 1990 can be eliminated by 2000 by conser-vation and fuel switching taken together.
Despite the lack of absolute constraints, how-
ever, it is unrealistic to expect total eliminationor nea r-elimina tion o f sta tiona ry fuel oil uses by2000. First, average capital costs are high enough
to discourage those investors who apply a high
*These sources include tight sands formations, geopressurizedmethane, coal seam methane, and Devonian shale formations.
* *ASSuming that all such stationary uses are reduced by conser-
vation as well.
discount rate to their investments. Second, thesite-specific variability and the large number ofdifferent types of measures imply that some ofthe individual measures will be far more expen-sive than the average. * Third, the record of oil-to-coal switching in industry during the past dec-ade has not been a good one despite apparentlyfavorable economic incentives. Finally, the con-
tinued reduction in supplies of high-quality“light” crude may lead to excess supplies ofresidual oil in the 1990’s, driving down its priceand ma king c onversion from residual oil to c oa lunec ono mical in som e c ases. To a c ertain extentthe latter effect will be offset by the economica ttrac tiveness of retrofitting oil refineries to p ro-duce less low-priced residual oil and more gaso-line, jet fuel, and diesel fuel.
costs
The investment costs for the two strategies for
reducing stationary oil uses are similar. OTA hascalculated the investment cost of the strategy thatrelies mainly on fuel switching to be roughly $230
billion, or an average of $90,000/bbl/d of oilsaved. Using SERI’S cost analysis, the strategy thatcombines strong conservation measures and re-placement of the remaining oil use with electricity
and natural ga s wa s c alc ulated to c ost roug hly$225 billion, or $88,000/bbl/d of oil saved. Thedifferenc e b etw een the estimate d c osts for thetwo strategies is too small to be meaningful.
Both the investme nt c osts and the op erating
costs paid by individual investors will vary overan extremely wide range, This is particularly truebecause the “strategies” are actually a combina-
*By the same reasoning, many will be less expensive than theaverage.
98-281 0 - 82 - 3 : QL 3

8/14/2019 Increased Automobile Fuel Efficiency and Synthetic Fuels: Alternatives for Reducing Oil Imports
http://slidepdf.com/reader/full/increased-automobile-fuel-efficiency-and-synthetic-fuels-alternatives-for 32/292
——
24 q /ncreased Automobile Fue/ Efficiency and Synthetic Fuels: Alternatives for Reducing oil Imports
tion of several markedly different kinds of invest-ments. For example, conversion of oil-burningutility boilers to coal has an average investment
cost of $74,000/bbl/d of oil replaced, whereasc onve rsion o f d istillate -using fac ilities to naturalgas averages $114,()()()/bbl/d (including the cost
of obtaining the new gas). Also, the costs of each
type of investment will vary from site to site.
Electric Vehicles*
Automobiles can be powered by rechargeable
batteries that drive an electric motor; indeed,some of the first automobiles used battery-electricpowertrains. Present concepts of electric passen-ger vehicles generally envision small vehicles forcommuting or other limited mileage uses, withrec harging a t night when e lec tricity dem and islow.
Projections of Use
OTA does not expect electric cars to play a sig-nificant role in passenger transportation in thiscentury. Battery-electric cars are likely to be veryexpensive, costing about $3,000 more in 1990than comparable gasoline-fueled autos. And thisconsumer investment may not yield any savingsin fuel costs. If batteries must be replaced every
10,000 miles, as required with current technol-ogy, total electricity plus battery costs will actu-ally be considerably higher than gasoline costsfor a comparable conventional auto, even at$2.00/gal gasoline prices (1980 dollars).
Ano ther reason tha t O TA is not op timistic is tha tprogress in electric vehicles remains severely lim-ited by battery performance. Currently available
ba tteries and c ompo nents req uire 6 to 12 hoursfor recharging and limit electric vehicles to arange of less than 100 miles between charges. Ac-
c elerat ion is limited to ab out O to 30 mp h in 10seconds, which is lower than the poorest per-forming (O to 40 mph in 10 seconds) gasoline and
diesel fuel ca rs and ma y not be ad equa te forma ny traffic c ond itions. Although p red ic tions ofsignific ant reduc tions in ba tte ry size a nd we ight
2 See, Synthetic Fuels for Transportation: The Future Pote ntia l of
Elec t r ic and Hybr id Veh ic les–Bac kground Pape r No. 1 ,
OTA -BP-E-13 (Washington, D. C.: U.S. Congress Office OfTechnology Assessment, April 1982).
c ontinue, in OTA’ S judgme nt c urrent unde rstand -ing of battery performance does not permit accu-rate pred ic tions of future improveme nts.
Even if sufficient p rog ress is ma de in ba ttery d e-velopment to encourage extensive usage of elec-
tric c a rs, electrification of automobile travel does
not offer the same potential for oil savings asthe other options. Under the best of circum-stances, most electric passenger vehicles are like-ly to be small, limited-performance vehicles thatwill substitute for small, fuel-efficient conven-tional autos. Consequently, a 20-percent electri-fication of the auto fleet is not likely to savemore than about 0.2 MMB/D. *
Environment, Health, and Safety
If te c hnic al d evelop me nts, severe liquid fuelshortages, and/or Government promotion were
to result in significant sales of electric vehicles,the major environmental impacts probably would
be the air quality and other effects associated withreducing auto emissions and increasing electricity
generation. The overall effects of widespread useof electric vehicles on urban air quality shouldbe strongly positive, because the electric carswould tend to be clustered in urban areas, manyof which have chronic automobile-related airpollution problems that would be eased by thedisplacement of conventional automobiles.There would be, however, a small net increasein regional and national emissions of SO 2, be-
c ause c onventiona l autos have few or no SO2emissions to offset the SO 2 emissions from fossil-fueled elec tric p ower ge neration for ba ttery re-charging. Additionally, when coal is the fuelsource for recharge electricity, the amount of coalmined p er unit of oil rep lace d is c ompa rab le tothat for synfuels production,** with similar coalmining impacts. Material requirements for bat-teries could add substantially to the demands forcertain minerals, e.g., lead, graphite, and lithium.
Electric passenger vehicles are likely to besmall and thus should share safety problems
*Assuming no oil is used for electricity production and the aver-age gasoline- or diesel-powered vehicle replaced gets 60 mpg.
* *That is, 1 ton of coal yields the same oil savings in either tech-nology.

8/14/2019 Increased Automobile Fuel Efficiency and Synthetic Fuels: Alternatives for Reducing Oil Imports
http://slidepdf.com/reader/full/increased-automobile-fuel-efficiency-and-synthetic-fuels-alternatives-for 33/292
Ch. I—Executive Summary q 25 —
with small conventional automobiles. Additional dent-caused spill; this latter problem is balancedsafety and health problems may be caused by the somewhat by eliminating the fuel tank with itsbatteries, which contain toxic chemicals that may highly flammable contents. Finally, extensive out-po se oc c upa tiona l prob lems in m anufac turing door charging of vehicle batteries may pose pub-and recycling and may be hazardous in an acci- Iic safety problems from the electrocution hazard.

8/14/2019 Increased Automobile Fuel Efficiency and Synthetic Fuels: Alternatives for Reducing Oil Imports
http://slidepdf.com/reader/full/increased-automobile-fuel-efficiency-and-synthetic-fuels-alternatives-for 34/292
s o
Z

8/14/2019 Increased Automobile Fuel Efficiency and Synthetic Fuels: Alternatives for Reducing Oil Imports
http://slidepdf.com/reader/full/increased-automobile-fuel-efficiency-and-synthetic-fuels-alternatives-for 35/292
FIGURE
Figure No. Page
3. U.S. Petroleum Consumption, Domestic Production, and Imports . . . . . . . . 29

8/14/2019 Increased Automobile Fuel Efficiency and Synthetic Fuels: Alternatives for Reducing Oil Imports
http://slidepdf.com/reader/full/increased-automobile-fuel-efficiency-and-synthetic-fuels-alternatives-for 36/292
Chapter 2
Introduction
Petroleum has been at the heart of the Nation’s
efforts to secure its energy future since the 1973-74 oil embargo. Petroleum products currentlysupply about 40 percent of total U.S. energyneeds, and imports account for approximately 30percent of tota l petroleum d ema nd. The increases
in the price of imported crude that have occurredsince 1972—a barrel of imported crude that was
selling for $4.80 in 1972 was selling for $31.40(both expressed in consta nt 1980 dollars) a s ofFebruary 1982–have severely strained the na-tional economy by contributing to domestic infla-tion a nd trade deficits and by a ltering d ema ndpatterns.
Instead of increasing gradually, petroleumpric es have go ne up in two large, rap id jump s.
These pric e “ shoc ks” have exac erba ted strainson the economy by preventing an orderly adjust-ment to higher fuel prices. Future price behavioris also very uncertain and complicates economicplanning. Subseq uent to de c ontrol of d omesticc rude oil pric es, a c ontinued increa se in the pric eof o il wa s ge nerally expe c ted . The sha rp drop indemand, coupled with reemergence of Iran onthe world oil market, however, has createddownward pressure on oil prices. A substantialdrop in the real price of oil over the next fewyears is quite possible.
This oil glut will not last indefinitely, however.Indeed, importing nations will eventually againface increasing competition for oil arising froma combination of dwindling world supplies* andinc rea ses in de ma nd from bo th produc ing a nddeveloping nations. This, in turn, will force oilprice increases with the possibility that they may
again come in the form of price shocks ratherthan an orderly rise. Thus, the U.S. petroleumproblem is not simply that we import oil–indeed,in a stab le, ec onom ically rationa l world imp ort-
*OTA estimates that non-Communist world oil production could
range from 45 to 60 MMB/D in 1990 and 40 to 60 MMB/D in 2000,compared to 46 MM B/D in 1980. While an increase in world pro-duction is possible, it is more likely that production will remainfairly stable or slightly decline. See World Petroleum Availability
19802000-A Tec hnica l Me morand um (Washington, D. C.: U.S.Congress, Office of Technology Assessment, October 1980),OTA-TM-E-5.
ing could be economically efficient-but that the
supply and price is subject to so much uncertainty
and dramatic change.
For 1981, the Nation’s imports of crude oil andpetroleum products averaged about 5.4 millionba rrels pe r da y (MMB/ D), ac c ounting for abo ut34 pe rc ent o f tota l petroleum de ma nd. These fig-ures compare with 7.5 MMB/D of imports, about41 percent of total petroleum demand, for 1980.
In fact, imports and demand have been on asteady downward trend since their peak in 1978,when imports of 8.2 MMB/D represented 44 per-
c ent o f tota l demand (see fig. 3). The p rinc ipa lc ause o f this do wnw ard trend in imp orts and theirshare of total petroleum demand was the nearly120-pe rc ent inc rea se in the rea l pric e o f c rude
oil since 1978. If the trend were to continue, oilimports could be eliminated by the end of thecentury.
There is c onsiderab le disagreeme nt, how eve r,
on w hether this trend c an be ma inta ined . Thec urrent do wnward trend o f p ric es as a result o fa soft market has a lrea dy be en no ted . The p rinci-pal focus of disagreement, however, is the ade-qua c y of the Nation’ s future do me stic supply. Thecurrent domestic production of crude oil and nat-
ural gas liquids is 10.2 MMB/D. Production ofthese two liquids has been declining steadily since
Figure 3.—U.S. Petroleum Consumption,Domestic Production, and Imports
c1 8
>1 6
Consumption
Production
1973 1974 1975 1976 1977 1978 1979 1980 1981
Year
SOURCE: Energy Information Administration, U.S. Department of Energy.
29

8/14/2019 Increased Automobile Fuel Efficiency and Synthetic Fuels: Alternatives for Reducing Oil Imports
http://slidepdf.com/reader/full/increased-automobile-fuel-efficiency-and-synthetic-fuels-alternatives-for 37/292
30 . Increased Automobilr Fuel Efficiency and Synthetic Fuels; Alternatives for Reducing Oil Imports
Photo credit: U.S. Department of Energy
Oil tankers deliver most of the crude oil importedto the United States
the peak year of 1970, when it reached 11.3MMB/D, although the decline has slowed notice-
ab ly the last 3 years (see fig. 3). This, coup led withthe remarkable upsurge in drilling activity since1979, has caused some forecasters to predict anincrease in production before the end of the cen-tury. In its most recent forecast, under a highworld oil price scenario, for example, the EnergyInformation Administration of the Department ofEnergy forecasts a production rate of 11.2MMB/D of crude oil and natural gas liquids by1995.1
Despite this increase in drilling and explorationactivity, as figure 3 shows, the effect of higher oilprices to this point has been almost exclusivelyin reducing demand, not increasing supply. Inaddition, the Office of Technology Assessmentin a study, World Petroleum Availability:
79802000, did not find a ny evide nce that a sig-nificant upturn in domestic production wouldoccur .2 In fac t, OTA estimate d a prod uc tion rateof 5 to 8 MMB/D by 1990 and 4 to 7 MMB/D by2000. Exxon’s most recent energy outlook fore-cast domestic production of 7.1 MMB/D by 1990and 7.8 MMB/D by 2000.3 Thus, production rate
1 Annual Report to Congress, 1980, vol. 3, DOE/EIA-01 73(80)/3,
Energy Information Administration, U.S. Department of Energy,Washington, D. C., March 1981, p. 85.
2 World Petroleum Availability: 1980-2000-A Technical Memorandum (Washington, D. C.: U.S. Congress, Office ofTechnology Assessment, October 1980), OTA-TM-E-5.
3Energy Outlook: 1980-2000, Exxon Co., U. S. A., Houston, Tex.,
December 1980, p. 7.
estimates for the middle 1990’s differ by as muchas 7 MMB/ D, an a mo unt g rea ter than c urrent U.S.imports.
In OTA’ S judg me nt, the lowe r ra tes estima tedin its study are still valid and it would be impru-dent to assume otherwise in planning for the1990’s. The principal justification for these lowerrate estimate s is not so m uc h an ac tua l dec linein tota l oil reserves as the increa sing d iffic ulty inextrac ting the o il tha t is found . The rate at whic hoil c an be produc ed is de c lining be c ause o il isno longer be ing fo und in the ve ry large oilfieldsnecessary to sustain or increase total production.
If dom estic prod uc tion doe s de c line to 5 or 8MMB/D by the mid-1990’ s, dem and w ill have tode c rea se e ven fa ster than it ha s during the lastfew years just to keep imports at their current lev-
el. It is possible to greatly reduce petroleum prod-uct demand by both fuel switching and increased
efficiency of use. This will require a substantialinvestment, however, and it is not clear yetwhe ther it will be ma de. The c urrent d em andresponse is a combination of shortrun elasticityto the mo st rece nt p rice rise a nd the long er runelasticity—involving turnove r of c apital stoc k—to the 1973-74 price rise. Current forecasts ofenergy demand all show a continued, but slower,
decline in petroleum demand for the rest of the1980’s but a steadying during the 1990’s. In allcases, substantial imports will be necessary in the1990’s if the dec line in dome stic p rod uc tion a s-sumed above takes place.
Faced with similar prospects after the 1973-74
oil embargo, Congress enacted a wide range oflegislation to encourage a reduction of the Na-tion’s dependence on oil imports. First, legisla-tion was enacted to reduce petroleum demand.Foremost among these initiatives was the estab-lishment in the Energy Policy and ConservationAct of the 1985 Corporate Average Fuel Efficien-cy (CAFE) standards for automobiles. More thanhalf of total U.S. petroleum demand is in thetransporta tion sec tor, wh ich, in turn, uses abouthalf of its petroleum in passenger vehicles. Other
legislation to reduce petroleum demand in-cluded: 1 ) the Powerplant and Industrial Fuel UseAct, whose provisions require large combustorsto convert from oil by 199o; and 2) systems oftax credits and financial programs to encourage

8/14/2019 Increased Automobile Fuel Efficiency and Synthetic Fuels: Alternatives for Reducing Oil Imports
http://slidepdf.com/reader/full/increased-automobile-fuel-efficiency-and-synthetic-fuels-alternatives-for 38/292
Ch. 2—/ntroduction . 31
capital investments for energy conservation in in-
dustry and buildings. Finally, legislation waspa ssed to aug ment do me stic supp lies of p etro-leum substitutes through the production of syn-thetic fuels. The Energy Security Act of 1980 es-tablished the Synthetic Fuel Corp., with synfuel
production goals of 0.5 MMB/ D in 1987 and 2.0MMB/D by 1992.
The e ffic ac y of this ap proac h is now be ing re-evaluated, not only because of the time limita-tions of the legislation, but also in light of the priceincreases of 1979, which have caused the Nation
to reduce imports more quickly than originallyanticipa ted . The d eb ate c enters on whe ther theGovernment should continue its approach of the1975-80 period—and if so which path or pathswo uld b e mo re effec tive-or whether the Nationcan depend primarily on the current high oil cost —not entirely anticipated when the original legis-
lation was pa ssed –to reac h an ac c ep tab ly lowlevel of oil imports. Complicating current debateis uncertainty about where oil prices will go inthe immediate future. A steady decline in realprices over the next few years could substantial-ly reduce market pressure toward increased con-
servation and de velopm ent o f alternative fuels,with the result tha t the Na tion will be tha t muc hmo re e c onom ic ally vulnerable should there b edram at ic upsurge s in pric es later in the de c ad eor throughout the 1990’s. Further, no matterwhich approach is preferable, general concern
exists about the side effects of the Nation’s move-ment to free itself from import dependence.
Of particular interest in the ongoing evaluationof policy are the approaches directed at produc-ing synthetic liquid fuels and at red ucing pe tro-leum c onsump tion by a utom ob iles. These a re b yfar the largest p rog ram s ena c ted by Cong ress,both in terms of their costs and of their effectson the economy.
In 1979, the Sena te C om mittee o n Co mme rc e,
Science, and Transportation requested OTA toassess and compare these two approaches to re-
ducing oil imports. Because mandated increasesin CAFE standards were to end in 1985, the com-mittee was interested in whether further stand-ards would be more or less effective than the syn-
fuels program in reducing oil imports. The large
increase in oil prices since 1979 and the responseto this increase have changed the environmentin which tha t request w as ma de . As a result OTAhas broadened its study to consider how far andfast automobile efficiency and synthetic fuels pro-
duction can develop during the next 20 years,
and to e valuate the e ffects on and risks to the in-dustries involved. Suc h a n eva luation is particu-larly important for the automobile industry be-cause of its current precarious state. No matterwhat course the Nation chooses—continued reg-ulation or more reliance on market mechanisms
—the industry may be in for continued difficulties
if the need for large capital investments continues
while de ma nd for auto mo biles rema ins relative-ly low.
In addition to assessing the import reducing po-
tential of synfuels and increases in automobile
fuel efficiency, this study also examines, althoughin considerably less detail, the oil savings thatcould be gained through fuel switching and con-servation by stationary oil users. By combiningthe three approaches, plausible development sce-narios for reductions in oil consumption are de-rived, leading to estimates for oil imports over thenext 20 years.
The body of this report starts with an analysisof p olic y op tions that: 1 ) could influenc e the rate
at which oil imports can be reduced or 2) affectthe consequences of changes needed to reduce
c onventional oil consump tion. The ne xt c hap terpresents the major issues and findings of the re-po rt, inc luding a disc ussion of the c ost o f oil im-ports, comparisons between increased automo-bile fuel efficiency and synfuels, and analyses ofissues related solely to one or the other of theseoptions.
The rema ining c hap ters of the rep ort c onta inthe b ac kground ana lyses. Sep arate c hap ters onincreased automobile fuel efficiency, synfuels,and stationary uses of petroleum present the tech-
nica l and c ost analyses for eac h. The final cha p-
ters analyze the economic and social effects andenvironmental, health, and safety impacts associ-
ated with both increased automobile fuel efficien-
cy and synfuels, as well as the availability of water
for synfuels development.

8/14/2019 Increased Automobile Fuel Efficiency and Synthetic Fuels: Alternatives for Reducing Oil Imports
http://slidepdf.com/reader/full/increased-automobile-fuel-efficiency-and-synthetic-fuels-alternatives-for 39/292
Chapter 3
Policy

8/14/2019 Increased Automobile Fuel Efficiency and Synthetic Fuels: Alternatives for Reducing Oil Imports
http://slidepdf.com/reader/full/increased-automobile-fuel-efficiency-and-synthetic-fuels-alternatives-for 40/292
Contents
In troduction . . . . . . . . . . . . . . . . . . . . . . . . . . . . . . . . . . . . . . . . . . . . . . .
The Nation’s Ability To Displace Oil Imports. . . . . . . . . . . . . . . . . . . .
Rationale for a Direct Federal Role. . . . . . . . . . . . . . . . . . . . . . . . . . . .
Distinguishing Features of Increasing Automobile Fuel Efficiency andSynthetic Fuels Production . . . . . . . . . . . . . . . . . . . . . . . . . . . . . . .
Factors Affecting the Rate of Automobile Fuel-Efficiency IncreasesAutomobile Fuel Efficiency-Policy Background. . . . . . . . . . . . . . . .Factors Affecting the Rate of Synthetic Fuels Production . . . . . . . . .Synthetic Fuels production–Poiicy Background . . . . . . . . . . . . . . . .
Policy Options. . . . . . . . . . . . . . . . . . . . . . . . . . . . . . . . . . . . . . . . . . . . .EconomyWide Taxation–Oil and Transportation Fuels . . . . . . . . . .Economywide Taxation—Special Provisions . . . . . . . . . . . . . . . . . . .Research and Development . . . . . . . . . . . . . . . . . . . . . . . . . . . . . . . .Trade Protection . . . . . . . . . . . . . . . . . + . . ? . . . . . . . . . . . . . . . . . . . .Sector-Specific Demand Stimuli-Purchase Pricing Mechanisms . . .Sector-Specific Supply Stimuli-Subsidies and Guarantees.. . . . . . .Regulations on Output . . . . . . . . . . . . . .Other Effects . . . . . . . . . . . . . . . . . . . . . .
Conclusions . . . . . . . . . . . . . . . . . . . . . . . . .
Appendix 3A. –Policy Options To Reduce
Appendix3B. –Additional CRS References
. . . . . . . . . . . . . . . . . . . . . .
. . . . . . . . . . . . . . . . . . . . . .
. . . . . . . . . . . . . . . . . . . . . .
Stationary Oil Use . . . . . .
. . . . . . . . . . . . . . . . . . . . . .
TABLES
. . . . . . . .
. . . . . . . .
. . . . . . . .
. . . . . . . .
. . . . . . . .
. . . . . . . .
. . . . . . . .
. . . . . . . .
. . . . . . . .
. . . . . . . .
. . . . . . . .
. . . . . . . .
. . . . . . . .
. . . . . . . .
. . . . . . . .
. . . . . . . .
. . . . . . . .
. . . . . . . .
. . . . . . . .
. . . . . . . .
Page
35
35
37
38
4 0
4 1
4 2
4 2
4 4
4 6
4 8
4 8
4 9
5 0
5 2
5 5
5 6
6 0
6 2
6 3
Table No. Page
7. Distinguishing Features oflncreasing Automobile Fuel Efficiencyand Synfuels Production . . . . . . . . . . . . . . . . . . . . . . . . . . . . . . . . . . . . . . . . . . 39
8. Potential Average New-Car Fuel Efficiencyin 1995 . . . . . . . . . . . . . . . . . . . . . 56

8/14/2019 Increased Automobile Fuel Efficiency and Synthetic Fuels: Alternatives for Reducing Oil Imports
http://slidepdf.com/reader/full/increased-automobile-fuel-efficiency-and-synthetic-fuels-alternatives-for 41/292
Chapter 3
Policy
INTRODUCTION
Success of any efforts to reduce oil imports willdepend on many complex, unpredictable factors,
including world oil prices, the success of tech-nological developments, consumer behavior,ge neral ec onom ic c ond itions, and –signific antly –Government policies and programs.
Government policy is vitally important, be-cause energy inevitably affects, whether direct-ly or indirec tly, all produc tion a nd c onsump tiondecisions in an industrial society. How quicklyand to what level the Nation displaces oil imports
have direc t imp licat ions for who be nefits from,and who pays the costs of, energy independence.
Such distributional questions arise regardless of
po lic y c hoices. Thus, the p olic y c hoices mad e b yCongress transcend a simple choice between in-tervention and nonintervention.
detailed discussion of policy options related tofuel switching and conservation in stationary uses
of petroleum, and to biomass, the reader is re-ferred to o ther OTA p ub lic a tions.1) The c hap teraddresses the circumstances which might justify
direct Government intervention to displace oilimports. The well-established auto industry andthe new ly deve loping synfuels industry are the ndescribed; and those economywide and sector-specific characteristics which shape, direct, andpace each industry’s ability to displace oil imports
are identified. A brief, recent history of Govern-ment policy towards each industry is also pro-vided. Finally, the major policy options available
to Congress are discussed and evaluated basedon the characteristics of the industries.
This c ha pte r describes the p olicy issues and o p-
tions for increasing automobile fuel efficiency andaccelerating synthetic fuels development. (For a
‘Energ y From Biolog ic al Proc esses, OTA-E- 124, July 1980; Resi-dential Energy Conservation, OTA-E-92, July 1979; Dispersed Elec-
tric Energy Generation Systems, OTA, forthcoming; Energy Efficiency
of Buildings in Cities, OTA-E-168, March 1982.
THE NATION’S ABILITY TO DISPLACE OIL IMPORTS
The three principal means for displacing oilimports-increased automobile fuel efficiency,synfuels production, and fuel switching and con-servation in stationary uses—can all make impor-
ta nt c ontributions to the Na tion’s energy future.Legislation has recently been enacted in all three
area s to red uce c onventiona l oil use, includingthe Energy Policy and Conservation Act of 1975,the Energy Security Act of 1980, the Fuel Use Act,and various taxes and credits to encourage capitalinvestment for ene rgy c onservat ion in industriesand buildings. z Some progress in displacing im-ports can be expected as a result of these Govern-me nt p rog ram s wo rking in c onc ert with ma rketforces.
OTA’S technical analysis, presented in this re-po rt, co nc ludes that if Cong ress wishes to elimi-
2For details of recent legislation, see for example congressionalQuarterly, Inc., Energy Po/icy, 2d cd., March 1981.
nate net oil imports, significant accomplishmentin all three areas may in fact be necessary toachieve this goal by 2000 if domestic productionfalls from 10 million to 7 million barrels per day(MMB/D) or less by 2000, as OTA expects.3 Inge neral, if there a re no ad ditional polic ies andprograms, if technology developments are only
partially successful, and if strong market forcesfor imp ort displac eme nt d o no t m ate rialize, theUnited Sta tes c an e xpec t to imp ort 4 to 5 MMB/ Dor more by 2000 (see issue on “How Quickly CanOil Imports Be Reduced?” in ch. 4).
In the near future, Congress will face a number
of decisions about whether to increase efforts to
displace oil imports, and if so, at what speed im-ports should be displaced, Major decisions will
3 World Petroleum Availa bi l i ty: 1980-2000—A Tec hnic al
Mem orand um, OTA-TM-E-5 (Washington, D. C.: U.S. Congress,Office of Technology Assessment, October 1980).
35

8/14/2019 Increased Automobile Fuel Efficiency and Synthetic Fuels: Alternatives for Reducing Oil Imports
http://slidepdf.com/reader/full/increased-automobile-fuel-efficiency-and-synthetic-fuels-alternatives-for 42/292
36 “ Increased Automobile Fuel Efficiency and Synthetic Fuels: Alternatives for Reducing Oil Imports
concern the two major programs enacted byCongress: the setting of fuel efficiency (CorporateAverage Fuel Economy (CAFE)) standards beyond
the 1985 mandate for new cars sold in the UnitedSta tes, and the p rovision o f large subsidies to p ro-mote rapid development of the synfuels industry.
Suc h d ec isions will sha pe the future of b oth theauto and synfuels industries. Whether new policyinitiatives are feasible, p rac tica l, and ap prop riate
cannot be determined until Congress specifies thedesired level and rate of import displacement. IS
the goal to “eliminate” or to “reduce” imports?*ISthis oil import displacement goal so vital to na-
tional interests that an emergency effort is re-quired, regardless of any accompanying disrup-tions and d islocat ions?
Given the uncertainties, risks, and unpredicta-bility assoc iated with bo th the auto mo bile fuel-efficiency and synfuels options, it is difficult to
determine how far and in what direction presentpolicies and market forces will take the Nation.OTA has not a ttemp ted to p redict the d etailedoutcomes of alternative policy futures, but ratherto demonstrate that the ability to displace oil de-pe nds on c omplex, interrelated fac tors, and todemonstrate that the Government’s policychoices—whether to implement additional poli-cies or to “do nothing” —will make a difference
in the ab ility to a c hieve oil displac eme nt g oa ls.Polic ies are a lso ide ntified tha t c ould b e e ffec -tive if future Government action is necessary.**
OTA’S low estimate is that the ave rage fleet fuelefficiency for new cars could reach at least 40 to
so miles per gallon (mpg) by the early to mid-1990’s and 45 to 60 mpg by 2000,*** based on
*“Elimination of oil imports” herein is assumed to mean the re-duction of net oil imports to a level of about O to 1 MMB/D by 2000.At this level, the “security premium” for oil—the difference betweenthe market price and full economic cost to the Nation of oil im-ports-would approach zero. This level of supplies could be pro-cured primarily from the United Kingdom, Canada, and Mexico;and foreign producers generally would be forced to compete formarkets. Because of the “security premium, ” policy decisions about
the value of displacing imports should not be based solely on theinternational price of oil.
**An examination of Government policy related to the use of
petroleum in the stationary sector is beyond the scope of this report.A summary of the major policy options for the stationary sector,however, is found in app. 3A to this chapter.
***Earlier trends showing relatively strong demand for fuel econ-omy have encouraged some domestic manufacturers to predictnew-car fuel economy averages of over 30 mpg by 1985 (the 1985CAFE standard requires a fleet average of 27,5 mpg), while individual
vehicles already on the market exceed 45 mpg.
relatively pessimistic expectations about howquickly improved a utomotive tec hnology is de -ployed and purcha sed . Fleet fuel consump tionfor pa sseng er ca rs wo uld be ab out 2.1 MMB/ Din 2000, for a cumulative savings of over 1 billionbarrels of oil between 1985 and 2000 (assumingthat the same proportion of large, medium, and
small cars are sold in 2000 as are expected to besold in 1985). The “high estimate” assumes thattechnology development is both successful andrapidly introduced into volume production. Aver-
ag e mp g ratings would be 55 to 65 mpg by 1995
and 60 to 80 mpg by 2000; and fleet fuel con-sumption for passenger cars could be as little as1.3 MMB/D in 2000 for a cumulative savings ofover 4 billion barrels (relative to a 30-mpg fleetand assuming a rapid shift to small cars).
However, the actual level of fuel consumptionwill depend on market demand for fuel-efficient
cars and/or additional Government policies de-signe d to fac ilitate either the m anufa c ture o r pur-chase of these cars. Although the low estimates
are believed to be achievable in the absence ofad ditional Government po lic ies, they would becontingent on consumer expectations that thereal price of gasoline will continue to increase.The high estimates are unlikely to be achievedin the absence of supporting Government policiesunless a strong and continuing consumer demand
for fuel efficiency is coupled with favorable tech-nological progress.
OTA’ S estima tes for a low- a nd a high-de velop -
ment scenario for synthetic fuels production de-pend principally on the price of conventional oiland the ease and rate with which synfuels proc-esses are proven. A rapid buildup of the industrycould begin as early as the late 1980’s or as lateas the mid-l990’s, resulting in technically plausi-ble production levels of fossil-synthetic transpor-
tation fuels of 0,3 to 0.7 MM B/D by 1990, 0.7 to1.9 MMB/D by 1995, and 1 to 5 MMB/D by2000. * In the absence of additional Governmentpolicies, the lower estimates are probably attain-
ab le b ut are c ontingent o n a Government-sup-ported commercialization program that reducesthe high technical and associated financial risks
to private investors of first generation plants.
Without a successful commercialization pro-gram, even the low estimates are probably unat-
*These estimates exclude contributions from biomass.
8/14/2019 Increased Automobile Fuel Efficiency and Synthetic Fuels: Alternatives for Reducing Oil Imports
http://slidepdf.com/reader/full/increased-automobile-fuel-efficiency-and-synthetic-fuels-alternatives-for 43/292
Ch. 3—Pol icy q 3 7
tainab le. If there is a c om mercialization p rog ram ,synfuels produc tion theoretically could reach thehigh estimates without additional Governmentprograms if: 1 ) early commercial-scale demonstra-
tion units are built and work successfully, and2) synfuels production becomes unambiguouslyp rofitab le. The maximum d isp lac em ent o f oil im-ports, however, would occur only if synfuels pro-duc tion c onc entrates on transpo rta tion fuels. itis OTA’ S judgme nt tha t, even with a c om me rc ial-
izat ion p rogram , the high estima tes are likely tobe delayed by as much as a decade unless poli-cies tantamount to energy “war mobilization” areenac ted .
Fuel switching and conservation of oil in sta-tionary uses will a lso b e e xtreme ly imp ortan t fo rdisplacing oil imports and would complementboth fuel-efficiency and synfuels efforts. Althoughmuch of the pote ntial for displac ement co uld
probably be achieved by market forces by 2000(under the high oil price scenario of the EnergyInformation Administration (EIA)),
4additional pol-
icies to encourage fuel switching and conserva-tion will likely be required to accelerate the
4Department of Energy, Energy Information Adminstration, An-
nual Report to Congress, vol. II 1, May 1982.
changes or completely eliminate stationary fueloil use. The level of displac eme nt that c an b e o b-
tained depends not only on future oil prices, buton financing, reg ulation, and tec hnic al fac tors.Efficiency increases in the various nonautomobiletransportation uses could also be significant.
Displacing oil imports is a necessary but nota sufficient condition for achieving nationalenergy security. Such security translates into anessential self-reliance, availability, affordability,and sustainability of energy resources. Alternativeenergy sources may present their own set of sup-
ply and/or distribution problems. Furthermore,the relationship between the level of imports andthe level of insecurity is not proportional in anobvious way. Even if the Nation could eliminateall of its oil imports, U.S. energy security couldstill be seriously affected if interruptions in worldoil supplies threatened international commit-
ments with allies, imbalances in the world mone-tary system, and pressures on foreign exchangemarkets. Thus, efforts to displace the Nation’smost insecure oil resources—its imports-shouldnot divert attention away from ensuring the resil-ience of the alternatives chosen and thus the sta-bility of both domestic and international energysystems.
RATIONALE FOR A DIRECT FEDERAL ROLE
The b asic rationa le for direc t Fed eral involve-ment in a market economy is that—in limited butimportant areas— ma rket p ric es and c osts usedto evaluate returns on private investments do notreflect the fuII value and cost of the investments
to society as a whole. National security and envi-ronm enta l protec tion are c lassic e xam ples of va l-
ues and costs that are not reflected in profit andloss statements. Private calculation of profits alsocauses market mechanisms to be most respon-sive to short-term economic forces as opposedto long-term soc ial and ec onom ic go als.
The three principal reasons for such market“failures” are that: 1 ) some of the social benefits
are public and not private goods, 2) some of the
costs are not paid by the private sector, and3) co sts and be nefits are no t fully know n. All three
situations arise in the context of displacing oil im-ports in general and of both increasing automo-bile fuel efficiency and producing synfuels in par-
ticula r. The inab ility of the c onve ntiona l ma rket-place to ensure the effective and rapid displace-ment of oil imports has major implications for theFederal role, depending on the goals chosen andthe resources made available.
National security is a public good that has tradi-
tionally received Government support. Nationalenergy security, promoted by the displacementof o il imp orts, is an important c om po nent o f ove r-
all sec urity. Direc t Government involvementwouId thus be justified if market forces alonewere not believed capable of achieving the quan-
tity and rate of oil displacement required by na-
tional security goals. The value to the Nation of

8/14/2019 Increased Automobile Fuel Efficiency and Synthetic Fuels: Alternatives for Reducing Oil Imports
http://slidepdf.com/reader/full/increased-automobile-fuel-efficiency-and-synthetic-fuels-alternatives-for 44/292
38 . Increased Automobile Fuel Efficiency and Synthetic Fuels: Alternatives for Reducing Oil Imports
accelerating automobile fuel efficiency increasesand synfuels production would be in addition toany private returns to investment.
Both increased automotive fuel efficiency and
synfuels p roduc tion g ive rise to side effe c ts andtradeoffs; those who benefit from the investments
are not necessarily the ones who bear the fullcosts. Side effects can fall on different sectors ofthe e c onom y, reg ions, or co nsumer group s de -pending on the investments chosen. In the case
of increased auto mo bile fuel effic iency, the ra-tionale for Gove rnment po lic y is that the a c tivitiesstimulated by market forces alone do not provide,for example, adequate safety and employmentsafeguards. There are other possible tradeoffs,on the one hand, betw een imp roving the co m-petitive position of the U.S. auto industry byencouraging investments in increased auto fuelefficiency, and, on the other hand, possible de-
clines in auto-related employment levels (becauseof increased automation, contraction of the do-mestic industry), increased consumer costs, and
decreased safety. With respect to synfuels, Gov-ernment intervention could be similarly war-ranted if market decisions do not reflect environ-mental, health, safety, and other social concerns.
Both increased automobile fuel efficiency andsynfuels prod uct ion are c harac terized by finan-
cial risks and uncertainties. If market forces alonedetermine outputs, investments associated withthese alternatives might be delayed or canceled.In such cases, the Government could chooseeither to assume some of the risk or to help re-duc e c om po nents of unc ertainty. The a uto indus-try’s unce rtainty foc uses on unp red icta ble c on-sumer demand for fuel-efficient cars, the longIeadtimes for investments, and, to a lesser degree,
on the rate of tec hnologica l de velopm ent. Syn-fuels production is subject to significant techno-logical uncertainties and, in turn, financial risks.Both the auto and synfuels industries are also af-
fected by uncertain and as yet undetermined fu-ture Gove rnme nt p olic ies.
DISTINGUISHING FEATURES OF INCREASING AUTOMOBILE FUELEFFICIENCY AND SYNTHETIC FUELS PRODUCTION
The major forces that will shape, direct, andpace increases in automobile fuel efficiency and
synfuels production are summarized in table 7.Identifying these forces may indicate both the
potential opportunities for and limitations ofGovernment policies in achieving a desired level
and rate of import displace ment, and the ap pro-priateness, practicality, and desirability of specificpolicies or combinations of policies.
Although increased automobile fuel efficiencyand synfuels production share several attributes,essential differences between them suggest thatthere is no single role for Government policiesand programs. These two options should beviewe d a s c ompleme ntary mea sures for red uc-ing oil imports. Each option has different implica-
tions for the rate of oil import displacement andwill give rise to different types of ec onom ic a ndnoneconomic impacts on the Nation. In addition,within the uncertainty about investment costs(per barrel per day oil equivalent (B/DOE) pro-
duced or saved), neither increased automobilefuel effic iency no r synfuels prod uc tion ap pe arsto have an overall unambiguous enconomic ad-vantage over the other. For this reason, the non-
monetary and often nonquantifiable differencesbetween these options will be the principalmeans for distinguishing between them for pol-icymaking purposes.
The fa c tors that de termine the rate o f fuelswitching and conservation in stationary applica-tions will share some common elements withautomobile fuel efficiency increases and synfuelsprod uc tion. The succ ess of fue l switc hing w ill de -
pend critically on the efficiency of stationaryenergy uses, the technologies for producingnatural gas from unconventional sources, the sup-
ply and future price of conventional natural gas,and the ability of the utility industry to solve itscurrent financial problems. in the absence ofmandated conservation or performance stand-ards, conservation measures will depend primar-

8/14/2019 Increased Automobile Fuel Efficiency and Synthetic Fuels: Alternatives for Reducing Oil Imports
http://slidepdf.com/reader/full/increased-automobile-fuel-efficiency-and-synthetic-fuels-alternatives-for 45/292
Ch. 3—Poicy Ž 39
Table 7.—Distinguishing Features of Increasing Automobile Fuel Efficiency and Synfuels Production
Increasing automobile fuel efficiency Synfuels production
1. Both near- and long-term restructuring of an existingindustry
2. Dominated by a few large, mature companies
3. Automobiles as consumer durables; differentiable;deferrable
4. New technology involved, but can proceed incremen-tally; associated risks are an ongoing feature ofindustry
5. Industry must produce competitive products eachyear, including fuel-efficient cars
6. Precariousness of industry’s current financial posi-tion; need to ease readjustment of an industry indistress
7. Large demand uncertainty
8. Dispersion of industrial activities, domestically and,increasingly, internationally; some concentration ofactivities in the North-Central region of the UnitedStates
9. Capital intensity and associated risks10. Declining profit margins in domestic industry11. Significance of international competition (i.e., auto im-
ports); importance of domestic market to financialviability
12. Large amounts of capital continually required forredesign, retooling, etc.; final costs for improved fuelefficiency uncertain; calculation of capital costs forfuel economy dependent on methods for costallocation
13. Can make significant contributions to reducing U.S.oil imports; contributions have a long Ieadtime butcan have significance incrementally
14. Caters to a saturated market; focus on productreplacement rather than growth markets
15. Consumer costs are investment to reduce future fuelpurchases
16. Reduces consumption of fuel17. Fuel savings in automobiles limited to about 3.5
MMB/D with about 1.5 MMB/D savings coming fromachieving a 30-mpg fleet
18. Principal health impact may be increased auto deathsdue to smaller cars
1. Growth and promotion of a new industry
2. Likely to be dominated by a few large, maturecompanies
3. Synfuels as uniform, consumable commodities
4. Large technical risks; possibilities for “whiteelephants, ” major risk occurs with first commercial-scale demonstration plants
5.
6.
7.
8.
9.10.11.
12.
13.
14.
15.
16.17.
18.
Sponsoring industry is involved in a breadth of activi-ties that provides alternative investment and businessopportunities, of which synfuels is oneSoundness of sponsoring industry’s current financialposition; need to facilitate growth
No unusual demand risk except insofar as synfuelsdiffer from conventional fuelsDispersion of activities among coal regions; currentoil shale activity concentrated in a small area of theWest
Capital intensity and associated risksPotential for profit still highly uncertainLong-term export potential; importance of interna-tional competition (i.e., oil imports) in terms ofestablishing the marginal priceLarge amounts of capital required primarily in the ini-tial construction phase; final costs for synfuels pro-duction uncertain
Can make significant contributions to reducing U.S.oil imports; contributions have a long Ieadtime andwill not be significant until commercializationCaters to a slowly growing or possibly decliningmarketNo investment needed by consumer; consumer paysincrementally for each increment of consumptionSubstitutes one fuel for anotherFuel-replacement potential ultimately limited by de-mand for synfuels, environmental impacts of synfuelsplants, and coal and oil shale reservesEnvironmental and health impacts from: large-scalemining of coal and oil shale; possible escape of toxicsubstances from synfuels reactors (major risks aredirect worker exposures, contamination of groundwater); visibility degradation; development pressureson fragile, arid ecosystems
SOURCE: Office of Technology Assessment.
ily on investo r be havior. Although there a re few investments. Both fuel switching and conserva-technical constraints, there are technical uncer- tion are difficult to put into practice because the
tainties about the conservation potential of build- me asures a re va ried , site-spec ific , and in som e
ings and the suc c ess of p articula r c onservat ion cases costly.
98-2 B 1 3 - 82 - 4 : QL, 3

8/14/2019 Increased Automobile Fuel Efficiency and Synthetic Fuels: Alternatives for Reducing Oil Imports
http://slidepdf.com/reader/full/increased-automobile-fuel-efficiency-and-synthetic-fuels-alternatives-for 46/292
40 q /ncreased Automobile Fue/ Efficiency and Synthetic Fuels: Alternatives for Reducing oil Imports
Factors Affecting the Rate ofAutomobile Fuel= Efficiency Increases
In order to be internationally competitive, thedomestic automobile industry is currently under-going major structural adjustments. 5 This readjust-ment is the consequence of two interrelated
force s. First, the dom estic industry is und ergoinga long-term restructuring that is being experi-enced by auto manufacturers worldwide. Re-source pressures and a trend towards small, fuel-efficient, and standardized “world cars” have re-
sulted in a period of corporate consolidation, withfirms being more closely tied by joint design and/ or production ventures, and a geographic disper-
sion of product assembly. Secondly, U.S. automa nufac turers are uniquely fac ed with a seriesof short-term problems that arise because theyhave historically served a market that demanded
large, relatively fuel-inefficient cars. U.S. manu-facturers have been the principal producers (andpromoters) of large cars and have historicallyearned their greatest profit margins on these cars.
The strains placed on the domestic industry,as it redesigns its products and retools its facilitiesfor fuel efficiency in the near and midterm,6 are
the forces that could most appropriately be tar-geted and eased by Government policies. In addi-
tion, because of the size and dispersion of theU.S. auto industry throug hout t he na tiona l eco n-
omy, maintaining the hea lth of the industry andminimizing the side effects on both upstream ac-
tivities (e.g., dealers, suppliers), and downstreamactivities (e.g., consumers) are of potentially greatGovernment concern.
Some aspects of the domestic industry’s short-
term readjustment problems are caused by econ-
omywide factors such as rising energy prices, tightc red it, and high interest rate s. These fa c tors haveaffected both manufacturers—by making capital
scarce and expensive—and consumers, who(with approximately two-thirds of all purchaseshistorically being on credit) are deferring pur-chases.
The market change s assoc iated with high ga so-
line pric es and the threa t o f g asoline shortag esexperienced in the 1970’s have shown that con-sumer demand is the most powerful influence onthe rate and manner of fuel-efficiency increases.However, the prices consumers will pay, and thetradeoffs consumers will accept in vehicle attrib-
utes—of which fuel efficiency is only one—arehighly unce rtain a nd am biguous. For examp le,in the mid-1 970’s, and again in 1980-81, the pro-
portion of relatively small cars purchased to largecars purchased decreased. * Furthermore, con-sumers did not consistently buy the most fuel-efficient car in a given size class. The ability ofthe industry to sell cars is made additionally diffi-cult because there has been a steady slowing inthe total demand for automobiles due to stagnantper ca pita d isposab le income and a general aging
of the population, implying that the industry ismainly serving a domestic replacement rather
than g row th ma rket. And a t the sam e time, im-po rts have c ap tured an inc rea sing share of t hedomestic market.
The nee d to m ake large investments under con-
ditions of uncertain demand for fuel efficiencyand slowing overall demand for automobiles, ag-
grava ted by ec ono myw ide stresses, is the mo stsignific ant c ontributo r to the financ ially preca ri-ous position now facing the domestic auto indus-try. Losses to U.S. auto manufacturers exceeded
$4 billion in 1980. As sales have decreased, prof-its have declined, and the industry’s longstanding
ability to reinvest with internally generated fundshas decreased. Because the industry is capital-in-tensive, any underutilization of capacity also im-plies large costs. Large amounts of outside capi-
tal will be required to retool for increasing fuelec onomy. If com pa nies are force d to c ut bac kon their capital investment programs in the nearterm (as some are doing), they will not only fore-stall fuel-efficiency improvements but may alsobecome increasingly vulnerable to foreign com-petition. 7
In adjusting to this, U.S. manufacturers face a
series of complex decisions. Domestic manufac-s~ee ~lso us. /nduStrja/ Competitiveness-A Comparison ofstee(
Electronics, and Automobiks, OTA-ISC-135 (Washington, D. C.: U.S.Congress, Office of Technology Assessment, July 1981).
K3ee General Accounting Office, “Producing More Fuel-EfficientAutomobiles: A Costly Proposition,” CED-82-14, Jan. 19, 1982.
*These data include both domestically produced and importedcars.
7U. S. Industrial Competitiveness, op. cit.

8/14/2019 Increased Automobile Fuel Efficiency and Synthetic Fuels: Alternatives for Reducing Oil Imports
http://slidepdf.com/reader/full/increased-automobile-fuel-efficiency-and-synthetic-fuels-alternatives-for 47/292
Ch. 3—Policy q 4 1
turers’ weak competitive position is primarily due
to high p rod uct ion co sts relative to foreign p ro-duc ers and c onsumers’ pe rc ep tions of va lue indomestic v. imported cars, that are difficult toquantify. If a strong demand for fuel efficiencydevelops, rapidly increasing the fuel efficiency ofdomestic automobiles could help to sell them.Demand for fuel efficiency, however, is usuallyaccompanied by a shift in demand to smallerc a rs, the market a rea w here U.S. manufac turershave b een least c om pe titive w ith imp orts. Thisshift would therefore also require that domesticmanufacturers devote some of their investments
to changes unrelated or only partially related tofuel efficiency. Corporate strategy, the way com-plex investment decisions are handled, overalldem and for new c ars, and the de ma nd for fuelefficiency vis-a-vis other attributes of automobileswill all interac t in a c omp lex way to affect the ac -
tual rate at which fuel effic ienc y increases.Technological uncertainties will also figure in
determining fuel efficiencies actually achieved.These unc ertainties rela te to the b eha vior of va ri-ous elements of the vehicle system, the way inwhich these e lements are integrate d and po ssi-ble performance tradeoffs among elements, andthe cost of specific manufacturing techniques.The rate of prod uc t and proc ess de velopm ent,and particularly the success of the development
effo rts (by no me ans assured) will influenc e theextent of fuel-efficiency increases. Basic researchcould lead to additional fuel economy gains by
providing a better understanding of some of thecomplex processes related to fuel consumption
(e.g., nonsteady-state combustion).
The single most important factor limiting thedeve lopm ent o f elec tric vehic les (EVS) is ba tterytec hnology. Even if EVS we re to be c om e p rac ti-
cal, however, they would not have the potentialto displac e signific ant am ounts of imp orted oil,primarily because they would be substitutes forthe most fuel-efficient gasoline or diesel-poweredc a rs. The Gove rnment c ould justify ac c eleratingthe d evelop ment and introduc tion of EVS if the
goal is to reduce automobile pollution in theinner cities or to promote a transportation modetha t d oe s not use p etroleum. EVS a re p etroleumindependent except insofar as electricity is gen-
erated from oil.
Automobile Fuel Efficiency—Policy Background
The industry has bee n reg ulate d b y Govern-ment policies and programs primarily since the1960’ s. Worker and public he a lth and sa fety a s-pects are regulated by the Environmental Protec-
tion Agenc y (EPA) and the Oc c upa tional Safetyand Hea lth Administrat ion; p rod uct safe ty a ndemissions by the National Highway Traffic Safe-ty Administration (N HTSA) and EPA. Auto salesare affected by all policies that influence consum-er de ma nd. In the a ftermath of the 1973-74 oilembargo, the Government became actively inter-ested in promoting automobile fuel efficiency,and legislation was subsequently enacted to re-
duce U.S. dependence on oil imports.
Policy for increasing automobile fuel efficien-c y is em bod ied p rincipa lly in two p rogram s. * Theprincipal policy instrument for increasing fuel effi-
ciency was established by the 1975 Energy Policy
and Conservation Act (EPCA) and specifies CAFE(i.e., fleet) standards for new cars and light trucks
betw een the mo del yea rs 1978 and 1985. Provi-sions of the CAFE p rog ram have ge nerally triedto recognize the financial difficulties of the auto
industry. CAFE standards mandate that new-carfuel efficiency will double, incrementally, be-tween the early 1970’s and the mid-1980’s.(American-made cars had averaged about 14 mpgover the period 1965-75; the 1985 CAFE stand-ards require fleet averages of 27.5 mpg and areto rem ain in force aft er 1985.**) Subseq uent pro-visions in the Fuel Efficiency Act of 1980 easedthe c omplianc e req uireme nts of the CAFE pro-gram, but the basic efficiency standards remain
in force . Possible a lteration of the sta ndards setby the p rog ram for post-1 985 could b e a ma jorpolicy issue coming before Congress.
a The sources ancJ magnitude of these cost advantages are not well
understood. Understanding the nature of any cost advantages en-joyed by competitors will be critical for determining how, when,and if U.S. manufacturers can get their cost structure into line, SeeU.S. Industrial Competitiveness, op. cit., pp. 96-99.
*A third program was enactment of the 55-mph speed limit.**The Energy Policy and Conservation Act provided guidelines
for the Department of Transportation to set standards for the early1980’s; Congress set standards for 1978 and 1985.

8/14/2019 Increased Automobile Fuel Efficiency and Synthetic Fuels: Alternatives for Reducing Oil Imports
http://slidepdf.com/reader/full/increased-automobile-fuel-efficiency-and-synthetic-fuels-alternatives-for 48/292
42 . /ncreased Automobjile Fuel Efficiency and Synthetic Fuels: Alternatives for Reducing oil Imports
The sec ond ma jor p rogram , pa rt of the 1978National Energy Act, establishes excise taxes for
purchases of automobiles with low fuel-economyratings beginning in the model year 1980. Cur-rent “gas-guzzler” taxes range from $200 for carsrate d a t 14 to 15 mpg in mod el year 1980 up to$3,850 for specialty cars rated under 12.5 mpgbeg inning in model yea r 1986. Suc h ta xes raisedonly $1.7 million in fiscal 1980.9
OTA’ S ana lysis indic a tes large unc erta inties inboth economic and noneconomic costs of fuel-ec ono my increa ses. OTA ha s also ident ified un-certainties in demand for fuel-efficient cars asc ritica l to inc rea sing fuel effic ienc y. These unc er-tainties, together with the desire of domestic man-
ufac turers to serve a wide variety o f c onsumertastes with a limited level of capital investment,are mainly responsible for the industry’s reluc-tance to accelerate the development and intro-
duction of fuel-efficiency increases. Until fuel ef-ficiency is a–or perhaps the–major selling pointfor new c ar buyers, this relucta nce, under-standably, is likely to continue.
Factors Affecting the Rate ofSynthetic Fuels Production
Unlike increasing automobile fuel efficiency,which may entail restructuring a major existingU.S. industry, production of synthetic fuels in-volves the emergence of a major new industry. *The c osts and the refore the p rofita b ility of pro-
ducing synfuels are influenced by major uncer-tainties that both characterize the economy asa whole and are specific to the synfuels industry.At the ec onom ywide level, fac tors suc h as thepric e o f oil, the c ost of c ap ital, inflation in ge neraland hyperinflation in the construction industries,
‘Congress rejected 60 proposals to tax purchases of inefficientnew cars and 19 proposals to raise gasoline taxes between 1973and 1977. In 1977, President Carter proposed a stringent “gasguzzler” tax keyed to CAFE standards which included a rebate pro-gram for purchases of especially efficient cars (which Congress de-cided would violate the General Agreement on Tariffs and Trade—orGAIT). When the current excise taxes were enacted, critics argued
that they would save only 10,000 bbl/d of imported oil, while theCarter proposal, with higher taxes applied to more vehicles, wasestimated to be able to save 170,000 bbl/d (New York Tim es, Dec.10, 1978).
*The liquid and gaseous fuel industry may also undergo a restruc-
turing, however. Synfuels development will tie up capital in consid-erably larger blocks and for longer periods than historically experi-enced by the industry. A concentration of ownership is also likely.
and the availability of appropriate labor and mate-rials will determine the financial risks that mustbe a ssumed by investo rs. Like the a uto industry,the synfuels industry is capital-intensive. A mod-erately sized (50,000 B/ DOE) fossil synfuels plantcould require an investment of $2 billion to $5billion; the industry’s growth and ability to attract
c apita l will thus be highly sensitive to the invest-ment climate.
The major co nstraint on the de velopm ent o fa synfuels industry is the technical uncertaintyassociated with synfuels processes. There is essen-tially no d omestic c ommercial experienc e w ithsynfuels processes, and processes and designconcepts have not yet been adequately demon-
strated at a commercial scale. It is thus con-ceivable that design errors and unexpected oper-ational problems could delay construction orcause a completed facility to be inefficient, even
a “ white elephant” ope rating at only a fractionof its capacity or at greatly higher cost than antic-ipated. As with any capital-intensive industry,there are high costs associated with the underutili-zation of capacity.
Synfuels prod uc tion will be an a ttrac tive invest-ment if investors view the technical risks as beinglow (i.e., commercial-scale demonstration unitsare successful) and they expect oil prices to risesharply in the future, or if they want to securean early market share in case synfuels do become
c om pe titive w ith the o il ma rket. Unless oil pric esrise more rapidly than synfuel construction costs,however, synfuels plants may not be economical-ly attractive even after the processes are proven
and the technical risk is small.
Synthetic Fuels Production—Policy Background
Cong ress c reate d the Nationa l Synfuels Produc -tion Program (NSPP) under the Energy SecurityAc t of 1980 (ESA) to p rom ote the rap id de velop -ment of a ma jor synfuels prod uct ion c ap ab ility.Spec ific goa ls a re set for 500,000 B/ DOE by 1987
and 2 MMB/DOE by 1992.10
0IOsynthetic substitutes for petroleum and natural gas are the focus
of the NSPP; other programs support development of synthetic fuelsfrom biomass. Biomass subsidy options have been reviewed in de-tail in the Ot%ce of Technology Assessment’s Energy From Bio/ogica/
Proc esses. For the NSPP definition of synfuels see Public Law 96294,
sec. 112 (17) (A).

8/14/2019 Increased Automobile Fuel Efficiency and Synthetic Fuels: Alternatives for Reducing Oil Imports
http://slidepdf.com/reader/full/increased-automobile-fuel-efficiency-and-synthetic-fuels-alternatives-for 49/292
Ch. 3—Policy q 4 3
In the first of three p hases, the Dep artment ofEnergy (DOE) was authorized to offer financialincentives for the production of alternative or syn-
thetic fuels. The original authorizing legislation(Public Law 96-1 26) made about $2.2 billion avail-able, mainly for purchase commitments or priceguarantees pursuant to the provisions of the Fed-
eral Nonnuclear Research and Development Actof 1974; total funds were subsequently increasedto approximately $5.5 billion. ’ 11
ESA created the Synthetic Fuels Corp. (SFC) inthe second phase as a quasi-investment bank, toprovide incentives to promote private ownershipand operation of synfuels projects. SFC is backedby funds dep osited in a spe c ial Energy Sec urityReserve in the U.S. Treasury and to be used forfinancial assistance in the form of: 1 ) price guar-antees, purchase agreements, and loan guaran-tees; 2) direct loans; and 3) support to joint ven-
tures. ” The g ove rning b oa rd o f SFC c an d ec ide11This figure does not include an additional $1.27 billion that has
been made available for biomass energy, including alcohol fuelsand energy from municipal waste. For further details on this legisla-tion, see Public Law 96-294, Public Law 96-304, and the CRS issuebrief (No. MB70245) “Synthetic Fuels Corporation, Policy and Tech-nology,” by Paul Rothberg.
During the interim program, DOE awarded, in a first “round,”$200 million of these funds, half each for feasibility studies and forcooperative agreements. Of the first $200 million, approximatelytwo-fifths, or $80 million were for biomass projects, while the re-mainder went to synfuels activities. DOE has in past years also pro-vided support for a variety of research and demonstration activitiesto support synfuels development.
DOE originally planned a second “round” of awards for feasibilitystudies and cooperative agreements, but at the request of the
Reagan administration the $300 million authorized for these awardswas rescinded as an economy measure.
*ln its guidelines to investors, SFC indicates that it strongly favors
price guarantees, purchase agreements, and loan guarantees, which
emphasize “contingent liabilities. ” The cost to the Governmentof such aid varies with the success of the assisted projects; it is min-
imized when projects produce synfuels that can be priced competi-tively with other fuels. To prevent overconcentrating funds, SFCcan give no project or person more than 15 percent of its authorized
funds, which is about $3 billion during its early years (1981-84).In the case of loan guarantees, SFC cannot assume a financial liability
for more than 75 percent of the initial estimated cost of the proj-ect, requiring the assisted company or companies to risk a sizableamount of their own funds. Although there are broad guidelines,the terms of each award will be negotiated separately with projectsponsors.
None of the contingent liability incentives available to SFC can
exceed the amounts held for SFC in the U.S. Treasury; that is, SFCcannot “leverage” its funds by guaranteeing loans in excess of itsactual reserves. In the period since the passage of the synfuels legis-
lation, estimates of the cost of commercial-scale synfuels plants have
continued to increase; therefore, unless investors are willing tonegotiate guarantees for smaller percentages of project costs thanallowed by legislation, the amount of synfuels produced by the sub-sidy program may be much smaller than originally anticipated.
which DOE projects it will take over once thebo ard be c omes fully operational. Tota l fundsauthorized for SFC are approximately $17 billionthrough June 30, 1984.12
The third p ha se o f the NSPP is to beg in in mid-1984, at which time Congress may appropriate
an ad ditional $68 billion on the ba sis of a c om-prehensive synfuels development strategy to besubmitted by the SFC board. SFC is scheduledto lose the authority to make awards in 1992 andto be termina ted in 1997. Som e rev ision o f NSPPda tes, goa ls, and/ or financ ing m ay ha ve to bemade if the production of synfuels falls short ofthe origina l NSPP goa ls—as is exp ec ted . In OTA’ S judgment, Congress is unlikely to have sufficientinformation by 1984 about the technical aspects
of synfuels processes to be able to make long-term synfuels decisions.
SFC ha s rece ived c ont inued p olitic al suppo rt,and the administration is committed to ensuringthe development of a commercial synfuels indus-try, as announced in its A Plan for Economic Recovery (Feb ruary 1981 ). In a dd ition DOE ha scommitted about 50 percent of its approximate-ly $5.5 billion, and provisional commitments have
been made to two projects. *
Reflecting a recent major policy change how-eve r, Go vernme nt supp ort is now to e mp hasizelong-range, high-risk research and development(R&D) activities that are unlikely to receive privatesponsorship. This shift is likely to have differenteffects on the two main types of synfuels projects:1) projects designed to test and demonstrate aker-
native design concepts, learn more about the de-
tails of the processes involved, and gain operatingexperienc e (de mo nstration plants); and 2) proj-ects designed to demonstrate commercial-scaleproc ess units (CSPUs).
Demonstration plants are generally smallerthan commercial-scale plants and are not in-tended to earn a profit. Under the new policies,
DOE programs to support demonstration plants
ISynthetic Fuels corp , , “Assisting the Development of SyntheticFuels,” p. 1. The $17-bilIion figure is an approximation. SFC isauthorized to spend up to $2o billion, but the money obligatedin the interim program is to be subtracted from the larger figure.
*These are a loan guarantee of up to $1.5 billion to the GreatPlains Coal Gasification plant in North Dakota and an as yet un -
negotiated assistance agreement with the Union Oil Co, oil shaleproject (product purchase guarantee).

8/14/2019 Increased Automobile Fuel Efficiency and Synthetic Fuels: Alternatives for Reducing Oil Imports
http://slidepdf.com/reader/full/increased-automobile-fuel-efficiency-and-synthetic-fuels-alternatives-for 50/292
. .
44 . Increased Automobile Fuel Efficiency and Synthetic Fuels: Alternatives for Reducing Oil Imports
are being terminated, but these projects presum-ably can apply to SFC for support.
If CSPUs can be made to o perate prop erly, sev-
eral such units might be built and operated inparallel in a commercial synfuels plant. Becausethe process unit is intended to be part of a com-
mercial synfuels plant, support for CSPU demon-strations continues to be available through SFC,under the new administration policies.
Termination o f DOE supp ort ma y lead to c an-cellation of several demonstration plants, sincethey must now compete against more developed
technologies for SFC support. * This would resultin a poorer understanding of various synfuelsproc esses and a na rrower rang e of te c hnologyoptions available to potential investors. It couldalso reduce the prospects for commercializingplants capable of producing fuels from a variety
of c oa ls found in different reg ions of the c oun-
*Apparently as a result of reduced Government interest in directlypromoting synfuels, three projects previously supported by DOEhave been canceled (SRC 11 and two high-Btu gasification projects,the Illinois Coal Gasification Project and the CONOCO Project in
Noble County, Ohio). Four additional demonstration projects arecontinuing with reduced levels of DOE support and their futuresare in doubt: H-Coal, EDS, Memphis Medium-Btu, and SRC 1. Atleast one upcoming project, not yet at the demonstration stage,has also been canceled in light of recent developments (a Iow-BtuCombustion Engineering project).
try.13 Finally, processes with the greatest immedi-
ate (i.e., not necessarily long-term) commercialp romise a re likely to b e fa vored by SFC in orde rto meet production targets. *
Although every commercial-scale process willhave gone through a demonstration plant stage,
the design of the CSPU will also be based on nu-merous other sources of relevant information.Terminating de mo nstration p lant p rojec ts will re-
duc e this po ol of information, thereby inc rea s-ing the risks tha t C SPUS will not func tion p roperlyand red ucing the de sign op tions for correc tingma lfunctions. Developm ent of p rom ising long erterm synfuels p roce sses ma y a lso b e d elaye d oroverlooke d entirely. For these reasons, it is OTA’ S
judg me nt tha t DOE’s termination of supp ort fordem onstration p lants is likely to red uc e the rateat which a synfuels industry is built.
1 JSee paul Roth berg, ‘‘Coal Gasification and Liquefaction, ” CRS
issue brief No. IB77105, Aug. 12, 1981.*Legislation calls for SFC to consider a wide range of alternative
synfuels technologies in order to broaden industry’s experience withthe technical and economic characteristics of many processes. Thisrequirement may conflict with the mandate to meet productiontargets—targets that already appear unrealistic.
POLICY OPTIONS
This sec tion eva luates the ma jor policy op tionsavailable for displacing oil imports generally andspecifically for stimulating auto fuel-efficiency in-
creases and synthetic fuels prod uc tion. The eva lu-
a tion is based on the industry charac teristics sofar discussed and on the technical analysis whichap pe ars late r in this repo rt. In p a rtic ular, the im-pacts of several policy options that have recent-ly received congressional attention are estimated.
Note, however, that policies are not discussed
in the context of emergency oil shortfalls.
The policy choices available to Congress dif-fer along several key dimensions: 1) the rate and
degree of oil import displacement; 2) the degreeand specificity of Government intervention andbudgetary effects; 3) the types, magnitude, and
d istribu tion of bene fits and c osts; 4) imp lic a tionsfor the long -term, susta inab le, and c ompe titivehealth of the affected industries; 5) the relation-
ship of the choices to other Government pro-gram s; and 6) the fea sibility of future a c tions. The
selection of policy instruments and resulting

8/14/2019 Increased Automobile Fuel Efficiency and Synthetic Fuels: Alternatives for Reducing Oil Imports
http://slidepdf.com/reader/full/increased-automobile-fuel-efficiency-and-synthetic-fuels-alternatives-for 51/292
Ch. 3—Policy 45
tradeoffs will reflect the priority ascribed to eachdimension. Policies can generally be designed ei-
ther a s incentives or p ena lties, ince ntives mo reclosely approximating the conventional market-place. Policies can be directed at either economy-wide o r sec to r-spec ific me asures.
Economywide Level.–’’Economywide” policychoice s are c onc erned with overall econom icand business c ond itions—as me asured by suc hindicators as inflation, unemployment, and inter-
est rates—that determine the financial health, in-vestment climate, and productive capabilities of
U.S. industries. Fisc a l and mo netary policies arethe primary instruments in this category; othermeasures could promote innovation, regulatoryreform, technology development, and human re-sources develop ment. Suc h G overnment po lic iesgenerally seek either to remove or to reduce im-
pediments to a strong and stable economy, aswell as to raise business and consumer confi-dence in the face of changing economic c ondi-tions. The a dvan tage of suc h p olic ies is tha t the ycan be directed at many industries, although theywill have different impacts on the various affectedindustries. They a re mo st c om mo nly preferred asa co mp lement to m arket forces, bec ause theirscope enables them to enlist the broadest baseof support, and they are best equipped for inte-
grating a wide range of economic and social ob-
jectives. General economic policy, however, hasonly limited ability to promote the displacement
of oil imports and to stimulate specific actions,and may indirectly distort capital flows amongoil displacement alternatives.
Automobile fuel efficiency and synfuels pro-duction (as well as fuel switching and conserva-
tion in stationary applications) are influenced by
such economywide factors as high interest rates,tight credit, increasing resource costs, andchanges in real disposable income. As for theauto industry, gene ral ec onom ic c ond itions in-fluence the ability of consumers to buy cars and
the ability of manufacturers and suppliers to in-
vest in needed changes. General economic policycould help to stimulate demand for automobilesby lowering the costs of consumer credit and by
ma king c red it ava ilab le. Strong de ma nd for newcars, together with stimuli that reduce the effec-
tive costs of capital and retooling can, in turn,stimulate the supply of fuel-efficient automobiles.
Economywide measures, however, would notinduce consumers to buy domestically manufac-tured vehicles rather than imports; and they couldhave a mixed effect on local automobile produc-
tion and employment. Economywide measuresmay facilitate investments by foreign firms in U.S.facilities, but they also assist investments by localproducers in labor-saving equipment and invest-
ments by domestic manufacturers in low-costproduction facilities abroad. These investmentsmay ensure the financial health of individual,American-owned firms, but attendant reductionsin domestic employment may aggravate regional
economic problems.
Deployment of synfuels production capacitywill also be sensitive to general economic condi-
tions: interest rates not only influence the availa-bility of capital for building plants; the capitalcosts also help determine whether products canbe priced competitively. Once established, how-ever, the synfuels industry is expected to be rela-tively insensitive to general economic conditionsto the extent tha t synfuels a re indistinguishablefrom conventional fuels and are competitivelypriced, and the plants do not require frequentretoo ling . Based on the ana lysis provided in thisrepo rt, it is OTA’ S judg me nt tha t favo rable ec on-
om ywide c ond itions, by the mselves, a re still un-likely to provide sufficient incentive for private
firms and investors to accelerate the commerciali-zation of a synfuels industry because of the largetechnical risks associated with as yet commercial-ly unproven synfuels processes.
Sector-Specific Leve l .–Policies c an b e a imedat spe c ific industries to stimulate industria l com -petitiveness, ease the adjustment of firms to new
ec onom ic c ond itions (rap id growth, short-termdistress, or long-term decline), or to promote theac hievement of na tional or regional objectives(e.g., national sec urity, reg iona l de velopm ent).To fo rmulate p olic ies a t this leve l, ana lyses of ind i-
vidual sectors and linkages among sectors areessent ial. The ma jor disadvanta ge s of suc h p oli-cies are that they do not always address the un-derlying causes of market distortions and theydiscriminate against other industries which are

8/14/2019 Increased Automobile Fuel Efficiency and Synthetic Fuels: Alternatives for Reducing Oil Imports
http://slidepdf.com/reader/full/increased-automobile-fuel-efficiency-and-synthetic-fuels-alternatives-for 52/292
46 INreased Automobile Fuel Efficiency and Synthetic Fuels: Alternatives for Reducing Oil Imports
not similarly assisted. in terms of the auto indus-try, sector-specific policies would be most effec-tive if they addressed the market risk, which isa major factor determining the rate of fuel-ec ono my improve me nts. The ma jor c onstraint onrap id d ep loyment of a synthet ic fuels industry istec hnic al unce rtainty with respe c t to unprovenprocesses and, currently, the cost of conventionaloil products.
Economywide Taxation—Oil andTransportation Fuels
General taxation measures are one vehicle for
stimulating c ap ita l investme nt a c ross the ec on-omy. Economywide taxation measures that spe-cifically relate to displacing oil imports are taxeson oil imports, on oil in general, and on transpor-tation fuels (e.g., gasoline and diesel fuel) in par-
ticula r. To the e xtent tha t the Na tion’ s ene rgy“problem” is defined as dependence on insecureforeign sources, an oil or transportation fuel taxwould promote security by reducing oil demand.How ever, an oil or ga soline ta x could be c ounter-
productive to the degree that the energy “prob-
lem” is defined as a lack of relatively low-cost,high-quality fuels. Consumers may oppose an oilimport tax, even though its impact would beminor c ompa red with that o f large OPEC p ric eincreases, as was the case when an oil import taxof $0.33/ bb l was in effec t b riefly during the Fordadminstration. Its impact, if any, was minor in
comparison with that of OPEC’s hikes.Oil taxes c an be imposed either on oil generally
or on oil imports in pa rtic ular. The a dvan ta ge sof an oil tax arise because of three features. First,the tax wo uld ma ke all uses of o il mo re e xpe n-sive without prejudging which kinds of adjust-ments would b e m ost d esirab le. A gene ral ta x on
oil would thus red uce c onsump tion and , in turn,impo rts. Sec ond , the ta x could b e d esigned toisolate c onsume r oil pric es from reduc tions in in-ternational oil prices. For example, if OPEC pricesremain steady through 1984 and if inflation con-
tinues at current rates, the real price of oil couldde c line b y as muc h as 20 to 30 perce nt d uringthis period. While perhaps beneficial to con-sumers in the short term, declining real prices for
petroleum p roduc ts would p roba bly lead to in-
c rea sed pe troleum de ma nd. C onsistent pric e sig-nals wo uld also provide assuranc e bo th to theauto industry that demand for fuel-efficient carswould be at least sustained if not increased, andto synfuels developers that they would receiveat least a c onstant rea l pric e fo r their produc ts.Finally, tax revenues could be used, for exam-ple, to support import displacement investments,or to offset some of the potential adverse effectsof the tax (e. g., to fund income support pro-grams).
Taxing o nly c rude o il, howe ver, and not itsproducts could reduc e the international c omp et-itiveness of industries heavily dependent on oil—
such as refineries and petrochemical companies. *Furthermore, because oil taxes do not differen-tiate among industries that use oil, they are noteffective means of altering the competitive posi-tion of either automobile fuel economy or syn-
fuels production relative to any other method fordisplacing imports (if such alteration is desired).Suc h taxes c ould a lso c ontribute to infla tion gen-erally and wo uld be pa id for disprop ortiona telyby consumers with low incomes. Compensatoryprograms and payments could deal with suchside effects, but at additional implementation andadministrative e xpense.
Taxes ta rge ted at only oil imp orts c ould d isc rim-inate against companies, and regions of the coun-
try, that a re hea vily de pe nde nt on impo rted oil.It is more likely, however, that import taxes
would cause the general price of oil to increaseto a level close to the p rice o f taxed imp orts. AnygeneraI price increase, in turn, would create addi-
tional revenues for domestic petroleum produc-
*lt is possible that refining activities would relocate overseas unless
additional import restrictions were also imposed. With respect tosynfuels production, refiners might be able to cut profit marginsand continue to process and sell oil at prices below synfuels pricesin order to maintain refining volumes (which are already rather low).Because many old refineries do not have capital charges, refiningcosts would be dominated by the variable costs of about 15 to20¢/GALproduct plus the oil acquisition costs. Consequently, taxesmay have to raise the cost of imported oil to within about $6/bblof synfuel product (150gal of gasoline equivalent) to ensure that
the refiners cannot economically use oil imports as copetitors forsynfuels. This would directly harm some companies ened in oilrefining, but this may be a necessary tradeoff to ensure that syn-fuels actually displace imported oil, rather than act to reduce domes-
tic petroleum product prices and thereby discourage a reductionin domestic oil consumption.

8/14/2019 Increased Automobile Fuel Efficiency and Synthetic Fuels: Alternatives for Reducing Oil Imports
http://slidepdf.com/reader/full/increased-automobile-fuel-efficiency-and-synthetic-fuels-alternatives-for 53/292
Ch. 3—Policy q 4 7
ers. The to ta l revenues ge nerated by an imp ortta x would thus be only partially rec eived b y theGove rnment. Com pa red with a ge neral oil tax,an import tax is thus likely to result in a smallerfraction of revenues being available to the Gov-
ernment for additional import displacementmeasures or to offset any adverse impacts ofhigher oil pric es. The wind fall profits ta x ca p turessome a dd itiona l revenue, b ut is mo re c omplexto administer than a general tax on all oil.
Another disadvantage of an import tax, fre-quently discussed, is the possibility that oil export-ing nations might see the acceptance of added
c ost by U.S. users as an indic a tion tha t the ir c rudeprices could be further increased without reprisal
or eco nom ic hardship. This ob jec tion prob ablyis not valid, however, during times of crude oilsurplus in the producing nations.
With respe c t to transpo rta tion fuel c onsump -tion, a ta x either on o il or on transpo rtation fue lsreduces demand for all uses of transportation fuel,
including automobile travel, as well as increas-ing the relative demand for fuel efficiency. Itcould reduce new-car sales, however, and could
also reduce the profitability of truck transports,agriculture, airlines, tourism, and other fuel-dependent industries. Taxes on only gasolinewould avoid some of these problems, but theycould encourage the purchase of diesel-fueledautomobiles.
Ga soline ta xes in this c ount ry have increa sedonly slight ly during the pa st tw o d ec ad es.l A TheFederal tax has been $0.04/gal since 1960, whilethe a verag e Sta te t ax ha s increased from $0.065
to $0.08/g al. A ga soline ta x that increa sed thepric e o f gasoline by, say $0.05/ga l (i.e., a 3-per-cent increase over a $1.50 price) would raiseabout $5 billion per year at current consumptionrates, as would a $1 .00/bbl crude oil tax. I n order
to offset inflation since 1960, the current gasolinetax would have to increase by about $0,1 5/gal.Taxes on gasoline are significantly lower in theUnited Sta tes than ab roa d. *
~4S ee Hans H. Landsberg, Energy Po/;cy Tasks for the 1980s, RFF
reprint 174 (Washington, D. C.: Resources for the Future, 1980).*Taxes on gasoline (per gallon) in 1979 were, as examples, $1.59
in France, $0.88 in the United Kingdom, $1.14 in West Germany,and $1.58 in Italy.
The ultimate effect an oil, gasoline, or dieselfuel tax wo uld have in displac ing oil imp orts de -pends on at least three factors. First, the effective-ness of the tax in the long run depends on theactual purchase and use of fuel-efficient vehicles.
Estimates of the responsiveness of demand (its“elasticity”) to changes in gasoline, auto, andother prices va ry widely from stud y to stud y, butthey sugg est tha t a tax on c rude oil or transpo r-tat ion fuels wo uld have to b e relatively large tomotivate consumers to trade in their relatively in-efficient cars for more efficient ones. ’ 5 Note,however, that tax provisions per se would not dif-ferentiate between domestic and foreign manu-
facturers except insofar as one produces morefuel-efficient vehic les.
Sec ond ly, tax imp ac ts will dep end on final oilor fuel pric es. The entire ta x amo unt nee d notbe passed onto consumers if producers are able
to m aximize p rofits by low ering the p ric e o f ga s-oline, ab sorbing p art of the tax, and inc rea singsales. As long as demand for oil is slack relativeto supp ly, at lea st p art of the tax will be ab sorbed
by producers.
Finally, the e ffec t o f ta xes will dep end on thedeg ree to which d riving is red uc ed . While OTA’ Sanalysis of oil savings attributable to fuel economyimprovement assumes a steady increase in vehi-
c le miles trave led (VMT) (bu t a d rop in VMT perca pita), lower total VMT induced by high g asolinepric es wo uld inc rease a c tua l oil savings. * How -
ever, this could also reduce car sales.While gasoline stations and refineries would be
affected by reduced demand, industry analystsalready expect that the number of service stationsand refineries will decline in the 1980’s. Remain-
IsDemand response is difficult to quantify because there is only
limited past experience with periods of gasoline price increases(“preenergy crisis” conditions appear to be of limited value for pre-dicting “postcrisis” consumer behavior); crude oil and transporta-tion fuel prices affect consumers in dynamic, multiple ways to alterreal income and demands; and it is difficult to understand demandresponse when vehicles have many different attributes, of whichfuel efficiency is only one. (See Motor Vehic/e Demand Mode/s:
Assessment of the State of the Art and Directions for Future Re- search, prepared by Charles River Associates, Inc., for the U.S.Department of Transportation, April 1980.)
*For example, OTA estimates that about half of the 0.5 MMB/Dreduction in gasoline consumed by autos in 1978-80 was due toreduced driving, while about half was due to increased efficiencyof vehicles in use.
8/14/2019 Increased Automobile Fuel Efficiency and Synthetic Fuels: Alternatives for Reducing Oil Imports
http://slidepdf.com/reader/full/increased-automobile-fuel-efficiency-and-synthetic-fuels-alternatives-for 54/292
48 . Icreased Automobileel Efficiency and Synthetic Fuels: Alternatives for Reducing Oil Imports
ing stations and refineries should be financiallystronger and better able to adapt to gasoline priceincreases. Any reduction in highway trust fundrevenues could presumably be balanced by pro-ceeds from the ga soline ta x or othe r taxes.
Economywide Taxation—
Special ProvisionsSpe c ial taxation p rovisions are ofte n ap plied a t
the ec onom ywide level to p romo te investment(e.g., by enc ourag ing c ap ital formation and re-structuring cashflow positions). Examples of suchprovisions are investment tax credits, deprecia-tion allowances, R&D tax credits, and capitalgains. As with other taxes, special taxation provi-sions could have differential impacts on industriesand distort private returns to capital. Both theauto and synfuels industries (as well as the elec-
tric utility industry), being capital-intensive, could
bene fit from spec ial taxing p rovisions. The scop efor additional special taxing provisions, however,is believed to be limited because of the many ex-
isting provisions,
Although a firm would generally have to beprofitable to take advantage of special taxationprovisions, tax credit sales rules have been ex-panded and liberalized to give unprofitable firmsthe chance to sell their investment tax credits andde prec iation rights. The auto industry has alrea dytaken advantage of liberalized rules for selling taxc redits.lb This type of sa le c an help to strengthe n
the financial position of the auto industry, al-though it does not directly encourage increasedfuel economy.
It is speculative to analyze how special taxingprovisions would stimulate investment in syn-fuels. Special taxing provisions have historicallybeen applied at the sector-specific level for do-mestic oil producers in the form of special depre-c iation allow anc es, and c urrently for expe nsingdrilling costs and for foreign tax credits.
l cFOr example, FOrd Motor Co., with losses in excess of $700 mil-lion in 1981, sold its tax credits on 1981 equipment purchases forsomewhere between $100 million and $200 million to IBM (kVash-
ington ~05t, Nov. 1 1 , 1 9 8 1 ) .
Research and Development
Government policies and programs could stim-ulate technical R&D at either the economywideor sector-specific levels to help displace oil im-ports. The p rima ry rationa le for Go vernment sup -
port of R&D is that there are social benefits from
R&D which surpass private gains, in large part be-c ause o f high front-end lea rning c osts. in a ddi-tion, the Government tends to support researchthat is too risky for private funding, and whichdoes not, for a variety of reasons, attract privateinvestment in the short term. A major advantageof Government support for R&D is that programscan assist the e c ono my, and spec ific industries,without direct intervention. However, the typesof basic research that Government has tradition-ally supported often have benefits only in the longte rm, so a nea rer term o il import savings imp liesGovernment involvement in shorter term R&D
areas. Applied R&D also offers the opportunityfor the Government to acquire equity in projectsor royalties from the results of the R&D.
EconomyWide R&D support could be designed
to stimulate opportunities for displacing oil im-ports generally and for both increasing automo-
bile fuel efficiency and accelerating synfuels pro-duction. Such measures could, as examples,sponsor basic research, promote the climate fortechnical innovation (e.g., increasing the rewards
to innovators through patent laws and/or specialta x inc ent ives), or esta b lish m ec ha nisms for as-semb ling and disseminating tec hnic al informa -tion. Such nonspecific support, however, is un-likely to have much impact on resolving the spe-cific technological uncertainties that impede both
auto fuel-efficiency increases and synfuels devel-opment.
Although the Government has supported sec-tor-spe c ific R&D in the pa st, po lic ies have seldo msupported product development with direct com-mercial application except in agriculture andnuclear power. Research to increase automobilefuel economy and to develop synfuels, as wellas other technologies for displacing oil imports,
would have direc t com mercial ap plica tion.

8/14/2019 Increased Automobile Fuel Efficiency and Synthetic Fuels: Alternatives for Reducing Oil Imports
http://slidepdf.com/reader/full/increased-automobile-fuel-efficiency-and-synthetic-fuels-alternatives-for 55/292
C h . 3 — P o l i c y 9
There ha s not yet b een a ny substantial Govern-
ment support for R&D to assist the automobileindustry. Several R&D and technology demon-stration programs have been Government-spon-sored, and a joint industry-Government-universityR&D program (the Cooperative Automotive Re-
search Program) was attempted unsuccessfully in1979-80.17 Some of the basic research areas that
could result in substantial long-term fuel-econ-omy payoffs include:
1.
2.
3.
4.5.
6.
the engine (e.g., advanced alcohol-fueled
engines, nonsteady-state combustion, micro-processor controlled fuel injection, high-tem-
perature materials);vehicle structure (e.g., crashworthiness);aerodynamics;
friction, lubrication, and wear;innovative production technologies for light-
weight materials; and
exhaust emissions.The G overnment m ight a lso c ontinue to provide
some support for the advanced development ofelectric and/or hybrid vehicles, alternativeeng ines, and alternative a utomob ile fuels.
The tec hnica l unce rta inties assoc iated with syn-fuels development are substantial. It is OTA’s
judgment that, even in the presence of favorableeconomywide conditions, investors would nothave suffic ient inc entive to ac c elerate synfuelsdevelopment because of the magnitude of the
tec hnica l risks assoc iate d with p rocess tec hnol-ogies. For example, one of the major components
of technical uncertainty is concerned with theflow and abrasive properties of soIid/liquid proc-
ess stream s. Ga ining a ba sic und erstand ing o f theproperties of these streams so that equipment willfunction properly is both a theoretical and an em-
pirica l engineering c halleng e. At present, eng i-neers must proceed to full-scale commercialplants without adequate analytical descriptions
of ho w w ell designs will work. OTA b elieve s the remay be considerable benefit in continuing theoriginal concept of a demonstration program to
provide tec hnica l informa tion. The results of b oth
‘The Justice Department also recently agreed to ease restrictionswhich had barred the four major manufacturers from working to-gether on development, as well as sale and installation, of pollu-tion control devices. See The Washington Post, Nov. 10, 1981.
ba sic and ap plied research c ould lead to impor-tant near- and long-term advances in synfuels
technology, as well as in o ther tec hnologies c on-cerned with solids handl ing. le
Trade Protection
Trade p rote c tion–ta riffs and du ties, quo ta s, lo-cal content requirements—has economywide im-plications but has traditionally been used to tem-
porarily insulate spe c ific industries and p roduc tsfrom foreign com petition. The c ase for imp ortprotection for the domestic auto industry is based
on the c laim tha t the ind ustry req uires only tem-porary protection in order to increase sales andthus to improve its revenue position, to generatecapital for reinvestment, and to position itself formanufacturing fuel-efficient cars. On the otherhand , it is argued that te mp orary trade p rotec -tion would neither ameliorate the shot-t-termcompetitive problems of the industry nor pro-mo te long-term restruc turing for fuel eco nomy.It is seen as inefficient and indirect adjustmentassistance that can lead to higher consumer prices
due to reduc ed c omp etition, to higher prod uc-tion costs for those industries that must compete,
unsubsidized, against autos for resources, and toless innova tion in general. Trade p rote c tion c ouldalso lead to retaliation on the part of trading part-
ners, and some measures are restricted by theGe nera l Ag reem ent o n Ta riffs a nd Trad e(GAIT).19
Import quotas are generally considered less ef-ficient than tariffs in reducing imports and stim-uIating domestic industries. This inefficiencyarises because quotas directly distort both pro-duction and consumption (whereas tariffs change
relative prices), and quotas can be bypassed withproduct differentiation. Duties have not generallyfigured in the p olic y de ba te, * but U.S. auto ma n-ufacturers have bee n granted temp orary trad eprotection in the form of a 3-year Japanese auto-mob ile quota ag reem ent. The ultima te effec ts of
}Bsee also “Repo~ to the American Physical Society by the Study
Group on Research Planning for Coal Utilization and Synthetic FuelProduction,” Rev. Mod Phys, 53, 4 (pt. 2), October 1981.19’’ General Agreement on Tariffs and Trade, ” 55 U. N.T.5. 194,
T.1.A.S. No. 1700 (1947).*Duties on car imports into the United States are 6 percent; this
compares with 14 percent into Canada, and 11 percent into France,Italy, Germany, and the United Kingdom.

8/14/2019 Increased Automobile Fuel Efficiency and Synthetic Fuels: Alternatives for Reducing Oil Imports
http://slidepdf.com/reader/full/increased-automobile-fuel-efficiency-and-synthetic-fuels-alternatives-for 56/292
50 Ž Increased Automobile fuel Efficiency and Synthetic Fuels: Alternatives for Reducing Oil Imports
these quotas on the domestic industry are un-known, but thus far the impacts of import re-straints ap pe ar to b e sma ll due to low new-c arsales. However, if new-car sales recover, thepric es of a ll sma ll c ars c ould increa se to the e x-tent that shortages are artificially induced by the
trade restrictions.
Local content provisions are another form oftrade protec tion that has be en d isc ussed in thecontext of the domestic automobile industry(H.R. 51 33). These measures would not displace
oil imports directly but could help to protectdo mestic a utomo bile m anufa c turing jobs. Suc hprovisions are generally viewed as being econom-
ically inefficient, although they could serve othersocial/equity objectives.
Trad e p rotec tion is not likely to a ddress any ofthe ma jor issues on whic h the future o f the syn-fuels industry depends. Trade concerns mayeventually arise if large quantities of materials and
equipment are imported to construct synfuelsplants or if the United States is in a position toexport synfuels products or production experi-ence .
Trad e p rote c tion c ould b e used to limit oil im-po rts direc tly. Such a quo ta, how ever, could lea d
to domestic shortages and price increases in theab senc e of replac em ents. The Ca rter ad ministra-tion placed a quota on oil imports (and explored
alternatives for allocations within the UnitedState s should de ma nd e xceed the q uota ), but it
was set at a level which did not influence imports.import quotas were also in effect from 19591971.20
Sector-Specific Demand Stimuli—Purchase Pricing Mechanisms
to
Demand for increased automobile fuel econ-
omy is an extremely important factor influenc-ing the rate of increases in new-car fuel efficien-cy. Autos are large, long-term, and deferrableinvestments for consumers. Furthermore, thedecision to buy a particular car depends on many
attributes, of which fuel economy is only one.Imported oil will not be displaced by the man-
‘“’’Energy Policy,” 2d cd., Congressional Quarterly, Inc., Wash-ington, D. C., March 1981, p. 30.
ufac ture of mo re fuel-efficient c a rs unless thesecars are actually bought. Demand uncertainty can
be reduc ed, and the de mand for fuel-efficient ca rs
c an b e stimulated , by raising the c osts to c on-sumers of b uying and op erating ineffic ient c arsand/or by lowering the costs of owning relative-ly efficient ones. The risks to manufacturers of
producing fuel-efficient cars could thus be re-duced. Car ownership costs can be altered by tax-ing g asoline, a s d isc ussed , or by ta xing / sub sidiz-ing auto mo biles direc tly.
Synfuels per se should not be directly influ-enc ed by c onsumer beha vior excep t insofa r asweak demand for liquid fuels limits the profitabil-ity of synfuels production. Some synfuels, how-ever, may no t fully c onform to end -use fuel spe c i-fications without more extensive processing orend -use eq uipme nt mo difica tions. The extent o fthis potential demand problem cannot be deter-
mined in the ab senc e o f end -use te sting, b ut islikely to be minor except for alternative fuels suchas methanol.
Purchase Taxes and Subsidies
Automobile purchase taxes or price subsidiescan directly change the costs of owning cars ofdiffering fuel efficiencies. Purchase pricing mech-anisms can be linked either implicitly or explicitlyto fuel-efficiency p erforma nce c riteria. Currenttaxes are now only loosely related to CAFE stand-ards. The exten t to w hich a dd itiona l me asures
would discourage the purchase of inefficient cars,or encourage the purchase of efficient cars, de-pends on many factors, including the level of the
effec tive ta x (or subsidy), the range of ve hic lesaffected, the extent that auto manufacturers’ pric-ing policies counteract the effect of the taxes (or
subsidies), and the responsiveness of consumerbeha vior to c hange s in ca r pric es. * There is a lso
*The difficulty in quantifying elasticities (i.e., the percentagechange in demand for a l-percent change in price) is discussedin “Economywide Taxation—Oil Imports and Gasoline. ” The inter-national Trade Commission analysis of the Carter gas-guzzler taxproposal implied an elasticity of demand for subcompacts of –0.79(i.e., sales of subcompacts increase less than proportionately withdecreases in their prices) and an elasticity of demand for full-sizecars of – 1.12 (i.e., sales of full-size cars decrease more than propor-tionately with increases in their prices). Assuming that these figuresare accurate, to reduce full-size car sales by 50 percent, for exam-ple, their prices should be raised by about 45 percent, or at least$3,500.

8/14/2019 Increased Automobile Fuel Efficiency and Synthetic Fuels: Alternatives for Reducing Oil Imports
http://slidepdf.com/reader/full/increased-automobile-fuel-efficiency-and-synthetic-fuels-alternatives-for 57/292
Ch. 3—Policy q 5 1
som e risk tha t p ric e subsidies ta rgeting only d o-me stic vehic les c ould violate the GA TT p rovisions
which prohibit most-favored-nation trading part-
ners from taking actions that discriminate againstimports from one another.
Low-interest loans for consumers could stim-
ulate the purchase of all new cars, which aregenerally more efficient than the average car onthe road. By tying the interest rates to the newcar’s fuel efficiency, sales of the more fuel-efficient new cars could be stimulated.
Gas-guzzler taxes, as another type of pricingmec hanism, would reduce the d ema nd for rel-atively fuel-inefficient cars. However, becausesuc h ta xes do not disc riminate am ong differenttypes of users, a disproportionate share of thetaxes could be paid by those who are most con-strained to using large vehic les. An eq uity argu-
ment c an b e ma de for excepting c ertain classesof drivers in a tax program (e.g., taxis, hearses),Income support programs could aid in the cases
of financial hardship; and tax proceeds could beused to fund these relief measures.
Both purcha se subsidies and taxes ma y ad d i-tionally and at least temporarily strain the revenueposition of U.S. automakers because they arethe principal suppliers of large cars, but subsidiescould strengthen their long-term position due toincreased car sales.
If Congress wishes to avoid discrimination
against large cars (which are inherently less fuelefficient than small cars), purchase taxes or sub-sidies could be based on the fuel efficiency of agiven mo de l relative to other mo de ls within thesame size o r ma rket c lass. This typ e o f ap p roac hwould lead to numerous cases where less fuel-efficient cars are taxed at lower rates or subsi-dized at higher rates than the more fuel-efficientones, but it would create a demand for cars withless powerful engines and technologically im-proved cars (as opposed to simply smaller ones)
and it would not favor imports in most cases.
BountiesAnothe r wa y to use p urc hase pric ing mec ha-
nisms to stimulate rap id fleet turnover to higherfuel ec ono my is by offering a ga s-guzzler boun-
ty. Bounties could be designed, as examples, asfull payme nt for a trad e-in, or as a p ayme nt upo nproof o f sc rap pa ge of a fuel-inefficient c ar. Be-c ause c onsume rs are relat ively unresponsive tochanges in prices,21 the bounty would have tobe large to induce significant increases in salesof more fuel-efficient cars. For example, if a value
of –0.3 is assumed for the price elasticity of de-ma nd fo r new c ars, then for total new c ar salesto rise b y 10 pe rc ent, net pric es wo uld have tofall by o ne-third. Sinc e the ave rag e new c ar c osts
about $8,000 in 1980-81, a bounty of about$2,700 would be necessary on average to raisenew-car sales by 10 percent. Since many usedcars have market values under $2,700, thisscheme would be profitable for the owners ofused cars. However, it would be costly both tothe Government and to potential buyers of usedcars.
The b ounty price would b ec ome the effectiveminimum used-car market price and all used-car
pric es wo uld be prop ortiona tely inc rea sed . Be-cause bounties distort existing relationships andoperations of both the new and used car markets,bounties would be difficult to design and imple-ment efficiently. Unless bounties were tied tohigh-fuel-efficiency car purchases, they mightneither help manufacturers nor lead to significantfuel savings.
Registration Taxes
Car registration taxes represent another de-ma nd -side stimu lus. These ta xes wo uld a ffec t theowners of all automobiles, and they could be ex-plicitly tied to fuel efficiency or some surrogatemeasure* to encourage replacement of fuel-ineffi-cient cars. However, they would make auto own-ership more expensive regardless of the amount
and nature of the travel, and they would worktowards red ucing d emand for autos in the longrun. By effectively lowering consumer income,registration taxes would also disproportionately
21 “Motor Vehicle Demand Models: Assessment of the State ofthe Art and Directions for Future Research, ” prepared by Charles
Rivers Associates, Inc., for U.S. Department of Transportation, April1980.*One possible measure would be ton miles/gallon (e.g., how
much a vehicle weighs per rate of fuel use), Several foreign coun-tries already have registration taxes that depend on automobileweight and/or engine size.

8/14/2019 Increased Automobile Fuel Efficiency and Synthetic Fuels: Alternatives for Reducing Oil Imports
http://slidepdf.com/reader/full/increased-automobile-fuel-efficiency-and-synthetic-fuels-alternatives-for 58/292
52 . Increased Automobile Fuel Efficiency and Synthetic Fuels: Alternatives for Reducing Oil Imports
affect low-income groups. * In addition, a registra-tion policy implies State action, and consistent,concerted implementation may be difficult toachieve.
An important possible side effect of all demand-
side stimuli which have the effect of reducing
large-car demand is that only those domesticmanufacturers with a clear competitive advan-tage in producing large cars will continue to serve
this shrinking market. This reorientation of do-mestic production would be consistent with long-term international trends towards corporate con-solidation and a standardized “world car. ”
Methanol
Promoting the use of methanol as an automo-bile fuel is likely to require coordination of supplyand de ma nd stimuli. A limited supp ly of m etha -
nol, however, is currently available from thec hemica l industry. * *
Autom otive uses of fuel m etha nol are p rinc ipal-ly in a blend (with cosolvents) in gasoline or inengines designed or converted to use straight(neat) methanol. Because many automobiles now
on the road ca nnot ac ce pt me thanol-ga solineblends with more than 1 to 3 percent methanol,the blend market for methanol is currently quitelimited (less tha n 50,000 B/ DOE); but t he poten-tial market could be expanded if incentives wereprovided to make new cars compatible with high-er pe rcen tage blend s. This wo uld a lso a dd flexi-
bility with respect to matching supply and de-mand, which would help to avoid methanol fuel
shortag es and gluts. The use o f b lends could b eencouraged through direct subsidies and through
approval of methanol by EPA as a blending agentin gasoline.
Demand for fuel methanol can also be stimu-lated with incentives to convert captive fleets***
(current fuel consumption by larger fleets is about
0.6 MMB/DOE22) to metha nol. Ca pt ive fleets arec urrently more at trac tive fo r neat m etha nol usethan p rivate ly owne d c ars be c ause fleets oftenhave the ir own fuel storag e a nd p ump ing fa c il-ities, which can be converted to methanol at thesame time as the fleet conversion.
Introduction of vehicles for general use whichare fueled with neat m etha nol prob ab ly will re-quire c oordinate d p lanning to ensure that ne atmethanol is available at service station pumps atab out the sam e time or before the vehicles ap -pear for sale. However, if this fuel supply prob-lem can be solved (see supply stimuli below) andmethanol is available at prices (per Btu) compar-
able to gasoline, it is likely that some auto manu-
facturers will supply alcohol-fueled vehicles with-out G overnment inc entives.
Sector-Specific Supply Stimuli—Subsidies and Guarantees
Supply-oriented stimuli–in the form of directsubsidies, grants, and loan, price, and purchaseguarantees–are methods for quickly providingvisible and directed sector-specific support to in-
dustries and firms.23 These stimuli, by shifting aportion of the costs and risks to the Government,can provide a temporary inducement to firms toaccelerate investments (i.e., to the auto industryto increase fuel economy and to the synfuels in-dustry to ac ce lerate produc tion). Supp ly-orientedstimuli can also be structured so as to minimizeor alleviate costly side effects associated with the
investment o r stimulus. The rationa le is tha t m ar-ket-driven business practices would not provide,at the time required, nationally desirable outputlevels.
Sector-specific, supply-oriented policy meas-ures share the disadvantages described earlierthat are associated generally with any sector-specific policy approach. In addition, they couldput direc t p ressure o n the Fed eral bud ge t. De-
*other fees that could discourage fuel use by all drivers include
commuter taxes, car-pooling incentives, and parking fees.**Total U.S. methanol production, which comes from natural
gas and residual fuel oil, corresponds to about one 50,000 B/DOEsynfuels plant or about 1.5 billion gal of methanol per year.
***A captive fleet is a fleet of cars or trucks owned and operated
by a single business or Government entity and often used primar-ily in a localized area with central refueling facilities also ownedand operated by the fleet owner.
ZZThe Department of Energy (“Assessment of Methane-RelatedFuels for Automotive Fleet Vehicles,” DOE/CE/501 79-1, vol. 2, pp.
5-23, February 1982) has estimated that automobile fleets of 10 ormore, truck fleets of 6 or more, and bus fleets consume about 0.6MMB/D of gasoline and about 0.4 MMB/D of diesel. Replacing allof the gasoline would require about 20 billion gal of methanol peryear.
~BSee An Assessment of Oil Shale Technologies, OTA-M-l 18
(Washington, D. C.: U.S. Congress, Office of Technology Assess-ment, June, 1980).

8/14/2019 Increased Automobile Fuel Efficiency and Synthetic Fuels: Alternatives for Reducing Oil Imports
http://slidepdf.com/reader/full/increased-automobile-fuel-efficiency-and-synthetic-fuels-alternatives-for 59/292

8/14/2019 Increased Automobile Fuel Efficiency and Synthetic Fuels: Alternatives for Reducing Oil Imports
http://slidepdf.com/reader/full/increased-automobile-fuel-efficiency-and-synthetic-fuels-alternatives-for 60/292
54 Increased Automobile Fuel Efficiency and Synthetic Fuels: Alternatives for Reducing Oil Imports
Purchase and Price Guarantees
Purchase and price guarantees protect investors
by ensuring that products can be sold at a price
equa l to or greater than the m inimum guaran-teed, regardless of market conditions. But unlessthe price is set at extremely high levels, these in-
centives do not ensure against losses that occurif initial estimates are wrong with respect to cost,price, production volume, or product quality.These g uarante es are m ost a pp rop riate whenmarket demand and price are the major uncer-
tainties (and are expected to be “too low”),where commodities are homogeneous, andwhen commodities have a value to the Govern-ment in use or resale. They could, however, dis-tort relationships among producers and consum-ers; they c an be ad ministratively co mp lex, andthey do not reduce investors’ financial exposurein the c ase o f po or performance .
Purchase and price guarantees have generallynot been considered viable for the auto industry
because of the differentiation of its products andthe complexity of manufacturer-dealer-consumerrelationships.
Although purchase and price guarantees do notaddress the central technical uncertainties of syn-
fuels production, they may nevertheless be useful
in conjunction with other incentives. Provisionsfor price guarantees and purchase commitmentsare included in the 1980 synfuels legislation.
Subsidies and gua rantees ca n lead to large an-nual investments by the Government. For exam-ple, given that 6 to 8 million c ars are p rod uce ddomestically each year, subsidies of several hun-
dred do llars pe r ca r for fuel-eco nomy imp rove-ments (which corresponds to the investmentsneeded to make the necessary changes) couldrequire annual expenditures of several billiondollars.
To illustrate the magnitude of subsidy thatcould be necessary through a price guarantee toaccelerate synfuels production, assume that
crude oil costs $40/bbl, that synfuel from a new-ly opened 50,000 B/DOE plant requires a $10subsidy for each barrel of oil replaced, and thatsynfuels production costs follow general inflation.if the rea l price o f oil we re to esc alate by 2 pe r-cent per year, the synfuel would have to be sub-
sidized for 11 years at a total cost of about $1billion. If the real price of oil escalates at 4 per-c ent p er year, the p eriod of subsidization a nd thetotal cost would be half as large. Similarly, a1-percent real inflation rate for oil would doublethe d uration and ma gnitud e o f the subsidy. Thus,
pric e gua rantee subsidies c an rea c h levels thatare a significant fraction of the investment initiallyneede d to build the p lant.
The Go vernme nt could , how eve r, require re-payment of a subsidy if the manufacture of fuel-
efficient cars or the production of synfuels be-came profitable without subsidies.
Methanol
The supp ly incentives me ntioned ab ove andthose described under “demand stimuli” are
probably adequate to encourage production ofmethanol from coal for use by the chemical mar-ket and some captive fleets of automobiles, and,
possibly, as blends in gasoline. However, addi-tional supply incentives may be necessary to en-courage the use of methanol in automobileswhich are not pa rt of a c ap tive fleet.
Once significant quantities (probably more than0.1 to 0.2 MMB/DOE) of methanol are being usedin captive fleets and, possibly, in gasoline blends,
it may be possible to offer methanol for sale tothe public in enough places to make ownership
of a methanol-fueled vehicle practical for individ-uals. Incentives can be offered to owners of meth-
anol-fueled captive fleets, who have their ownmethano l storag e and pum ping fac ilities, to sellmethanol to the public. Incentives can also begiven to service station owners who sell methanol
blends to install methanol storage tanks and blend
the m etha nol with gasoline a t the p ump . Theycould then sell straight methanol, as well.
Many owners of captive fleets probably can-not be easily induced to offer methanol for sale,
bec ause it would not b e related to their other
business ac tivities and wo uld be tantam ount toentering the service station business. Similarly,very large ec onom ic ince ntives ma y initially b enecessary to induce service station owners to in-stall methanol facilities, because the investmentwould not lead to a near-term increase in sales.

8/14/2019 Increased Automobile Fuel Efficiency and Synthetic Fuels: Alternatives for Reducing Oil Imports
http://slidepdf.com/reader/full/increased-automobile-fuel-efficiency-and-synthetic-fuels-alternatives-for 61/292
Ch. 3—Policy q 5 5
On the other hand, it could be mandated thatany supplies of methanol used for Government-owned captive fleets be made available for publicsale. And some captive fleet and service stationow ners wo uld b e w illing to offer methano l to ga inan ea rly ma rket share or for the financ ial inc en-tives offered by the Government. If these mone-tary and nonmonetary incentives were adequate,
methanol could compete directly with gasolineand diesel fuel as an auto mo bile fuel.
Regulations on Output
One of the mo st d irec t p olic y mec hanisms forpromo ting alternatives that c an d isplac e o il im-ports is regulation. Regulations are a common,if controversial, form of Government interventionin the economy. Although their effects can be felt
economywide, regulations are typically directedat specific industries or products. In general, they
wo uld target the supp ly aspe c ts of o il imp ort al-te rnatives. Mea sures c ould a lso b e d esigned tota rget c onsume rs (e.g., the 55-mp h speed limit,end-use fuel restrictions in the stationary sector),but the Government has traditionally been reluc-tant to mandate changes in consumer behaviorand habits.
Regulations can be designed for two major pur-poses. First, they can serve to protect the publicfrom the side effects ca used by the c onduc t ofindustrial a c tivities. These effec ts include impa c tson the environme nt, health, and safety w hic h are
discussed in the next section. Regulations canalso be used to determine outputs directly—the
level of consumption or production of fuels–ifthe ma rket is una ble to ensure desirable levels.
the investment risks since , a lthoug h reg ulationsc an a ffec t the supp ly of fuel-efficient c ars, theydo no t d irec tly influenc e p urc hases. Through the1970’s consumers failed to demonstrate a con-sistent d ema nd for fuel ec onom y, * and the C AFE
standards probably increased fuel efficiencyab ove what the market would have ac hieved.And recent data (fall 1981 ) show that, in fact, theproportion of relatively large cars sold has once
ag ain increased co mp ared w ith the number ofsmaller cars sold.
The a rgume nts for extend ing C AFE sta ndardsbe yond 1985 are inconc lusive. To the extent thatCAFE standards are met through sales of smallercars, as opposed to purely technological changes,
U.S. manufacturers must increasingly competewith imports for the small-car market. Increasingly
stringe nt fuel e c onom y sta nda rds could, the re-fore, result in higher import levels if domestic
manufacturers are unable to increase their com-petitiveness in this market, despite the productchanges they have made. Post-1 985 standards arealso likely to require additional capital for morerounds of redesigning and retooling. But post-1985 standards could result in important fuel sav-
ings to the Nation, espe c ially if the d ema nd fo rfuel-efficient cars remains sluggish. Additional de-mand stimuli may also be necessary, dependingon na tional and international co nditions, to en-sure that fuel-efficient c ars are b oug ht.
In considering the effects of CAFE standards it
is important to recognize that CAFE standards donot distinguish among average efficiency in-creases that result from: 1) technological improve-
The auto industry has been regulated in theUnited States in the areas of emissions, safety, and
mo re rec ently fuel ec onom y. The m ajor Govern-ment program mandating fuel-efficiency increasesis the CAFE standards. Whether or not to increasethese standards beyond levels set by current legis-lation for 1985 and beyond may be a major up-
c oming de c ision be fore Co ngress.
Effectiveness of the CAFE standards in spurring
fuel economy improvements is controversial, Animportant feature of these standards is that theyare effective only if they force manufacturers todo mo re tha n c onsume rs de ma nd . This increases
*The drop in demand for fuel efficiency and the resurgence inlarge-car demand in the mid to late 1970’s led manufacturers topetition (unsuccessfully) NHTSA to lower CAFE standards for theearly 1980’s because sluggish sales of fuel-efficient cars madenecessary investments appear especially costly and risky. Markettrends in the 1970’s also led manufacturers to concentrate initiallyon improving fuel economy for relatively large cars rather than ondeveloping new small-car designs. Manufacturers attributed theirexpectation to exceed voluntarily the 1985 CAFE standard of 27.5mpg to renewed, strong demand for fuel economy arising from the1979 oil crisis and increases in gasoline prices. This increase in de-
mand and current industry efforts to raise fuel economy recentlyled NHTSA, which administers the CAFE program, to terminate
rulemaking with respect to post-1 985 average fuel-economy im-provements (Fed. Reg. 22243, Apr. 16, 1981 ). A petition from theCenter for Auto Safety that requested NHTSA to continue rule-making was also subsequently denied (Fed. Reg. 48383, Oct. 1,1981 ).
98-281 IC - 82 - 5 : ~11, 3

8/14/2019 Increased Automobile Fuel Efficiency and Synthetic Fuels: Alternatives for Reducing Oil Imports
http://slidepdf.com/reader/full/increased-automobile-fuel-efficiency-and-synthetic-fuels-alternatives-for 62/292
56 . Increased Automobile Fuel Efficiency and Synthetic Fuels: Alternatives for Reducing Oil Imports
ments, 2) consumers’ purchasing the more fuel-efficient cars in each size class, and 3) consumerspurchasing smaller cars. Depending on marketdemand, success of technical developments and
auto manufacturers’ financial positions and capi-
tal stock, CAFE standards could be met throughvarious mixes of the three (see table 8). Conse-
quently, without special provisions it probablyis impossible to establish conventional CAFEstandards which simultaneously: 1 ) are effective(i.e., increase new-car fuel efficiency above what
market forces would dictate), and 2) do not pro-
mo te the sales of sma ll imported c a rs. Sep ara tefuel-efficiency standards for each automobile sizeor market class could significantly reduce the in-direct promotion of small-car sales; however, thiswould greatly reduce automobile companies’flexibility in responding to the regulations.
The NSPP sets targets for synfuels production
but the mandating of synfuels output has notbe en o f c entral c ong ressiona l interest. The m a jor
difficulty associated with developing synfuelsstems from technical uncertainties which, in turn,affect the likely cost at which synfuels initially willbe produced. in addition, contributions to oil im-port savings from synfuels would not be madeincrementally (as with increasing automobile fuel
efficiency) but rather depend on the proper func-tioning of large-scale facilities. As experience andknowledge is gained, it may become possible to
establish realistically achievable production levelsif the Go vernmen t d esires an a ssured level of syn-
fuels supply.
Table 8.—Potential Average New-CarFuel Efficiency in 1995
Fuel efficiency ofCar size class average model (mpg)a
Large . . . . . . . . . . . . . . . . . . . . . . . . . . . . . . . ....30-45Medium . . . . . . . . . . . . . . . . . . . . . . . . . . . . . ....45-60Small . . . . . . . . . . . . . . . . . . . . . . . . . . . . . . . ....60-75
Average new-car fuelSize mix of cars sold efficiency (mpg)a
1961 size mixb. . . . . . . . . . . . . . . . . . . . . . . . ....40-50Moderate shift to small carsc. . . . . . . . . . . ....45-60Large shift to small carsd . . . . . . . . . . . . . . ....50-65a All mpg figures rounded to nearest 5 mpg. Mpg refers to the composite con-slstlno of 55 percent EPA city cycle and 45 percent EPA highway cycle,
b 1~1 gales: 47 percent large cars, da percent medium-sized cars, and 5 per-cent small cars.
C l= gales: m percent large Cars, 55 percent medium, 25 percent small.d l% gales: s percerlt large cars, 45 percent medium, 50 percent smali.
SOURCE: Office of Technology Assessment.
One possible form of regulation would be tostipulate that a ce rtain percentage of the o utputfrom domestic oil producers be synfuels. How-ever, this provision would be unworkable forsmall oil producers, so it would have to be tar-ge ted at the larger oil com pa nies. Similar p rob -lems arise with regulations aimed at refiners or
reta ilers. Furthermore, b ec ause refining a nd re-tailing are considerably less profitable than gasand oil production, regulations aimed at the form-er might induce some of the companies that arevertically integrated to abandon refining ratherthan to incur the added costs and risks. For thesereasons, it would probably be very difficult to ad-
minister mandates on synfuel content.
Other Effects
Environment, Health, and Safety
Both increased automobile fuel efficiency andsynthetic fuels production have the potential forcreating large-scale environmental, health, and
safety hazards. A principal rationale for policy in-
tervention is the general past failure of privatemarkets to internalize these other effects in invest-ment decisions and operating practices. Policiesto protect the public have tended to take the formof regulations that govern known or anticipatedimpacts through performance standards or con-
trol spec ific a tions.
Apart from fuel efficiency, the auto industry isregulated in the areas of emissions and safety.Emissions standards require that each vehicle–and automobile safety standards require that eachof certain vehicle parts-meet minimum perform-ance standards. (By contrast, fuel-economy stand-
ards a re fo r fleet a verag es.) There a re p rop osalsbefore Congress to delay, modify, or eliminateover 30 automotive-related environmenta l andsafety regulations.25
A p otential threat to the p ublic from size a ndweight reduction of vehicles used to increase fuel
effic ienc y is dec reased automo tive sa fety. Thebasic policy issue is whether the Governmentshould act to help prevent future highway fatal-ities if consumer demand for safety does not result
25 See Gwenell Bass, “The U.S. Auto Industry: The Situation inthe Eighties,” CRS issue brief No. IB81054, Sept. 30, 1981.

8/14/2019 Increased Automobile Fuel Efficiency and Synthetic Fuels: Alternatives for Reducing Oil Imports
http://slidepdf.com/reader/full/increased-automobile-fuel-efficiency-and-synthetic-fuels-alternatives-for 63/292
Ch. 3—Policy q 5 7
in adequate safeguards. * Regulatory policy could,
as examples, reconsider the passive restraint pro-gram (rulemaking for that program was ter-minated by NHTSA although a recent U.S. Courtof Appeals ruling has reinstated the program, atleast for the moment), mandate the use of safetybelts, strengthen crashworthiness design stand-ards, or maintain or tighten speed limits. Othertypes of programs could provide for stricter driverlicensing standards and improved road mainte-nance and traffic control, support R&D, and pro-vide for driver safety education. Another poten-
tial adve rse e ffec t is the a ir quality impa c t of alarge increase in diesel-powered autos. Policy al-
ternatives include more stringent particulate andNO Xemission regulations for diesel engines andGovernment assistance in diesel health effectsresearch and emissions control development.
Potential environmental and worker-relatedproblems associated with synthetic fuels develop-ment (e. g., contamination of drinking water, re-lease of cancer-causing agents and other hazard-ous pollutants, highly visible plant upsets, obnox-ious odors, and localized water availability con-flicts) are substantial and have considerablepotential for arousing strong public opposition.There are also elements of the present synfuelsdevelopment strategy that appear to increase the
po tent ial for ad verse imp ac ts. These e lements in-clude the proposed siting of some synfuels dem-onstration plants close to heavily populated areas,research budget cuts at EPA and the proposed
dismantling of DOE, the current policy to shiftenvironmental management responsibilities toState a nd loca l agenc ies without a co ncom itantshifting of resources, and an industry environ-mental control program that appears reluctant tocommit resources to currently unregulated pollut-
ants and tha t may be overc onfide nt abo ut thepe rformanc e of integ rate d c ontrol systems.**
“Manufacturers may not pursue safety for fear that the addedcost will dampen market demand. In most cases safety has not been
a strong selling point in automobiles in the past.*“In apparent response to their confidence that adequate environ-
mental control of synfuels plants will involve only “fine tuning”
of existing control technologies, developers have passed up someopportunities to test out control systems on demonstration plants.For example, Exxon feeds the wastes from its Baytown, Tex., EDSplant into a neighboring refinery rather than developing and testingspecific controls for the plant. In OTA’s opinion this increases therisk of unforeseen problems at the first large-scale plants. Such prob-
lems appear quite possible given the differences between the con-ditions under which proposed control systems have been usedpreviously (in chemical plants, refineries, etc.) and the expectedconditions in synfuels plants.
Finally, the multiplicity of pollutants associatedwith synfuels production and the difficulty of de-tecting and evaluating some of the potential im-
pacts (e.g., long-term cancer impacts from low-Ievel exposures), coupled with the above factors,leads to a strong concern about the adequacy of
future regulation of a synfuels industry.
Government actions targeted at the potentialrisks of synthetic fuels development may be animportant factor in assuring that the risks areproperly measured and in causing the private sec-
tor to account for these risks. A problem the Gov-
ernment faces, however, is that premature adop-tion of rigid standards could ultimately act to sti-fle innovation or force suboptimal environmentaldecisions. Also, the capital-intensive nature of theindustry leaves it vulnerable to delays caused byshifts in environmental requirements or standardsthat ultimately prove unattainable.
The e xistenc e o f these p roblems plac es a p re-
mium on an intensive resea rc h p rog ram and around of d emonstrat ion p lants, that inc lude fullenvironmental control systems, to avoid surprisesand provide timely information for intelligent reg-ulation. Also, the impact of an environmental sur-prise might be minimized by choosing isolatedsites and requiring particularly strict controls forthe first round of pla nts, thus minimizing the ac -tual impact suffered from excessive discharges orother problems.
The vulnerability of synfuels plants to schedul-ing delays has also generated pressures on Con-gress and State legislatures to streamline environ-mental permitting for energy facilities. Althoughit is too early to assess recent streamlining effortsat b oth the Fed eral and State levels, considerab leimprovement appears possible without a full-sc a le Energy Mo b iliza tion Boa rd.26 In m ost c ases,reg ulatory delays are impo rta nt only to the ex-tent they delay construction starts or requirechanges in plant design; otherwise, all necessarypermits are likely to be obtained before signifi-cant construction investment has been made. De-
lays after construction has started could, how-ever, be costly. A 3-year delay, for example,
ZbCongressional Research Service, “Synfuels From Coal and theNational Synfuels Production Program: Technical, Environmental,and Economic Aspects. ”

8/14/2019 Increased Automobile Fuel Efficiency and Synthetic Fuels: Alternatives for Reducing Oil Imports
http://slidepdf.com/reader/full/increased-automobile-fuel-efficiency-and-synthetic-fuels-alternatives-for 64/292
58 q Increased Automobile Fuel Efficiency and Synthetic Fuel: Alternatives for Reducing Oil Imports
could increase synfuels product costs by 20 per-cent or more. In addition, the risk that retrofit-ting may be required will remain until synfuelprocesses have been proven and both emissionsand products extensively tested. Formulating reg-ulatory policy entails an assessment of the fullrange of regulatory costs to industry versus the
possible costs arising in the absence of policy.At present these complex tradeoffs are often de-termined in a lengthy, case-by-case process based
on judicial interpretations.
policy alternatives to regulation include effluent
c harges and po llution vouc hers. Although suchmechanisms have a strong theoretical basis, thereis a general lack of practical experience in using
them. Also, the toxic pollutants of most concernin synfuels prod uc tion c anno t safe ly b e trade doff a mo ng sources the w ay po llutants suc h a s SO 2
and NO Xcan be.
There are two additional levels for policy in-volvement. First, Congress could decide to in-crease the environmental capabilities of respon-sible regulatory agencies. One specific option is
to ta rget resource s for spe c ific Sta te a nd loc a l en-
vironmental agencies, as was done under theClean Air Act in the early 1970’s. As a part of thisoption, Congress may also wish to investigate theeffects of the programmatic changes and budgetreduc tions for synfuels environm enta l resea rchand control system development at EPA andDOE.
Sec ond ly, environme ntal c onc erns c ould b e in-tegrated directly into financial support decisions —i.e., of SFC. Although some would claim thatthis latter option is redundant given current envi-ronme ntal leg islat ion, there are neverthelessmany conc erns (e.g., siting) which a re notwe ll-ad dressed by existing laws. In a dd ition, theprotection of SFC investments would be well-served b y an a bility to influenc e e nvironme ntalplanning. SFC has not yet moved aggressively to
build a technical capability for the environmen-
tal assessment of projects it will support.
The availability of water resources may posespecial problems for policy because of the pres-
ent controversies surrounding the allocation and
use of increasingly scarce supplies.27 How con-flic ts are resolved in areas where users p resentlyor could potentially compete for water will haveimportant implications for the distribution of costs
and be nefits to all wa ter users, espe c ially sincethe costs of procuring water are likely to be small(in co mp arison with o ther c osts) for the synfuels
industry. Present water policies and planningmechanisms are fragmented and generally inade-quate to assess water availability and plan forfuture water needs on a consistent, compre-hensive, and continuous basis. Because of themagnitude, diversity, and nationwide distributionof water resource problems and because the out-
c ome o f wa ter-resource alloc at ion c onflic ts willhave loc al, State , reg ional, and National impac ts,
the Fed eral Government has an imp ortant roleto play in improving water resource managementprac tices in c oop eration with the States. Ma jorpolicy issues include the resolution of uncertain-
ties surrounding water rights and future waterneeds and the definition of responsibilities, objec-tives, and priorities for water planning and alloca-
tion. Leg islation p end ing b efo re Congress (e.g.,S.1095 and H.R. 3432, which both call for thedismantling of the U.S. Water Resources Coun-c il) see ks to rede fine the respec tive responsibil-ities of Federal and State Governments and toclarify the role of regional and local interests inmanaging water resources.
Social Adjustment Assistance
Increasing automobile fuel efficiency and de-veloping a synfuels industry will result in socialcosts and benefits which are side effects, i.e., ef-fects that are external to the transactions made
be twe en c onsumers and produc ers. The m ove-ment of capital and labor as a result of industrialchange (i.e., restructuring, contraction, orgrowth) will have implications not only for thecharacter of the labor market but also, conse-quently, for lifestyles and standards of living.
ZzFOr fur ther discussion of these issues see An Assessment of oil
Shale Technologies, OTA-M-118 (Washington, D. C,: U.S. Congress,OtYice of Technology Assessment, June 1980); and A Technology Assessment of Coal Slurry Pipelines, OTA-E-60 (Washington, D. C.,U.S. Congress, Office of Technology Assessment, March 1978).

8/14/2019 Increased Automobile Fuel Efficiency and Synthetic Fuels: Alternatives for Reducing Oil Imports
http://slidepdf.com/reader/full/increased-automobile-fuel-efficiency-and-synthetic-fuels-alternatives-for 65/292
Ch. 3—Policy 59
in th e auto industry, the major social effects arerelated to job losses resulting from structural ad-
justment. In the synfuels industry, the major socialexternalities are related to new employment andresult from large, rap id and fluctuating p op ula-tion growth in some areas where the industry may
locate. Government policy may be importantboth for easing those social adjustments that themarket does not address and for ensuring thatassociated costs do not fall disproportionately onparticular groups. Social-adjustment assistance inthis country has generally been limited in the pastto sectors affected by international trade and to
several programs focusing on regional adjust-ment.
Labor market dislocations are of primary impor-
tance to the Nation because of the penetration,numbers, and dispersion of auto-related jobs
throughout the economy as well as the geograph-ic concentration of auto production jobs. Restruc-
turing of the industry for improved internationalc ompe titiveness, prod uc tivity, and fuel efficien-cy is resulting in what is likely to be a long-termdec line in a uto-related emp loyment.
The p rob lem of unem ployment in the auto in-dustry could b e a dd ressed by p olic y me asuresthat seek to ease the adjustment of firms, workers,and communities to changing economic condi-tions. Policy options include, as examples: reloca-tion assistance, support of retraining programsand training institutions, local content provisions,
manpower training vouchers for targeted individ-uals, plant-closing restrictions, tax incentives toother ind ustries (or reg ions) to at trac t d ispla c edwo rkers, and c ommunity aid programs (e. g., todiversify local economies).
Som e a ssistanc e ha s be en a va ilab le unde r theTrade Act of 1974 provisions and through Hous-ing and Urban Development, the Economic De-
velopment Administration, and other Govern-me nt ag enc y programs. These prog rams havegenerally been limited in scope and funding andhave generally required evidence of economic
distress (i.e., they are not preemptive). They arealso candidates for curtailment under proposedFederal budget cuts. Note that because employ-ment displacement depends in part on laborcosts, automobile-related employment levels will
also vary with the de gree to whic h autow orkersaccept changes in compensation and work rules,behavior which is not generally subject to directFederal policy initiatives.
Major social side effects arise from synfuels de-velopment because the communities which ab-
sorb the large, rapid population increases (a por-tion of which is only temporary) are vulnerableto institutional and social disruptions. These ex-ternalities could constrain synfuels development
by generating public opposition to synfuels andby ad versely affec ting worker p roduc tivity. Theprincipal policy issues relate to who will bear the
c osts of m ana ging a nd mitiga ting these d isrup-tions and how up-front capital can be made avail-
ab le to financ e nec essary pub lic fa c ilities andservices. Those who view social impacts as theprice of regional development emphasize the re-
sponsibilities of State and local governmentswo rking w ith private deve lope rs. Those w ho a s-sociate local impacts primarily with the pursuitof national energy objectives call for a continuedand expanded Federal role.
There are also many questions of equity thatarise in allocating resources among differentareas, because of the large variations in themagnitude and character of adverse impacts andthe resources available to cope with these im-pacts. An acceptable assistance program mustdeal with the problem that some of the shortagesof impact-mitigation resources are caused by limi-
tations on planning and borrowing powers im-po sed by loca l and State go vernments them-selves.
Current policies to deal with the social impactsof energy developme nt are unable to a dd ressconsistently and comprehensively the cumulativeimpacts arising from the large-scale, rapid-growth
situations that characterize synfuels development.Government policies could be directed at either
energy development generally or synfuels pro-duction specifically, and could provide, as ex-amples: financial aid, technical assistance, growth
management planning assistance, regulation(e.g., with respect to siting, phasing, pacing, mon-itoring), lending and borrowing assistance, or tax-ing p rovisions. The va rious forms of t ec hnica l andfinancial assistance for growth management are

8/14/2019 Increased Automobile Fuel Efficiency and Synthetic Fuels: Alternatives for Reducing Oil Imports
http://slidepdf.com/reader/full/increased-automobile-fuel-efficiency-and-synthetic-fuels-alternatives-for 66/292
60 Ž Increased Automobile Fuel Efficiency and Synthetic Fuels: Alternatives for Reducing Oil Imports
examined in detail in previous OTA stud-ies.28 29 30 31 All relevant Federal programs havebeen targeted for substantial budget reductions,or elimination, in fiscal year 1982 under proposalssubmitted to Congress by the present administra-t ion.32
The d eve lopm ent o f a synfuels plant w ill lea dto the c rea tion of new job s in c onstruc tion and
ZBAn Assessment of Oil Shale Technologies, Op. cit.zgThe Dir~t L/se of~a~ OTA-E-86 (Washington, D. C.: U.S. Con-
gress, Office of Technology Assessment, April 1979).30&fanagement of Fue/ and Nonfuel Minerals in Federal Land,
OTA-M-88 (Washington, D. C.: U.S. Congress, Office of TechnologyAssessment, April 1979).
31An~sessment of ~ve~pment and production Potential of Fed
era/ Coa/ Leases,OTA-M-150 (Washington, D. C., U.S. Congress,Office of Technology Assessment, December 1981).
3zCongressional Research Service, “Energy Impact Assistance Leg-islation, “ issue brief No. 1679022, Sept. 9, 1981.
engineering. Technically qualified personnelshould be available for most of these jobs. How-
ever, a shortage of experienced chemical processengineers and project managers could arise, caus-ing costly mistakes and production delays. Theoverall number of chemical process engineers,for exam ple, would have to increase b y ab outone-third by the mid to late 1980’s to accom-modate an optimistic level of synfuels plant con-
struction.The Fed eral Government c ould enc ourage the
education of engineers by providing financial sup-port for facilities, equipment, retraining programs,scholarships, and the hiring and retraining of fac-ulty. Training in skills needed for complex proj-ec t ma nag ement c ould similarly be stimulate d.The auto industry would also benefit from pro-grams to train engineers if the industry pursuedextensive development efforts domestically.
CONCLUSIONS
Both increasing automobile fuel efficiency andsynfuels production have economic and noneco-nomic risks and external costs. The decision topursue either, or both, alternatives–as well asto pursue the third major technical alternative offuel switching and conservation in stationary uses
of petroleum—depends on the desired rate andlevel of oil import displacement and what the Na-
tion is prepared to spend to achieve its oil-dis-
placement goals.
The availab ility and c ost of ca p ital are espe c iallyimportant for the automobile and synfuels indus-
tries, since they are both capital-intensive. Gen-eral economic conditions affect consumer confi-
dence and purchasing power. Among the policiesmentioned in this chapter are general tax policies
and special taxing provisions which would en-courage capital formation and stimulate industrialinnovation economywide.
The rate a t which a utom ob ile fuel effic ienc ycan be increased and a synfuels industry devel-
oped are also affected by factors that are specificto each alternative. Contributions to oil-importdisplacement from increased automobile fuel effi-
ciency d epe nd c ritica lly on c onsumer dema ndfor fuel-efficient cars. Government actions to stim-
ulate demand are a direct way to help ensure thatfuel-efficient c ars are b oug ht a nd, in turn, thatthey will be produced. Demand-oriented meas-ures that appear promising and that deserve fur-
ther a na lysis include registration, p urcha se, a ndfuel taxes and purchase subsidies. Supply incen-tives, depending on their nature, could help man-
ufac turers pay for the investments nec essary toincrea se fue l efficienc y, espec ially if there is an
absence of strong demand for either cars in gen-eral or fuel-efficient cars in particular. In the caseof weak demand for efficiency, increasing CAFE
standards beyond the 1985 level may help to en-sure continued oil import displacement. How-ever, the increased cost of the efficiency increasescould reduce new-car sales and thereby reducethe potential savings. In general, a combination
of d ema nd and supp ly ince ntives would b e themost effective means of promoting more efficient
fuel use in automobiles. This would contrast withpast policy, which has been aimed largely at pro-ducers.
The suc c ess of synfuels de velop me nt in d isplac -ing o il imports hinges on the resolution o f majortec hnic al unc ertainties assoc iated with a s yet un-
8/14/2019 Increased Automobile Fuel Efficiency and Synthetic Fuels: Alternatives for Reducing Oil Imports
http://slidepdf.com/reader/full/increased-automobile-fuel-efficiency-and-synthetic-fuels-alternatives-for 67/292
Ch. 3—Policy q 6 1
proven processes. private investments are likelyto b e ac ce lerate d onc e proce sses are dem on-strated in commercial-scale units—provided theprocesses are economically competitive sources
of fue ls. The high c osts and other risks assoc iate dwith demonstration projects are likely to necessi-
tate Government support if synfuels productionis to become a significant fuel source by the endof the century.
Other policy considerations for displacing oilimports are a pp lic ab le g enerally to p lanning ina world of uncertainty. First, flexible and nonspe-cific policy interventions provide both public andcorporate decision makers with the maximum op-
po rtunities to ad just internally to c hang ing ec o-nomic and tec hnic al c irc umsta nce s. Sec ond ly,periodic reviews and adjustments can help pre-vent prematurely locking the Nation into techni-cal choices that discourage a continuing searchfor better methods, although too much flexibil-ity can lead to ad hoc p rograms.
A long-term, stable policy commitment to oilimport displacement, and to alternatives for dis-placing imports, is essential in order to send clear
signals about Government intentions and pro-mote mutual co nfide nce in a ny public-privaterelationship. In the past, the Government hassometimes sent conflicting signals. For example,concurrent Government programs were in place,on the one hand, to encourage automobile fueleconomy with CAFE standards and, on the other
hand, to discourage fuel conservation with pricecontrols on oil which helped to keep the priceof gasoline low. *
Increased automobile fuel economy and syn-fuels production contribute in different ways tothe Na tion’ s ene rgy sec urity. The a dvanta ge s ofautomobile fuel efficiency include the following:1) through conservation, it directly eliminates the
need for oil imports in the Nation’s highest petro-
leum-consuming sector; 2) after large numbersof fuel-efficient vehicles have been sold, the fuel
*U.S. policies in the 1970’s also implicitly encouraged oil usefor stationary purposes (e.g., Federal curtailment policy for naturalgas).
savings do es not d ep end on the o pe ration of afew large plants, and there will continue to befuel savings even if particular vehicles performbelow standards; 3) it does not result in a netred uc tion of na tural ene rgy resources and thuspreserves options for future generations; and
4) although there are long Iea dtimes for com mer-c ializing new p roduc ts in the a uto industry, sav-ings are already occurring as technologies are dif-fusing into the consumer market. However, ifmarket and/or Government pressures for in-creased automobile fuel efficiency damage theU.S. auto industry, there will be repercussionsthroughout the ec onomy.
The p rinc ipal nationa l sec urity a dva ntag e o fsynfuels production is that it may provide long-term strategic insurance against sustained short-falls. Rapid and successful deployment could con-
ceivably serve to reduce the rate at which oil im-port prices increase and thus help to reduce infla-
tion. The vulnerability of the synfuels alternativeis related to the complexity of technical controls,
the high risks and costs of failure, potentially haz-ardous environmental side effects, institutionalbarriers to d ep loyment, and , in som e c ases, thegeographic concentration of facilities.
Because increasing auto fuel efficiency and syn-
fuels development are both capital-intensive,each will incur major economic penalties if facili-ties function below capacity. However, becausethe “ normal” rate of c ap ital turnover is likely to
be lower in the synfuels than the auto industry,synfuels production will be more limited in adapt-ing to changing demands.
Developing a long-term, coordinated, andcomprehensive energy policy will be an incre-mental process. A prime objective is to choosea least cost mix of options for reducing oil im-ports. Bec ause investment c osts (per barrel perday of oil saved or replaced) for the various op-
tions considered in this report for the 1990’s arehighly uncertain, yet appear to be comparablein magnitude, the judgment of relative costs will
depend largely on value assessments of the var-ious externalties of pursuing each option.

8/14/2019 Increased Automobile Fuel Efficiency and Synthetic Fuels: Alternatives for Reducing Oil Imports
http://slidepdf.com/reader/full/increased-automobile-fuel-efficiency-and-synthetic-fuels-alternatives-for 68/292
62 q Increased Automobile Fuel Efficiency and Synthetic Fuels: Alternatives for Reducing Oil /reports
APPENDIX 3A.–POLICY OPTIONS TOREDUCE STATIONARY OIL USE
Conservation
1. Tax credits for investments in conservation:
Ž Current 15-percent credit for investments byhomeowners–single-family and 4-unit or lessmuItifamiIy.
q 10-percent tax credit for energy efficienc y or re-newable resource investments by industry.
2. Residential Conservation Service:q UtiIity audit service for homeowners.q Proposed extension to include apartment and
commercial buildings.3. Subsidized loans to homeowners to finance conser-
vation investments:q Currently the purpose of the Solar and Conserva-
tion Bank.q Private savings and loan institutions also offer be-
low-market loans for conservation in some cases.4. Targeted tax credits (20 percent) for investments in
energy efficiency by industry:q Currently prop osed in leg islation now b efo re
Congress.q Tax c red it in add ition to c urrent c redits.
5. State public utility commission actions to encourageconservation efforts by utilities:
Allowance of conservation investments in the ratebase of utilities (proposal).Permission to sell saved energy to private in-vestors (proposals).Allowing utilities to set up separate companies toprovide conservation services—now occurs in
some cases,6. Legislating standards and/or information:
q
q
q
q
Appliance efficiency standards–labeling of appli-ances.
Building standards–currently prescriptive stand-ards through the minimum property standards ofthe Department of Housing and Urban Develop-ment.Building energy performance standards are legis-lated but currently not enforced.Efficiency standards for industrial electric motorswere proposed but never enacted.
Fuel Conversion
1. Prohibition on oil use by utility boilers and large
industrial boilers:q Principal focus of the Fuel Use Act.q Goal to eliminate use of oil by 1990.
2. Financial assistance for utilities to convert from oilto coal:Ž State commissions have allowed New England
Electric Co. to secure a “loan” from their custom-ers to pay for an oil-to-coal conversion.
q Federal legislation proposed to provide loan guar-antees for these conversions was never passedand is not likely to be pursued now.
3. Legislation to remove regulatory restrictions on useof natural gas by industry:q Currently part of several proposals to encourage
conversion to natural gas. Current regulations (Federal and State) either pro-
hibit or discourage natural-gas use for many appli-cations that now use fuel oil.
4. Environmental regulations affecting coal use in in-dustry:q Lowering of emission standards for applications
below a certain size. Financial assistance to help install control tech-
nologies.
General
1. R&D to increase efficiency of end-use technologies:q Promotes general conservation. Can also be directed at developing efficient elec-
tric energy using technologies to make the eco-nomics of switching to electricity attractive.
2. Tax on oil–either on imports or on specific prod-ucts such as fuel oil for boilers or space heating:
3. Economic incentives for development of unconven-tional natural gas:q Currently unconventional natural gas is complete-
ly deregulated. Tax credits to encourage development of uncon-
ventional gas (this is currently not available).

8/14/2019 Increased Automobile Fuel Efficiency and Synthetic Fuels: Alternatives for Reducing Oil Imports
http://slidepdf.com/reader/full/increased-automobile-fuel-efficiency-and-synthetic-fuels-alternatives-for 69/292
Ch. 3—Policy q 6 3
APPENDIX 3B.–ADDITIONAL CRS REFERENCES
The Congressional Research Service has recently 3.
published many reports on various aspects of energypolicy to which the reader is referred. These reportsinclude the following:
1.
2.
Rothberg, Paul, ‘Synthetic Fuels Corporation and 4.
National Synfuels Policy, ” CRS issue brief No.1681139, Oct. 13, 1981.Chahill, Kenneth, “Low-Income Energy Assist- 5.
ance Reauthorization: Proposals and Issues, ” CRSmini brief No. MB81227, Aug. 26, 1981.
Abbasi, Susan R., “Energy Policy: New DirectionsIndicated by the Reagan Administration’s BudgetProposals, ” CRS mini brief No. MB81222, June29, 1981.Parker, Larry, Bamberger, Robert L., and Behrens,
Carl, “Energy and the 97th Congress: Overview,”CRS issue brief No. 1681112, Sept. 15, 1981.Rothberg, Paul, “Synthetic Fuels Corporation,Policy and Technology,” CRS mini-brief No.MB79245, July 13, 1979, updated Apr. 20, 1981.

8/14/2019 Increased Automobile Fuel Efficiency and Synthetic Fuels: Alternatives for Reducing Oil Imports
http://slidepdf.com/reader/full/increased-automobile-fuel-efficiency-and-synthetic-fuels-alternatives-for 70/292
Page
introduction . . . . . . . . . . . . . . . . . . . . . . . . 67
What Do Oil Imports Cost? . . . . . . . . . . . 67Depend ence of Price on Qua ntity
Imported . . . . . . . . . . . . . . . . . . . . . . . 68Loss of U.S. Jobs and GNP Caused by
Rising Oil payments and byPotential Supply Interruptions . . . . . . 68
Military Outlays and Foreign PolicyDirections Forced by Oil ImportDependence . . . . . . . . . . . . . . . . . . . . 69
Conclusion . . . . . . . . . . . . . . . . . . . . . . . 69
How Quickly Can Oil Imports BeReduced? . . . . . . . . . . . . . . . . . . . . . . . 69
Chapter 4
Issues and Findings
What are the Investment Costs forReducing U.S. Oil Consumption? . . . 74
Introduction . . . . . . . . . . . . . . . . . . . . . . 74Conventional Oil and Gas Production . 74
Automobile Fuel Efficiency . . . . . . . . . . 75Electric Vehicles . . . . . . . . . . . . . . . . . . . 77Synfuels . . . . . . . . . . . . . . . . . . . . . . . . . . 77Stationary Uses of Petroleum . . . . . . . . 78Conclusion . . . . . . . . . . . . . . . . . . . . . . . 78
Page
How Do the Environmental Impactsof Increased Automobile FuelEfficiency and Synfuels Compare? . . . 83
Public Health and Safety . . . . . . . . . . . . 84Worker Effects . . . . . . . . . . . . . . . . . . . . 84Ecosystem Effects . . . . . . . . . . . . . . . . . . 85Summary . . . . . . . . . . . . . . . . . . . . . . . . . 85
How Will the Social Impacts ofSynfuels and Increased AutomobileFuel Efficiency Compare? . . . . . . . . . . 86
Employment . . . . . . . . . . . . . . . . . . . . . . 86Community Impacts . . . . . . . . . . . . . . . . 86
How Do the Regional and NationalEconomic Impacts of Synfuels andIncreased Auto Efficiency Compare? . 87
Inflation and Economic Stability . . . . . . 87
Employment and InternationalCompetition . . . . . . . . . . . . . . . . . . . . . 87
Income Distributing Among Regions . . . 88Capital Intensity and Ownership
Concentration . . . . . . . . . . . . . . . . . . . 88

8/14/2019 Increased Automobile Fuel Efficiency and Synthetic Fuels: Alternatives for Reducing Oil Imports
http://slidepdf.com/reader/full/increased-automobile-fuel-efficiency-and-synthetic-fuels-alternatives-for 71/292
Page
What Do Incentives for Increased FuelEconomy Imply for the Evolutionand Health of the U.S. AutoIndustry ?. . . . . . . . . . . . . . . . . . . . . . . . 89
Can We Have a 75-Mpg Car?. . . . . . . . . . 90
Are Small Cars Less Safe than LargeCars?. . . . . . . . . . . . . . . . . . . . . . . . . . . 92
How Strong Is Current Demand forFuel Efficiency in curs?... . . . . . . . . . 93
What Are the Prospects for ElectricVehicles? . . . . . . . . . . . . . . . . . . . . . . . 94
lf a Large-Scale Synfuels Industry lsBu il t. .. Will Public and WorkerHealth and Safety as Well as theEnvironment be AdequatelyProtected? . . . . . . . . . . . . . . . . . . . . . . 95
Will Water Supply Constrain SynfuelsDevelopment? . . . . . . . . . . . . . . . . . . . 98
Are Synthetic Fuels Compatible WithExisting End Uses? . . . . . . . . . . . . . . . . 99Alcohols . . . . . . . . . . . . . . . . . . . . . . . . . 99Shale Oil . . . . . . . . . . . . . . . . . . . . . . . . . 99Direct Coal Liquids . . . . . . . . . . . . . . . . . 99Indirect Coal Liquids . . . . . . . . . . . . . . . 100Caveat .. . . . . . . . . . . . . . . . . . . . . . . . 100
TABLES
Table P/o, Page
9. Minimum Oil lmports for Base Case . 70
10. Contributions to the Reduction ofOil imports Beyond the Base Case . . 7011. Estimated Investment Costs for
Conventional Oil and NaturalExploration and Development . . . . . . 75
12. Capital Investment Allocated to FuelEfficiency Plus AssociatedDevelopment Costs . . . . . . . . . . . . . . . 76
Table No.13.
14.
15.
16.
17.
18.
19.
Investment Cost for VariousPage
Transportation Synfuels and ElectricVehicles . . . . . . . . . . . . . . . . . . . . . . . . 77Estimated investment Cost of FuelSwitching and Conservation inStationary Petroleum Uses Duringthe 1990’s. . . . . . . . . . . . . . . . . . . . . . . 78Plausible Consumer Costs forincreased Automobile Fuel Efficiency
Using Alternative Assumptions AboutVariable Cost Increase. . . . . . . . . . . . . 80Estima ted Consume r Cost ofVarious Fossil Synfuels UsingTwo Financing Schemes . . . . . . . . . . . 81Com pa rison o f Averag e a nd Highe stFuel Efficiency for 1981 ModelGasoline-Fueled Cars in EachSize Class . . . . . . . . . . . . . . . . . . . . . . . 93prope rties of Selec ted Jet FuelsDerived From Shale Oil and SRC-11 . . 100Properties of Selected Diesel FuelsDerived From Shale Oil and SRC-ll. . 100
FIGURES
Figure No. Page
4. Comparison of Base Case Oil Imports
5.
and Potential Reductions in TheseImports . . . . . . . . . . . . . . . . . . . . . . . . . 73Consumer Cost of Selected SynfuelsWith Various Aftertax Rates of Returnon lnvestment . . . . . . . . . . . . . . . . . . . . 81
A.
B.
c.
BOXESPage
Consumer Cost of lncreasedAutomobile Fuel Efficiency . . . . . . . . . . 79Consumer Cost of Synfuels. . . . . . . . . . 81Total Cost and lnvestment Cost . . . . . . 82

8/14/2019 Increased Automobile Fuel Efficiency and Synthetic Fuels: Alternatives for Reducing Oil Imports
http://slidepdf.com/reader/full/increased-automobile-fuel-efficiency-and-synthetic-fuels-alternatives-for 72/292
Chapter 4
Issues and Findings
INTRODUCTION
This c hapter is a summ ary and c om parison o f
major results from the analyses discussed later inthe report. It also contains additional analyseswhe re ne ed ed to p ut the results in perspe c tive.
It begins with a discussion of the true cost ofimported oil. Increased automobile fuel efficien-cy, synfuels, and conservation and fuel switchingin stationary petroleum uses are then comparedaccording to the speed with which they can act
to reduce oil imports and their respective invest-me nt c osts. Inc rea sed auto fuel effic iency a ndsynfuels are compared according to their environ-menta l, soc ial, and ec onom ic imp ac ts. Estimated
consumer costs for increased automobile fuel effi-ciency and synfuels are also given in separateboxes, but the uncertainties are too large for anymeaningfuI comparison. In addition, there is abox discussing the uncertainties in total consumerc osts for eac h of the o il displac eme nt op tions.
Following the comparisons, several issues re-
lated specifically to increased automobile fuel effi-c iency o r to synfuels are c overed . For auto mo -b iles, the issues include the effe c ts of incentivesfor inc rea sed fuel effic iency o n the evolution a ndhealth of the U.S. auto industry, the possibilitiesfor a highly fuel-effic ient c a r, the safe ty of sma llcars, current demand for fuel efficiency i n cars,and the prospec ts for elec tric vehic les. For syn-fuels, probable environmental dangers, waterconstraints, and compatibility of synfuels with ex-
isting end uses a re c onsidered .
Each separate entry in this chapter is designed
to sta nd a lone a nd g enerally doe s not b uild onothe r ma teria l in the chap ter. The c hapter is notdesigned to be read from beginning to end; rath-er, each reader can turn directly to those compar-isons and issues of interest without loss of con-text or reg ard fo r the wa y the e ntries are orde red .
WHAT DO OIL IMPORTS COST?
The private U.S. consume r pa ys the go ing m ar-ket price for imported oil, but that is not its onlyeconomic cost. In the last decade, the Nation has
been forced to pay a substantial additional “pre-mium” because of its strategic dependence on
a small number of foreign oil producers. Duringespecially unstable periods, such as the 1973-74Middle East War and the 1978-79 Iranian Revolu-tion, this import premium payment is highly visi-ble a nd, whe n me asured in terms of the inc re-mental cost for that segment of demand whichclearly exceeds available supplies, it can greatlyexceed the actual market price.
It is rea sona ble to attribute an excep tional pre-
mium payment to oil, and not to other imported
go od s and servic es, be c ause uninterrupte d oilsupplies are critical to economic stability (i.e., few
substitutes exist at least in the short run) andbeca use the United States has beco me the prom-inent imp orter on the wo rld sc ene and has as-
sumed major responsibility for protecting worldoil trade. No other import constitutes such a vitalec onom ic resource that must flow in such a large
c ontinuous strea m around the w orld. Althoug hthe third quarter of 1981 has witnessed fa lling o ilprices and a modest supply surplus, future short-
age risks remain plausible because of the ex-pected longrun depletion of world oil reservesand be c ause of unresolved a nd p ote ntial inter-national conflicts.
The e xistenc e o f a national premium p aym entfor oil imports can be explained in terms of three
economic relationships:
1.
2.
the dependence of international price on the
quantity of U.S. imports;the loss of U.S. jobs and gross na tiona l prod -uc t (GNP) ca used by oil pa yments ab roa dand the associated depreciation of the dollar;
a nd
67

8/14/2019 Increased Automobile Fuel Efficiency and Synthetic Fuels: Alternatives for Reducing Oil Imports
http://slidepdf.com/reader/full/increased-automobile-fuel-efficiency-and-synthetic-fuels-alternatives-for 73/292
68 q Increased Autornobile Fuel Efficiency and Synthetic Fuels: Alternatives for Reducing Oil Imports
3. the budgetary cost of military outlays and for-
eign milita ry assistance related to assuringthe security of oil imports. These are de-sc ribed b elow.
Dependence of Price on
Quantity ImportedMarket price is a good measure of real or total
cost when markets are competitive and in a stateof stable equilibrium. Neither situation is charac-
teristic of international oil markets, which aredominated by a small number of sellers and buy-ers in an unstable marriage of short-term conven-ience. Despite the complexity and unpredictabil-
ity of this relationship, it seems reasonably clearthat raising U.S. oil imports drives price upwardand vic e versa, simp ly be c ause a ny move me ntby such a prominent impo rter ap pe ars to the rest
of the wo rld as a shift in the world de ma nd c urve.This positive relationship between quantity im-ported and price means that the cost of incremen-
tal U.S. consumption exceeds current pricebecause the increment makes all future consump-tion more expensive. Conversely, decrements in
U.S. consumption save more money than themarginal reduction in purchases.
Eventually, oil markets may anticipate thisprice/quantity relationship, but market adjust-ments may not be smooth. Shocks can be ex-pected, leading to domestic inflation and reces-
sion, because international relationships betweenexporters and imp orters have be c ome po litic izedand because significant reductions in oil con-sumption are difficult to achieve over periods ofup to several years due to the long lifetimes ofenergy-related capital stock and the long lead-time for alternative domestic fuels.
Loss of U.S. Jobs and GNP Causedby Rising Oil Payments and byPotential Supply Interruptions
Oil imports accounted for 26 percent of U.S.payments for imports in 1979, which is abouttwice the level of the sec ond large st item. Con-sequently, compared with equivalent rates ofgrowth o r dec line for other imports, cha nge s over
time in oil payments have a relatively large im-
pa ct on the U.S. balance of trad e, and, hence ,a relatively large impact on the exchange value
of the dollar.
In periods when the dollar is relatively strong,as it has been recently (second half of 1981), itis due in part to declining oil payments. In periods
when the dollar is weak, as it was during mostof the 1970’s and especially after 1975 because
of large de fic its in mercha ndise t rad e, g row ingoil payments increase selling pressure on the dol-
lar, lowering its foreign exchange value. Whilethis makes U.S. exports more attractive to foreignbuyers, export sales may not increase elasticallybecause of stagnant world economy or failure ofU.S. goo ds to m ee t qua lity sta nd ards. Therefore,market adjustments, including both higher pricesand undoubtedly reduced purchases, are forcedon U.S. importers.
Furthermore, the declining value of the dolIarhas relatively little effect on oil imports, again dueto the long lifetimes of capital related to oil con-
sumption. Barring economic recession, oil con-sumption significantly declines only with the slowrep lac em ent o f capita l. Thus, even thoug h risingoil imports or sharply rising oil import prices maybe clearly responsible for dollar depreciation, oilconsumption may not bear the brunt of the re-sulting short-term adjustment.
Ove ra ll, ad justme nts in the U.S. ba lanc e o f pa y-ments also affect domestic economic activity. A
sharply rising oil import price directly increasesdo me stic inflation w hile at the sam e time large rforeign payments can lower total demand for do-
mestic goods and services if, as is likely in theshort run, oil exporters do not spe nd their large rreceipts in the United States. This combinationof rising inflation a nd de c lining to tal de ma nd putsthe Federal Government in a difficult position be-cause corrective policies are contradictory. If con-
trol of inflat ion is the p rima ry objec tive, sharp oilprice increases may force the Government tobrake the growth momentum of the nationaleconomy or exaggerate downward cycles in or-
der to limit propagation of inflationary pressures.In addition to oil price shocks, potential sup-
p ly inte rrup tions of oil imp orts p resent the c lear-est, most direct threat to national economic activ-ity. As discussed above, few good substitutes exist

8/14/2019 Increased Automobile Fuel Efficiency and Synthetic Fuels: Alternatives for Reducing Oil Imports
http://slidepdf.com/reader/full/increased-automobile-fuel-efficiency-and-synthetic-fuels-alternatives-for 74/292
Ch. 4—issues and Findings q 6 9
for oil in the short run, so that reduced flow re-sults in lost production and unemployment assoon as stockpiles can no longer make up for thedeficit.
The p otential premium pa yment, imp lied b ybo th unsta ble o il import prices and supp ly inter-
ruptions, c an b e illustrate d in terms of the 1973-74 shock. In 1974 and again in 1975, real GNPdeclined by more than a percentage point afterhaving grown at a rate of 5 percent in 1973 and4 percent in 1972. Although cause and effect inmacroeconomics is highly speculative, the lossesin 1974 and 1975 are widely believed to havebe en d ue in p art to the d isruption o f oil supp liesand the assoc iated q uad rupling of impo rted oilp ric es. If, in fac t, rea l GNP grow th ha d b ee n re-duced by just one percentage point by oil-related
events, it would have meant a loss of about $15
billion in U.S. production ($1.5 trillion GNP in1975), which amounts to $6.80 per barrel (bbl)for the 2.2 billion bbl imported that year. Theprice of oil at that time was about $11.
Military Outlays and Foreign PolicyDirections Forced by Oil
Import Dependence
Military and foreign policy are predicated onmany national objectives, but apparently onevery imp ortan t considerat ion for the United Sta tesis protection of oil supply lines. The cost of such
protection c annot be asce rtained d irec tly, butcurrent debate over defense budget prioritiesindica tes that the United States intends to de velopweapons systems and train personnel in order to
be ab le to fight a wa r in the M idd le East, if nec -essary.
If 10 percent of estimated 1982 defense outlayswere justified to meet military threats to MiddleEast oil supplies, it amounts to about $18 billionor about $9/bbl for the 2 billion bbl of oil im-ported (net of exports) in 1981.
ConclusionThe c omplexity a nd unpredicta bility of wo rld
oil markets and wo rld oil politic s ma ke it difficultto p red ict the oil import p remium o ver time . * InOTA’ s judgme nt, the possible future imp ort p re-mium could range up to $50/bbl. It could be neg-ligible if world demand continues its sharp down-ward trend and if major new discoveries aremade outside the Middle East, but could be muchlarger than the current price of oil if hostilitiesbreak out which cut off most supplies from theMiddle East.
A technical analysis must stop short of greater
certainty except to indicate that a significant re-duction of imports would drive the premiumdown by reducing the visibility of the UnitedStates in world oil markets and by reducing U.S.dependence on supplies from politically unstablecountries. In other words, the premium paymentfor the last b a rrel of imp orts is muc h higher thanfor the first, and it is the last b arrel which wo uldbe displac ed by do me stic synfuels or by higherfuel effic iency in a utomob iles.
*A number of estimates for both components of the oil importpremium are available. For the most detailed discussion of relatedeconomic issues and documentation of results from current eco-nomic models, see VVor/cf Oil, Energy Modeling Forum, StanfordtJniversity, Stanford, Calif., ch . 5 (forthcoming).
HOW QUICKLY CAN OIL IMPORTS BE REDUCED?
Op tions for reduc ing U.S. oil co nsump tion a re Table 9 shows the estimated level of importsconsidered in detail later in the report. Here, the in the absence of synthetic fuels and automobile
results of those analyses are summarized and the fuel-efficienc y inc reases beyond a 1985 leve l ofrelative contributions that the various options can 30 mpg. This base case also assumes: 1) the En-make to reducing imports over the next two dec- ergy Information Administration’s (EIA) high oilades are considered. price future to 1990 for the consumption of oil

8/14/2019 Increased Automobile Fuel Efficiency and Synthetic Fuels: Alternatives for Reducing Oil Imports
http://slidepdf.com/reader/full/increased-automobile-fuel-efficiency-and-synthetic-fuels-alternatives-for 75/292
70 q Increased Automobile Fuel Efficiency and Synthetic Fuels: Alternatives for Reducing Oil Imports
Table 9.-Minimum Oil Importsfor Base Case (MM B/DOE)
1980 1985 1990 1995 2000
Stationary demanda (noadditional measurespast 1990) . . . . . . . . . . . . 8.1 7.3 6.4 6.4 6.4
Transportation demand(other thanautomobiles . . . . . . . . . . 4.5 4.7 5..0 5.4 5.7
Automobiles (with1985 new-car averageof 30 mpg, no changethereafter) . . . . . . . . . . . . 4.3 3.6 3.0 2.7 2.7
Sum of demand . . . . . . . . . 16.9 15.6 14.4 14.5 14.8Domestic production . . . . 10.2 8.6 7.6 7.1 7.0
Imports. . . . . . . . . . . . . . . . . 6.7 7.0 6.8 7.4 7.8%cludes all nonfuei oil uses such as asphalt, petrochemical feedstock, liquefiedpetroleum gas, etc., which are projected by the Energy Information Administra-tion to total 3.8 MMB/D by 1990,boil PIUS natural gas liquids.
SOURCE: Office of Technology Assessment,
for stationary uses;1 2) the transportation petro-
leum demand (other than for passenger cars) ex-plained in chapte r 5; 3) fuel oil demand by sta -tionary uses is held constant after 1990; and 4)the maximum domestic oil production projectedby OTA.2 For 1995 and 2000, the trends of the1980’s for stationary uses of petroleum other thanfuel oil have been extrapolated, while holdingfuel oil consumption constant at the projected1990 leve l. The assump tion o f c onsta nt fue l oildemand for the 1990’ s wa s c hosen a s the b asecase to help illustrate the importance of eliminat-ing this demand relative to othe r options for re-ducing oil imports in the 1990’s.
It should b e emp hasized tha t a conside rab lered uc tion in oil consump tion throug h increasedefficiency and fuel switching in the 1980’s is al-ready built into the base case. in particular,achieving an average new-car fuel efficiency of30 mpg by 1985 saves about 0.8 million barrelsper day oil equivalent (MMB/DOE) by 1990, rela-tive to 1980 demand;* and conservation and fuelswitc hing in the EIA high oil pric e scena rio reduc eoil consumption by 1.7 million barrels per day
1 Energy Information Administration, U .S. Depatiment of Errergy.
z wOr/d petfo/eurn Availability: 19802~ Technical Memoran- dum, OTA-TM-E-5 (Washington, D. C.: U.S. Congress, Office ofTechnology Assessment, October 1980).
*The fuel saved in cars is 0.9 million barrels per day (MMB/D),
but the assumed increase in transportation needs raises consump-tion in other types of transportation by 0.1 MMB/D.
(MMB/D) in stationary uses by 1990. However,domestic oil production is likely to drop by atleast 2.6 MMB/D during this same time period, 3
thereby nullifying any reduction in oil importsfrom these measures alone.
Table 10 shows the various reductions in oil
consumption that may be achieved beyond thebase c ase. These inc lude c ont ributions from fur-ther conservation and fuel switching in stationaryuses, increased automobile fuel efficiency beyond
a 1985 level o f 30 mpg, electric vehicles (EVs),and synfuels. Each of the areas where additionaloil savings are possible is discussed below.
By 1990, stationary demand for residual anddistillate fuel oil is 2.6 MMB/ D in the base c ase. *As explained in c hap ter 7, a c omb ination of c ost-effective conservation measures and switching tonatural gas and electricity can eliminate this sta-tionary fuel oil demand without a need to in-crease gas production or electric generating ca-pacity. How much of this potential actually isreached will depend on such things as individual
de c isions ab out c onservation investme nts and3
World Petroleum Av aila bility: 19802-Tec hnic al Mem oran-
dum, op. cit.*The remainder of the 6.4 MM B/D of stationary oil use includes
asphalt, petrochemical feedstocks, liquefied petroleum gas, and re-finery still gas.
Table 10.—Contributions to the Reduction of OilImports Beyond the Base Case (MMB/DOE)
1980 1985 1990 19952000
Conservation andswitching instationaryapplications . . . . . 0 0 0 0.8a-1.3 l.5a-2.6
Increased automobilefuel efficiencybeyond 1985average of 30mpg . . . . . . . . . . . . 0 0-0.1 0.1-0.5 0.3-1.0 0.6-1.3
(Average new-carefficiency,mpgb). . . . . . . . . (23) (30-37) (36-49) (40-63) (45-79)
Electric vehicles . . . 0 0 0 0 0-0.1Synthetic transpor-
tation fuels:Fossil . . . . . . . . 0 0-0.1 0.3-0.7 0.7-1,9 1.3-4.5
Biomass . . . . . . 0 (c) 0-0.3 0-0,6 0,1-1.0. — — — —Total . . . . . . . . . . . 0 0-0.20 .4-1.5 1.8-4.8 3.5-9.5
aEnergY Information Administration forecast.bss percerlt EPA citylds percent EPA highway test wcles.CLeSS tharl 0.05 MMBID.
SOURCE: Office of Technology Assessment.

8/14/2019 Increased Automobile Fuel Efficiency and Synthetic Fuels: Alternatives for Reducing Oil Imports
http://slidepdf.com/reader/full/increased-automobile-fuel-efficiency-and-synthetic-fuels-alternatives-for 76/292
Ch. 4—issues and Findings q 7 1
availability of transmission and distribution sys-tem s. The m ost rec ent projec tion o f EIA p rovidesa reasonable lower bound on the reduction infuel oil that c an b e a c hieved during the 1990’s.
The rang e o f po tent ial sav ings from increased
automobile fuel efficiency corresponds to the low
and high estimates derived in chapter 5 and dif-ferent assumptions about relative future demandfor small-, medium-, and large-sized cars, i.e.,1) no shift to smaller cars and pessimistic assump-tions about efficiency increases from automotivetechnologies, and 2) a substantial shift to smallercars and optimistic assumptions about the tech-nologies. By 2010, automobiles containing theaverage technology of 2000 would have replaced
most cars on the road and the savings, relativeto the base case, would be 0.8 to 1.7 MMB/D (2.3to 3.2 MMB/D relative to 1980 demand).
It should be emphasized that average new-carfuel effic iencies shown in ta ble 10 do not rep re-sent a technical limit to what can be achieved.In any given year, cars with higher (and lower)mileages than those shown would be producedand sold. * Rather, the mileage ranges correspondto w ha t OTA c onsiders to b e feasible through avariety of tec hnologica l improveme nts.
If a very strong de ma nd for fuel-effic ient c arsdevelops, e.g., as the result of continued largeoil pric e increases, consume rs ma y be willing toaccept poorer performance or pay the added cost
in o rde r to a c hieve highe r fuel effic ienc y. In thiscase, the estimated average fuel efficiency shownfor 2000 in table 10 could be achieved by themid- 1990’s.
The c ontribution from EVs wa s c alc ulate d b yassuming that O to 5 percent of passenger auto-mobiles would be electric by 2000, growinglinearly from O perc ent a t 1985, The savings from
EVs is relatively small, however, because of therelatively low consumption of petroleum by auto-
mobiles (1.3 to 2.1 MMB/DOE in 2000) and the
*For example, u p until January 1981, the 1981 model new-car
fuel efficiency of cars sold averaged slightly less than 25 mpg, butif the most fuel-efficient cars in each size class had been bought,the average would have been about 33 mpg.4
4Derived from data in J. A. Foster, J. D. Murrell, and S. L. Loos,“Light Duty Automotive Fuel Economy . . . Trends Through 1981 ,“U.S. Environmental Protection Agency, SAE paper No. 810386, Feb-ruary 1981,
fac t tha t EVs wo uld be a substitute fo r the m ostfuel-efficient cars.
The fina l ca teg ory in tab le 10, synthet ic fue ls,must be considered carefully to ensure that only
the synthetic fuels production that displaces oilis included and technical difficulties are ac-
c ounted for. To d erive the low estima te o f syn-fuels contributions, it is assumed that by the time
synthetic fuels become available, the only re-maining stationary uses of petroleum are forc hemic al feed stoc ks, aspha lt, petroleum c oke,still gas, and liquefied petroleum gas (LPG). Sincethese products cannot now be economically con-verted to transportation fuels, the low estimatein table 10 assumes that their replacement by syn-
thetic fuels (synthetic gas) would not result in ad-ditional transportation fuels. * In addition, poorperformance of the first round of synfuel pIantsis assume d, limiting p roduc tion until the ea rly to
mid-1 990’s. As a consequence of this, the lowsynfuels production scenario from chapter 6 isused in the table 10 low estimate.
A m ore op timistic sc enario is possible if it is as-sumed that market or other forces strongly favorthe production of transportation fuels over syn-thetic fuel ga ses and that half of t he syntheticgas* * plants projected in chapter 6 actually are
built to produce synthetic transportation fuels.With these assumptions and the high scenariospresented in chapter 6, one arrives at the upperestima te for oil displac ement by synfuels show n
in table 10. The high estimate, however, repre-sents a vigorous dedication to synfuels produc-tion and what might be termed near “war mobil-
ization” development of the industry.
The range of oil savings from each of thesesources is shown in figure 4, alongside the im-po rt levels c alc ulate d in the ba se c ase. As c anbe seen, under the most favorable circumstances
it is technically possible to eliminate oil importsby 2000. However, if domestic oil production s
is below that shown in table 9 and if only the lowestimates of table 10—or even only the low esti-
*LPG can, however, be used directly in appropriately modifiedautomobiles.
**Excluding biogas from manure, which would be used principal-ly on the farms where it is produced.
5World Petroleum Ava ilability: 1980-2000- Tec hnica l Mem oran-
dum, op. cit.
98-281 0 - 82 - 6 : QL 3

8/14/2019 Increased Automobile Fuel Efficiency and Synthetic Fuels: Alternatives for Reducing Oil Imports
http://slidepdf.com/reader/full/increased-automobile-fuel-efficiency-and-synthetic-fuels-alternatives-for 77/292
72 . Increased Automobile Fuel Efficiency and Synthetic Fuels: Alternatives for Reducing Oil Imports
Photo credit: Paraho Development Corp.
The Paraho Semiworks Oil Shale Unit at Anvil Points, Colo.

8/14/2019 Increased Automobile Fuel Efficiency and Synthetic Fuels: Alternatives for Reducing Oil Imports
http://slidepdf.com/reader/full/increased-automobile-fuel-efficiency-and-synthetic-fuels-alternatives-for 78/292
Ch. 4—issues and Findings q 7 3
Figure 4.—Comparison of Base Case Oil Imports and Potential Reductions in These Imports
10 —
9 —
8 -
7 -
6 —
5 —
4 “
3 -
2 —
1
0
1980 1985 1990 1995
B
2000
Year
O i l i m p o r t . i n b a s e c a s e
Increased efficiency and fuel switching in stationary uses Fossil and biomass synthetic fuels
= Electric vehicles
Increased automobile fuel efficiency (relative to 1985 A = Low scenarios as outlined in textaverage of 30 mpg)
SOURCE Office of Technology Assessment.
mate for synfuels—are reached, then it is quiteunlikely that oil imp orts c an be eliminated be foresometime well into the first decade of the 21stcentury.
Although the large numb er of note wo rthy un-c ertainties ma ke an exac t de termination of thec ourse of oil imp orts impo ssible, seve ral c onc lu-sions c an be draw n.
First, increased efficiency and fuel switching in
buildings and industry are extremely importantfor the reduction of oil consumption. Althoughmuch of the potential in this area will be achieved
through market forces by 2000 under the highoil price scenario of EIA, implementing the nec-essary changes at an earlier date could significant-ly reduce oil imports before 2000. For example,
B = High scenarios as outlined in text
fully implementing the potential for reducing sta-
tionary uses of fuel oil by 1990 would save about15 billion bbl of oil imports or $600 billion (atan average of $40/bbl) for the imports during theperiod 1981-2000.
Sec ond , synthetic fue ls de velopm ent has ap-proximately the same importance as the conser-
vation and fuel switching options but its contribu-tion to red uce d imp orts will not b e a s large untila t lea st the late 1990’ s. Further, if a large part ofthe synfue ls is used as a sub stitute for inc rea sedefficiency and for conventional fuel switching in
stationary uses or as a substitute for petroleumproducts not readily converted to transportation
fuels, elimination of oil imports is likely to bedelayed.

8/14/2019 Increased Automobile Fuel Efficiency and Synthetic Fuels: Alternatives for Reducing Oil Imports
http://slidepdf.com/reader/full/increased-automobile-fuel-efficiency-and-synthetic-fuels-alternatives-for 79/292
74 q Increased Automobile Fuel Efficiency and Synthetic Fuels: Alternatives for Reducing Oil Imports
Third, increases in automobile fuel efficiencybeyond a 1985 averag e of 30 mpg c ould reduc e
auto mo bile fuel co nsump tion 20 to sO p ercent(0.6 to 1.3 MMB/D) by 2000 below the fuel con-sumption of a 30-mpg fleet. in addition, because
fuel efficienc y inc reases in automo b iles (to a ndbeyond 30 mpg) could reduce the automobile’s
share of transportation fuel needs from so per-cent (in 1980) to 20 to 25 percent (in 2000), itis likely that efficiency increases in various non-automobile transportation uses beyond those as-
sume d in the base c ase c ould a lso m ake signifi-cant contributions to reducing transportation fuel
needs. This option has not been analyzed byOTA.
In summary, it probably will be necessary toimplement fully all of the options for reducingoil c onsump tion if one w ants to eliminate net o ilimports before the first decade of the next cen-
tury. This will require full implementation ofcharges needed for increased efficiency in all uses
of oil and fuel switching in stationary uses, as wellas directing synfuels production to transportationfuels.
WHAT ARE THE INVESTMENT COSTS FORREDUCING U.S. OIL CONSUMPTION?
Introduction
investme nt c osts are a n imp ortant c onsidera-tion when comparing alternatives for reducingU.S. oil consumption. OTA’s analysis indicatesthat synfuels production, increased fuel efficiencyin automobiles, and conservation and fuel switch-ing in stationary uses of oil all will require invest-ments of the same order of magnitude for com-parable reductions in oil. consumption in the1990’s; whereas, synfuels production appears to
require larger investments than the other alterna-tives for the 1980’s. Uncertainties in the cost esti-mates as well as the fundamental differences in
the nature of the investments are too large, how-ever, to allow a choice between approaches onthis basis alone.
In order to compare investment costs, theyhave been expressed as the investment needed
to either produce or save 1 barrel per day oileq uivalent* of p etroleum p roduc ts. This me thodwas chosen in order to avoid problems that arisewhen comparing investments in projects with dif-ferent lifetimes and for which future oil savingsma y be disc ounted at different rates.** In ad di-tion, from a national perspective the per unit in-
*One barrel of oil equivalent = 5.9 MMBtu.**It does not, however, avoid the problem that the different par-
ties making the investments will have fundamentally different con-straints on and perspectives about these investments and thus willreact quite differently in the face of investments of the same size.
vestment cost is important in that it is the param-
eter used in the aggregate to make choicesamong competing investments. Conventional oil
and gas exploration are considered first to pro-vide a refe renc e p oint. Follow ing this, OTA’ s esti-mates for the investment costs for increased auto-
mobile fuel efficiency, EVs, synfuels, and in-creased efficiency and fuel switching in stationary
uses are discussed briefly.
Conventional Oil and Gas Production
Two estimates of recent investment costs forconventional oil and gas exploration anddevelopment in the United States are shown inta ble 11. The d ata in this ta ble w ere de velope dfrom e stima tes of the annua l investments in o il,gas, and natural gas liquids exploration and devel-opment per barrel of increased proven reservesof the se fue ls (correc ted for de p letion). These lat -
ter estimates were then converted to investmentsfor an increase of 1 barrel per day (bbl/d) of pro-
duction (corrected for depletion) using the 1980ratio of crude oil reserves to crude-oil produc-tion and assuming an 8 percent refining loss. Theratio of reserves to production for natural gas was
not used be c ause p ric e c ontrols on na tural ga stend to inflate this ratio and thus the estimatedcosts; and investments for oil exploration and de-velopment were not separated from those for nat-
ural gas because there is no practical way to doso.

8/14/2019 Increased Automobile Fuel Efficiency and Synthetic Fuels: Alternatives for Reducing Oil Imports
http://slidepdf.com/reader/full/increased-automobile-fuel-efficiency-and-synthetic-fuels-alternatives-for 80/292

8/14/2019 Increased Automobile Fuel Efficiency and Synthetic Fuels: Alternatives for Reducing Oil Imports
http://slidepdf.com/reader/full/increased-automobile-fuel-efficiency-and-synthetic-fuels-alternatives-for 81/292
76 q Increased Automobile Fuel Efficiency and Synthetic Fuels: Alternatives for Reducing Oil Imports
Table 12.—Capital Investment Allocated to Fuel Efficiency Plus Associated Development Costs
Average capital investment plusassociated development costsb
Thousand 1980 dollars perbarrel per day oil
New-car fuel efficiency at equivalent ofTime of investment Mix shift end of time perioda (mpg) fuel savedc 1980 dollars per car producedd
1985-1990 . . . . . . . . . Moderatee 38-48 20-60 g50-1909
Largef 43-53
1990 -1995 . . . . . . . . . Moderate e 43-59 60-1309 70-1809Largef 49-65
1995-2000 . . . . . . . . . Moderate e 51-70 50-1509 50-1509Largef
58-78a EpA rated 5w45 percent city/highway fuel efficiency of avera9e new car.b Development costs assumed to be 40 percent of capital investment allocated
to fuel efficiency (see text). One barrel of oil equivalent contains 5.9 MMBtu.c Ave rages a re ca lcu la ted by dividing average investment fOr technological im-
provements by fuel savings for average car at end of time period relative toaverage car at beginning of time period. The resultant average cost per barrelper day is lower than a straight average of the investments for each car sizebecause of mathematical differences in the methodology (i.e., average of ratiosv. ratio of averages) and because extra fuel is saved due to demand shift tosmaller cars. The averaging methodology used is more appropriate for compari-sons with synfuels because it relates aggregate Investments to aggregate fuelsavings. It should be noted that the cost of adjusting to the shift in demandto smaller-sized cars is not included. Only those investments which increasethe fuel efficiency of a given-size car are included.
d Assuming l n v e9 tmen t iS used to produce cars fOr 10 Years, on the avera9e.
e Moderate shift In demand to smaller cars. Percentage Of new carS sold in each
size clasa are:SOURCE: Office of Technology Assessment.
changes in the car. * The c ost alloca tion prob lem
associated with multipurpose investments is wellknown in accounting theory, and there is no fullysatisfactory solution to it.7
For table 12, it was assumed that 50 percentof the cost of engine and body redesign, 75 per-cent of the cost of most transmission changes,and 100 percent of the cost of advanced materials
substitution a nd e nergy storag e a nd a utomatic
engine cutoff devices should be allocated to fueleffic ienc y. This results in be tw ee n 55 and 80 per-c ent of the investme nts be ing alloc ated to fuelefficiency, depending on the time period and sce-nario chosen. For further details on how this andother problems in estimating the cost of fuel effi-c ienc y were resolved, see c hap ter 5.
*For example, automobile designs with low aerodynamic dragmay be preferred by consumers on esthetic grounds; front wheeldrive may be introduced to improve traction and increase interiorvolume; microprocessor control of carburetion or fuel injection,spark advance, exhaust gas recirculation, and other operating condi-tions can be used to reduce exhaust emissions, improve perform-ance, and enable the use of lower octane fuels; continuously vari-
able transmissions may be introduced to produce smoother acceler-ation and improve performance. These and many other changescan also be exploited to improve fuel efficiency.
7A. L. Thomas, “The Allocation Problem in Financial Account-ing Theory, ” American Accounting Association, Sarasota, Fla., 1969,
pp. 41-57, and A. L. Thomas, “The Allocation Problem: Part Two, ”American Accounting Association, Sarasota, Fla., 1974.
Year/size class Large Medium Small
1985 35 60 5
1990 25 60 15
1995 20 55 2535
fLarge shift in demand to smaller cars. Percentage of new cars sold in each
size class are:Year/size class Large Medium Small
1965 15 75 101990 5 65 30
1995 5 45 502000 5 25 70
g
Within uncertainties, the costs are the same for both mix shifts.
During the period 1985-2000, total capital in-vestments in changes associated with increasingfuel efficiency (i.e., allocating 100 percent of themultipurpose investments to fuel efficiency) could
average $2 billion to $5 billion per year, depend-ing on the number of new cars sold and the rate
at which fuel efficiency is increased. However,if one ded ucts the c ost of c hanges that wouldhave been made under “normal” c ircum-stances, * the added capital investment needed
to achieve the lower mpg numbers in table 12wo uld b e $0.3 b illion to $0.7 billion p er yea r. Thehigher mpg numbers in table 12 would requireadded capital investments (above “normal”) of
$0.6 billion to $1.5 billion per year. Adding 40percent of the capital investment for development
costs results in added outlays of $0.4 billion to$0.9 billion per year and $0.8 billion to $2 billionper year for the low and high scenarios, respec-tively.
A d eta iled examination of the sc ena rios pre-sented in cha pter 5 shows that a 1990 new-ca r
*Assuming “normal” capital turnover is: engines improved after6 years, on average, redesigned after 12 years; transmissions sameas engines; body redesigned every 7.5 years; no advanced materials
substitution.

8/14/2019 Increased Automobile Fuel Efficiency and Synthetic Fuels: Alternatives for Reducing Oil Imports
http://slidepdf.com/reader/full/increased-automobile-fuel-efficiency-and-synthetic-fuels-alternatives-for 82/292

8/14/2019 Increased Automobile Fuel Efficiency and Synthetic Fuels: Alternatives for Reducing Oil Imports
http://slidepdf.com/reader/full/increased-automobile-fuel-efficiency-and-synthetic-fuels-alternatives-for 83/292
78 q Increased Automobile Fuel Efficiency and Synthetic Fuels: Alternatives for Reducing Oil Imports
tion, they most likely represent a lower limit ofthe synfuels investment costs. *
Stationary Uses of Petroleum
OTA ha s also c onsidered the c osts of c onser-vation and fuel switching in stationary uses of oil,
although not in the same detail as for synfuelsand inc rea sed auto mo bile fuel efficiency. Themajor candidates are the residual and distillatefuel oils still used in stationary applications after1990. Other stationary uses of petroleum—as-phalt, petrochemical feedstock, still gas, and liq-uefied petroleum gas (LPG)—were not considered
to be major potential supplies of increased trans-portation fuels. Although LPG can technically be
used as a transportation fuel, and petrochemicalfeedstocks can be replaced by synthesis gas fromcoal, a preliminary analysis indicates that the fuel
oils are more economically attractive alternatives
for increasing supplies of transportation fuels inmost cases.
OTA’ s estima tes for the inve stment c osts of fue l
switching and increased energy efficiency in sta-tionary uses during the 1990’s are shown in table
14. Although only single numbers are shown, infact there will be a range of costs depending ondevelopment costs for new energy supplies, in-stallation costs for end-use equipment, the extentof changes needed at oil refineries, and variations
in conservation investments. Of the fuel switchingop tions the range is na rrow est fo r fuel switc hing
to elect ricity bec ause o f the fairly well-defined
“Decisions about whether and how quickly to proceed with in-vestments in synfuels production, however, will be strongly influ-enced not only by estimated costs but by corporate strategy.
cost of producing electricity from coal and largestfor fuel switching to natural gas because of differ-
enc es in the c ost of d evelop ing va rious unco n-ventional gas supplies.
In d eriving the numb ers in table 14, it wa s as-sumed that the lower c ost o pp ortunities for fuelswitching and conservation would already havebe en c arried out by 1990. To the extent tha t thisdoes not occur, the per-unit investment cost esti-mates for the 1990’s wouId be lowered some-what. Also, increased end-use efficiency of elec-tricity for heat and hot wa ter would reduc e theinvestment needed for electric powerplants; andif large supplies of relatively inexpensive gas are
found , fuel switching to ga s c ould b e a very at -tractive option, in terms of capital investment. Be-cause of these uncertainties and site-specific dif-ferences in installation costs, one cannot clearlychoose among the alternatives on the basis of in-
vestment c osts alone . All of the o p tions to elimi-nate stationary fuel oil use seem to require thesam e o rde r of ma gnitude of investme nts.
Conclusion
Three principal conclusions emerge fromOTA’ s ana lysis of inve stment c osts for the va riousways of reducing oil consumption. First, there isa great deal of uncertainty about investment costs
due to te c hnologica l unknowns, lac k of expe ri-enc e, and site-spe c ific c ost differenc es. * Sec ond ,
*The situation is further complicated by the different nature ofthe investments. Synfuel plant construction requires large invest-ments over a number of years before any product is sold. Auto in-dustries tend to make incremental changes in capital stock, withthe sum of several such investments sometimes costing more thanone abrupt changeover in capital stock. Investments in fuel switch-ing and conservation are paid back through future fuel cost sav-ings rather than product sales.
Table 14.—Estimated Investment Cost of Fuel Switching andConsecration in Stationary Petroleum Uses During the 1990’s
Thousand 1980 dollars per barrel per day of oil replaced or saved
Conversion to Conversion to Conversion of boilers from Increased efficiencyInvestment at natural gas electricity residual fuel oil to coal and fuel switching
End use equipment . . . . . . . . . . . . . . . . . . 24 32 37 (51)a 88New production of fuel . . . . . . . . . . . . . . . 90 78 b 16C (22)a o
Total . . . . . . . . . . . . . . . . . . . . . . . . . . . . . 114 110 53 (74)a 88The number in parenthesis is corrected for the 72-percent efficiency of refining residual fuel oil and is the Investment per barrel per day of resultant distillate oil pro-
duced from the residual 011.btin9truction of coal-fired powerpiant ($74,000) Plus new coal mining (S4,400).CM~ification of reflnerleg t. upgr~e residual oil to distillate fuels, $14,000, and incre~~ COSI production, $2,000. The refinery modification is based on data presented
in ch. 6, assuming that 0.6 MMB/D of domestically produced residual oil is already being upgraded in 1990.
SOURCE: Office of Technology Assessment.

8/14/2019 Increased Automobile Fuel Efficiency and Synthetic Fuels: Alternatives for Reducing Oil Imports
http://slidepdf.com/reader/full/increased-automobile-fuel-efficiency-and-synthetic-fuels-alternatives-for 84/292
Ch. 4—issues and Findings Ž 79
even if more c ertain cost d ata were ava ilab le to- been made, the annual capital investmentday, different inflation rates in different sectors needed to maintain all aspects of liquid fuel pro-
of the ec onomy or mode st tec hnica l de velop - duction and use will depend on the level of fuel
ments could change any conclusions about rela- efficiency a c tually ac hieved . In p artic ular, hightive costs by the 1990’s. Finally, once the initial levels of e fficienc y in end uses will require lowe rinvestments to reduce oil consumption have levels of annua l ca pital investme nt.
Box A.-Consumer Cost of Increased Automobile Fuel Efficiency
For the purposes of this section, the consumercost of increased fuel efficiency was defined tobe the added cost of producing a more fuel-effi-cient car (relative to an otherwise comparablebut less efficient car) per gallon of fuel saved byusing the more efficient vehicle. The added costof producing more fuel-efficient cars will dependnot only on the investments needed to changeautomobile production facilities and the produc-tion volumes, but also the resultant changes inthe variable costs* of production, such aschanges in materials and labor costs.
As discussed on page 75, the capital invest-ments that are needed to increase fuel efficien-cy also produce other changes in automobiles;and allocation of costs among fuel efficiency andthe other changes is somewhat arbitrary. In addi-tion, if market demand for fuel efficiency isstrong, many changes that increase fuel efficien-cy would be incorporated into the normal capi-tal turnover of the industry. For the purpose ofcalculating consumer costs, however, essentiallythe same approach was taken as with the invest-ment cost estimates. The fraction of investmentsallocated to fuel efficiency are the same as forthe investment costs per barrel per day of fuelsaved; and only the average costs per averagegallon saved have been calculated-relatingeach 5-year period to the previous 5-year period —rather than compounding errors by assumingsome market-driven scenario as a point ofreference.
In addition, it was assumed that productionvolumes are sufficiently large so that there areno significant diseconomies from small-scaleplants or losses from underutilized facilities.Weak demand for fuel efficiency and/or for newcars in general could of course result in addition-
al costs of this sort.A key factor in consumer costs is the changein variable costs associated with producing morefuel-efficient vehicles. Variable cost estimates,
q Variable production costs are those that vary in proportion to thenumber of units produced as opposed to fixed costs such as capitalcharges.
however, are generally proprietary and can varyconsiderably from one company to another. Fur-thermore, changes in variable costs with in-creased fuel efficiency will depend, to a largeextent, on the success of efforts to develop pro-duction technologies that can hold down pro-duction costs. Some of the uncertainties in vari-able cost changes ar e discussed below, followedby illustrative examples of plausible consumercosts for increased fuel efficiency.
Some changes that increase fuel efficiency willlower variable costs; some will increase somevariable costs while lowering others; and stillother changes are likely only to increase variablecosts.* However, factors which are only periph-eral to the nature of the technology incorporatedin the car often dominate the change in variablecosts, These factors include: 1) the existingnature and layout of equipment in the plantbeing modified to produce the new car, 2) vari-ous specific production decisions (e.g., whichof various processes is used in manufacturing acomponent, what equipment will be modified,what will be the production volume), and 3) thesuccess of developing new, lower cost proce-dures for producing a component and assem-bling it in the vehicle. In other words, the netchange in variable costs depends not only onthe nature of the new technology and the wayit is produced, but also on the path the manufac-turer has chosen to evolve from the current pro-duction facilities and configurations to thoseneeded to produce the more advanced tech nol-
*For exampte, reducing automobile size and weight by reducingthe quandtyofmetedals mshms variable costs. Switching to lighterwei@t matedats has the side dfsct of reducing the needed size ofaxtes, auto fra~ ate,, which rbduces costs; but the higher cost ofthe new matena tand i~ dtfficuky of handling that material(e@ ddiw dw X finishin& painting, heat treating) can
incraase vat?abtecmsts. Srt#@dy, producing a more efficient enginemay enatdemductton }a##ne s&e, number of cylinders and com-plexity of the polhKion control w@prnent, which reduces costs; but
the need for more precise machining and possibiy added equipment(e.g., turbochargers) can raise thevariabie costs. Finally, changes suchas going from a three-speed transmission to a four-speed, five-speed,or continuously variabie transmission are iikeiy to increase variabie
costs because of increased complexity and materiais and process-ing requirements.

8/14/2019 Increased Automobile Fuel Efficiency and Synthetic Fuels: Alternatives for Reducing Oil Imports
http://slidepdf.com/reader/full/increased-automobile-fuel-efficiency-and-synthetic-fuels-alternatives-for 85/292
80 Ž Increased Automobile Fuel Efficiency and Synthetic Fuels: Alternatives for Reducing Oil Imports
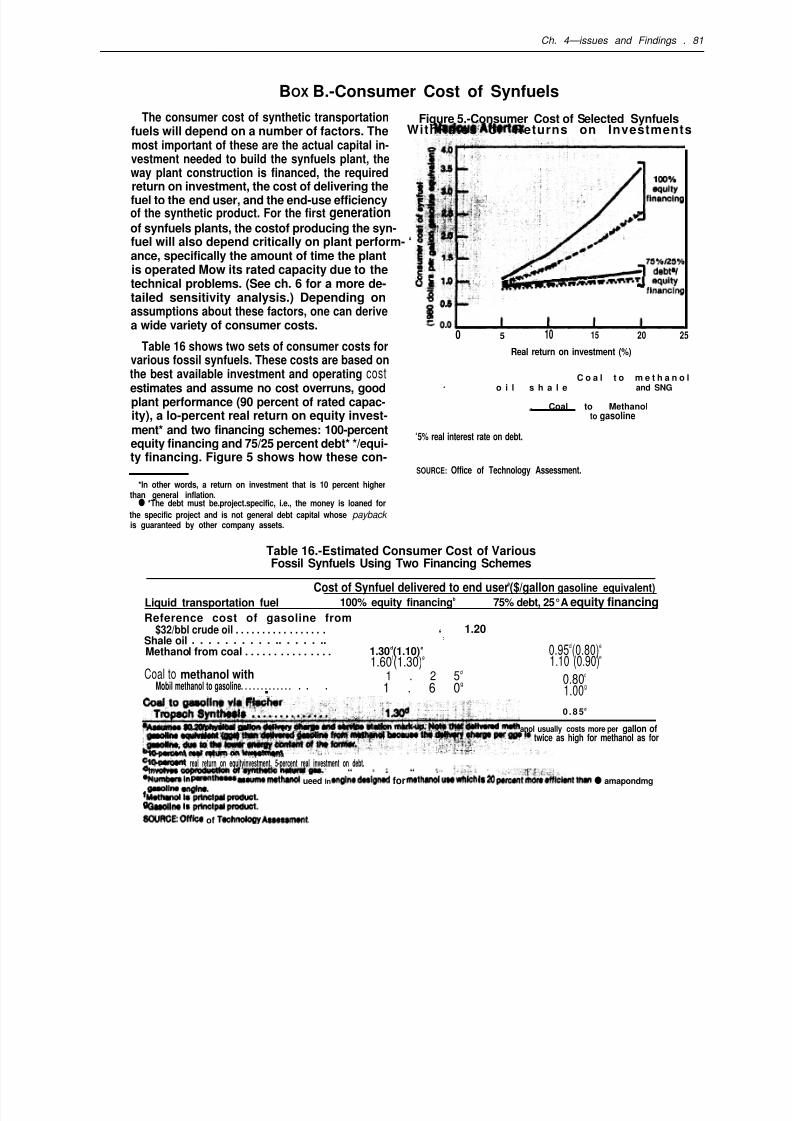
8/14/2019 Increased Automobile Fuel Efficiency and Synthetic Fuels: Alternatives for Reducing Oil Imports
http://slidepdf.com/reader/full/increased-automobile-fuel-efficiency-and-synthetic-fuels-alternatives-for 86/292
Ch. 4—issues and Findings . 81
BOX B.-Consumer Cost of Synfuels
The consumer cost of synthetic transportation Figure 5.-Consumer Cost of Selected Synfuelsfuels will depend on a number of factors. The WithRates of Returns on Investmentsmost important of these are the actual capital in-vestment needed to build the synfuels plant, theway plant construction is financed, the requiredreturn on investment, the cost of delivering the
fuel to the end user, and the end-use efficiencyof the synthetic product. For the first generationof synfuels plants, the costof producing the syn-fuel will also depend critically on plant perform- ‘ance, specifically the amount of time the plantis operated Mow its rated capacity due to thetechnical problems. (See ch. 6 for a more de-tailed sensitivity analysis.) Depending onassumptions about these factors, one can derivea wide variety of consumer costs.
Table 16 shows two sets of consumer costs forvarious fossil synfuels. These costs are based onthe best available investment and operating cost
estimates and assume no cost overruns, goodplant performance (90 percent of rated capac-ity), a lo-percent real return on equity invest-ment* and two financing schemes: 100-percentequity financing and 75/25 percent debt* */equi-ty financing. Figure 5 shows how these con-
*ln other words, a return on investment that is 10 percent higherthan general inflation.
q *The debt must be.project.specific, i.e., the money is loaned for
the specific project and is not general debt capital whose payback is guaranteed by other company assets.
0 5 10 15 20 25
Real return on investment (%)
C o a l t o m e t h a n o l. o i l s h a l e and SNG
, Coal to Methanolto gasoline
a5% real interest rate on debt.
SOURCE: Office of Technology Assessment.
Table 16.-Estimated Consumer Cost of VariousFossil Synfuels Using Two Financing Schemes
Cost of Synfuel delivered to end usera
($/gallon gasoline equivalent)Liquid transportation fuel 100% equity financingb 75% debt, 25°A equity financing
Reference cost of gasoline from$32/bbl crude oil . . . . . . . . . . . . . . . . . 1.20
Shale oil‘ :. . . . . . . . . . .. . . . . ..
Methanol from coal . . . . . . . . . . . . . . . 1.30d(1.10)
e 0.95d(0.80)e
1.60f(1.30)
e 1.10 (0.90)e
Coal to methanol with 1 . 2 5d
Mobil methanol to gasoline. . . . . . . . . . . . .0.80
d
. . . 1 . 6 0g
1.00g
0 .85d
anol usually costs more per gallon oftwice as high for methanol as for
real return on equityinvestment, 5-percent real investment on debt. ~~~~-m’ “ ‘ ‘ “ ‘“ :’:- - ~, (, ~,+
%Ju~ln ~hOOOS aaeume methanof ueed In englnedealgned
formethanot
uaewhlch
Is
20
@“~ta~~lclentthmq amapondmg
sine Ongtne.fMettWot@Geeollne R $%s =:SOUftOE: Offtoe of Teohndogy Aeaeaement.

8/14/2019 Increased Automobile Fuel Efficiency and Synthetic Fuels: Alternatives for Reducing Oil Imports
http://slidepdf.com/reader/full/increased-automobile-fuel-efficiency-and-synthetic-fuels-alternatives-for 87/292

8/14/2019 Increased Automobile Fuel Efficiency and Synthetic Fuels: Alternatives for Reducing Oil Imports
http://slidepdf.com/reader/full/increased-automobile-fuel-efficiency-and-synthetic-fuels-alternatives-for 88/292
Ch. 4—issues and Findings q 8 3
creases the apparent cost of fuel efficiency pergallon saved by a factor of 2.5 over the situa-tion where no discount is applied to future fuelsavings. In practice, there will be a wide varietyof discounting rates used by various consumers,and the rates will change with market conditions(including oil prices and interest rates) and con-sumers’ beliefs about future oil prices and avail-ability, among other things.
Synthetic Fuels
For synfuels processes that produce sizablequantities of different fuel products (e.g., synthet-ic natural gas and fuel oil), one encounters ac-counting problems similar to those discussedunder increased automobile fuel efficiency-i.e.,how to allocate production costs to the varioussynfuels products. However, these problems areless severe for synfuels than for automobiles be-cause all of the major products of the former are
separate consumer products with known currentprices. Furthermore, the accounting problemscan be largely avoided by considering only proc-esses that produce only fuels of similar quality(e.g., gasoline, jet, and diesel fuel), and avoidedentirely by considering processes that produceonly one major product.
Variations in operating and maintenance costsand future coal prices produce some uncertain-ty in the cost of synfuels. The more importantuncertainties, however, involve the cost of build-ing a synfuels plant, how this cost will be fi-nanced, and investors’ required rates of return
on investment. The cost of synfuels from the firstgeneration of synfuels plants will also dependcritically on plant performance, with frequentshutdowns and repairs increasing costs dra-matically. Presumably, later generations of plantswill perform reliably.
Fuel Switching and Conservation
The total cost of switching utility boilers fromfuel oil to coal is fairly welt known. There are,however, some areas of the country where coalis not readily available, and there is insufficientspace to accommodate coal handling facilitiesat some electric generating plants.
The major variability in the cost of switchingto natural gas and electricity for buildings andin industry results from widely varying requiredrates of return on investments in different indus-tries and for different building owners or renters.
At some sites, though, natural gas is not availableor space limitations prevent the installation ofgas facilities. There is also uncertainty in the costof finding and processing unconventional natu-ral gas (from tight sands, etc.).
The total cost of conserving heat and hot waterin buildings is probably the least certain of themeasures for reducing stationary oil use. Notonly are there large uncertainties and variabilityin the savings that can be achieved through vari-ous conservation measures, but also consumerswill discount future fuel savings at widely differ-ing rates.
HOW DO THE ENVIRONMENTAL IMPACTS OF INCREASEDAUTOMOBILE FUEL EFFICIENCY AND SYNFUELS COMPARE?
The synfuels, auto fuel effic ienc y, and elec tricauto alternatives for displacing imported oil havesharply different potential impacts on publichealth and safety, on workers, and on ecosys-tems. In addition, probabilities of these impactsactually occurring—few of them are inevitable—
are also quite different. Both the potential impactsand their risks are briefly compared below. Thenature of some of the risks, however, is obscuredby the brevity of the following discussion. For ex-ample, the actual risk associated with possible
contamination of drinking water by synfuels pro-duc tion is heavily dep ende nt on the deg ree ofp rior reco gn ition o f the risk and response to thisrecognit ion –for example, development ofground wa te r monitoring systems. Also, risks tha tare similar in ma gnitude are o ften va lued differ-
ently because of the degree of choice involved(e.g ., willing expo sure to the risks of auto trave lv. unwilling exposure to accidental toxic spills)and the precise nature of the risks (e.g., multipleautomobile accidents involving only a few peo-
8/14/2019 Increased Automobile Fuel Efficiency and Synthetic Fuels: Alternatives for Reducing Oil Imports
http://slidepdf.com/reader/full/increased-automobile-fuel-efficiency-and-synthetic-fuels-alternatives-for 89/292
84 q Increased Automobile Fuel Efficiency and Synthetic Fuels: Alternatives for Reducing Oil lmports
p le at a time v. a serious accident or control fail-ure at a large synfuels plant).
Public Health and Safety
Red uc tions in vehicle size, p art of the auto fue l-efficiency measures, could have the strongest ef-
fect on p ublic health and safety through their po-tentia l ad verse e ffec ts on ve hicle safe ty. The e f-fect is difficult to estimate because of a lack ofcomprehensive traffic safety data that would al-low an evaluation of the relative effect of car sizeand other key safety variables on vehicle crash-’worthiness and accident avoidance, and because
of uncertainty about the compensatory measuresthat might be taken by the vehicle manufacturers
and by d rivers. Althoug h the National Highw ayTra ffic Sa fety Administration ha s projec ted veh i-cle size reductions to cause an additional 10,000annual traffic deaths by 1990 if compensatorymeasures are not taken, this and other quantita-tive estimates of changes in traffic safety are based
on limited d ata and relatively c rude mod els. Nev-ertheless, an increase in traffic deaths of a fewthousand per year because of vehicle size reduc-tions does seem plausible.
Diesel use could have an adverse effect onemissions of nitrogen oxides (NO X) and particu-Iates, and conceivably could cause public health
problem s in cong ested urba n a reas. The risk ismoderated, however, because: 1) controls forNO Xand particulate are under active develop-ment, although success is not assured and it ispossible that the current level of effort will notbe continued; and 2) the evidence for healthdamage from diesel particulate is equivocal.
Electric passenger vehicles are likely to besmall, and thus should share safety problems withradically downsized high-mileage conventional
automobiles. Additional safety problems causedby the ba tteries, whic h c onta in toxic c hemica lsthat m ay b e ha zardous in an a c cident-ca usedspill, are offset somewhat by eliminating the fueltank with its highly flammable contents. Also,electric cars shouId have a positive effect on airquality, espe c ia lly in urban a rea s, bec ause thereductions in automobile emissions outweigh in-
creased emissions from powerplants, except forsulfur dioxide (SO 2).
Synfuels plants ma y expose the ge neral pub licto health and safety hazards in a variety of ways:contamination of drinking water from leachingof w astes, ac c identa l sp ills, or failure o f effluentc ontrols; ac c identa l release o f toxic vapo rs; ex-posure to contaminated fuels; and routine emis-sions of c onvent iona l air po lluta nts suc h a s SO 2
and NO X. Only the routine emissions are essen-tially inevitable, however, and health and safetyproblems from these should be minimized byFederal ambient air quality standards and by therelative magnitude of these emissions, whichshould be considerably lower than emissionsfrom projected levels of development of coal-fired
electric generation during the same time frame.The extent of risk from the other sources is notwell understood because the toxic waste streamsfrom the plants have not been fully characterized,the effects of some of the known and suspectedwaste products are not yet well understood, and
the effec tiveness and reliab ility of som e c ritic alenvironmental control systems have not beendemonstrated under synfuels plant conditions(see issue on p. 95). Chemical industry sourcesbelieve that few problems will arise, but, asdiscussed in the above-mentioned issue, someareas of c onc ern rema in.
Worker Effects
With the possible exception of some workerexpo sure to toxic ma terials in ba ttery manufa c -ture, the o nly signific ant oc c upa tiona l health and
sa fety prob lem a ssoc iated with the automo bilemeasures appears to be mine safety and healtheffects involved in any increased mining of coalfor electricity needed for recharging electric carbatteries, and, to a lesser extent, for aluminumma nufac ture. These impa c ts are no t trivial, be -ca use the amount of coa l needed per ba rrel of oil saved for elec tric c ars is of the sam e o rde r ofma gnitude as that need ed for synfuels produc -tion (assuming coal-fired electricity and coal-ba sed synfuels). The c oa l-to-oil ba lance fo r alumi-num use is somewhat less certain, although someanalyses have c alc ulated it to b e simila rly high.The use o f aluminum is not the m ajor pa rt of theeffic ienc y me asures, howeve r, and the a ctua lamount of coal required is not likely to be signifi-cant in comparison with the coal used for syn-thetic fuels.

8/14/2019 Increased Automobile Fuel Efficiency and Synthetic Fuels: Alternatives for Reducing Oil Imports
http://slidepdf.com/reader/full/increased-automobile-fuel-efficiency-and-synthetic-fuels-alternatives-for 90/292
Ch. 4—issues and Findings q 8 5
As noted, synfuels production has a coal re-quireme nt similar to that of e lec tric a utos, andthus shares similar mineworker problems. It hasimportant additional problems. The sources ofmoderate risks to public health and safety—fugi-
tive emissions, spills, plant accidents, and con-ta mina ted fue ls–pose mo re serious risks to work-ers because of their frequency and severity of ex-posure. For example, workers will be continuous-ly exposed to low levels of polynuclear aromaticsand other toxic substances because fugitive emis-
sions cannot be reduced to zero. Another impor-tant source of possible worker exposure is themaintenance requirements of synfuels reactors;the materials that must be handled in these opera-tions are likely to have the highest concentrationsof dangerous organics.
Exposure to hazardous substances is commonin the pe trochem ica l industry, and wo rker-pro-
tec tion strateg ies de velope d in this and relatedindustries will be used extensively in synfuelsplants. These strategies clearly will reduce thehazards, but the degree of reduction is highly un-certain (see issue on p. 95).
Ecosystem Effects
The only significant sources of ecosystem ef-fects from the automobile measures are likely tobe the changes in air quality caused by the useof electric autos (which probably will be positive)and diesels, and the a ir, land , and wa ter po llu-tion associated with the mining and processingof both coal for electricity (for battery recharg-ing or aluminum production) and battery materi-
a ls suc h as lead and lithium. Ob ta ining the newbattery materials is thought unlikely to cause im-po rtant environme ntal p rob lems, but the re a remany different kinds of potential battery materi-als, and final judgment probably should be with-
held at this time. Nevertheless, with the excep-tion of the electric-car coal-mining requirements,any adverse ecosystem effects of the automobile
measures appear likely to be mild.
Synfuels production is likely to cause signifi-cantly greater adverse effects, because it will have
coal-mining damages per barrel of oil roughlysimilar to electrical autos as we// as several addi-tional and potentially important adverse impacts.
These include substantially inc reased mining a ndwaste disposal requirements if oil shale is the syn-fuels feedstock, and a variety of potential adverseimpa c ts stem ming from the possibility that toxicmaterials generated during the conversion proc-esses will esc ap e to the e nvironm ent . The p ath-ways of potential damage from toxics are essen-
tially identical to those threatening public healthand safety—surface and ground water contamina-
tion, toxic vapors, and exposure (in this case from
spills) to contaminated fuels. Unfortunately, prob-ability of the damage actually occurring is equally
difficult to evaluate.
An additional concern is that synthetic fuelsfrom biomass sources–which in general havesimilar or less severe environmental problemsthan coal-based synfuels—may have more severe
ecosystem effects because of the very extensivenature o f the ir resource ba se. The ad verse ec osys-
tem effec ts of large inc rea ses in g rain p rod uctionto p rod uce ga sohol, for exam ple, can be quiteserious, and, given the nature of the currentagricultural system, the probability of such effectsoccurring is high.
Summary
The e nvironme ntal impa c ts of increased auto -mobile fuel efficiency and synthetic fuels develop-
ment will be quite different and difficuIt to com-pa re. The major imp ac ts of a uto e ffic iency im-provements are likely to be increases in crash-
related injuries and fata lities from auto size red uc -tions. The severity of these impacts is heavilydependent on vehicle design and driver behavior
(especially seatbelt usage). Synthetic fuels devel-opment’s major impacts will include the well-known ecosystem effects as well as public andwo rker hea lth a nd safe ty effec ts of large-sc alemining and combustion of coal. Oil shale devel-opment will have many similar effects; a mostserious environmental risk may come from inade-quate disposition of the spent shale. In addition,
there a re potentially serious impacts on peopleand ecosystems from the escape of toxic sub-stances from synfuels conversion processes. Theseverity of these impacts is unclear because im-
portant waste streams have not been character-ized and environmental control effectiveness and
reliab ility has not be en de mo nstrated .

8/14/2019 Increased Automobile Fuel Efficiency and Synthetic Fuels: Alternatives for Reducing Oil Imports
http://slidepdf.com/reader/full/increased-automobile-fuel-efficiency-and-synthetic-fuels-alternatives-for 91/292
86 . Increased Automobile Fuel Efficiency and Synthetic Fuels: Alternatives for Reducing Oil Imports
HOW WILL THE SOCIAL IMPACTS OF SYNFUELS AND INCREASEDAUTOMOBILE FUEL EFFICIENCY COMPARE?
Identifying, assessing, and comparing the social
impacts of synfuels development and improved
automobile fuel efficiency are difficult because
these impacts will not be distributed evenly intime or among reg ions. Moreover, they c anno tnecessarily be measured in equivalent (e.g., dol-Iar) terms, and they are difficult to isolate and at-tribute to specific technical choices. Both benefi-c ial and adverse soc ial co nseq uenc es will a risefrom these two approaches to reducing oil im-ports.
Employment
Synthet ic fue ls p rod uc tion p resents two m a jorc onsiderations ab out soc ial imp ac ts related to
employment. First, there is the possibility of short-ages of experienced chemical engineers andskilled craftsmen. A rapid growth in synfuelswould likely put increased pressure on engineer-ing sc hoo ls, which are now suffering from insuf-fic ient numb ers of fa c ulty. The sec ond c onc ernarises from the large and rapid fluctuations inlabor requirements for construction. While noshortages of construction workers are expected,on the average, fluctuating labor requirementsduring construction and startup can have severe
secondary effects on communities at the con-struction sites. A population increase of about
three to five people per new worker could occur,leading to possible population fluctuations of30,000 to 60,000 people for some synfuels con-struction.
The c hanging struc ture and ma rkets of the es-
tablished automobile industry are likely to leadto a long-term, permanent decline in auto-relatedindustrial emp loyment. The na ture of this dec line
will dep end on imp ort sales, the g row th rate ofthe U.S. auto market, the competitiveness and
lab or intensity of U.S. ma nufac turing, t he use offoreign suppliers and production facilities, andthe a do ption of m ore ca pital-intensive p rod uc-
tion processes and more efficient managementpractices. The skill mix will also shift increasing-ly towards skilled labor. Scarcities of experiencedengineers and certain supplier skills could inflatethe prices of skilled manpower resources for both
synfuels and changing automotive technology.
Community Impacts
Synfuels development will have its most imme-diate effect in relatively few small and rural oilshale communities in the West, as well as in thesmall rural communities located near many of
the Nation’s dispersed coal resources. In the longterm, local communities should benefit from syn-fuels in terms of expanded tax bases and in-creased wages and profits. However, in the nearterm, there are risks of serious disruptions in boththe public and private sectors of these communi-ties. The nature and extent of these disruptionswill be determined by the community’s ability toab sorb and m ana ge g rowth, and the rate a ndsc ale of loc al synfuels de velopm ent.
Automobile production jobs are presently con-
centrated in the North-Central region of the Na-
tion. The g eog rap hic al d istribution c an be ex-pected to change as inefficient plants are closed
and new production facilities are established inothe r pa rts of t he United Sta tes. New plants willprovide new employment opportunities with ac-companying community benefits (e. g., tax rev-
enue s); p lant c losings in area s hea vily o riente dtowards the auto industry would deepen the ex-isting ec onom ic p rob lems of the North-Centralregion, i.e., high unemployment, rising socialwe lfare c osts, and de c lining tax b ase.

8/14/2019 Increased Automobile Fuel Efficiency and Synthetic Fuels: Alternatives for Reducing Oil Imports
http://slidepdf.com/reader/full/increased-automobile-fuel-efficiency-and-synthetic-fuels-alternatives-for 92/292
Ch. 4—issues and Findings . 87
HOW DO THE REGIONAL AND NATIONAL ECONOMIC IMPACTSOF SYNFUELS AND INCREASED AUTO EFFICIENCY COMPARE?
In addition to comparisons on the basis of costper barrel, environmental impacts and local socialimpacts, increased automobile fuel efficiency and
synfuels c an b e c ompa red on the ba sis of theirpotential regional and national economic im-pa c ts. The latter co mp arison is important bec ause
each type of investment implies an alternative na-tional strategy to achieve the goals of price stabil-ity, national economic growth, and equity as wellas oil import reduction.
Regional and national aggregation are also im-
portant because both industries are capital-inten-sive. Large b locks of investment must b e m ob il-ized, with key investment decisions made by arelatively small number of firms, based on very
unce rtain longrun p red ictions ab out the future.As summarized below, a variety of important na-tional and regional issues are raised by the uncer-
tainties and inflexibilities inherent in these deci-sions.
Inflation and Economic Stability
Inflation may be dampened and the economy
stabilized if either type of investment is successful.In the case of synfuels, if first generation plantsde mo nstrate c ompe titive c osts, the m ere p ros-pec t of rap id d eployment co uld m ode rate o il im-
port prices and thus help to control what hasbeen one of the major inflationary forces duringthe last decade. In the case of autos, if increasedfuel efficiency helps domestic firms to hold or per-haps increase their market share, this would keep
U.S. workers em ployed and at lea st sta b ilize fo r-eign payments for autos. Higher employment alsotends to reduce Federal transfer payments, whicheither reduces the Federal deficit or lowers taxes.Reductions or stabilization of foreign paymentstends to strengthen the value of the dollar in for-eign exchange markets. Both changes, in the Fed-
eral budget and on foreign accounts, reduce infla-
tionary pressure.
On the other hand, attempts to displace oilimports too quickly may be inflationary. Risks ofinflation, technical errors, and market miscalcula-tions all increase with the rate of synfuels deploy-ment and with shortening the time taken to con-vert the domestic auto fleet to high fuel efficiency.
in the case of synfuels, rapid investment growth
in the next decade, beyond construction of dem-onstration projects, could cause inflation by creat-ing suppliers’ markets in which prices for con-struction inputs, especially chemical engineering
servic es, ca n rise more rap idly than the g ene ra linflation rate. Deployment prior to definitive test-
ing in demonstration plants also compoundspotential losses due to design errors.
In the c ase o f autos, rapid large-sc a le invest-me nts c an infla te p ric es of ve hicles as firms at -tem pt to a mortize c ap ital costs quickly. How ever,if these attempts fail, presumably because buyers
stop buying high-priced domestic autos, thennew ly invested c ap ita l must b e w ritten off pre-maturely, resulting in the waste of scarce re-sources for the firm and the Nation. Furthermore,if rapid fuel-efficiency improvements are forcedby abrupt, real fuel price increases or by ag-
gressive foreign auto competition, then thedomestic auto industry and owners of fuel-inef-ficient cars will both be forced to absorb lumpsum losses in the real value of current assets. Lowprices for new cars resulting from competition do,
however, benefit purchasers of these cars.
Employment and InternationalCompetition
If improved fuel economy makes domestically
produced autos more competitive with imports,

8/14/2019 Increased Automobile Fuel Efficiency and Synthetic Fuels: Alternatives for Reducing Oil Imports
http://slidepdf.com/reader/full/increased-automobile-fuel-efficiency-and-synthetic-fuels-alternatives-for 93/292
88 q Increased Automobile Fuel Efficiency and Synthetic Fuels: Alternatives for Reducing Oil Imports
there w ill be tw o m ajor national econom ic pa y-offs besides fuel savings. First, this improved com-
petitiveness will protect traditional U.S. jobs; sec-ond, it will reduce the drain of foreign paymentsto auto exporting countries as well as to oil ex-porters. Synfuels do no t present a similar couplingof economic possibilities.
There are m ajor do ubts, though, a bo ut thelong run suc c ess of U.S. automa kers with foreig nc om pe tition. The United Sta tes ma y not be ab leto compete in the mass production of fuel-effi-cient autos for a variety of reasons—such as high
wages, low productivity, and inefficient or out-of-date management. All such explanations arespeculative, but together they have raised serious
doubts about U.S. competitiveness in the con-text of the rec ent, rap id inc rea se in the ma rketshare of auto imports. If foreign automakers con-tinue to drive domestics out of the market for fuel-
efficient autos, synfuels investments may be pre-ferred ove r investments in fuel effic ienc y even ifthe apparent cost per barrel of the former arehigher.
Assuming investment in either industry doeslead to inc rea sed U.S. prod uct ion, em ploymentopportunities for synfuels and autos can be com-pared based on 1976 data (the most recent avail-able). Synfuels production involves mainly min-ing and chemical processing activities, which in
1976 dollars had $59,000 and $55,000 investedpe r worker respe c tively. On the othe r hand, the
transportation equipment sector of the economy(which is dominated by autos) had $27,000 in-vested per worker and auto suppliers such as fab-ricators of metal, rubber, and plastic products had
abo ut $21,000 per wo rker. In o ther words, in therecent past the auto industry created about twice
as many jobs per dollar of investment as industrial
activities similar to synfuels. The current trendtowa rd autom ation in autom ating will undoubt-edly lower its labor intensity, but the auto industryshould continue to employ more workers per unit
of investment.
Income Distribution Among RegionsAnother question concerns the likely regional
d istribut ion o f incom es from au tos and synfuels.An analysis of location factors was not carried out,
but two po ints c an b e mad e. First, to the e xtentthat the auto industry could use existing plantsor build nearby, current employment patternsand established communities could be main-ta ined. This wo uld prec lude c ostly reloc a tion andwo uld te nd to favor the North-Central reg ion ofthe United States, which has been losing its in-dustrial base.
Second, new auto plants can be located inmore areas of the country than new synfuelsplants bec ause o f the high c ost o f transpo rtingsynfuels feedstocks, especially oil shale, com-pared with the cost of transporting manufacturedma teria ls and pa rts for autom ob iles. Transpo rta -tion c osts a re likely to c onc entra te synfuels invest-ments in regions of the Nation with superior shaleand coal reserves. Biomass options are least likelyto be concentrated, because resources are dis-persed, and coal-based options are much more
flexible than shale because coal is more widelydispersed.
Capital Intensity andOwnership Concentration
Finally, both strategies for oil import substitu-tion affect the number of profitable firms in eachindustry. In b oth industries, the numbe r of c om-petitive firms is severely constrained by the sizeof investment outlays and by the acquired knowl-
edge of those already in the business.
In liquid fuels, the introduction of syntheticfuels sharply inc reases the amo unt o f c ap ital in-vestment required per barrel of liquid fuels pro-duction capacity. For example, in the case of onemajor oil company, present capitalized assets per
average daily barrel of oil equivalent of produc-tion from old reserves of conventional oil and nat-ural gas is less tha n 20 pe rcent o f OTA’ s estima teof the similar ratio for oiI shale. * However, newreserves of c onve ntiona l oil and ga s will also re-quire much larger capital outlays than old re-serves, due to depletion of finite natural re-sources.
*Value of assets for Exxon was obtained from its 1980 AnnualReport.

8/14/2019 Increased Automobile Fuel Efficiency and Synthetic Fuels: Alternatives for Reducing Oil Imports
http://slidepdf.com/reader/full/increased-automobile-fuel-efficiency-and-synthetic-fuels-alternatives-for 94/292
Ch. 4—issues and Findings q 8 9
From the investor’s viewpoint, the sequenceof investments for conventional petroleum re-sources is very different from synfuels projects.For conventional petroleum, small operators canexplore for new reserves, at least on shore, withonly a relatively small amount of high-risk moneyand the limited technical staff required to renta drilling rig and to determine where the wildcatwell should be drilled. If a discovery is made, sub-
sequent, much larger investments in develop-ment wells and pipelines can be made at relative-
ly low risk. In synfue ls, a firm simp ly canno t e nte rthe b usiness without c omma nd o f all ca pital re-quirements up-front, or without a very large staffof technicians and managers.
In summary, investment options to discoverand develop conventional oil and gas will be ex-ploited before synthetics even if estimated total
capital outlays are the same, because the former
confine major risks to the front-end of projectsbefore the largest blocks of capital must be com-mitted.
As a result, it is likely that only a very small frac-
tion of the hundreds of firms currently produc-
ing conventional oil and gas will have the finan-
cial and technical means to produce synfuelswhen conventional resources are depleted.While this growing concentration of ownershipma y not lead to the c lassica l prob lem of p rice fix-ing by domestic producers, because oil and gas
are traded on worldwide commodity markets, itdoes at least make the industry appear to be more
mo nolithic , since synfuels projec t m anage rs willcommand very large blocks of human andmaterial resources.
In domestic automating, ownership may be-come more concentrated because at least twoout o f the three ma jor U.S. comp anies a re b eingforce d, by lac k of ca pital and p erhap s by highproduction costs, to curtail the number of differ-ent vehicles made. Although foreign automakersare increasing their U.S. manufacturing activities,
the g row ing d ominanc e o f one m ajor U.S. auto-maker over the other two may decrease pricecompetition in certain types of cars and possibly
red uce profitmaking op po rtunities for do me sticsuppliers to auto manufacturing because of thema rket leverag e o f the one dom inant b uyer.
WHAT DO INCENTIVES FOR INCREASED FUEL ECONOMY IMPLYFOR THE EVOLUTION AND HEALTH OF THE U.S. AUTO INDUSTRY?
The a uto industry beg an a proc ess of structuralchanges in the 1970’s which complicates evalua-tion of how fuel ec onomy p olicy m ight a ffec t theindustry, auto manufacturing communities, andthe national economy. Regardless of fuel econ-omy policy, the U.S. auto industry is undergoinga long-term decline in terms of employment, thenumber of domestic firms (including suppliers),and the proportion of global auto productionsited in the United Sta tes. Rec ent c onsume r de-mand for fuel economy and other auto character-istics have supported these trends by motivatingcostly product changes to meet competition fromforeign firms. Factors such as the relatively fast
sales growth in foreign auto markets and lowercosts of labor and capital abroad have induced
U.S. manufacturers to increase investments in for-eign p rod uc tion ac tivities.
Increases in demand and other pressure onU.S. firms to raise fuel economy will reinforce andperhaps accelerate current industry and markettrends. Although large spending needs will moti-vate reductions in the number of independentfirms and , pe rhap s, the b rea dth of their op era-tions, the size and financ ial hea lth of the U.S. autoindustry in the future will depend, to a greatdegree, on its ability to compete with foreignfirms–particularly in the small-car market. Thec om petitiveness of U.S. auto firms dep end s notonly on product designs and production facilitiesbut also on total manufacturing costs, which re-flect labor costs and the efficiency of production,
organization, and management. Incentives for ac-celerating fuel-efficiency increases will not onlydirectly affect the investment requirements, buta combination of high perceived investment
8/14/2019 Increased Automobile Fuel Efficiency and Synthetic Fuels: Alternatives for Reducing Oil Imports
http://slidepdf.com/reader/full/increased-automobile-fuel-efficiency-and-synthetic-fuels-alternatives-for 95/292
90 . Increased Automobile Fuel Efficiency and Synthetic Fuels: Alternatives for Reducing Oil /reports
need s, p ossible rig idity in U.S. c osts, a nd a slow-growing c om pe titive U.S. ma rket m ay disc ourage
U.S. firms from investing in U.S. capacity.
There are some a uto c ompa ny ac tivities thatshould be relatively invulnerable to fuel econ-omy-motivated market changes and should con-
tinue in the United Sta tes. These a c tivities inc ludeproduction of specialty cars and nonautomotive
projects suc h a s defe nse c ont rac ting. U.S. autocompanies may continue to conduct some activ-ities in the United States at historic or greaterlevels, while they may reduce the levels of othersor eliminate them entirely.
A decline in U.S. auto production, especiallyone that is not substantially offset by growth inforeign-owned capacity in the United States,
poses a major policy dilemma. On the one hand,the auto industry metamorphosis may result ina more economically efficient domestic industrythat is more competitive with strong import com-
petition. On the other hand, the process of indus-try change results in loss of jobs for current auto-
workers and loss of employment and businessactivity for local economies, losses which are rela-tively large and regionally concentrated in thealrea dy e c onom ica lly dep ressed North-Centralregion. These c onc erns can b e dea lt with through
industrial and ec onom ic d evelop me nt po lic ies,but it should be recognized that policy to accel-erate fuel economy improvements may aggravate
them. In addition, many of these changes mayoc cur even in the a bsence of strong dem and forfuel efficiency, but possibly at a slower rate.
CAN WE HAVE A 75= MPG CAR?There a re no technological barriers to design-
ing and building a four-passenger automobile that
c ould a chieve 75 mp g on the co mb ined 55/45pe rc ent highw ay/ c ity EPA d riving c ycle. Such acar would take at least 5 years to design and de-
velop and might be co stly to ma nufacture, butit is technically feasible. It should be noted, ofcourse, that the appearance of one or a few mod-els that get 75 mpg would have littIe immediateeffect on fleet average fuel economy, or on theNation’s petroleum consumption.
High fuel economy entails tradeoffs and com-promises that affect other features of vehicledesign–carrying capacity, performance, safety,c om fort, and relate d a me nities. Tec hnolog y is ac ritic a l fac tor in ma naging the se trad eo ffs. Som eroutes to improved passenger car fuel economyalso increase manufacturing costs (diesel engines,
more complicated transmissions, lightweight ma-
terials). Here again, better technology can helpto improve fuel economy at the least cost.
If a 75-mpg car can be made sufficiently attrac-
tive to consumers in terms of the other featuresbeyond fuel economy that affect purchasing deci-
sions—including price, but also the variety of lesstangible factors that contribute to perceived val-ue—then automa kers will bu ild suc h c a rs, co nfi-
dent that t hey will find a m arket. The interplaybetween consumer demand and automotivetechnology will determine when 75-mpg cars will
appear. Consumer expectations concerning fuel
costs and the possibility of future shortages of fuel,as well as their judgments of the practicality ofsuch cars, will be important factors affecting therate at which these cars would be introduced.
An autom ob ile d esigned to a c hieve 75 mp gmight look much like a current subcompact—
e.g., a General Motors Chevette—but, as dis-cussed in chapter 5, would be considerably differ-
ent und er the skin. It w ould ha ve to be lighte r,and might also be somewhat smaller—with a curbweight of perhaps 1,600 lb as opposed to about2,000 lb for the Cheve tte. The a ct ual weight de -pends not only on the size of the car, but alsoon the ma terials from w hich it is ma de. By usingmaterials with high strength-to-weight ratioswherever possible—or, where strength or stiffness
are not important, materials of low density—afour-passenger car could weigh, in principle,even less than the 1,600 lb suggested above.Co sts a re the limiting fa c tors in the use o f suc hmaterials—both the costs of the materials them-
selves and the costs of the required manufactur-ing processes.

8/14/2019 Increased Automobile Fuel Efficiency and Synthetic Fuels: Alternatives for Reducing Oil Imports
http://slidepdf.com/reader/full/increased-automobile-fuel-efficiency-and-synthetic-fuels-alternatives-for 96/292
Ch. 4—issues and Findings • 91
Photo credit: Volkswagen of America
Artists drawing of the VW2000, a three-cylinder diesel test vehicle that has achieved over 60 mpg instandard fuel-efficiency tests
The o ther essentia l element in a 75-mpg c ar isan efficient powertrain. For a car weighing 1,600lb or less, a relatively small diesel engine–onewith a displacement in the range of 0.9 to 1.3liters–would suffice. The transmission could beeither a manual design or a considerably im-proved automatic, perhaps a continuously vari-
able transmission.
To g et 75 mp g w ould a lso require a great d ea lof attention to the detailed design of many aspectsof the car—low aerodynamic drag, low rolling re-sistance, use of microprocessor controls, minimal
accessories, and parasitic loads—with careful en-
gineering development throughout the vehiclesystem . None of this de pe nds on te c hnologica lbreakthroughs.
Given equally good design practices, the result-ing car would not be as safe as a larger vehicle.
Nor would it be luxurious. It might not have airconditioning. It would probably not be able topull a c am ping trailer throug h the Roc ky Moun-tains. But it could get 75 mpg. When automobilemanufacturers—here, in Europe, and in Japan—decide that American consumers want such a car,
they will build it.

8/14/2019 Increased Automobile Fuel Efficiency and Synthetic Fuels: Alternatives for Reducing Oil Imports
http://slidepdf.com/reader/full/increased-automobile-fuel-efficiency-and-synthetic-fuels-alternatives-for 97/292
92 . Increased Automobile Fuel Efficiency and Synthetic Fuels: Alternatives for Reducing Oil /reports
ARE SMALL CARS LESS SAFE THAN LARGE CARS?
One of the easiest ways to increase the fueleconomy of passenger cars is to make them light-er. Although it is possible to make cars somewhatlighter without making them smaller, in general
size and we ight g o toge ther. Thus, ca rs with in-c rea sed fuel ec onom y a re typica lly sma ller—adownward trend in the size and weight of carssold in the U.S. market began in 1977 and willc ontinue through the 1980’ s, although grad ual-ly leveling off.
Size is the more critical variable for safety, al-though weight also affects the dynamics of colli-sions. A great deal of improvement in the safety
of cars of all sizes is possible through improved design–but given best practice design, a big car will always be safer than a small car in a colli-
sion. As a result, making cars smaller to improvefuel ec onom y will, everything else be ing eq ual,increase risks to drivers and passengers. Assum-ing no change in the way the cars are driven,there will be more injuries and fatalities thanwould oc cur with bigge r cars emb od ying eq uiva-lent design practices and having identical acci-
dent avoidance capabilit ies.
Size a ffec ts safety be cause when an a utomob ile
hits another object–whether another car, a truck,
or a road side ob sta c le—the c a r itself slows, or isdecelerated (the “first collision”), and the occu-
pa nts must then be slow ed with respe c t to thevehic le (the “ sec ond c ollision” ). To m inimize thechance of injury, the decelerations of the occu-pants with respect to the passenger compartment
during the second collision must be minimized,The oc cupa nts must also be protec ted ag ainst in-
trusion or penetration of the passenger compart-ment from the outside. But controlling decelera-tions during the second collision depends on thedeceleration of the entire vehicle during the firstcollision. Given good design practices, the sever-ity of both the first and the second collision canbe lowered, on the ave rag e, if the ca r is ma de
larger.
Ideally, the vehicle structure will deform in ac ontrolled ma nner around the p assenge r c om-partment during a collision, so that the average
deceleration of the passenger compartment in the
first collision will be low. The larger the car, themore space the designer can utilize to managethe deformations and decelerations—e.g., byusing a crushable front-end. In a small car, there
is less room for controlled deformation withoutintruding on the passenger compartment. Withinthe passenger compartment, more space meansmore room to control the deceleration of the pas-
sengers—using belts, harnesses, padding, andother m ea sures—with less risk of hitting unyield -ing portions of the vehicle structure. More roomalso makes penetration or other breaches of theintegrity of the compartment less likely. Onepathway to increased fuel economy without sacri-ficing collision protection is therefore to makec ars lighte r by d esign c hang es and / or differentmaterials while preserving as much space as pos-
sible for managing the energies that must be dis-sipated in the first and second collisions.
Bec ause ve hic le size a nd we ight are no t theonly significant factors in determining vehiclesafety, and because “all other things being equal”does not apply in actual real-world situations, anyconclusion about the relative safety of large and
sma ll ca rs should b e temp ered with the follow -ing observations:
1.
2.
3.
The rec ent series of c rash te sts sponsored bythe Nationa l Highway Tra ffic Safe ty A dminis-tration demonstrated that vehicles of approx-
imately equal size can offer remarkably dif-ferent de grees of c rash protec tion to theiroc c upa nts. In many c ases, differenc es be -tween cars of equal size overshadowed dif-ferences between size classes in the kind of
accident tested (35-mph collision head-oninto a barrier).Crash-avoida nc e c ap ab ilities of large andsma ll c a rs a re unlikely to b e the same , andany differences must be factored into anevaluation of relative safety. Unfortunately,the effects of differences in such capabilities
are difficult to measure because they repre-sent both physical differences in the vehicles
and driver responses to those differences.Available traffic safety data and analysis isoften confusing and ambiguous on the sub-
ject of large car/small car safety differences.

8/14/2019 Increased Automobile Fuel Efficiency and Synthetic Fuels: Alternatives for Reducing Oil Imports
http://slidepdf.com/reader/full/increased-automobile-fuel-efficiency-and-synthetic-fuels-alternatives-for 98/292
Ch. 4—issues and Findings 93
Although analyses of car-to-car crashes tendto a gree that oc cup ants of large ca rs are at
a lesser risk than those of smaller cars, thereis no such firm a greement a bo ut the o therclasses of accidents that account for three-quarters of all passenger vehicle occupant
fatalities. A probable reason for the ambigu-ity of results is the shortage of consistent, na-tionwide data on accident incidence and de-
tails; only fatal accidents are widely re-c orded . Another rea son is the m ultitude o ffactors other than car size that might affectinjury and fatality rates. Important factors in-
clude differences (among different sizeclasses) in driver and occupant age distribu-
tion, general types of trips taken, average an-nual mileage, vehicle age distribution, andseatbelt usage.
HOW STRONG IS CURRENT DEMAND FORFUEL EFFICIENCY IN CARS?
An extremely imp ortant fa c tor influenc ing fu- Table 17 presents a c om pariture new-car average fuel efficiency is the marketdemand for this attribute, relative to the otherfeatures the new-car buyer wants. Although it is,
at be st, only an a pp roxima te m ea sure o f futuremarket behavior, examination of recent demandpatterns in the new-car market can provide some
insights abo ut c urrent de ma nd for fuel effic ien-cy. I n particular, the importance of fuel efficien-cy as compared with car size, price, and perform-ance is examined for 1981 model gasoline-fueledcars* sold through January 5, 1981.
son of the average
fuel efficiency of new gasoline-fueled 1981 model
c ars sold through Janua ry 5, 1981, with the fuelefficiency of the most efficient car in each of the
Environmental Protection Agency’s (EPA) ninesize classes. Also shown are the sales fractionsand the nationality of the manufacturer of themo st efficient ve hicle, These d ata show tha t the
ave rag e fuel efficienc y of new c ars sold w as 25mpg, but if consumers had bought only the most
fuel-efficient c a r in eac h size c lass* (and m anu-facturers had been able to supply this demand),
*The results of the analysis would change somewhat if dieselswere included, primarily with respect to nationality of manufac- *lnterestingly, this would also have resulted in U.S. manufac-turers because U.S. manufacturers did not offer diesels in several turers and captive imports capturing over 90 percent of sales, rathersize classes in 1981. U.S. manufacturers, however, are beginning than 74 percent of sales that they actually achieved in this period.to offer diesels in most size categories; but the relevant data are If diesels are included, however, average fuel efficiency could have
not now available. In 1981, about 95 percent of the automobiles been slightly higher than 33 mpg, but less than 60 percent of thesold were gasoline-powered. cars purchased would be domestically produced.
Table 17.—Comparison of Average and Highest Fuel Efficiencyfor 1981 Model Gasoline-Fueied Cars in Each Size Class
Sales-weighted averagefuel efficiency of cars Fuel efficiency of most Nationality of
Sales fraction sold through Jan. 5, 1981 fuel-efficient model in manufacturer of mostEPA size class (percent) (mpg) size class (mpg) fuel-efficient model
Two-seater. . . . . . . . . . . . . 2 22 30 ItalianMinicompact . . . . . . . . . . . 3 34 45 JapaneseSubcompact . . . . . . . . . . . 30 28 42 United States
(Captive Import)Compact . . . . . . . . . . . . . . 9 27 37 United StatesMidsize . . . . . . . . . . . . . . . 37 23 31 United StatesLarge . . . . . . . . . . . . . . . . . 9 24 United StatesSmall wagon . . . . . . . . . . . 4 30 37 JapaneseMidsize wagon . . . . . . . . . 5 23 30 United StatesLarge wagon . . . . . . . . . . . 1 18 20 United States
Sales-weighted average 25 33SOURCE: Data from J. A, Foster, J. D. Murrell, and S. L. Loos, US. Environmental Protection Agency, “Light Duty Automotive Fuel Economy . . Trends Through 1981,”
SAE papar No. 810388, Februa~ 1981.

8/14/2019 Increased Automobile Fuel Efficiency and Synthetic Fuels: Alternatives for Reducing Oil Imports
http://slidepdf.com/reader/full/increased-automobile-fuel-efficiency-and-synthetic-fuels-alternatives-for 99/292
94 q Increased Automobile Fuel Efficiency and Synthetic Fuels: Alternatives for Reducing Oil Imports
the average fuel efficiency would have be en 33mpg (a 33 percent increase). Because EPA’s sizeclasses are based on cars’ interior volume, it isclear that demand for large interior volume in carsis not c urrent ly preventing a signific antly higheraverage fuel efficiency in new cars than is actually
being purchased.
Similarly, a comparison of prices shows that themost fuel-efficient 1981 model cars generally had
a base sticker price in the middle or lower halfof the price range of cars in each size classifica-tion. * Thus, there is no e videnc e tha t p ric e is c on-straining the purchase of fuel-efficient cars either.
A further comparison of the average and mostfuel-efficient cars in each size category shows that
the average cars are heavier and have more pow-erful engines than the most fuel-efficient models.However, OTA’ s ana lysis indica tes that t he g rea t-
er engine pow er found in the averag e c ar soldis, to a large extent, needed simply because thecar is heavier.** There is no indication that the
“Sales-weighted average sticker prices for comparably equippedcars are not currently available.
**For example, in subcompacts and midsized cars (accountingtogether for 67 percent of sales), the average car weighed about33 percent more and had about 50 percent larger engine displace-ment (which is correlated to power) than the most fuel-efficientcar. A further comparison of specific fuel efficiency (ton miles per
most fuel-efficient car in most size categories per-forms (e.g., accelerates) significantly worse than
the a verge 1981 mo de l ca r ac tually sold in thatc ateg ory. Although there are exce pt ions to thisin certain size categories (e.g., two-seaters, large
cars, and possibly midsized station wagons), theseexceptions account for only about 10 to 15 per-
c ent of t ota l sales.
This analysis indicates that interior volume,price, and performance cannot account for thelarge d ifference betw een the fuel efficiency o fcars actually sold and what was available. As in’
the past, consumers consider features such asstyle, quality, safety, ability to carry or haul heav-ier loads, and energy-intensive accessories to beof co mp arable imp ortanc e to fuel ec onomy. Itis probable, therefore, that new-car average fuel
efficiency could be significantly increased if con-
sumer demand for fuel economy were strength-
ened.
gallon, or the mpg of an equivalent car weighing 1 ton) shows that,for midsized cars (37 percent of sales), the difference in fuel effi-ciency between the average and the most fuel-efficient car can beexplained solely on the basis of weight. Thus, there is no indica-tion that the average car has better performance characteristics (e.g.,
acceleration) than does the most fuel-efficient model. A similar com-
parison of subcompacts indicates that, if anything, one would ex-pect the most fuel-efficient model to perform better than theaverage.
WHAT ARE THE PROSPECTS FOR ELECTRIC VEHICLES?
EVs were among the first cars built, but theyhad almost vanished from the marketplace by the1920’s, primarily because they could not com-pete with gasoline-powered vehicles in terms ofprice and performance. Due to concern overautomobile emissions, the increasing price of oiland recent oil supply disruptions, however, therehas been a renewed interest in this technology.The a dvanta ge s of EVs a re tha t they d erive the ir
energy from reliable supplies of electricity, whichcan be produced from abundant domestic energy
sources, and they operate without exhaust emis-
sions. The ir d isadva nta ge s are the ir high c ost andpoor performance and the increased sulfur diox-ide emissions that result from increased electricgeneration.
From the c onsumer’s point of view, the prob -lems with EVs are principally centered on bat-tery technology. Current batteries are expensiveand hea vy, relative to the energy they store; theyrequire several hours to recharge; and they must
be replaced approximately every 10,000 miles ata c ost o f $1,500 to $3,000. The we ight o f b a tterieslimits vehic le rang e, * performance, and cargo-and passenger-carrying capacity. Because of thecost of batteries and electric controls, a new EVis estimated to cost about $3,000 more than acomparable gasoline-powered vehicle. And re-
placing batteries every 10,000 miles because oflimited life w ould a dd mo re tha n $().10/m ile to
*Usually 100 miles or less between recharging.

8/14/2019 Increased Automobile Fuel Efficiency and Synthetic Fuels: Alternatives for Reducing Oil Imports
http://slidepdf.com/reader/full/increased-automobile-fuel-efficiency-and-synthetic-fuels-alternatives-for 100/292
Ch. 4—Issues and Findings q 9 5
op erat ing c osts, which is eq uivalent to ga solinecosting more than $4 to $6/gal for a 40- to 60-mpg
car.
Future developments in battery technologycould improve the prospects for EVs, and severalap proa c hes are b eing p ursued . But the und er-standing of battery technology is not adequateto predict if or when significant improvementswill occur.
If battery problems persist, sales of EVs couldbe limited to a relatively few people and firmsthat c an a fford to p ay a premium to a void trans-porta tion prob lems tha t wo uld a rise if liquid fuelsupplies were disrupted. On the other hand, ifgasoline prices increase by more than a factor of
four or five or if gasoline and diesel fuel are ra-tioned at levels too low to satisfy driving needseven with the most fuel-efficient cars, then EVscould be favored—provided electricity prices donot also increase dramatically.
Prospects for EVs may also be influenced byGove rnme nt inc entives ba sed on na tional andregional considerations. One such considerationis the oil displacement potential of EVs. EVs aremost nearly a substitute for small cars, which arelikely to b e relat ively fuel efficient in the 1990’ s;but the limited range of current and near-termEVs prevents them from being a substitute for all
of the yearly travel needs supplied by a small gas-oline-driven c ar. As a result, oil d ispla c ement byEVs is likely to be relatively small; probably nomore than 0.1 million barrels per day (MMB/D)with a 10-pe rc ent m arket p enetration, even a s-suming no oil consumption by those electric util-
ities supplying electricity to EVs.At current levels of utility oil consumption,
however, the net oil displacement would be lessthan 0.1 MMB/D (see ch. 5 for details). Futurereduc tions in utility oil co nsump tion w ill imp rovethe oil displacement potential of EVs, while in-creased fuel efficiency in petroleum-fueled carswill reduce any advantage EVs might have in thisconnection.
A final co nsideration is the reduc ed auto mo tive
emissions and other environmental effects of EV
use. Because that use would be concentrated in
urban areas and the necessary increased electricpower generation would be well outside of theseareas, cities with oxidant problems that replacelarge numbers of conventional vehicles with EVswill significantly improve their air quality. This in-centive could improve the prospects for EV salesand use. Emissions and other impacts of increasedpower generation may cancel some of this bene-
fit, bu t the p ositive urba n effe c ts a re likely to b econsidered the most important environmental at-tributes of EVs.
IF A LARGE-SCALE SYNFUELS INDUSTRY IS BUILT . . . WILLPUBLIC AND WORKER HEALTH AND SAFETY AS WELL AS THE
ENVIRONMENT BE ADEQUATELY PROTECTED?
It is virtually a truism that all systems designed environmental community has focused on theto produce large amounts of energy will have the potential damaging effects, while the industry haspotential to adversely affect the environment and focused on the controls and environmental man-human health and safety. It is equally true that, agement procedures available to them. Gainingwith few exceptions, it is technically feasible to a perspective on the correct balance betweenreduce these effects to the point where they are these two po ints of view—on the likelihood thatgenerally considered an acc eptable exchange for some of the potent ial damages will actually occur
the energy benefits that will be obtained. In cur- —is espe c ially imp ortant in the c ase of synfuelsrent arguments concerning synthetic fuels devel- developm ent b ec ause environmental d ange rsopment, as with many other such arguments, the have b ecome a genuine public concern.

8/14/2019 Increased Automobile Fuel Efficiency and Synthetic Fuels: Alternatives for Reducing Oil Imports
http://slidepdf.com/reader/full/increased-automobile-fuel-efficiency-and-synthetic-fuels-alternatives-for 101/292
96 . Increased Automobile Fuel Efficiency and Synthetic Fuels: Alternatives for Reducing Oil /reports
As shown in the e valuation o f p ote ntial envi-ronmental impacts in this report, many of the im-portant impacts of a large synfuels industry willbe similar in kind to those of coal-fired electricpo we r generation. The m ag nitude of these im-pacts (acid drainage and land subsidence fromcoal mines, emissions of sulfur and nitrogen ox-ides and particulate, effects of water use, popula-tion increases, etc. ) is likely to be similar to andin some cases less than the likely impacts of thenew, tightly controlled electric-generating capac-ity projected to be installed in the same timeframe.
A second set of impacts–those associated withthe toxic materials present in the process andwa ste stream s of the plants and possibly in the irproducts—are not predictable at this time but are,nevertheless, very worrisome. Factors that shouldbe useful in gaging the risk from these impacts
include the technical problems facing the design-ers of environmental controls, the availability ofadequate regulations and regulatory agency re-sources, past industry and Government behaviorin implementing environmental and safety con-
trols, and diffic ulties that might b e enc ounteredin detecting adverse impacts and tracing them to
their sources. A brief discussion of these factorsfollows:
1. Tec hnica l Problems.—Virtually all the con-trols which are planned for synthetic fuelsplants are based on present engineering
practices in the petroleum refining, petro-chemical, coal-tar processing and powergeneration industries, and industry spokes-men a pp ear co nfident tha t they will worksatisfactorily. Problems may be encountered,however, because of differences betweenthese industries and synfuels plants—the Iat-
ter have higher c onc entrations of to xic hy-droc arbo ns and trac e metals, highe r pres-sures, a nd mo re e rosive p roc ess strea ms, inparticular, As yet, few effluent streams havebeen sent through integrated control sys-tems, so it has not yet been demonstrated
tha t the va rious con trol proc esses will wo rksatisfactorily in concert, Technical person-nel at the Environme ntal Prote c tion Ag en-cy (EPA) and the Department of Energy
2.
3.
(DOE) have expressed particular concernsabout control-system reliability.
Judging from these indications, it appears
possible that a considerable period of time– possibly even a few years–will be necessaryto solve control problems in the first fewplants and ge t the environme ntal systems
working with adequate performance andreliability. Delays are especially likely fordirect-liquefaction pIants, which have someparticularly difficult problems involving toxicsubstances and erosive process streams.These de lays ma y be ag grava ted b y a po ten-
tial ga p in c ontrol technology developme nt.Recent Federal policy has left the develop-ment of environmental controls largely to in-dustry. The major concern of the synfuelsindustry, on the other hand, is to clean upwaste streams so that existing regulationsmay be met. Less emphasis is placed on con-
trolling pollutants such as polynuclear aro-matics that are not currently regulated. It ap-
pe ars c ertain that there will be c onsiderablepressure to regulate these and other pollut-ants, but it is not certain that the industrywill be able to respond quickly to such regu-lations.
Detec ting a nd Tracing Impa c ts. —One of the
major potential dangers of synfuels plantswill be low-level emissions of toxic sub-stances, especially through vapor leaks (pri-
mary danger to workers) or ground water
contamination from waste disposal (primarydanger to the public and the general envi-ronment), Current ground water monitoringprobably is inadequate to provide a desirablemargin of safety, although presumablyknowledge of this danger will result in bet-ter monitoring systems. A major problemma y be the long lag times assoc iated withdetecting carcinogenic/mutagenic/teratogen-ic damages—a major concern associatedwith trace hydrocarbons produced underthe physical and chemical conditions pres-
ent in most synfuels reactors.
Regulation. –The regulatory climate facingan emerging synfuels industry is mixed. Onthe one hand, ambient standards for partic-
ulates, sulfur oxides, and other pollutants

8/14/2019 Increased Automobile Fuel Efficiency and Synthetic Fuels: Alternatives for Reducing Oil Imports
http://slidepdf.com/reader/full/increased-automobile-fuel-efficiency-and-synthetic-fuels-alternatives-for 102/292
Ch. 4—issues and Findings q 9 7 — .-.
associated with conventional combustionsources are in plac e a nd should offer ad e-quate protection to p ublic health with re-spect to this group of pollutants. A limitednumber of other standards, including thosefor drinking water protection, also are in
place. On the other hand, new source per-forma nc e sta ndards–fed erally set em issionstandards—have not been determined yet,nor have national emission standards forhazardous air pollutants been set for the vari-
ety of fugitive hydrocarbons or vaporizedtrace elements that might escape from syn-fuels plants. Likewise, although Occupation-al Sa fety and Health A dministration (O SHA)exposure standards and workplace safety re-
quirements do apply to several chemicalsknown or expected to occur in synfuels pro-duction, the majority of such chemicals are
not regulated at this time.These regulatory gaps are not surprising,
given the limited experience with synfuelsp lants, and seve ral of the sta ndards–espe -cially the emissions standards—probablycould not have been properly set at this stage
of industry development even had therebeen intensive environmental research.However, the difficulties in detecting im-pacts described above, and some doubts as
to the ava ilab ility of e nvironme ntal resea rc hresources at the Federal level, lead to con-cern about the adequacy of future regula-
tion.4. Past History. –Given both the potential for
environmental harm and the potential formitigating measures, the attitude and behav-ior of both the industries tha t w ill build andoperate synfuels plants and the agencies thatwill reg ulate them are c ritic al d eterminantsof actual environmental risk. Consequent-ly, an understanding of the past environmen-tal record of these entities should be a usefulguide in gaging this risk. Unfortunately, thereis little in the way of comprehensive research
on this behavior. Even the compilation ofdata on compliance with existing regulations
and incidence of deaths and injuries is quiteweak.
For example, to our knowledge EPA hassponsored only one major evaluation ofcompliance with emission regulations; thisrecent stud y of nine Sta tes show ed tha t 70percent of all sources failed to comply fullywith tho se reg ulations. Also, Dep artment of
Labor statistics on occupational hazards arecompiled in such a way as to overlook healthproblems that cannot easily be attributed to
a specific cause—just the kinds of problemsof most concern to an evaluation of poten-tial synfuels problems. Consequently, occu-pational health and safety statistics that ap-pear favorable to synfuels-related industriesare likely to be an inadequate guide to theactual hazard potential.
Anecdotal evidence, although not an ade-
quate b asis for eva luating risk, may be usefulas a warning signal of future causes of health
and safety problems. For example, recentstudies have demonstrated that protectiveglove s used in the c hem ica l industry fail toprotect workers from several hazardous, and
c ommo nly enc ountered , c hemica ls. Thispoints to b oth a n immed iate technical prob-lem and an institutional failure in the chem-ical industry itself and its regulating agencies.
On the other hand, the tests, which werespo nsored by OSHA, a lso demonstrate theability of the regulatory agency to correctpast fa ilures.
Another example of anecdotal evidence
that may indicate some future problems withindustry performance is that some develop-ers have failed to incorporate separate andmeasurable control systems in synfuels pilot
plants. For example, a direct-liquefactionfacility in Texas has its effluents mixed withthose of a neighboring refinery, rather thanhaving a separate control system whose ef-fectiveness at treating synfuels wastes can be
tested and op timized . This might reflec t in-dustry’s lack of priority or, more likely, itshigh level of confidence that no unusualcontrol problems will arise that cannot beread ily handled a t the c omm ercial stag e.There is considerable disagreement aboutthe validity of this confidence.

8/14/2019 Increased Automobile Fuel Efficiency and Synthetic Fuels: Alternatives for Reducing Oil Imports
http://slidepdf.com/reader/full/increased-automobile-fuel-efficiency-and-synthetic-fuels-alternatives-for 103/292
98 . Increased Automobile Fuel Efficiency and Synthetic Fuels: Alternatives for Reducing Oil lmports
Finally, there is ample evidence that thechemical industry and its regulators have had
significant problems in dealing properly withsubtle, slow-acting chemical poisons. Chem-icals that were unregulated or inadequately
regulated for long periods of time, and
whose subsequent regulation became ma- jor sources of conflict between industry andGovernment, include benzene, formalde-hyde, vinyl chloride, tetraethyl lead, thepestic ide 2,4,5-T, and ma ny o the rs. In som ec ases, c ontrove rsy p ersists despite yea rs oreven decades of research.
An implication of the above discussion is thatadequate environmental management of synfuelsis unlikely to occur automatically when develop-ment begins in earnest. Although OTA believesthat the various waste streams can be adequate-ly co ntrolled , this is go ing to require a strong in-dustry effort to determine the full range of poten-tial environmental impacts associated with devel-
opment and to devise and implement measuresto mitigate or prevent the important impacts. Atpresent, however, there are indications that most
developers are interested primarily in meetingcurrent regulatory requirements, most of whichare limited in their c overag e o f po tential imp ac ts.
And completing the regulatory record, to providethe incentive necessary to stimulate further envi-ronme ntal efforts, is go ing to be a diffic ult a ndtime-co nsuming job, p artic ularly if ongoing c ut-backs in Government research and regulatorybudgets are not accompanied by promised im-provem ents in e ffic ienc y.
Finally, there are some remaining doubts aboutthe reliability of proposed control systems inme eting c urrent regulatory requireme nts. Thesepotential problem areas imply that congressionaloversight of an emerging synfuels industry willneed to be especially vigorous in its coverage of
environmenta l c onc erns.
WILL WATER SUPPLY CONSTRAIN SYNFUELS DEVELOPMENT?
In the aggregate, the water consumption re-quireme nts for synfuels deve lopm ent a re sma ll.Ac hieving a synfuels prod uc tion ca pa bility of 2million barrels per day oil equivalent would re-quire on the order of 0.3 million acre-feet/yearor about 0.2 percent of estimated total current
na tiona l freshwa ter c onsump tion, Nevertheless,synfuels pla nts a re individually la rge w a ter c on-sumers. Depending on both the water supplysources chosen for synfuels development and thesize and timing of water demands from otherusers, synfuels development could create con-flic ts amo ng users for increa singly sc arce wa tersupplies or exacerbate conflicts in areas that are
already water-short.
The na ture a nd extent of the imp ac ts of syn-fuels development on water availability are con-
trove rsial. The c ontrove rsy arises in la rge p art be -
cause of the many hydrologic as well as institu-tional, legal, political, and economic uncertain-ties and constraints which underlie the data, andbecause of varying assumptions and assessmentmetho do logies used . The impo rtanc e o f the fac -
tors influenc ing wa ter a vailab ility will vary in thedifferent river basins where the energy resourcesare located.
In the major Eastern river basins where energyresources are loc ated (i.e., the Ohio, Tenne ssee ,
and the Upper Mississippi), water should general-ly be adequate on the mainstems and larger trib-utaries, without new storage, to support likelysynfuels development. However, localized waterscarcity problems couId arise during the inevita-ble d ry pe riod s or due to de velopm ent o n sma llertributaries. The severity of these local problemscannot be ascertained from existing data and they
have not yet been examined systematically. With
appropriate water planning and management, itshould be possible to reduce, if not eliminate, anylocal problems that might arise.
Com pe tition for wa ter in the West a lrea dy e x-ists and is expected to intensify with or withoutsynfuels development. In the Missouri RiverBasin, the magnitude of the institutional, legal,and political uncertainties, together with the need

8/14/2019 Increased Automobile Fuel Efficiency and Synthetic Fuels: Alternatives for Reducing Oil Imports
http://slidepdf.com/reader/full/increased-automobile-fuel-efficiency-and-synthetic-fuels-alternatives-for 104/292
Ch. 4—Issues and Findings . 99
for major new water storage projects to average-out seasonal and yearly streamflow variations,preclude an unqualified conclusion as to theavailability of water for synfuels development.The ma jor sources of the se unc erta inties, wh ichare difficult to quantify because of a lack of sup-
porting information, include Federal reserve wa-ter rights (including Indian water rights claims),provisions of existing compacts, and instreamflow reservations.
In the Upper Colorado River Basin, water couldbe made available to support the level of synfuels
development expected over the next decade.However, the institutional, political, and legaluncertainties make it difficult to determine which
source s would b e used and the a ctua l amountof water that would be made available from these
source s. The principa l unce rtainties c onc ern the
use of Federal storage, the transfer of water rights,provisions of existing compacts and treaties, andFederal reserve rights. The range of uncertaintysurrounding the water availability to the entireba sin after 1990 is so b road tha t it te nds to sub-sume the amount of water that would be neededfor expa nde d synfuels de velopm ent.
ARE SYNTHETIC FUELS COMPATIBLE WITH EXISTING END USES?
When introducing new fuels into the U.S. liq-uid fue ls system , it is impo rta nt to d ete rmine thecompatibility of the new fuels with existing enduses in order to determine what end-use changes,if any, may be necessary. In this section the com-
patibility of various synfuels with transportationend uses is briefly described.
Alcohols
Neither pure ethanol nor pure methanol canbe used in existing a utom ob iles without mo d ify-ing the fuel delivery system, but cars using them
can be readily built and engines optimized forpure alco hol use w ould p rob ab ly be 10 to 20 per-
c ent more effic ient than their ga soline c ounter-parts. New cars currently are being built to becompatible with gasohol (1 O percent ethanol, 90percent gasoline), so potential problems with thisblend are likely to disap pe ar with time.8 Metha-nol-gasoline blends have been tested with mixedresults. Principal problems include increasedevaporative emissions and phase separation ofthe fuel in the presence of small amounts ofwater. These p roblems ca n be reduc ed by b lend-ing t-butanol (another alcohol) with the methanol,
and such a blend is currently being tested.9 How-
ever, due to the corrosive effects of methanol on
afnergy From Biological Processes, Volume 11: Technical and fnvi-
ronmenta/ Ana/yses, OTA-E-1 28 (Washington, D. C.: U.S. Congress,Office of Technology Assessment, September 1980).
91bid.
some plastics, rubbers, and metals in some vehi-cles, it probably is preferable to use methanol in
its pure form in modified vehicles or to requirethat components in new automobiles be compat-
ible with methanol blends.
Shale Oil
Shale oil has been successfully refined at thepilot plant level to products that meet refineryspecifications for petroleum derived gasoline,diesel fuel, and jet fuel.10 The properties of thediesel and jet fuels are shown in tables 18 and19, where they are compared with the petroleum
counterparts. Current indications are that the ma- jor question with respect to compatibility of thesefuels with their end uses is what minimum levelof refining (and thus refining cost) will be neededto satisfy the needs of end users.
Direct Coal Liquids
One of the direct coal liquids, SRC II, has alsobeen successfully refined to products that meetrefinery specifications for gasoline and jet fuel(tab les 18 and 19). (The c eta ne numbe r of theresultant “ d iesel fue l, ” however, is lower than
that normally required for petroleum diesel fuel.)The g asoline, bec ause o f its a roma tics c ontent,
‘OR. A. Sullivan and H. A. Frumkin, “Refining and Upgrading ofSynfuels From Coal and Oil Shales by Advanced Catalytic Proc-esses, ” third interim report, prepared for DOE under contract No.EF-76-C-01-2315, Chevron Research Co., Apr. 30, 1980.
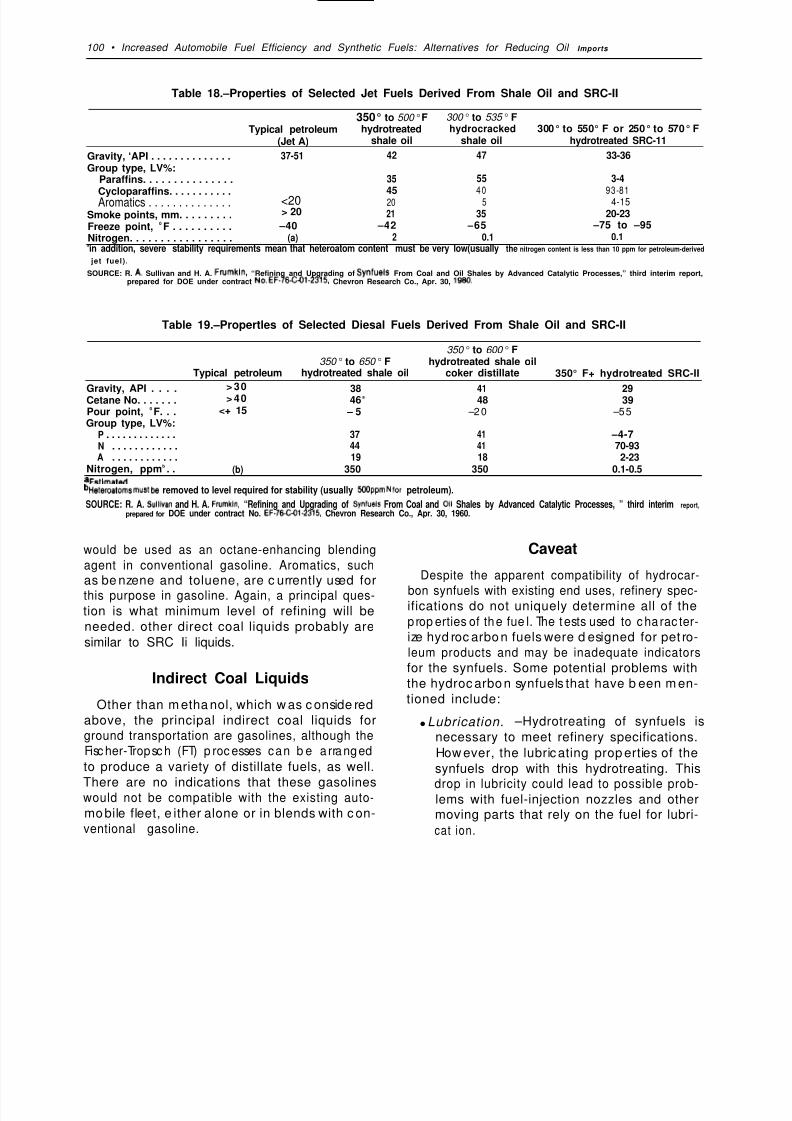
8/14/2019 Increased Automobile Fuel Efficiency and Synthetic Fuels: Alternatives for Reducing Oil Imports
http://slidepdf.com/reader/full/increased-automobile-fuel-efficiency-and-synthetic-fuels-alternatives-for 105/292
100 Increased Automobile Fuel Efficiency and Synthetic Fuels: Alternatives for Reducing Oil Imports
Table 18.–Properties of Selected Jet Fuels Derived From Shale Oil and SRC-II
350° to 500°F 300° to 535° FTypical petroleum hydrotreated hydrocracked 300° to 550° F or 250° to 570° F
(Jet A) shale oil shale oil hydrotreated SRC-11
Gravity, ‘API . . . . . . . . . . . . . . 37-51 42 47 33-36
Group type, LV%:Paraffins. . . . . . . . . . . . . . . 35 55 3-4
Cycloparaffins. . . . . . . . . . .45 40 93-81
Aromatics . . . . . . . . . . . . . . <20 20 5 4-15
Smoke points, mm. . . . . . . . . > 20 21 35 20-23
Freeze point, 0 F . . . . . . . . . . –40 –42 –65 –75 to –95Nitrogen. . . . . . . . . . . . . . . . . (a) 2 0.1 0.1ain addition, severe stability requirements mean that heteroatom content must be very low(usually the nitrogen content is less than 10 ppm for petroleum-derived
jet fuel).
SOURCE: R. A. Sullivan and H. A. Frumkin, “Refining and Upgrading of SYnfuels From Coal and Oil Shales by Advanced Catalytic Processes,” third interim report,prepared for DOE under contract No. EF-76-C-01-2315, Chevron Research Co., Apr. 30, 19S0.
Table 19.–Propertles of Selected Diesal Fuels Derived From Shale Oil and SRC-II
350° to 600° F350° to 650° F hydrotreated shale oil
Typical petroleum hydrotreated shale oil coker distillate 350° F+ hydrotreated SRC-II
Gravity, API . . . .> 30
38 41 29Cetane No. . . . . . . > 40 46 a48 39
Pour point, 0 F. . . <+ 15 – 5 –20 –55Group type, LV%:
P . . . . . . . . . . . . . 37 41 –4-7N . . . . . . . . . . . . 44 41 70-93A . . . . . . . . . . . . 19 18 2-23
Nitrogen, ppmb . . (b) 350 350 0.1-0.5
aEatlmated.bHeterOatOrnS rnwt be removed to level required for stability (usually 600 Ppm N for petroleum).
SOURCE: R. A. Sulllvan and H. A. Frumkln, “Refining and Upgrading of Synfuels From Coal and 011 Shales by Advanced Catalytic Processes, ” third interim report,prepared for DOE under contract No. EF-76-C-01-2315, Chevron Research Co., Apr. 30, 1960.
would be used as an octane-enhancing blending
agent in conventional gasoline. Aromatics, suchas be nzene and toluene, are c urrently used forthis purpose in gasoline. Again, a principal ques-
tion is what minimum level of refining will beneeded. other direct coal liquids probably aresimilar to SRC Ii liquids.
Indirect Coal Liquids
Other than m etha nol, which w as c onside redabove, the principal indirect coal liquids forground transportation are gasolines, although theFisc her-Tropsc h (FT) p roc esses can b e a rranged
to produce a variety of distillate fuels, as well.
There are no indications that these gasolineswould not be compatible with the existing auto-
mo bile fleet, e ither alone or in blends with c on-ventional gasoline.
Caveat
Despite the apparent compatibility of hydrocar-
bon synfuels with existing end uses, refinery spec-ifications do not uniquely determine all of thep rop erties of the fue l. The tests used to c ha rac ter-ize hyd roc arbo n fuels were d esigned for pet ro-leum products and may be inadequate indicators
for the synfuels. Some potential problems withthe hydroc arbo n synfuels that have b een m en-tioned include:
q Lubrication. –Hydrotreating of synfuels isnecessary to meet refinery specifications.How ever, the lubric ating prop erties of thesynfuels drop with this hydrotreating. This
drop in lubricity could lead to possible prob-lems with fuel-injection nozzles and othermoving parts that rely on the fuel for lubri-cat ion.

8/14/2019 Increased Automobile Fuel Efficiency and Synthetic Fuels: Alternatives for Reducing Oil Imports
http://slidepdf.com/reader/full/increased-automobile-fuel-efficiency-and-synthetic-fuels-alternatives-for 106/292
Ch. 4—issues and Findings q 10 1——-. - — — - — — — .
q Emissions. —The p a rticulate and nitroge n ox-ide emissions of synthetic diesel fuel couldbe greater than those from an otherwisecomparable petroleum diesel fuel. Automo-bile manufacturers are having difficulty meet-ing emissions standards with conventional
diesel fuel, and there is some concern thatsynfuels could aggravate these problems.
q Variability. —The d irec t liquefa c tion synfuelsfrom coal can vary in composition depend-
ing on the coal used.11 Consequently, al-though the synfuel from one coal may beco mpa tible with an end use, the same proc-ess might produce an incompatible synfuelif another coal is used.
In principle, if the exact chemical compositionof synfuels were known, synfuels could beblended from petrochemicals and tested exten-sively for these potential problems before synfuelsplants were built. In practice, however, the chem-ical compositions are so complex, varied, and
proc ess-dep end ent t hat this op tion is prob ab lynot practical.
The alte rnative is to wa it until sufficient quan-tities of synfuels are available and to conduct ex-tensive field tests of synfuels processed in variouswa ys and from d ifferent c oa ls. Until this is do ne,statements about the compatibility of hydrocar-bon synfuels with current end uses are somewhat
speculative.
1 Ibid,

8/14/2019 Increased Automobile Fuel Efficiency and Synthetic Fuels: Alternatives for Reducing Oil Imports
http://slidepdf.com/reader/full/increased-automobile-fuel-efficiency-and-synthetic-fuels-alternatives-for 107/292
Chapter 5
Increased Automobile Fuel Efficiency
Contents
Page
Status and Trends . . . . . . . . . . . . . . . . . . . 105
Automobile Technologies . . . . . . . . . . . . . 108Vehicle Size and Weight . . . . . . . . . . . . 110Powertrain . . . . . . . . . . . . . . . . . . . . . . . . 111Fuel Economy–A Systems Problem . . . 113
Tradeoffs With Safety and Emissions. . . 113Methanol-Fueled Engines . . . . . . . . . . . . 115Battery-Electric and Hybrid Vehicles. . . 117
Future Automobile Fuel Efficiency . . . . . . 120Technology Scenarios . . . . . . . . . . . . . . 121Projection of Automobile Fleet
Fuel Efficiency . . . . . . . . . . . . . . . . . . . 122
Estimated Fuel Consumption, 1985-2000. 126Projected Passenger-Car Fuel
Consumption . . . . . . . . . . . . . . . . . . . . 126Substitution of Electric vehicles . . . . . . 128Fuel Use by Other Transportation
Modes . . . . . . . . . . . . . . . . . . . . . . . . . 129
Page
Costs of Increased Fuel Efficiency . . . . . . 130Overview . . . . . . . . . . . . . . . . . . . . . . . . . 130Fuel Savings Costs . . . . . . . . . . . . . . . . . 137Consumer Costs . . . . . . . . . . . . . . . . . . . 139Electric and Hybrid Vehicles, . . . . . . . . 141
MethanoI Engines . . . . . . . . . . . . . . . . . . 142Appendix A.–Prospective Automobile
Fuel Efficiencies . . . . . . . . . . . . . . . . . . 142
Appendix B. –Oil Displacement Potentialof Electric Vehicles . . . . . . . . . . . . . . . 149
TABLES
Table No. Page
20. Potential Battery Systems for Electric(and Hybrid) Vehicles . . . . . . . . . . . . . 118
21. Prospective AutomobileFuel-Efficiency Increases, 1986-2000 . 122

8/14/2019 Increased Automobile Fuel Efficiency and Synthetic Fuels: Alternatives for Reducing Oil Imports
http://slidepdf.com/reader/full/increased-automobile-fuel-efficiency-and-synthetic-fuels-alternatives-for 108/292
Table No. Page Page
22. Small, Medium, and Large Size 36. Total Domestic Capital InvestmentsClasses Assumed for 1985-2000 . . . . . 123 for Changes Associated With
23. Automobile Characteristics– Increased Fuel Efficiency. . . . . . . . . . . 136High-Estimate Scenario . . . . . . . . . . . . 124 37. Estima ted Ca p ital Investment
24. Automobile Characteristics— Alloc ate d to Fuel Effic iency p erLow-Estimate Sce nario. . . . . . . . . . . . . 124 Gallon of Fuel Saved . . . . . . . . . . . . . . 138
25. Estimated New-Car Fuel Economy: 38. Capital investment Attributed to1985 -2000 . . . . . . . . . . . . . . . . . . . . . . . 125 Increased Fuel Efficiency Plus
26. Effec t on Size Mix on Estimated Assoc ia ted Development Costs per
Fuel Economy of the New-Car Sales Barrel/Day of Fuel Saved . . . . . . . . . . 139in the United States. . . . . . . . . . . . . . . 126 39. Plausible Consumer Costs for
27. Baseline Assumptions for Projections Increased Automobile Fuel Efficiencyof Automobile Fuel Consumption . . . 126 Using Alternative Assumptions About
28. Effects of Substituting Electric Variable Cost Increase. . . . . . . . . . . . . 140Vehicles . . . . . . . . . . . . . . . . . . . . . . . . 128
29. Projected Petroleum-Based FuelUse for Transportation . . . . . . . . . . . . 129
30. Post-1985 Automotive Capital CostFIGURES
Estimates. . . . . . . . . . . . . . . . . . . . . . . . 132 Figure No. Page
31. Summary of investment 6. Historic a l Average New-Car FuelRequirements Associated With Efficiency of Cars Sold in the UnitedIncreased Fuel Efficiency. . . . . . . . . . . 134 States . . . . . . . . . . . . . . . . . . . . . . . . . . 105
32. Average Capital Investments 7. Historical Capital Expenditures byAssoc ia ted With Inc rea sed Fuel U.S. Automobile Ma nufa cturers . . . . . 108Efficiency by Car Size and by 8. Fuel Use in City Portion of EPAScenario . . . . . . . . . . . . . . . . . . . . . . . . 134 Fuel-Efficiency Test Cycle . . . . . . . . . . 109
33. Average Cap ita l Investments 9. Sa les-Weighted Average New-CarAssociated With Increased Fuel Fleet Specific Fuel Efficiency. . . . . . . . 125Efficiency by Car Size and by 10. Projected Passenger-Car Fuel
Scenario . . . . . . . . . . . . . . . . . . . . . . . . 135 Consumption . . . . . . . . . . . . . . . . . . . . 12734. Average Capital Investments 11. Cumulative Oil Savings From
Associated With Increased Fuel Increased Automobi le Fuel Ef f ic iencyEfficiency by Car Size and by Relative to 30 MPG in 1985, NoScenario . . . . . . . . . . . . . . . . . . . . . . . . 135 Change Thereafter . . . . . . . . . . . . . . . . 128
35. Percentage of Capital Investments 12. Real and Nominal U.S. Car Prices,Alloc ated to Fuel Efficiency . . . . . . . . 136 1960-80 . . . . . . . . . . . . . ... , . . . . . . . . 139

8/14/2019 Increased Automobile Fuel Efficiency and Synthetic Fuels: Alternatives for Reducing Oil Imports
http://slidepdf.com/reader/full/increased-automobile-fuel-efficiency-and-synthetic-fuels-alternatives-for 109/292
Chapter 5
Increased Automobile Fuel Efficiency
STATUS AND TRENDS
Until the 1970’s, fuel economy was seldom im-
portant to American car buyers. Gasoline wasc hea p and plentiful, taxes on fuel a nd on c ar sizelow. In contrast with automobile markets in most
of the rest of the w orld, a utomakers had few in-centives to build small cars, or consumers to pur-c hase the m. The typ ic al Am eric an pa sseng er ca r –large, comfortable, durable–evolved in relativeisolation from design trends and markets in other
parts of the world. Fuel economy was a minorc onsidera tion. (This wa s not the c ase fo r hea vytrucks, where fuel costs have always been a sub-
stantial component of operating expenses.)
In the late 1960’s and early 1970’s, Federalemissions control standards worked at the ex-pense of fuel economy. But fuel economy pres-sures were also building—signified by gasolineshortages, the sudden rise in oil prices, and thepassage of the Energy Policy and Co nservat ionAct of 1975 (EPCA). EPCA set fleet average mile-
age standards for automobiles sold in the UnitedStates beginning in 1978. The combination ofCorporate Average Fuel Economy (CAFE) stand-ards and market forces stimulated rapid changesin the design of American cars, followed by asharp sw i ng in consumer demand during 1979
and 1980 toward small, economical imports.A similar upsurge in small-car demand had fol-
lowed the 1973-74 oil shock. Over the 1965-75period, Ame rica n-mad e c ars averaged ab out 14to 15 miles per gallon (mpg). * For model year1980, the a verag e fo r ca rs sold in the dom esticmarket was up to 21 mpg, 1 mpg above the EP-
CA requirement. For 1981 models, domestic carssold through January 5, 1981, averaged almost24 mpg, or almost 2 mpg above EPCA require-ments. (See also fig. 6.)
Most of the increases in fuel economy have
come from downsizing—redesigning passengerc ars so tha t they a re sma ller and lighte r, and c anuse engines of lower horsepower. Other changes
*Based on EPA’s combined test cycles (55 percent city and 45percent highway cycle).
Figure 6.—Historical Average New-Car FuelEfficiency of Cars Sold in the United States
30,
25 -
20 -
15
1 0
c
1970 1972 1974 1976 1978 1980 1982
YearSOURCE: J. A. Foster, J. D. Murrell, and S. L. Loaa, “Light Duty Automotive Fuel
Economy. . Trends Through 1981 ,“ SAE Paper 810386, February 1981.
in vehicle designee. g., decreased aerodynamic
drag and rolling resistance, improved automatictransmissions and higher rear axle ratios, elec-tronic engine controls, greater penetration ofdiesels–have also helped to reduce fuel con-sumption.
While the latest te c hnolog y is used in these re-designs, technology itself is not–and has notbeen–a limiting factor in passenger-car fuel econ-
om y in any funda me nta l sense. The limiting fa c -tor is what the manufacturers decide to buildbased on judgments of future consumer demand.Decisions on new models may also be con-strained by the costs of new capital investment.Tec hnology d oes have a vita l role in ma nag ingthe many tradeoffs among manufacturing and in-vestment costs, fuel economy, and the other at-tributes that affect consumer preferences—qual-
ity, comfort, carrying capacity, drivability, and
pe rforma nc e. Tec hnolog y is a lso c ritic al in man-aging possible tradeoffs involving fuel economy,
emissions, and safety.
American automakers are still incrementallydownsizing their fleets–in the process convert-
105

8/14/2019 Increased Automobile Fuel Efficiency and Synthetic Fuels: Alternatives for Reducing Oil Imports
http://slidepdf.com/reader/full/increased-automobile-fuel-efficiency-and-synthetic-fuels-alternatives-for 110/292
106 q Increased Automobile Fuel Efficiency and Synthetic Fuels: Alternatives for Reducing Oil Imports
ing to front-wheel drive, which helps to preserveinterior spac e. These red esigns have be en large-
ly pac ed by three interrelated fac tors: 1) CAFEstandards, which require fleet averages of 27.5mpg by 1985; 2) each manufacturer’s estimatesof future market demand in the various size
classes (until 1979, market demand for smaller,more fuel-efficient cars lagged behind the CAFEstandards, but it has now outstripped them—sev-eral recent projections point toward fleet averages
of more than 30 mpg by 19851); and, 3) the c ap -
ital resources of U.S. firms, which affect both theirab ility to de sign and de velop ne w sma ll ca rs and
their ability to invest in new plant and equipmentfor manufacturing them.
The grad ua l do wnsizing o f the U.S. autom ob ilefleet ha s been ac co mpa nied by a n intensive d e-velopmental effort aimed at maximizing the fueleconomy of cars of a given size, consistent with
the need for low pollutant emission levels andoccupant safety—both also matters of Govern-ment policy. Foreign manufacturers, who in 1980
accounted for about one-quarter of sales in the
United Sta tes, are a lso imp roving the fue l eco n-omy of their fleets, but they can concentrate ontec hnic al improveme nts rathe r than new sma ll-car designs because their product lines are al-rea dy he avily oriented tow ard c ars that are sma llin size and low in weight.
Bec ause the U.S. auto mo bile fleet now c on-tains over 100 million cars, increases in new-car
fuel eco nomy ta ke time to b e felt. Typica lly,ab out ha lf the c ars of a given mo de l yea r are stillon the road after 10 years; it takes about 17 years
before 99 percent are retired. Thus, while new-car fuel economy for the 1980 model yearrea c hed ab out 21 mp g, the a verage for the U.S.fleet in 1981 is still only about 16 to 17 mpg, aleg ac y of the big c ars of e arlier yea rs. if new c ars
ave rag e 30 to 35 mp g b y 1985—a target that iseasily attainable from a technological stand-point–the average fuel efficiency of cars on theroad would reach only about 22 mpg by 1985.While more than half the annual fuel savings asso-
ciated with the 1985 CAFE standards will beachieved by 1985, the full benefit of the 30-mpgnew cars of 1985—and of further improvementsin later years—will not come until the end of the
century.
Of course, 30-mpg CAFE standards are possible
right now , and 50-mpg c ars are c urrently beingsold. Proportionately higher fuel economy figureswill in principle be attainable in the future, asautomotive technology progresses. But todayonly a portion of consumers want such vehicles—be ca use fuel ec onomy often c ome s at the e x-pense of comfort, accommodations for passen-gers and luggage, performance, luxury, conven-ience features and accessories, and other attri-butes more commonly found in larger cars–andma nufac turers try to plan their future produc t m ixto appeal to a broad range of consumer tastes.
The sudden shift in ma rket demand to wa rdsmall, fuel-efficient cars in 1974-75, followed bya resurgence in large-car sales during 1976-78 and
another wave of d ema nd for fuel efficiency in1979 and 1980, illustrate s the unpredic ta b le na -ture o f c onsume r preferenc es. The 1979 marketshift ha s ou tp ac ed the CA FE sta nd ards. The 27.5-mpg requirement set by EPCA for the 1985 modelyea r rem ains in effec t fo r subseq uent yea rs unlessmodified by Congress. If world oil prices againsta bilize, a nd supp ly exce ed s de ma nd—as oc-curred through much of 1981 —the risks and un-certainties facing U.S. automakers could multi-
ply, a particularly worrisome situation given theirprec arious financ ial situations and the large c ap -ital outlays necessary for redesign and retooling.Recently, American automakers have been reas-
sessing their commitments to rapid downsizingand new small-car lines—both because of cashflow shortfalls and be c ause o f unc ertainty overfuture m arket d ema nd.2
The 14-mp g U.S. fleet average o f 1975 is a use-ful baseline for estimating recent and near-termfuel savings resulting from the combination ofEPCA standards and market forces. For the period
1975-85, OTA estimates that fuel economy in-IW. G. Agnew, “Automobile Fuel Economy Improvement,” Gen-
eral Motors Research Publication GMR-3493, November 1980; The
U.S. Automobile Industry, 1980: Report to the President From the
Sec retary of Transpo rtation , DOT-P-1 O-81-O 2, January 1981. inde-pendent estimates by OTA are similar.
ZJ. Holusha, “Detroit’s Clouded Crystal Ball; Gasoline Glut SpursReview of Small Cars,” New York Times, July 28, 1981, p. Dl;j. Holusha, “For G. M., a Fresh Look at Spending Strategy,” NewYork Times, Nov. 10, 1981, p. D1.

8/14/2019 Increased Automobile Fuel Efficiency and Synthetic Fuels: Alternatives for Reducing Oil Imports
http://slidepdf.com/reader/full/increased-automobile-fuel-efficiency-and-synthetic-fuels-alternatives-for 111/292
Ch. 5—Increased Automobile Fuel Efficiency 107
creases in passenger cars alone will have saved
slightly more than 0.8 MMB/DOE (million bar-rels per day, oil equivalent) on the average—much less in the earlier years, and about twiceas much near the end of this 10-year period, Con-
sidering only passenger cars, the cumulative sav-ing throug h 1985 will be app roximately 3 billionba rrels (bb l) of p etroleum–ab out 75 percent o fthe total U.S. crude oil imports during 1979 and1980. For the period 1985-95, by the end ofwhich the average efficiency of all cars on theroa d should b e 30 mp g o r more, the d aily sav-ings would be at least 3 million barrels per day(MM B / D), giving an additional cumulative sav-ing of at least 10 billion bbl compared with a 14-mpg fleet. Thus, for the 20-year period 1975-95,the total savings from increased passenger-car fuel
ec onom y would b e ove r 13 billion b bl—equiva-Ient to 8 years of crude oil imports or about 7
yea rs of ne t p etroleum imports a t the 1981 rate.These estima ted reduc tions in petroleum c on-
sumption could be larger if fuel-economy im-provements proceed faster than assumed. Fuel-economy improvements in trucks, particularlylight and medium trucks, will also save significant
amounts. Nonetheless, the U.S. passenger-carfleet would still consume 3.6 MMB/D in 1985 and
3 MMB/D in 1995–compared with 4.3 MMB/Din 1980—if the passenger-car fleet grows as ex-pected and cars continue to be driven at the his-torical rate of 10,000 miles per year, on the aver-
age. If automobile travel is reduced, fuel con-sump tion would be d ec rea sed p rop ortiona tely.
The savings in pe troleum c onsump tion–whic hrepresent a direct benefit to consumers as wellas an indirect benefit because of the expectedimp rovem ent in the U.S. ba lance of p aym ents—
a lso c arry costs. These w ill generally take the fo rmof higher purchase prices for new cars, eventhough these cars will be smaller. Costs will behigher because the redesign and retooling for adownsized U.S. fleet requires capital spendingat rates significantly higher than the historical
average for American manufacturers. Increasedcapital spending—which, along with the salesslump of 1979-81, shares responsibility for theover $4 billion lost by U.S. automakers during1980–is passed along at least in part to purchas-
ers. To the e xtent tha t com petitive force s a llow ,importers will also raise prices even though theirca pital spend ing rates ma y not have gone up.
Many of the technological roads to improvedfuel economy also carry higher direct manufac-
turing c osts. A fa miliar e xamp le is the diesel en-
gine—which, for comparable performance, canincrease p asseng er ca r fuel eco nomy, and de -crease operating costs, by as much as 25 percent,
but at a substantial penalty in purchase price. Inthis c ase, the higher c osts stem largely from anintrinsically expensive fuel injection system, butalso from the greate r me c hanica l strength a ndbulk required in a diesel engine. Beyond eco-nomic costs and benefits, smaller cars cannot bedesigned to be as safe as larger cars (given bestpractice design in both) –thus, risks of death andinjury in collisions could go up.
For the 10-year period 1968-77, average annualc ap ital investment by the b ig three U.S. autom ak-
ers in constant 1980 dollars was $6.68 billions(AMC and, in later years, Volkswagen of America
add only small amounts to these averages). Overthis period, production fluctuated considerably,but with only a slight upward trend; thus, theaverage expenditure is primarily that for normalredesign and retooling as new models are intro-
duced and existing product lines updated, rather
than fo r inc rea ses in prod uc tion ca pa c ity. Notethat the period 1968-77 includes investments as-sociated with the introductions of several new
sma ll c a rs around 1970 (Pinto, Ma veric k, Vega ),as well as later subc ompa c t d esigns (Chevet te,Om ni/Horizon). The fig ures a lso inc lude oversea sinvestments by the three U.S. firms.
The 2 years with the highest investments dur-ing the 1968-77 period were 1970 ($7.67 billion)and 1977 ($7,78 billion). In 1978, investment roseto $9.21 billion, and in 1979 it reached $10.5 bil-lion (still in 1980 dollars) –half again as much asthe historical level. (See fig. 7.) Estimates of invest-ment for the 5-year period 1980-84 reach close
JThese investment figures were tabulated from annual reports by
R. A. Leone, W. J. Abernathy, S. P. Bradley, and J. A. Hunker, “Reg-ulation and Technological Innovation in the Autombile Industry, ”report to OTA under contract No. 933-3800.0, May 1980, pp. 2-92.Conversions to 1980 dollars are based on the implicit price defla-tor for nonresidential fixed domestic investment.

8/14/2019 Increased Automobile Fuel Efficiency and Synthetic Fuels: Alternatives for Reducing Oil Imports
http://slidepdf.com/reader/full/increased-automobile-fuel-efficiency-and-synthetic-fuels-alternatives-for 112/292
708 q Increased Automobile Fuel Efficiency and Synthetic fuels: Alternatives for Reducing Oil Imports
Figure 7.—Historical Capital Expenditures byU.S. Automobile Manufacturers
SOURCE: G. Kulp, D. B Shonka, and M. C, Holcomb, “Transportation EnergyConservation Data Book: Edition 5,” Oak Ridge National Laboratory,ORNL-5765, November 1981.
to $60 billion.4 5 Such estimates have generallybeen based on fleet redesigns to meet EPCA re-quirements through 1985. While it is doubtful that
Weneral Accounting Office, “Producing More Fuel-Efficient Auto-
mobiles: A Costly Proposition, ” CED-82-14, Jan. 19, 1982.‘Fuel Economy Standards for New Passenger Cars After 1985
(Washington, D. C.: Congressional Budget Office, December 1980),p. 56. Other estimates are generally comparable but may differ asto whether development costs or only fixed investment are included.
they inc lude muc h spe nding for new mod els tobe introduced in the immediate post-1985 period,they do include substantial overseas expenditures
—perhaps one-quarter or more.
The $60 billion estimate represents about $12billion per year in 1980 dollars, nearly double the
historical spending level. It is a clear indicationof the market pressures (for smaller cars as wellas for grea ter fuel ec ono my in vehic les of a ll sizes,including light trucks) being placed on domestic
manufacturers. Component suppliers also facehigher-than-normal investments.
The rema inder of this c hap ter trea ts the fa c torsthat d etermine autom ob ile fuel consump tion inmore detail—both the technological factors andmarket demand—as well as the net savings in fuelconsumption that may accrue from increases inautomobile fuel economy. While consumer pref-erences—as judged by manufacturers in planning
their future product lines–are dominant, technol-og y is vitaI in ma ximizing the fue l eco nom y tha tcan be achieved by cars of given size and weight,
as well as given levels of performance, emissions,and occupant safety.
AUTOMOBILE TECHNOLOGIES
Fuel co nsumed by a n auto mob ile (or truck) de -
pends, first, on the work (or power) expendedto move the vehicle (and its passengers and car-go), and second, on the efficiency with which theenergy contained in the fuel (gasoline, diesel fuel)is c onve rted to work. The p ow er req uirem entsdepend, in essence, on: 1) the driving cycle–the pattern of acceleration, steady-state opera-tion, coasting, and braking–which is affected by
traffic and terrain, but otherwise controlled bythe driver; 2) the weight and rolling resistance ofthe vehicle; and 3) the aerodynamic drag, which
depends on both the size and shape of the vehi-c le and is a lso a func tion of spe ed . The d esignercontrols weight, aerodynamic drag, and to someextent the rolling resistanc e, b ut c an affe c t the
driving cycle only indirectly –e.g., through thepow er output and gea r ratios ava ilab le to thedriver.
The fuel co nsumed in p rod ucing the po wer tomove a vehicle of given size and weight is againa function of vehicle design, primarily engine de-sign. The e ffic iency w ith which the eng ine c on-verts the energy in the fuel to useful work de-pe nds on the type of e ngine a s we ll as its de ta ildesign; diesel engines are more efficient thanspa rk-ignition (ga soline) eng ines, but no t a ll d ieselengines have the same efficiency.
Furthermore, an engine’s efficiency varies withload. For example, when a car is idling at a traf-fic light, the engine’s efficiency is virtually zero

8/14/2019 Increased Automobile Fuel Efficiency and Synthetic Fuels: Alternatives for Reducing Oil Imports
http://slidepdf.com/reader/full/increased-automobile-fuel-efficiency-and-synthetic-fuels-alternatives-for 113/292
Ch. 5—Increased Automobile Fuel Efficiency q 109
because the energy in the fuel is being used onlyto overcome the internal friction of the engineand to power accessories. Engines are more effi-cient at relatively high loads (accelerating, driv-ing fast, or climbing hills), but such operation will
still use fuel at a high rate simply because thepower demands are high–hence the justification
for the 55-mph speed limit as an energy-conserva-tion measure.
Effic iency–the frac tion of t he fuel ene rgy thatcan be converted to useful work—cannot be 100
percent in a heat engine for both theoretical and
prac tica l rea sons. For a typica l autom ob ile e n-gine, peak efficiency may exceed 30 percent, but
this is attained for only a single combination ofload and speed. Average efficiencies, character-istic of normal driving, may be only 12 or 13 per-
cent, even lower under cold-start and warmupoperation. To illustrate this point, figure 8 shows
energy losses for the drivetrain in one 1977 mod-el car in the Environmental Protection Agency’s
(EPA) urba n c yc le. This figure should no t be ta ken
too literally because losses vary considerably from
c ar to c ar and numerous de sign cha nge s havebeen implemented since 1977, but the figuredoes serve to illustrate approximate magnitudes.
The d esign o f the eng ine a ffects the a mount o ffuel consumed during the driving cycle in two
basic ways. First, the size of the engine fixes itsma ximum po we r output. In ge neral, a sma ller en-gine in a car of given size and weight will givebetter fuel economy, mainly because the smallerengine will, on the average, be operating moreheavily loaded, hence in a more efficient part of
its range, There are practical limits to enginedownsizing, however, because a heavily loaded,
underpowered engine provides poor perform-ance and can suffer poor durability.
Sec ond , the d esigner can d irec tly affect driving-cycle fuel economy through the transmission and
axle interposed between the engine and wheels.Significant gains in fuel economy over the pastfew yea rs have c om e from d ec rea ses in rea r axle
Figure 8.—Fuel Use in City Portion of EPA Fuel’ Efficiency Test Cycle (2,750 lb/2.3 liter)
Alternator
Fan0.7%
Coolant42.3%
0.5%
m
Exhaustr 22%
/Friction
1 1 2 . 2 %
I
Heat a x l e0.8%
P o w e rsteering 1
“ “ ” ”
Delivered to wheels11.5%0
SOURCE Serge Gratch, Ford Motor Co., prwate communication, 1982.

8/14/2019 Increased Automobile Fuel Efficiency and Synthetic Fuels: Alternatives for Reducing Oil Imports
http://slidepdf.com/reader/full/increased-automobile-fuel-efficiency-and-synthetic-fuels-alternatives-for 114/292
110 . Increased Automobile Fuel Efficiency and Synthetic Fuels: Alternatives for Reducing Oil Imports
ratios* so that engines are operating at higher effi-
ciencies during highway operation, and fromchanges in transmission ratios** to better matchdriving needs to engine efficiency (in earlier yearstransmission ratios were often chosen to maxi-mize performance rather than fuel economy).Adding more speeds to the transmission—wheth-
er manual or automatic—serves the same objec-tive. The op timum w ould b e a c ontinuously va ri-able, stepless transmission allowing the engineto operate at all times at high loads where its ef-ficiency is greatest. (Such transmissions can bebuilt tod ay, but require further develop ment fo rwidesprea d use in ca rs.)
Changes in many other areas of automobile de-sign can help increase fuel economy, but the pri-
mary factors are size (which is one of the fac-tors that determines aerodynamic drag), weight(which determines the power needed for acceler-
ation, as well as rolling resistance), and power-train characteristics (engine plus transmission).These a re d isc ussed in mo re d eta il below , in thecontext of the driving cycle—itself a critical vari-ab le in fuel ec onom y—followed by brief d isc us-sions of emissions and safety tradeoffs, methanol-fueled vehic les, and elec tric vehic les (EVs).
Vehicle Size and Weight
On a sa les-averaged basis, the inertia w eightof cars sold in the United States during 1976 (in-cluding imports) came to slightly over 4,000 lb. 6
This c orrespond s to a n averag e c urb we ight***of 3,700 to 3,800 lb. The averag e inertia we ightfor 1981 is expected to be about 3,100 lb, andmay further decrease to around 2,750 lb by 1985.
Although the lightest cars sold here still have iner-tia weights close to 2,000 lb–as they did in 1975 —the distribution has shifted markedly toward thelower end of the range. Ma ny heavier mod els
*Rear axle ratio is the ratio of the drive shaft speed to the axlespeed.
**Transmission ratio is the ratio of the engine crankshaft speedto the drive shaft speed.
6J. A. Foster, j. D. Murrell, and S. L. Loos, “Light Duty Automo-
tive Fuel Economy . . . Trends Through 1981 ,“ Society of Automo-tive Engineers Paper 810386, February 1981. Inertia weight is a representative loaded weight—equal to curb weight, which includesfuel but not passengers or luggage, plus about 300 lb–used by EPAfor fuel economy testing.
***Curb weight is the weight of the car with no passengers orcargo.
have disappeared; consumers are now selectingsmaller and lighter vehicles—downsized or newlydesigned U.S. models as well as imports.
While size is a primary d ete rminant o f weight ,newer designs typically make greater use of light-we ight m aterials suc h a s plastics and aluminum
alloys, as well as substituting higher strengthsteels—in thinner sections—for the traditionalsteels. Materials substitution for weight reductionwill continue, but is constrained by the higherc osts of materials with b etter streng th-to-weightor stiffness-to-weight ratios. As production vol-umes go up, costs of at least some of these mate-rials will tend to decline.
Weight is a fundamental factor in fuel econ-omy because much of the work, hence energy,need ed fo r a typ ica l driving c ycle is expend edin a c c elerat ing the ve hic le. The fue l co nsumedin stop-and-go driving is directly related to theloaded weight of the car (including passengersand payload) and the inertia of its rotating parts.Everything else being the same, it takes twice asmuc h energy to a c c elerate a 4,000-Ib c ar as a2,000-lb c a r ove r the same spe ed range. Urbandriving, in particular, consists largely of repeated
accelerations and decelerations; thus, weight iscritical to fuel consumption. (This also points upthe potential that smoothing flows of traffic of-fers for gasoline savings.) Lighter cars consumeless fuel even at constant speeds because theyhave less rolling resistance.
Although the weights of cars can be reducedby m aking them from lightw eight ma terials andby shifting from separate body and frame designs
to unitized construction, cars can always be made
lighter by making them smaller.
Small cars can also have lower aerodynamicdrag, because drag depends on frontal area aswell as on the shape of the vehicle. Drag can bereduced by making cars lower and narrower, aswe ll as by streamlining the vehic le. Drag red uc -tion ha s bec om e a t least a s important a s stylingin rec ent yea rs; working p rima rily with wind tun-
nel data , automakers have reduc ed typica l dragcoefficients* from 0.5 to 0.6, characteristic of the
*The drag coefficient is a measure of how aerodynamically “slip-pery” the car is. The aerodynamic drag is proportional to the dragcoefficient, the frontal area and the velocity squared.
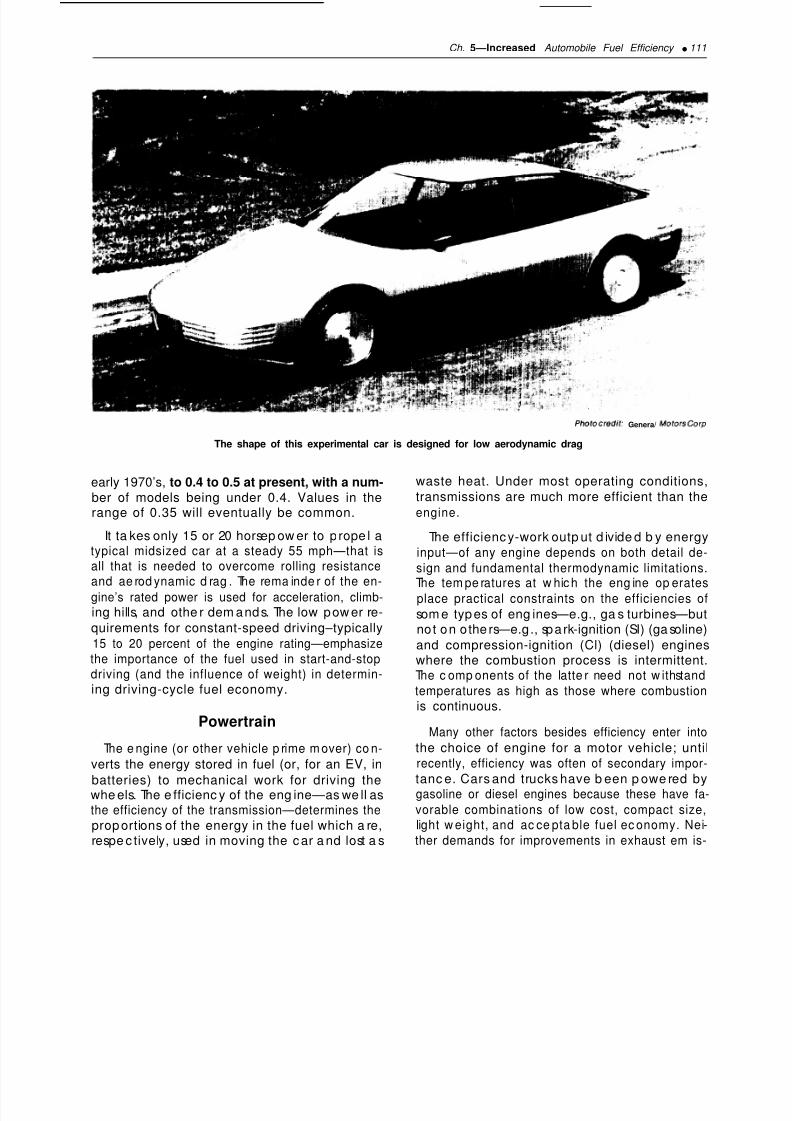
8/14/2019 Increased Automobile Fuel Efficiency and Synthetic Fuels: Alternatives for Reducing Oil Imports
http://slidepdf.com/reader/full/increased-automobile-fuel-efficiency-and-synthetic-fuels-alternatives-for 115/292
Ch. 5—Increased Automobile Fuel Efficiency q 111
Photo credit Genera/ Motors Corp
The shape of this experimental car is designed for low aerodynamic drag
early 1970’s, to 0.4 to 0.5 at present, with a num-ber of models being under 0.4. Values in therange of 0.35 will eventually be common.
It ta kes only 15 or 20 horsep ow er to p rope l atypical midsized car at a steady 55 mph—that isall that is needed to overcome rolling resistanceand ae rod ynamic d rag . The rema inde r of the en-
gine’s rated power is used for acceleration, climb-ing hills, and othe r dem ands. The low pow er re-quirements for constant-speed driving–typically15 to 20 percent of the engine rating—emphasizethe importance of the fuel used in start-and-stopdriving (and the influence of weight) in determin-ing driving-cycle fuel economy.
Powertrain
The e ngine (or other vehicle p rime m over) co n-
verts the energy stored in fuel (or, for an EV, in
batteries) to mechanical work for driving thewhe els. The e fficienc y of the eng ine—as we ll asthe efficiency of the transmission—determines theprop ortions of the energy in the fuel which a re,respe c tively, used in moving the c ar a nd lost a s
waste heat. Under most operating conditions,transmissions are much more efficient than theengine.
The efficienc y-work outp ut d ivide d b y energyinput—of any engine depends on both detail de-sign and fundamental thermodynamic limitations.
The tem pe ratures at w hic h the eng ine op eratesplace practical constraints on the efficiencies of
som e typ es of eng ines—e.g., ga s turbines—butnot on othe rs—e.g., spark-ignition (SI) (ga soline)and compression-ignition (Cl) (diesel) engineswhere the combustion process is intermittent.The c omp onents of the latte r need not w ithstandtemperatures as high as those where combustionis continuous.
Many other factors besides efficiency enter into
the choice of engine for a motor vehicle; untilrecently, efficiency was often of secondary impor-
tanc e. Cars and trucks have b een p owe red bygasoline or diesel engines because these have fa-
vorable combinations of low cost, compact size,light w eight, and ac ce pta ble fuel ec onomy. Nei-ther demands for improvements in exhaust em is-

8/14/2019 Increased Automobile Fuel Efficiency and Synthetic Fuels: Alternatives for Reducing Oil Imports
http://slidepdf.com/reader/full/increased-automobile-fuel-efficiency-and-synthetic-fuels-alternatives-for 116/292
112 q Increased Automobile Fuel Efficiency and Synthetic Fuels: Alternatives for Reducing Oil Imports
sions nor for better fuel economy have yet re-sulted in serious challenge to these engines—which have been dominant for 70 years. At leastthrough the end of the century, most passengerc ars are likely to b e p ow ered b y rec iproc ating SIor diesel engines.
SI and Cl or diesel eng ines have p ea k efficien-c ies ge nerally in the range of 30 to 40 percent.However, their efficiency at part-load can bemuch less; the farther the engine operates fromthe load and speed for which its efficiency isgreatest, the lower the e ffic iency. In typ ica l ur-ban driving, the average operating efficiency isless than one-third of the peak value–e.g., in therange of 10 to 15 percent.
Part-load fuel economy remains a more criticalvariable for an automobile engine than maximum
efficiency because of the light loading typical of
most driving. Such a requirement favors Cl en-gines, for example, but works against gas tur-bines. Cl engines have good part-load efficiency
because they operate unthrottled, thereby avoid-ing pumping losses. They also have high com-pression ratios–which, up to a point, raises effi-ciency under all operating conditions.
Various modifications to SI engines can in-crease part-load efficiencies. This is one of theadvantages of stratified-charge engines—which
use a heterogeneous fuel-air mixture to allowoverall lean operation, ideally without throttlingas in a diesel—and also of SI engines that burnalternative fuels such as alcohol or hydrogen.Sma ller, more hea vily loa ded SI engines also tendto have greater driving-cycle fuel economy be-
cause the higher loads mean the engine is run-ning with less throttling. Among the steps that can
be and are being taken to give greater fuel econ-
omy are:
q
q
q
q
using the highest compression ratio consist-
ent with available fuels;refined combustion chamber designs, partic-
ularly those optimized for rapid burning oflean mixtures, one of the routes to higher
compression ratios;minimizing engine friction;optimizing spark timing consistent with emis-
sions control;
q
q
q
minimizing exhaust gas recirculation consist-ent with emissions control;precise control of fuel-air ratio, both overall
and c ylinde r-to-cylinde r, p artic ularly und ertransient c ond itions suc h a s c old sta rts andacceleration—again consistent with emis-sions control; andminimizing heat losses.
Transmission e ffic ienc ies also dep end on load ,
but m uc h less so tha n eng ines; transmission e ffi-ciencies are also much higher in absolute terms.For manual transmissions, more than 90 percentof the input p ow er rea c hes the o utput shaft e x-cept at quite low loads. Because they have moresource s of losses, autom a tic transmissions are lessefficient, particularly those without a lockuptorque converter or split-path feature. In theseolder transmissions, all the power passes throughthe to rque c onverter, even a t highwa y c ruisingspe ed s. The resulting fue l-ec onomy pena lty, com-pared with a properly utilized manual transmis-sion, is typically in the range of 10 to 15 percent.By avoiding the losses from converter slippageat higher speeds, split-path or lockup designs cutthis fuel-economy penalty approximately in half,four-speed transmissions offering greater im-provement than those with only three forwardgears.
One function of the transmission is to keep theeng ine op erating w here it is rea sona bly efficient.Although automatic transmissions are less effi-
cient than manual designs, they can sometimesincrease overall vehicle efficiency by being“smarter” than the driver in shifting gears. Fur-ther benefits are promised by improved electron-ic control systems for automatics. These micro-processor-based systems can sense a greaternumber of operating parameters, and are thusable to use more complex logic, perhaps in con-
junction with an engine performance map storedin memo ry. Suc h c ontrol system s c ould a lso beused with m anua l transmissions—e.g., to tell thedriver when to shift. A continuously variabletransmission would be better still. As mentionedabove, these can be built now, but they have notbeen practical because of problems such as high
ma nufac turing c ost, low e ffic ienc y, noise, a ndlimited torque capacity and durability.

8/14/2019 Increased Automobile Fuel Efficiency and Synthetic Fuels: Alternatives for Reducing Oil Imports
http://slidepdf.com/reader/full/increased-automobile-fuel-efficiency-and-synthetic-fuels-alternatives-for 117/292
Ch. 5—increased Automobile Fuel Efficiency q 113
Fuel Economy—A Systems Problem
An automobile is a complex system; design im-provements at many points can improve fueleconomy. Even if each incremental improvement
is sma ll, the c umulative effec t c an b e a big in-c rea se in milea ge . Interac tions am ong the e le-me nts of the system (engine, transmission, vehi-cle weight) and the intended use of the vehicleare among the keys to greater system efficiency.At the same time, as the state of the art improves,further increases in efficiency tend to becomemo re d iffic ult unless there are d ram atic tec hnic al
breakthroughs–and OTA thinks such break-throughs a re improb able. This is a ma ture te c h-nology in which, as a general rule, radicalchanges are few and far between.
Ma king c a rs sma ller and ligh ter helps in ma nywa ys to red uce the p owe r neede d, hence fuel
c onsume d. Front-wheel d rive p reserves inte riorspace while allowing exterior size and weight tobe reduced. Reductions in the weight of the body
structure mean that a smaller engine will giveequivalent performance, while also allowing light-er chassis and suspension members, smaller tiresand brakes, and related secondary weight sav-ings. Among other steps taken in recent yearshave been the adoption of thinner, hence lighter,window glass—and even redesigned window liftmechanisms.
Once ma jor dec isions have b een ma de co n-
cerning overall vehicle design parameters—size,engine type, etc.—subsystem refinement and sys-tems integration become the determining factorsin the fuel economy achieved in everyday driv-ing. Some of these refinements decrease the need
for power, as by reducing friction or making ac-cessories more efficient; others increase the effi-ciency of energy conversion, as by using three-way exhaust catalysts and feedback control of the
fuel-air ratio to limit emissions while preservingfuel economy.
Tradeoffs With Safety and Emissions
Go vernment p olic ies to increa se a utomob ilefuel efficiency, reduce pollutant emission levels,and improve passenger safety involve significant
tradeoffs. Measures to control auto emissions can
impair fuel efficiency. Reducing the size of carsto increase fuel economy makes them intrinsically
less safe. Meeting regulatory goals also affectsma nufac turing costs. Tradeo ffs like these have not
always been fuIly recognized in the formulationof Federal policy,7 but w ill c ontinue to be impor-
tant as policy makers focus on questions of post-1985 fuel economy.
The issues inc lude whe ther Governme nt po li-cies are to be directed at further improvementsin mileag e, such as by a c ontinued inc rea se inCAFE standards, or by a gasoline tax, and whether
emissions standards are to be tightened or re-laxed. The tradeoffs will involve manufacturingcosts, as always—but the relationship of fueleconomy to safety will perhaps be most critical.
Safety
The tradeoffs betwe en fuel economy a nd o cc u-pant safety are largely functions of vehicle size—therefore of weight as well. Although many char-acteristics of the car are important for occupant
safety, protection in serious collisions dependsquite substantially on the crush space in the vehi-cle structure and on the room available withinthe passenger compartment for deceleration.Penetration resistance is also vital. Design re-quirements are based on a “first collision” be-tween vehicle and obstacle, and a “second colli-
sion” between occupants and vehicle. In the“ first c ollision,” the more space available for the
struc ture to c rush—without enc roa c hing on thepassenger compartment-the slower the averagerate of deceleration that the passenger compart-ment and the passengers experience. More crush
space translates directly to lower decelerations.
Space, hence vehicle size, is also importantwithin the pa sseng er com pa rtment . The mo respace available inside, the easier it is to preservethe basic integrity of the structure and the slower
the occupants can be decelerated during the“ sec ond c ollision. ” Sea tb elts, for examp le, c anstretch to lower the decelerations the restrained
occupants experience, but only if there is nothing7 U.S. Industrial Competitiveness. A Comparison of Steel Elec-
tronics, and Automobiles, OTA-ISC-135 (Washington, D. C.: U.S.Congress, Office of Technology Assessment, June 1981), pp.120-122.

8/14/2019 Increased Automobile Fuel Efficiency and Synthetic Fuels: Alternatives for Reducing Oil Imports
http://slidepdf.com/reader/full/increased-automobile-fuel-efficiency-and-synthetic-fuels-alternatives-for 118/292
114 . Increased Automobile Fuel Efficiency and Synthetic Fuels: Alternatives for Reducing Oil Imports
rigid for the occupants to hit; deformable anchors
for seatbelts are thus a further method for improv-ing safety.
Because of their larger crush space and interiorvolume, big ca rs c an always provide more pro-tection for their occupants in a collision—given
best practice design. How eve r, not a ll c ars em-body best practice designs, and the crashworthi-ness of autos in the current fleet does not improve
uniformly a nd p red icta b ly with vehic le size. Fur-thermore, vehicle safety depends on avoidingcrashes as well as surviving them, and thereforeon fa c tors such as braking and hand ling as wellas driver a b ility. These a nd othe r fac tors relatedto the potential effects on auto safety of increas-ing fuel efficiency are discussed in chapter 10.
Emissions Control
Fairly direct tradeoffs exist between engine effi-ciency and several of the measures that can beused to control the constituents of exhaust gasesthat c ontribute to air pollution. The three ma jorcontributors in the exhaust of gasoline-fueled ve-hic les, all reg ulated by the Clean A ir Ac t a nd itsamendments, are hydrocarbons (HC), carbonmonoxide (CO), and nitrogen oxides (NO X).8Emissions control measures have frequentlyworked against the fuel economy of cars sold in
the United Sta tes since 1968, when manufac tur-ers be ga n to reta rd spa rk timing to red uce HCemissions. Although the costs of emissions con-
trol measures—as reflected in the purchase priceof the vehicle—have often been disputed and re-main controversial, there have also been operat-ing cost penalties because fuel economy has been
less than it would otherwise have been.
Mileage penalties were more severe in the mid-
1970’s than at present, but efficiency increaseshave c ome a t the expense o f higher first c ost.Ground is periodically lost and regained, buteven with best prac tic e tec hnology a t any giventime, the engineering problems of balancingemissions and fuel economy at reasonable cost
have forced many compromises. One recent esti-mate of the net effect of emissions control
through 1981 finds a 7.5-percent fuel-economypenalty. 9
“ The single cha nge with the grea test co ntinuingeffect has been reduced compression ratios re-sulting from the changeover to unleaded gaso-line. Cl engines require high compression ratios;
SI engines, in contrast, suffer from a form of com-bustion instability termed detonation (i.e., the en-gine “knocks”) if the compression ratio is toohigh for the o c ta ne rat ing of the fuel. Thus, de-c reases in the a lrea dy low er com pression ratiosof SI engines—to values in the range of 8:1 ver-sus ratios as high as 10:1 in the early 1970’s—haveled to signific ant de c rea ses in fuel ec onom y.
Lead compounds, formerly added to gasolineto raise the octane, have been removed to pre-vent poisoning (deactivation) of catalytic convert-
ers—themselves adopted to control, first, HC and
CO, and later NO Xas we ll–and also b ec ause o fconcern over the health effects of lead com-pounds. While electronic engine control systems,including knock d etec tors, have a llowed co m-pression ratios to be increa sed som ew hat, onlya p ortion of the g round lost c an b e rega ined inthis way.
Methano l with c osolvents c an be used as anoc tane-boo sting a dd itive to ga soline that do esnot interfere with the catalytic converter. In addi-tion, compact, fast-burn combustion chambersma y help. By burning the fuel fa st e nough thatthe preflame reactions leading to detonation donot have time to occur, fast-burn combustion sys-tems might allow compression ratios to be in-c reased by seve ral po ints. This latte r ap proac h,however, increases HC and NO Xemissions, andit is not yet clear how much compression ratioscan be raised while maintaining emissions withinprescribed limits.
Related measures used to control emissions—and/or to limit detonation—can also degrade en-gine efficiency. Retarding ignition timing—to limitde tona tion, and in some c ases help c ontrol HCand CO emissions by promoting complete com-
bustion of the fuel–hurts fuel economy. Othertec hnique s ad op ted in the ea rly 1970’ s to c on-
6D. j. Patterson and N. A. Henein, Emissions From Combustion
Engin es and Their Co ntrol (Ann Arbor, Mich.: Ann Arbor SciencePublishers, 1972).
‘L. B. Lave, “Conflicting Objectives in Regulating the Automo-bile,” Science, May 22, 1981, p. 893.

8/14/2019 Increased Automobile Fuel Efficiency and Synthetic Fuels: Alternatives for Reducing Oil Imports
http://slidepdf.com/reader/full/increased-automobile-fuel-efficiency-and-synthetic-fuels-alternatives-for 119/292
Ch. 5—Increased Automobile Fuel Efficiency 115
trol HC and CO—such as thermal reactors, whichwe re likewise intend ed to drive the c ombustionprocess toward complete reaction of HC and CO —also led to increased fuel consumption.
Unfortunately, while more c omplete c ombus-tion decreases HC and CO pollutants, NO X in the
exhaust is increased under conditions leading tomore c om plete c omb ustion. Thus, not o nly do es
control of exhaust emissions conflict with fueleconomy, but there are also potential conflictsbetween control of HC and CO on the one hand,and NOXon the other. The NO Xstandards of themid-1 970’s could be met by adding exhaust gasrecircuIation (EGR) to the repertoire of measures
used for HC and CO control. Although EGR ini-tially carried a substantial fuel economy penalty,
and also impaired driveability, improved controlsystems—which recirculate exhaust only whenneeded—have improved both economy and
driveability substantially. Still, the drawbacks ofother methods of NO Xcontrol, * together withthe more stringent NO Xsta ndards of late r years,have led to the most common current controltec hnique—the three-wa y c ata lytic c onverter,which reduces levels of all three pollutants. Thisgives fuel economy comparable to an uncon-trolled engine, though at higher first cost.
Compression ratios of diesel engines are oftentwice those for SI engines; at these high levelssmall changes in compression ratio have relativelylittle effect on efficiency. For this reason and be-
cause of the different set of emissions standardsapplied, Cl engines have faced fewer conflicts be-
twee n em issions c ont rol and fuel ec ono my. Thisad vantag e has helped them to c omp ete with SIengines for passenger cars, although the situation
ma y c hang e in the future, as the diesel stand ardsbecome tougher. Particulate (bits of unburned,charred fuel) are the most difficult of diesel emis-sions to control, although NO Xalso poses prob-lems. However, future regulations for particulatein diesel exhaust a re not yet definite. This c reate s
uncertainty not only abo ut the c ontrol tec hnol-ogies that might be needed, but also about the
*It should be noted, however, that burning a very lean fuel/airmixture also reduces NOX emissions substantially. Because metha-nol has considerably wider flammability limits than does gasoline,the use of methanol opens new opportunities for controlling NOX.
future penetration of Cl engines in passengervehicles.
Nonetheless, as will be seen below, OTA re-mains cautiously optimistic about diesels. Theirhigher intrinsic efficiency at both full- and part-Ioad makes them quite attractive in terms of fuel
economy, and there is considerable scope for fur-ther improvements in their driveability and re-lated characteristics that are more important forpassenger cars than for trucks and other uses inwhich diesels have be en m ore c ommo n. Thelong developmental history of Cl engines pro-vides a useful foundation for passenger-car appli-
cations.
Methanol-Fueled Engines
There are basically two routes to higher SI en-gine efficiency via alternate fuels: lean operation,
which c uts pump ing a nd other thermod ynamiclosses, and higher compression ratio.10 Fuels varyin the extent to which these factors operate and
there are a number of secondary effects, but alco-
hols and hydrogen ha ve excellent p ote ntial forboth lean burning and higher compression ratios,with possible driving-cycle economy improve-ments in the range of 10 to 20 percent. Furtherengineering development—but no breakthroughs —would be needed before alcohols or other alter-nate fuels could be used in U.S. cars, but the pro-duction and distribution of such fuels are moresignificant barriers.
Diesels, like SI engines, can operate on a variety
of alternative fuels, althoug h p erhap s need ingspark-assisted combustion. Powerplants such asopen-chamber stratified-charge engines and con-
tinuous c ombustion engines c an often toleratequite broad ranges of fuels with minimal designchanges.
Bec ause m etha nol from c oa l is an a ttrac tivesynthetic fuel, methanol-burning engines for pas-seng er ca rs a re disc ussed in more d eta il below .Unlike ethanol, which will probably be used pri-ma rily as a ga soline extend er (e.g., in ga soho l),
10J. A. Alic, “Lean-Burning Spark Ignition Engines–An Overwew,”
Proceedings, 2nd Annual UMR-MECConferenc e on Energy, Rolla,
Me., Oct. 7-9, 1975, p . 143.

8/14/2019 Increased Automobile Fuel Efficiency and Synthetic Fuels: Alternatives for Reducing Oil Imports
http://slidepdf.com/reader/full/increased-automobile-fuel-efficiency-and-synthetic-fuels-alternatives-for 120/292
sufficient quantities of methanol could be pro-duced to consider using it as the only or principalfuel for some automobiles.
If methanol-fueled engines receive intensive de-
velopment aimed at maximizing fuel economyand driveability, driving-cycle fuel-efficiency im-provements (on a Btu basis) of 20 percent or more
should be possible, compared with a well-devel-op ed but otherwise c onventional SI engine burn-ing gasoline. Most of the improvement stems from
the higher octane rating of methanol, whichwo uld permit co mp ression rat ios in the rang e o f11 or 12:1—perhaps even higher, depending on
whether preignition is a serious limiting factor—aswell as the somewhat leaner air-fuel ratios pos-sible.
The enginee ring of vehic les to run on methanol
—or other alchohols—is rather straightforward.11
Indeed, a good deal of experience has already
been accumulated. Despite the greater efficien-cy possible with methanol, vehicles fueled with
11’’CH30H: Fuel of the Future?” Automot ive Eng ineer ing ,
December 1977, p. 48.
it probably will require larger fuel tanks to achieveacceptable cruising ranges, because methanolhas significantly less energy per gallon than gaso-line or diesel fuel. Methanol corrodes some ofthe materials commonly used in gasoline-fuel sys-tems, which m ust b e replac ed by m ore c orrosion-resistant components.
Bec ause a lcoho ls have muc h higher heats ofvaporization than gasoline and therefore do notvaporize as easily, alcohol-fueled engines aremore difficult to start in cold weather. Driveabilityduring warmup also tends to be poor. Fuel injec-tion is one a pp roa c h to m itiga ting such diffic ul-ties. Another solution is to start and warm up the
eng ine on a d ifferent fuel. In Brazil, where ma nycars and trucks run on 100 percent ethanol, en-gines are typically started on gasoline via an aux-iliary fuel system . A low er c ost a lternative m ightbe to b lend in a sma ll frac tion–5 to 10 pe rc ent–of a hydrocarbon to aid in starting and warmup.
Fuel b lends could b e tailored sea sona lly just a sgasolines are.
Metha nol also offers ad vanta ge s in red ucingheat losses and thus raising fuel efficiency. Al-

8/14/2019 Increased Automobile Fuel Efficiency and Synthetic Fuels: Alternatives for Reducing Oil Imports
http://slidepdf.com/reader/full/increased-automobile-fuel-efficiency-and-synthetic-fuels-alternatives-for 121/292
Ch. 5—Increased Automobile Fuel Efficiency q 117
though its high specific heat and high heat ofvaporization can cause starting and warmupproblems, these characteristics also mean that thefuel can, in principle, be used to help control in-ternal engine temperatures and heat flows so asto reduc e he a t losses.
Test programs with alcohol fuels have some-times shown abnormally high engine wear—par-ticularly piston ring and bore wear. While thecauses have not yet been fully determined, corro-
sion, perhaps associated with wall-washing andcrankcase dilution during cold-start, are possible
contributing factors.12 If this is the case, solvingthe cold-start and warmup difficulties would alsobe expected to cut down on wear. Oil additive
packages specially tailored for alcohols shouldbe a further help.
Emissions from methanol-burning automobiles
can be controlled with many of the same technol-
ogies used for gasoline engines. However, be-cause of the differing fuel chemistries, standardsdeveloped for gasoline-burning vehicles are notnecessarily appropriate for alcohols. Aldehydes,for exam ple, may need to b e c ontrolled .
Battery-Electric and Hybrid Vehicles
The a utomob ile p ow erplants c onside red byOTA for inc rea sed fuel effic ienc y are all hea t en-gines–i.e., they c onvert the energy (he at) pro-duced when a fuel burns into mechanical work.Passenger cars can also be powered from energystored in forms other than fuel—e.g., by mechan-ical energy drawn from a spinning flywheel.Amo ng the se a lternative storag e me dia a re re-chargeable batteries that convert chemical energy
into e lec tric al energy. The e lectric energy c anthen drive a direct current (DC) (or sometimes,through an inverter, an alternating current (AC))motor. Many of the first automobiles built, aroundthe turn of the century, used battery-electric pow-
er.
In an extension of the battery-electric concept
—c alled a hybrid—a c onventiona l hea t engine
12T. w. RYan, III, D. w. Naegeli, E. C. OWens, H. w. MarbaChtand J, G. Barbee, “The Mechanism Lending to Increased CylinderBore and Ring Wear in Methanol-Fueled S.1. Engines, ” Society ofAutomotive Engineers Paper 811200, 1981.
drives a generator (or alternator) which can thensupply power to an electric motor directly, charge
batteries, or both–depending on the instantane-ous nee ds of the d riving c yc le. A pa rallel hybridis de signed so the hea t eng ine c an a lso p owerthe whe els direc tly, throug h a transmission (theengine turns the generator and the drive wheels
in parallel). A series hybrid, in contrast, has nodirect mechanical connection between heat en-gine and drive wheels. Diesel-electric submarines
provide examples of both series and parallelhybrid powertrains, but automobiles have neverbe en ma ss prod uc ed w ith either arrang ement.
Whether or not a battery-electric or hybridautomobile would have an overall energy conver-
sion efficiency greater or less than a more con-ventional SI- or Cl-powe red ca r dep ends on many
variables, including the sources of the electrici-ty used to charge the batteries. In the context of
this report, the potential of battery-electric or hy-brid vehicles as substitutes for petroleum-basedfuels is more important than the net energy con-
version efficiency. If the electricity for chargingthe batteries comes from a coal or nuclear gener-ating plant—or any other nonpetroleum energysource—widespread sales of such cars could helpc onserve liquid pe troleum.
At p resent, how ever, the limitations of p rac tic al
electric and hybrid vehicles far outweigh any ad-vantages that might be gained from their petro-leum-displacing effects.
13Battery-electric cars will
have very limited applications until the perform-ance of batteries (as measured, for example, bythe q uantity of energy tha t c an b e stored p er unit
of battery weight), increases roughly fivefold—or unless petroleum availability declines muchmo re rap idly tha n now expec ted . Hybrids sharemany of the disadvantages of battery-electric cars
and—although they offer theoretically promising
energy conversion efficiencies—are dependenton fuels. Their current prospects are even dim-me r than for ba ttery-elect rics, in large pa rt b e-c ause hyb rid vehicles wo uld be expensive a ndc omplex—the d uplic ation in the p owertrain is a
formidable cost barrier.
13R. L, Graves, C. D, West, and E. C. Fox, “The Electric car—is
It Still the Vehicle of the Future, ” Oak Ridge National LaboratoryReport ORNLITM-7904, August 1981.

8/14/2019 Increased Automobile Fuel Efficiency and Synthetic Fuels: Alternatives for Reducing Oil Imports
http://slidepdf.com/reader/full/increased-automobile-fuel-efficiency-and-synthetic-fuels-alternatives-for 122/292
118 q Increased Automobile Fuel Efficiency and Synthetic Fuels: Alternatives for Reducing Oil Imports
Despite the widespread publicity given to bat-tery-electric automobiles over the past 20 years—most recently, the attention garnered by GeneralMotors’ announcement of production plans forthe mid-1980’s—progress in EVs remains severelylimited by b at tery pe rforma nc e. This is true bothfor battery systems that are available now and for
those that appear to have possibilities for near-term p rod uct ion. Power and energy d ensities ofava ilable ba tteries rema in too low for pract icaluse in other than highly specialized automotiveap plic ations. Power density (wa tt p er pound orW/lb) measures the rate at which the battery can
supply energy. Energy density (watt hours perpo und o r Whr/ lb) me asures the to tal amount ofenergy that c an b e stored and then withdrawnfrom the battery. For some battery systems, to getall the energy out requires a slow rate of with-drawal, limiting the instantaneous delivery ofpower. Because of the transient demands of auto-
motive driving cycles, power density is almost asimportant for vehicle applications as energy den-sity, which determines the operating range beforethe batteries need to be recharged.
In general, battery systems that are near-term
candidates for automotive applications sufferfrom both low power density and low energydensity. Tab le 20, which include s seve ral ba tteries
that are still in rather early stages of development,gives typical values. Energy and power densitytend to b e inversely related , a p artic ular prob lemfor the familiar lead-acid battery; the inverse rela-
tion means that—for any given battery system—the d esigne r ca n c hoose higher energy d ensityonly at the sacrifice of power density. Limitedpower density restricts the acceleration capabil-ities of current EVs to low levels—for some driv-ing c ond itions, to the d etrime nt of sa fety. The e n-
Photo credit: Electric Vehicle Council
A view of the battew-pack configuration in ademonstration electric vehicle
ergy d ensity, in co ntrast, limits the to ta l amountof energy that can be carried, therefore, the range
of the vehicle before the batteries must be re-charged. Recharging is a time-consuming proc-
ess—as much as 10 hours for some, though notall, batteries. If power density and energy densi-
ty are low, then the vehicle must carry more bat-teries. This makes it heavier, increasing the de-mands for power and energy and compounding
the design problems.
As a rule-of-thumb, and assuming reasonable
costs, an energy density in the vicinity of 100
Table 20.-Potential Battery Systems for Electric (and Hybrid) Vehicles
Energy density Power densityBattery (Whr/lb) (W/lb) Status
Lead-acid . . . . . . . . . 15-20 5-20 AvailableNickel-zinc . . . . . . . . 30-40 40-80 Available, but expensiveZinc-chlorine . . . . . . ~ 3 5 ~ 5 0 Experimental; potentially inexpensiveAluminum-air . . . . . . 100-200 ~ 8 0 Experimental; cannot be electrically
recharged (requires periodicadditions of water and aluminum)
Sodium-sulfur. . . . . . ~100 ~100 Prospective; high-temperature;potentially inexpensive
SOURCE: Office of Technology Assessment.

8/14/2019 Increased Automobile Fuel Efficiency and Synthetic Fuels: Alternatives for Reducing Oil Imports
http://slidepdf.com/reader/full/increased-automobile-fuel-efficiency-and-synthetic-fuels-alternatives-for 123/292
Ch. 5—increased Automobile Fuel Efficiency q 11 9
Whr/lb, along with a power density of about 100W/lb, wo uld suffic e for a p rac tica l general-pur-pose vehicle. With these characteristics, 400 lbof batteries would give about 100 miles of travel
between battery recharging and produce about
55 horsepower. Urban or commuter cars mightget by with somewhat lower figures. Table 20shows that currently available battery systemseither cannot achieve such figures, or—as withnickel-zinc batteries-are too expensive for wide-spread use.
Battery-electric cars–often production vehicles
converted by replacing the engine and fuel sys-tem with an electric motor and lead-acid batteries(like the storage batteries used in golf carts) -have
been built in prototype or limited-productionform for years. At present, a four-passenger elec-tric car with lead-acid batteries would weighab out twice a s muc h as a c onventionally pow -ered ca r, cost twice a s much, and have a rangeof less tha n 50 miles befo re rec ha rging . The bat -tery pac k alone would w eigh 1,000 lb or more,
and would have to be replaced several times dur-ing the life of the vehicle, adding to the operating
costs.
In addition to the nickel-zinc batteries men-tioned above, there are a number of other candi-
date battery systems for EVs–of which table 20includes three as examples—the zinc-chlorine,a luminum -air, and sod ium-sulfur ba tte ries. Theseshare the advantage of relatively inexpensive raw
materials, but have other drawbacks: for exam-ple, the zinc- chlorine battery has low energydensity; the aluminum-air system is “recharged,”not by an inward flow of electricity, but bymechanical replacement of materials (in consum-
ing materials to produce electricity the aluminum-
air battery is like a fuel cell, but fuel cells arecontinuous-flow devices); the sodium-sulfur bat-tery operates at temperatures greater than 5000F. All of these batteries are experimental, andnone has been developed as rapidly as oncehoped; the same is true of many other candidate
battery systems with theoretically attractive char-acteristics for EVs and/or hybrid vehicles.14
Not only are battery-electric cars severely lim-ited in range and performance by the energy and
po we r densities of a vailab le ba tteries, but pro-duc tion c osts wo uld a lso b e high, a t lea st initial-
ly. A further a nd serious d isad vanta ge is the lim-ited life of many prospective battery systems.
Often, the ba tteries would need to b e replac ed– at high cost—before the rest of the vehiclereached the end of its useful life. Battery-electriccars also pose new and different safety problems,
such as spills of corrosive chemicals in the eventof an ac cident,
Battery-electric powertrains may have a placein local delivery trucks, and perhaps for small,specialized commuter cars. More widespread usede pend s on large imp rovements (a fa cto r of at
Ieast 5 in battery performance, particularly energydensity). Although research and development(R&D) on battery systems for EV applications willcontinue, there seems little likelihood of signifi-cant production—i. e., hundreds of thousands ofvehicles per year—before the end of the century.
“Breakthroughs” in batteries are improbable;slow incremental progress is more likely to char-ac terize R&D o n b a tte ry systems, and henc e EV(and hybrid) vehicles. Moreover, by the time bat-tery performance is improved sufficiently for prac-tical application, progress in fuel-cell technologyma y make the latter a m ore attrac tive op tion.
(Fuel cells convert a fuel, now generally hydrogenbut potentially a hydrocarbon or methanol, di-rec tly to elec tric ity.)
Hybrids also are limited by battery perform-ance, but the on board charging capacity meansthat not as many batteries are needed, so the bat-
IAA. R. Lancfgrebe, et al., “Status of New Electrochemical Storageand Conversion Technologies for Vehicle Applications, ” Proceec/-
ings of the 16th Intersociety Energy Conve rsion Enginee ring C onfer-
ence, Atlanta, Ga., Aug. 9-14, 1981, Vol. 1 (New York: AmericanSociety of Mechanical Engineers, 1981), p. 738.

8/14/2019 Increased Automobile Fuel Efficiency and Synthetic Fuels: Alternatives for Reducing Oil Imports
http://slidepdf.com/reader/full/increased-automobile-fuel-efficiency-and-synthetic-fuels-alternatives-for 124/292
120 q Increased Automobile Fuel Efficiency and Synthetic Fuels: Alternatives for Reducing Oil imports
tery pack is lighter. However, hybrids must carrya complete heat engine, as well as a generatoror alternator, and an electric drive motor. Al-though the engine can be small, because it need
not be capable of powering the vehicle by itself,the c ost and co mp lica tion of the hybrid pow er-train are prohibitive, at lea st a t p resent. The c om -
plication comes not only from the duplicateenergy conversion and drive systems but also
from the control system. While the performancerequirements for the control system are not unu-sual, the need for a reliable, mass-produced sys-tem at reasonable cost does create a demandingset o f c onstraints. The a dd ed we ight of the ba t-teries and duplicate drivetrain, and the efficien-cy losses associated with recharging the batteries,
also tend to c ounterac t the theoretica l advantag esof hybrids in fuel economy.
FUTURE AUTOMOBILE FUEL EFFICIENCY
Automobile technology is not a major con-straint on fuel ec onom y. Sma ll c ars c an be de -signed today—indeed, are on the market—withmileage ratings twice the current new-car aver-
ag e. Tec hnology is important for increasing thefuel economy of the larger, more powerful, and
more luxurious cars that many Americans still de-sire. Evolutionary improvements will continue toincrease the mileage of both large and small cars,but the p ac ing fac tor at the mom ent is ma rketdemand.
Because consumer demand is unpredictable,
estimates of post-1985 fuel economy are uncer-tain; these estimates largely reflect expectations
of the importance consumers will place on sizeand gas mileage. Projections of the fuel economytha t the U.S. new-c a r fleet will ac hieve va ry wide-ly, but most now tend to be optimistic. Only 2
or 3 yea rs ag o, Ame ric an auto ma kers view ed theCAFE standards, correctly, as pushing their prod-uct lines away from the sorts of cars that mostconsumers still demanded. Now many of thosesame consumers are buying cars with averagefuel economies above the CAFE requirements.
EPA sta tistics indica te tha t a verag e d om esticnew-car fuel economy averaged almost 24 mpgfor 1981 mo dels sold through Janua ry 5, 1981.15If imports are included, the figure is about 25mp g. A fe w predic tions are a s high a s 90 mp gfor 1995 or 2000, although such projections areusually exhortations rather than realistic attempts
to project future trends. While the technology toachieve such efficiencies will exist, fleet averages
15’’ Light Duty Automotive Fuel Economy . . . Trends Through1981 ,“ op. cit.
are likely to remain well below the economy rat-ings that the best performers will be able toachieve.
The p rimary differenc es am ong the m any p ro- jec tions of a utomo bile fuel ec onom y for the years
ahead arise from varying assumptions of futuremarket demand. Different assumptions for therate of introd uc tion of new tec hnology are alsocommon. A constraint for American manufactur-ers may b e the a bility to generate a nd a ttrac t ca p-ital for R&D and for investment in new plant and
equipment, particularly if movement towardsmall, high-mileage cars and introductions of newtechnology are more rapid than domestic firmshave been anticipating. Many foreign automakersalready produce cars that are smaller and lighter
—and get better fuel economy—than those theynow sell in the United States.
Although the fuel ec onomy a chieved b y thenew-car fleet in future years will depend strong-ly on ma rket dema nd a nd the hea lth of the auto
industry, tec hnolog y is a lso impo rtant. Both thetiming of new vehicle designs and their ultimatecosts—whether routine downsizing and materialssubstitution, or more demanding tasks such asimproved powerplants—depend on extensiveprogram s of eng ineering d eve lopm ent . Thesetake time and talent, as well as money. Complete
succ ess ca n never be gua ranteed . Some projects
will have more satisfactory outcomes than others.
To d istinguish these tec hnolog ica l d imensionsfrom questions of market demand, the discussionbelow first outlines two scenarios for future devel-opments in automobile technology. Designated
the “ high-estimate sc ena rio” a nd the “ low-esti-

8/14/2019 Increased Automobile Fuel Efficiency and Synthetic Fuels: Alternatives for Reducing Oil Imports
http://slidepdf.com/reader/full/increased-automobile-fuel-efficiency-and-synthetic-fuels-alternatives-for 125/292
Ch. 5—Increased Automobile Fuel Efficiency . 121
mate scenario, ” they represent plausible upperand lower bounds for fleet average passenger-carfuel economy in future years. Of course, among
the cars on the market in any year, some wouldhave mileage ratings considerably below, somec onsiderab ly ab ove, the fleet ave rag es for that
yea r. These sc ena rios are inde pe ndent o f ma rketdemand for cars of various size classes, and aresimply based, respectively, on optimistic and pes-
simistic expectations for rates of advance in auto-mobile technology as these affect fuel economy.
Using these scenarios, later sections of the chap-
ter disc uss the e ffec t of m arket de ma nd o n thefuel economy of the U.S. auto fleet.
Technology Scenarios
Both the high- and low-estimate technologyscenarios take as a baseline the new-car fuel
economy now expected for 1985. This baselineincludes a “number of technical advances, as well
as further downsizing, compared with 1982 mod-el cars. While the product plans of individualma nufa c turers for 1985 are not know n in deta il,the broad outlines of 1985 passenger-car technol-og ies c an be ea sily d isc erned . The scenarios thencover the period 1985-2000. The high estimate assumes:
q
q
q
The
q
q
that engineering development projectsaimed at improving fuel economy are gen-erally successful;that these technological improvements arequickly introduced into volume production;a nd
that they produce fuel ec onomy improve-ments at the high end of the range that c annow be anticipated.
low estimate assumes, in contrast:
that development projects are not as success-ful–e.g., that tec hnic al p rob lems de c rea sethe magnitude of fuel-economy gains,lengthen development schedules, and/orresult in high production costs;
the pace of development is slower thanwould result from the vigorous efforts to“push” automotive technology assumed for
the high estimate sc ena rio; a nd
q the resulting fuel-economy improvementsare at the low end of the range that can now
be anticipated.
From a technological perspective, the vehicle
subsystem most cri t ical for fuel-economyimprovements is the powertrain-i.e., the engine
and transmission. Here, as in other aspects ofautomotive technology, more-or-less continuousevolutionary development can be expected. Butmajor changes in powertrains have also been oc-
curring—e.g., new applications of diesel engines
to passenger cars.
The p ac e of d evelopment m ay vary for otheraspects of automobile technology—aerodynam-ics, downsizing and weight reduction, powerconsumption by accessories—but individual inno-vations with large impacts on fuel economy areunlikely. Engine developments, in contrast, de-
pend more heavily on successful long-term R&Dprograms; fundamental knowledge–e.g., of com-
bustion processes–is often lacking, and the risksas well as the rewards can be large. In contrast,
development programs aimed, for instance, atfriction reduction, are likely to be more straight-forward–and less costly.
Tab le 21 presents OTA’ s high a nd low e stima tesfor improvements in fuel economy by categoryof technology, based largely on informed techni-
cal judgments. * Relative to an assumed 1985 car
whic h ge ts 30 mp g (EPA rating, 55 perce nt c ity,45 percent highway driving cycle), table 21 indi-
cates that gains of 35 percent in fuel economymay be possible from engine redesigns, but thatpe rcentage improve me nts in transmissions andvehicle systems are likely to be smaller. Nonethe-
less, the c umula tive improvements in fuel ec on-omy c an be quite large.
*Alternative methodologies for estimating future fuel economy—e.g., the use of learning curves, or analytical modeling of the vehi-cle system—generally lead to comparable results. All approachesto projecting fuel economy have their limitations. The methodadopted by OTA does not always do the best job of evaluating thesystems effects of combining different technologies—i.e., open-chamber diesel engines combined with four-speed lockup torqueconverters. Learning curves, based on historical trends, do not takeexplicit account of new technologies. Analytical modeling is a valu-able tool for comparing alternative technologies, but mode ls must
be validated by comparison with hardware results before the modelcan be used with confidence.

8/14/2019 Increased Automobile Fuel Efficiency and Synthetic Fuels: Alternatives for Reducing Oil Imports
http://slidepdf.com/reader/full/increased-automobile-fuel-efficiency-and-synthetic-fuels-alternatives-for 126/292
122 . Increased Automobile Fuel Efficiency and Synthetic Fuels: Alternatives for Reducing Oil Imports
Table 21.–Prospective Automobile Fuel-Efficiency Increases, 1986-2000
Percentage gain in fuel efficiency
High estimate Low estimateTechnology 1986-90 1991-95 1996-2000 1986-90 1991-95 1996-2000
Engines Spark-ignition (SI) . . . . . . . . . . . . . . . . . . . . . . . . 10 10-15 15 5 5-1o 5-1oDiesel:
Prechamber. , . . . . . . . . . . . . . . . . . . . . , . . . . . 15 15 15 15Open chamber . . . . . . . . . . . . . . . . . . . . . . . . . 25 35 35 20 20 25
Open chamber (SI) stratified charge (SC) . . . . 15 20
Hybrid diesel/SC . . . . . . . . . . . . . . . . . . . . . . . . . 35Transmissions Automatic with lockup torque converter . . . . . 5 5 5 5 5 5Continuously variable ((XT). . . . . . . . . . . . . . . . 10 15 10Engine on-off . . . . . . . . . . . . . . . . . . . . . . . . . . . 10 10 10
Vehicle system Weight reduction (downsizing and
materials substitution) . . . . . . . . . . . . . . . . . . 8 13 18 4 8 10Resistance and friction (excluding engine)
Aerodynamics. . . . . . . . . . . . . . . . . . . . . , . . . . 2 3 4 1 2 3Rolling resistance and lubricants . . . . . . . . . 1 2 3 1 1 2
Accessories . . . . . . . . . . . . . . . . . . . . . . . . . . . . . 2 3 4 1 1 2a improvements in fuel efficiency are expressed as percentage gain in mpg compared with an anticipated average 1985 passenger car. The 1985 average car used as
a reference has an Inertia weight of about 2,500lb, is equipped with spark-ignition engine, three-aped automatic transmission, and radial tires, and has an EPA mileage
rating (55 percent city, 45 percent highway) of 30 mpg. The fuel efficiencies of the individual baseline cars, which are used to calculate future fuel efficiencies ineach size class, are given In tables 23 and 24. Percentages are given on an equivalent Btu basis where appropriate—e.g., for diesels, which use fuel having higherenergy content per gallon than gasoline, the percentage gain refers to miles per gallon of gasoline equivalent, which Is 10 percent less than miles per gallon of dieselfuel. The table does not include efficiency improvements from alternate fuels such as alcohol.
SOURCE: Office of Technology Assessment.
None of the figures in this table should be inter-
preted as predictions. Rather, they illustrateranges in fuel-economy improvement, based onOTA’ s judg me nt of w ha t is likely to be tec hnica lly
prac tica l. The p rojected imp rovem ents are notdirectly associated with the developmental pro-grams of specific automobile manufacturers—
either domestic or foreign. As changes in auto-mo bile te c hnology o c c ur, older de signs will c oex-ist with new—just as, recently, older V-8 SI en-gines have remained in production alongside re-placements such as diesels and V-6 SI engines.New engines and transmissions are typically intro-duced with the presumption that they will remainin prod uc tion fo r at least 10 yea rs. These ratherslow and gradual patterns of technologicalchange are likely to continue unless market con-
ditions forc e an ac c eleration. For this to hap pe n,
the market pressures would have to be rather in-tense, if only be c ause o f the limited c ap ital re-
sources available at present to the domestic auto-makers.
Tab le 21 lists the net improve me nts in autom o-
bile c omp onents that c ould be expec ted, on theave rag e, for the high a nd low estimate s during
each 5-year period. Note that the technologies
listed in the table are not in every case compati-
ble with one ano ther, nor can a ny simple co m-bining procedure yield net figures that have clear
and direc t me aning for particular hypothetica lvehicles. This is because different technologiescombine in different ways. For example, the poorpa rt-load efficienc ies of throttled SI eng ines mea n
tha t c ontinuously variab le transmissions and en-gine on-off will yield greater improvements than
for partially throttled open-chamber stratified-charge engines or diesels. Thus, the choice ofcost-effective technologies cannot be inferredfrom such a tab le a lone, but m ust d epe nd o nmore detailed analysis, and finally on testing.
The tec hnolog ies listed in table 21 are d iscussedin more d eta il in ap pe ndix 5A at the end of thischapter.
Projection of AutomobileFleet Fuel Efficiency
Based on the technological scenarios in table21 and several assumptions about the size mixof new cars, OTA has constructed a set of pro-

8/14/2019 Increased Automobile Fuel Efficiency and Synthetic Fuels: Alternatives for Reducing Oil Imports
http://slidepdf.com/reader/full/increased-automobile-fuel-efficiency-and-synthetic-fuels-alternatives-for 127/292
Ch. 5—Increased Automobile Fuel Efficiency 123
jections for the fuel economy of passenger carssold in the U.S. market in future years. As empha-sized earlier in this chapter, market demand—not technology—is the key factor in determining
the mileage potential of the new-car fleet, Market
demand is particularly critical in determining the
size mix of new-car sales.The a utom ob ile te c hnolog ies listed in tab le 21
are more important as tools for increasing the fuel
ec ono my o f the large r, mo re Iuxurious c a rs tha tmany American purchasers still demand than forcars that are small and Iight—e.g., nearly all cur-rent imports, as well as the new generations ofAmerican-made subcompacts. Improved power-
trains and the use of materials with high strength-to-weight ratios will lead to improved fuel econ-omy in cars of all sizes. But a 10-percent increasein ga s milea ge fo r a b ig ca r—with milea ge that
is initially low—saves more fuel than a 10-percentimprovement to a small car that is already morefuel efficient.
This is not to say, howeve r, tha t a given tec h-nologica l de velopm ent will nec essarily give thesame percentage improvement for cars of allsizes—or even be applicable to all types of cars.Continuously variable transmissions (CVTs) havebeen in limited use for many years in small cars,and would no do ubt b e a pp lied widely in sub-compacts before finding their way into heaviervehicles. The reason is simply tha t the mechanica ldesign p roblem s for a CVT a re simpler if the leve ls
of torque that must be transmitted are low.
On the other hand, if gas turbines becomepractical as automobile powerplants, they arelikely to be used first–and perhaps exclusively–in big cars, because turbine engines are more effi-
cient in larger sizes.
Any projection of fleet fuel economy will de-pend on the assumed weight (size) mix of new-car sales in the years ahead. For its analysis, OTA
adopted a simplified description of this mix,based on three size classes–small, medium, andlarge . This a llow s possible m arket shifts to be a na -
lyzed in terms of the assumed proportion of new-car sales by size class—for each of which the av-erag e fuel ec ono my ha s been estima ted . This isa considerable abstraction from the real situation –-one in which the spectrum of curb weightsfrom which consumers select extends from lessthan 2,000 lb to over 4,000 lb. For any givenweight—now and in the future—there will alsobe a range of fuel economies, depending on vehi-
c le de sign. The c onvenienc e of the de sc riptionin terms of only three size classes, for which other
c harac teristics are ave rag ed , com es at t he ex-pense of the richness and variety that will actually
exist in the marketplace.
New-Car Fuel Efficiency by Size Class
Table 22 describes the small, medium, andlarge size c lasses on w hich OTA’ s projec tions arebased . The schem e is similar to c urren t EPA p rac -tice for fuel-eco nomy ratings—group ing c ars ofsimila r pa sseng er ca pa c ity and interior volume.However, the designations of car sizes in table22 differ from some current designations because
they are intended to reflect future vehicle charac-te ristics rathe r than the p ast; in othe r words, OTA
prefers to call a future small car just that, not a‘ ‘m in i compact .“ Each class in the table encom-
passes a considerable range of possible vehicledesigns. Under either the high or low estimatescenarios, curb weights of cars in the U.S. fleetare expected to decrease over the period 1985-2000.
Table 22.–Small, Medium, and Large Size Classes Assumed for 1985-2000
Curb weighta (lb) 1981 equivalents
Class High estimate Low estimate Interior volume (ft3) Passenger capacity Size class Typical models
Small . . . . . . . . 1,300-1,600 1,400-1,700 < 85 2-4 Minicompact, Honda Civictwo seaters Toyota Starlet
Medium. . . . . . 1,600-2,000 1,700-2,000 80-110 4 Subcompact, VW Rabbitcompact Chrysler K-Car
Large. . . . . . . . 2,200-3,000 2,500-3,000 100-160 5-6 Intermediate, GM X-Carlarge, luxury Ford Fairmont
aCurb weight is the weight of the car without passengers or cargo.
SOURCE: Office of Technology Assessment.

8/14/2019 Increased Automobile Fuel Efficiency and Synthetic Fuels: Alternatives for Reducing Oil Imports
http://slidepdf.com/reader/full/increased-automobile-fuel-efficiency-and-synthetic-fuels-alternatives-for 128/292
124 q Increased Automobile Fuel Efficiency and Synthetic Fuels: Alternatives for Reducing Oil Imports
Tables 23 and 24 expand on the descriptionsin ta ble 22. For these ta b les, OTA has estimatedweight averages, engine alternatives, and averagefuel economies at 5-year intervals through 2000for the tw o te c hnology sc ena rios. Again, theseestimates reflect informed technical judgment butshould not be viewed as predictions. The curbweights are averages expected for each of the
three size c lasses; ra ther b road ranges in ac tua lweights are likely, especially in the medium andlarge c lasses. The fue l economy estimates are like-wise ave rag es with c onsiderable sprea d antici-pated. Fuel economy projections are given interms of c urrent EPA rating practice (combinedcity-highway figures)—which overestimate actualover-the-road mileage by as much as 20 percent.The EPA rating ba sis has be en a do pted for ea seof comparison with fuel economy ratings for the
current fleet; in later sections, to estimate actual
fuel consume d, EPA ratings are a djusted dow n-ward to more realistic values.
The a verage fuel eco nomy estimates in ta bles23 and 24 for the high- and low-estima te te c hnol-
og y sc ena rios are g roup ed tog ether in ta ble 25so that the differences by size class and technol-
og y level ca n be m ore easily c omp ared . Tab le25 illustrates the importance of size and weightfor fuel economy. By 2000, the low-estimate aver-age effic iency for med ium-size c a rs is the sameas the high-estimate efficiency for big cars—bothare 50 mpg. Large cars show the greatest percent-age improvements because more can be done
to imp rove fuel eco nomy b efore d iminishing re-turns become severe.
One way to abstract the effects of downsizing
and weight reduc tion from o ther tec hnologica limproveme nts is to examine spe c ific fuel ec on-omy—by normalizing to ton-mpg, or the milesper gallon that would result for an otherwise sim-ilar ca r we ighing 1 ton. Ton-mp g va lues have e x-hibited an upward trend overtime as automotive
technologies have improved.16
Figure 9 shows the gradual increase–with con-
siderable year-to-year fluctuations—that has char-acterized average fuel economy in ton-mpg forthe U.S. new-ca r fleet over the p ast d ec ad e, to-gether with estimates through 2000 based on the
16"Powerplant Efficiency Projected Via Learning Curves, ” Auto-
motive Enginee ring July 1979, p. 52.
Table 23.—Automobile Characteristics- High-Estimate Scenario
Small Medium Large
1965 1990 1995 2000 1965 1990 1995 2000 1985 1990 1995 2000
Average curb weight (lb) . . . . . . . . . . . . . . . . . 1,600 1,500 1,400 1,300 2,000 1,800 1,700 1,600 3,0002,6002,4002,200Engine type (percent):
Spark ignition . . . . . . . . . . . . . . . . . . . . . . . . 100 95 70 60 90 70 50 30 75 30 30 25Prechamber diesel . . . . . . . . . . . . . . . . . . . . — 5 — — 10 10 — — 25 40 — —Open chamber diesel or open
chamber stratified charge . . . . . . . . . . . . — 30 40 20 50 70 – 30 70 75Fuel economya (mpg) . . . . . . . . . . . . . . . . . . . . 48 62 74 84 39 51 61 71 27 37 43 49aCombined EPA clty/highway fuel-economy rating, baaed on 55 percent city and 45 percent highway driving.
SOURCE: Office of Technology Assessment.
Table 24.—Automobile Characteristics-Low-Estimate Scenario
Small Medium Large
1965 1990 1995 2000 1985 1990 1995 2000 1985 1990 1995 2000
Average curb weight (lb) . . . . . . . . . . . . . . . . . 1,7001,6001,500 1,400 2,0001,9001,600 1,700 3,0002,6002,6002,500
Engine type (percent):Spark ignition . . . . . . . . . . . . . . . . . . . . . . . . 100 100 100 60 90 60 70 70 75 60 50 40Prechamber diesel . . . . . . . . . . . . . . . . . . . . — — — — 10 20 30 25 40 20Open chamber diesel . . . . . . . . . . . . . . . . . . — — — 40 — — — 3 0 - – – 3 O G
Fuel economya (mpg) . . . . . . . . . . . . . . . . . . . . 45 52 57 65 35 41 45 50 23 28 31 34 aCombined EPA city/highway fuel-economy rating, baaed on 55 percent city and 45 percent highway driving.
SOURCE: Office of Technology Assessment.

8/14/2019 Increased Automobile Fuel Efficiency and Synthetic Fuels: Alternatives for Reducing Oil Imports
http://slidepdf.com/reader/full/increased-automobile-fuel-efficiency-and-synthetic-fuels-alternatives-for 129/292
Ch. 5–Increased Automobile Fuel Efficiency • 12 5
Table 25.—Estimated New-CarFuel Economy: 1985-2000
Average new-car fuel economya
Size class 1985 1990 1995 2000
Large:High estimate . . . . . . . 27 37 43 49Low estimate . . . . . . . 23
28 31 34Medium:High estimate . . . . . . . 39 51 61 71Low estimate . . . . . . . 35 41 45 50
Small:High estimate . . . . . . . 48 62 74 84Low estimate . . . . . . . 45 52 57 65
aCombined EPA city/highway fuel-economy rating, based on 55 percent city and45 percent highway driving.
SOURCE: Office of Technology Assessment.
Figure 9.—Sales.Weighted Average New-Car FleetSpecific Fuel Efficiency
z - 1975 1980 1985 1990 1995 2000
Year
SOURCE: Off Ice of Technology Assessment.
high and low scenarios in table 21. As for theearlier tables, figure 9 aggregates both domestic
automobiles and imports. Using such projections,the fuel economies of future new-car fleets ofvarious size (weight) mixes can be estimated.
As the figure shows, average specific fuel con-sumption for new cars sold in the United Stateshas increa sed from less tha n 30 ton-mp g in theearly 1970’s to roughly 39 ton-mpg in 1981, a30-percent improve me nt. The m ost e ffic ient 1981
cars sold in this country gets 50 ton-mpg. * By
1990, the average should equal the current best.By 2000, the average could be as high as 65ton-mpg.
Based on the projections in tables 23-25, or al-ternatively those in figure 9, the effects of changesin the size mix of the new-car fleet can be esti-mated. In the mix of new 1981 cars sold through
Janua ry 5, 1981, sma ll c a rs ma de up only 5 pe r-c ent o f the ma rket; the rest w as almo st e venlydivided between medium cars (48 percent) andlarge cars (47 percent). By 1985, the share of small
c ars ma y rema in at 5 percent, b ut the share ofmedium cars is expected to go up at least to 60percent, dropping the large-car share to 35 per-
c ent or less. Even in the unlikely event tha t the60:35, ratio remains unchanged beyond 1985–that medium cars show no further sales gains over
large cars–the average fuel economy of the new-
c ar fleet in 2000 would b e 62 mpg in the high-estimate scenario, 43 mpg in the low-estimatescenario. * (See table 26, “no mix shift” case.)These figures represent a substantial improve-ment over the 25 mpg expected in 1981 and the
30 to 35 mpg expected for 1985. A further shiftin consumer preference toward smaller andlighte r c ars wo uld inc rea se the expec ted fleet -average fuel economy even more.
To illustrate the effec ts of a c ontinuing shift to-wards smaller and lighter cars, table 26 also gives
average fuel economies at 5-year intervals for a“modera te” mix shift-leading to 35 percentsmall cars, 50 percent medium cars, and 15 per-
c ent large c ars by 2000-and for a “ large -sc ale”mix shift. The latter assumes 70 percent smallc ars, 25 perce nt med ium c ars, and only 5 per-c ent large c a rs in 2000. As the tab le show s, thelarge -sc ale m ix shift c ould g ive a new-ca r fleetaverage fuel economy of 60 to 80 mpg by 2000.Whether market demand will lead to such a mixshift depends on factors such as price differen-tials between large and small cars, and the com-promises in other vehicle characteristics that ac-
company smaller cars, as well as the pricing and
availability of fuel.*These are diesels, for which the ton-mpg rating has been ex-
pressed on a gasoline-equivalent basis; the value based on dieselfuel would be about 55 ton-mpg. The best current SI engine mod-els sold in the United States have ton-mpg ratings about 10 per-cent lower, or roughly 45 ton-mpg.
*The corresponding numbers for the 1981 mix are 59 mpg inthe high estimate and 41 mpg in the low estimate.

8/14/2019 Increased Automobile Fuel Efficiency and Synthetic Fuels: Alternatives for Reducing Oil Imports
http://slidepdf.com/reader/full/increased-automobile-fuel-efficiency-and-synthetic-fuels-alternatives-for 130/292
126 . Increased Automobile Fuel Efficiency and Synthetic Fuels: Alternatives for Reducing Oil Imports
Table 26.—Effect on Size Mix on Estimated Fuel Economy of the New-Car Sales in the United States
Estimated average new-car fuel economya(m p g )
No mix shiftb Moderate mix shiftc Large-scale mix shiftd
Technology scenario 1985 1990 1995 2000 1985 1990 1995 2000 1985 1990 1995 2000
High estimate . . . . . . . . . . . . . . . . . . . . . . . . . . 34 45 54 62 34 48 59 70 37 53 65 78Low estimate . . . . . . . . . . . . . . . . . . . . . . . . . . . 30 36 39 43 30 38 43 51 33 43 49 58a
55 percent city, 45 percent highway EPA rating.
CThe moderate mix shift assumption is as follows:bThe no mix shift case assumes: ‘The large-scale mix shift assumption is:Sales mix (percent) Sales mix (percent)
Size class Sales mix (percent) for all years
Small . .Size class 1985 1990 1995 2000 Size class 1985 1990 1995 2000
5Medium . . . . . 60
Small . . . 5 15 25 35 Small . . . . . . . 10 30 50 70
Medium . . . . . 60 60Large . .
55 5035
Medium . 75 65 45 25Large . . . . . . . 35 25 20 15 Large . . . . . . . 15 5 5 5
SOURCE: Office of Technology Assessment.
ESTIMATED FUEL CONSUMPTION, 1985–2000
In this sec tion e stima tes of the fuel c onsume dby the U.S. pa sseng er-ca r fleet a re b ased on thevarious assumptions and projections of car size
mix and efficiency discussed above, but assumethat g asoline a nd d iesel fuel c ontinue to p owerpassenger vehicles, with no significant penetra-
tion of alternative fuels such as methanol.
In 1975, when Federal fuel economy standardswere enacted, passenger cars consumed an aver-
age of about 4.3 MMB/D of fuel. (Trucks areomitted from the calculations in this chapter, butma ny light trucks and vans are used intercha nge-ably with passenger cars and add about 1.1MMB/D to average consumption). Passenger-carfuel consumption rose to 4.8 MMB/D in 1978,but has since declined to 4.3 MMB/D–about the1975 Ievel.17 OTA p rojec ts tha t p asseng er-c ar fuelconsumption will continue to decline—to about
3.6 MMB/D in 1985, as the automobile fleet be-c om es mo re fuel-effic ient. This estima te a ssumesthat the fleet will grow from about 107 millioncars in 1980 to 110 million in 1985, and that theaverage car will continue to accumulate about
10,000 miles per year.
Projected Passenger-CarFuel Consumption
The baseline chosen for discussing fuel con-sumption by passenger cars past 1985 is outlinedin table 27. Growth in the automobile fleet—which depends on both sales levels for new cars,
and the rates at which older cars are scrapped—is
Table 27.—Baseline Assumptions for Projectionsof Automobile Fuel Consumption
1980 1985 1990 1995 2000 2005 2010
Vehicle miles of travel: Trillion
miles/yr . . . 1.14 1.17 1.20 1.23 1.26 1.28 1.31Also assumes 47 percent of fleet vehicle miles traveled
(VMT) by cars less than 5 years old, 38 percent of VMTby cars 5 to 10 years old, and 15 percent of VMT by carsolder than 10 years.
New-car fuel economy (combined EPA ratings; 55 percent city, 45 percent highway)
1985 base case (low-high estimate)Small cars: . . . . . . . . . . . . . . . . . . . . . . . . . . . . . 45-48 mpgMedium cars: . . . . . . . . . . . . . . . . . . . . . . . . . . 35-39 mpgLarge cars: . . . . . . . . . . . . . . . . . . . . . . . . . . . . . 23-27 mpg
Fleet baseline average efficiency30 mpg, 1985-2010
High- and low-estimate scenariosSee table 25
lzDerived from j. K. pollard, et al., “Transportation Energy Out-
look: 1985-2000,” Transportation Systems Center, U.S. Departmentof Transportation, DOT-TSC-RS-1 12-55-81-6, September 1981, pp .
4-21; and “Monthly Energy Review, ” Energy Information Agency,U.S. Department of Energy, DOE/EIA-0035 (81/10), October 1981.
On-the-road fuel efficiency: 10 percent less than EPA rated fuel efficiency
Size mix:
See table 26SOURCE: Office of Technology Assessment.

8/14/2019 Increased Automobile Fuel Efficiency and Synthetic Fuels: Alternatives for Reducing Oil Imports
http://slidepdf.com/reader/full/increased-automobile-fuel-efficiency-and-synthetic-fuels-alternatives-for 131/292
Ch. 5—increased Automobile Fuel Efficiency q 127
projected to average less than 2 percent peryear.18 Ca rs are a ssumed to b e d riven a n a verage
of 10,000 miles per year, with newer cars drivenmore and older cars driven less, on the average
(see ta ble 27). The projections for new-car fueleconomy and future size mix are taken from the
tables in earlier sections. Because those fuel-economy projections were based on EPA ratings,which overestimate actual on-the-road mileage,
fuel ec onomy ha s be en a djusted do wnwa rd 10percent to compensate.
If neither fuel economy nor size mix were toadvance past a 1985 baseline average of 30 mpg,fuel consumption by passenger cars would stilldecline slowly for 10 years, reflecting the largerfrac tion of c ars in the fleet with fuel eco nomiesa t this baseline va lue, Betw ee n 1985 and 1995,passenger-car fuel consumption would decline– even with a status quo in fuel economy and size
mix—from about 3.6 MMB/D in 1985 to 2.7MMB/D in 1995. Thereafter, the upward trendwo uld resume be c ause o f increases in the to talsize of the fleet.
But of course, automobile technology will con-
tinue to improve (table 21 ), and a continuing shift
toward smaller cars is also probable (table 26).Therefore, under almost any realistic set of as-sump tions, pa sseng er-ca r fuel consump tion w illcontinue to decrease during the post-1995 peri-od. At some point it may still turn upward be-c ause o f increa ses in fleet size, th is turning p oint
de pe nding o n bo th tec hnology a nd size m ix. Inany case, as figure 10 shows, the decline in pas-
senger-car fuel consumption will level off byabout 2005 (unless growth in the fleet is slowerthan projected in table 27 or cars are driven fewer
miles per year).
Figure 10 gives fuel-consumption projectionsto 2010 based on these assumptions. The influ-ence of technological improvements is striking.For example, even without a mix shift toward cars
smaller than in the 1985 baseline mix, the highestimate gives fuel savings greater than those for
the low estimate with a large-scale shift towardssma ller c a rs. But suc h a mix shift would a lso c re-ate substantial fuel savings. For the cases plotted
~au. S. / ndustr ja/ Competitiveness: A Comparison of Stee( elec-tronics, and Automobiles, op. cit., pp. 140-141.
Figure 10.—Projected Passenger-CarFuel Consumption
5 . 0
4 .030-mpg new-car
3. 5 average 1985-2000
0
3. 0
2. 5
2. 0 Low estimate,k *
q
large mix shift1 . 5 - - -
- - - -
1 . 0High estimate,
‘- - -
no mix shift High estimate.0 .5 large mix shift
0 . 0 1 I I 1 1 1
1975 1980 1985 1990 1995 2000 2005 2010
Year
SOURCE: Off Ice of Technology Assessment.
in this figure, passenger-car fuel consumptionstays well below 2.5 MMB/D during the earlyyea rs of the next c entu ry. The figure a lso show sthe potential benefits if technical success is ac-c om pan ied by a strong shift to sma ller ca rs. Thedifference in 2010 between the low estimate withno m ix shift (ab out 2.0 MM B/D), and the high esti-mate with a large mix shift toward smaller cars(1.1 MMB/D), is nearly a factor of 2. The lowerend of this range is about one-fourth the currentlevel of fuel consumption. Where within thisrang e the a c tual fuel c onsump tion would fa ll islikely to depend–as emphasized earlier–on mar-ket demand for fuel-efficient vehicles, and/or con-
tinuing Government policies designed to encour-age the manufacture and purchase* of fuel-effi-
cient cars. Changes in vehicle miles traveledwould also change the fuel consumption propor-tionately.
*An illustration of the importance of new-car sales can be de-rived as follows: In 1980, 47 percent of the vehicle-miles traveled
(VMT) were by cars 0 to 4 years old, 38 percent by 5 to 9 year oldcars, and 15 percent by cars 10 years old and older. Call this thebase case. A persistent 20 percent depression in new car sales could
change the VMT distribution by 1995 to: 40 percent by cars O to4 years old, 35 percent by cars 5 to 9 years old, and 25 percentby cars 10 years old and older. Call this the “low” car sales case.
If VMT are held constant at the 1980 level, fuel consumption underthe base case would be up to 0.3 MMB/D (or nearly 20 Percent)lower than fuel consumption in the “low” car sales case in 1990,everything else being equal. And cumulative oil savings could beover 1 billion bbl during the period 1981-2000. The base case, how-ever, probably would be accompanied by higher VMT than the“low” sales case, and much of this savings could be lost.

8/14/2019 Increased Automobile Fuel Efficiency and Synthetic Fuels: Alternatives for Reducing Oil Imports
http://slidepdf.com/reader/full/increased-automobile-fuel-efficiency-and-synthetic-fuels-alternatives-for 132/292
128 Ž Increased Automobile Fuel Efficiency and Synthetic Fuels: Alternatives for Reducing Oil Imports
Total projected oil savings are bracketed by the
curves in figure 11. These show the fuel con-served relative to the 1985 baseline case of new-car efficiencies of 30 mpg between 1985 and2010. Clearly, the high-estimate technology sce-nario, accompanied by a continuing shift toward
smaller cars, leads to large fuel savings. By2010–when virtually the full benefit of fuel sav-ings from cars sold in the period 1985-2000 wouldbe realized–the cumulative savings (relative toa 30-mpg fleet) could be as high as 10 billion bblof oil equivalent. This is equivalent to 6 years sup-ply of passenger-car fuel at the 1980 rate of con-
sumption. The fuel economy increases expectedbetween now and 1985 would add about 14 bil-lion bbl to this cumulative savings between nowand 2010 (relative to 1980 fuel consumption).Thus, between now and 2010, the total savingspossible is about 24 billion bbl relative to 1980passenger-car fuel consumption–an amountabout equal to proven U.S. oil reserves, whichwere 26.5 billion bbl as of 1980.19
Substitution of Electric Vehicles
The estimates ab ove are b ased on a pa sseng er-
car fleet for which energy comes from a fuel car-ried onboard—e.g., gasoline or diesel fuel. In the
19Wof/d Petro/eum Availability 19802(XXL Technical Memoran- dum, OTA-TM-5 (Washington, D. C.: U.S. Congress, Office of Tech-nology Assessment, october 1980.)
Figure Il.—Cumulative Oil Savings From IncreasedAutomobile Fuel Efficiency Relative to 30 MPG in
1985, No Change Thereafter
0
1985 1990 1995 2000 2 0 0 5 2010
Year
SOURCE: Office of Technology Assessment.
“Battery-Electric and Hybrid Vehicles” section,the prospects for EVs were briefly discussed, with
the c onc lusion that m ajor imp rovem ents in bat-tery performance were necessary before EVs (orhybrids) would be practical in any but very spe-cialized applications. If, however, these improve-ments are achieved—or if acute shortages of
transportation fuels occur in the future—EVsmight be sold in sufficiently large numbers to af-fect petroleum co nsumption.
The result w ould b e to rep lac e som e o f the p e-
troleum c onsumed in the transpo rta tion sec torby e lec tric p ow er generation. To the extent thatthis electricity was produced from nonpetroleumfuels–e.g ., na tural ga s, co al, nuclea r–the c umu-lative oil savings shown in figure 10 would in-crease (see app. 56). Table 28 illustrates theresults for a high ly op timistic leve l of EV sub stitu-tion. Note that this again is not a prediction; sub-
stantial penetration by electric and/or hybridvehicles (EHVs) before the end of the c entury isunlikely, and d oub tful even the rea fter. The ta blesimply shows what might happen if battery im-provements oc c ur more rapidly than OTA e x-pects, or if other factors combine to increase theattractiveness of EHVs. Table 28 assumes thatEHVs represent 5 percent of the total U.S. passen-ger-car fleet by 2000, and 20 percent by 2010.This would require EHV production and sales atlevels of several million per year during the lastfew years of the century.
Tab le 28 shows tha t pene tration of EHVs a t highenough rates co uld beg in to replace mea ningfulvolumes (14 percent) of transportation fuels dur-
Table 28.—Effects of Substituting Electric Vehicles s
Passenger-carComposition of fuel consumedpassenger-car or replacedfleet (million) (MMBID)
2000 2 0 1 0 2000 2010
Conventional cars . . . . . 133 124 1.7 1.4EVs . . . . . . . . . . . . . . . . . . 7 31 0.04 0.2
Percent EVs . . . . . . . . . . 5 20 — —Percent fuelconsumptionreplaced. . . . . . . . . . . . — — 2 14
qf battery Improvements occur more rapidly than OTA expects, or if other factorscombine to increaae the attractiveness of electric vehicles.
SOURCE: Office of Technology Assessment.

8/14/2019 Increased Automobile Fuel Efficiency and Synthetic Fuels: Alternatives for Reducing Oil Imports
http://slidepdf.com/reader/full/increased-automobile-fuel-efficiency-and-synthetic-fuels-alternatives-for 133/292
Ch. 5—Increased Automobile Fuel Efficiency 129
ing the first decade of the next century. Nonethe-less, the savings in pe troleum wo uld b e relat ive-ly small in absolute terms–because EHVs are best
suited as replacements for small cars which al-read y get good mileage .
Comparing the estimated fuel savings in table
28–only 0.2 MM B/ D even fo r op timistic a ssump -tions of EHV penetration—with the fuel-consump-tion trends projected in figure 9, demonstratesthat improvements in automobile technology,particularly if combined with more rapid mixshifts toward smaller cars, offer much greaterpo tential. Thus, the p rima ry ap pa rent a dva ntag eof EVs during the next 30 years is that they wouldnot depend on petroleum supplies—an impor-tant factor if severe absolute shortages develop– rather than a ny pote ntial for saving petroleum.
Fuel Use by OtherTransportation Modes
Thus far, the discussion of fuel consumptionhas been restricted to passenger cars, although,
as pointed out earlier, many light trucks—i.e.,vans and pickups—are used primarily for passen-ge r trave l. In a dd ition, me dium a nd hea vy trucks,buses, motorcycles, and airplanes–plus rail andmarine transportation and military operations—consume petroleum-based fuels. All of these
transportation modes depend predominately onhea t eng ines for powe r, althoug h SI eng ines a renot so widely used as in passenger cars. Dieselshave already replaced SI engines in almost allheavy trucks, and rates of installation in medium-duty trucks are going up rapidly. Diesels are also
common in rail and marine applications, al-though som e large ships rely on ga s turbines orsteam power. Commercial aircraft are generallypowered by turbine engines.
Table 29 summarizes the projected oil con-sump tion for transpo rtat ion be twe en 1980 and2000. The p rojec tions for autom ob iles are d erivedin this c hapter, while those fo r other transporta -tion modes are taken from the “market trend”ba se c ase in a rec ent Dep artment o f Transpo rta-tion study.20 The projections for fuel consump-tion by trucks in table 29 assume that many ofthe technological improvements discussed abovefor passenger cars will also be applicable to light
trucks. However, the specific technologies dis-cussed elsewhere in this chapter are more gener-
ally ap prop riate to pickup trucks and vans thanto medium and heavy trucks.
Zoj. K. Pollard, et al., “Transportation Energy Outlook: 1985-2000,”Transportation Systems Center, U.S. Department of Transportation;DOT-TSC-RS-1 12-55-81-6, September 1981.
Table 29.-Projected Petroleum-Based Fuel Use for Transportation
1980a
1990a 2000a
Mode M M B / Db Pe rc e n t MMB/Db Pe rc e n t MMB/Db Pe rc e n t
Passenger car . . . . . . . . . . . . . 4.3 49 2.4-2.9 35 1.3-2.1 23Light trucks . . . . . . . . . . . . . . . 1.1 13 0.9 12 0.8 11Other trucks. . . . . . . . . . . . . . . 1.1 13 1.2 16 1.4 19Other highway (buses,motorcycles, etc.) . . . . . . . . . . 0.1 1 0.2 3 0.2 3
Total highway . . . . . . . . . . . 6.6 75C4.7-5.2 65C
3.7-4.5 5 5C
Air . . . . . . . . . . . . . . . . . . . . . . . 0.8 9 1.1 14 1.5 20
Marine. . . . . . . . . . . . . . . . . . . . 0.7 8 0.8 10 0.9 12Rail . . . . . . . . . . . . . . . . . . . . . . 0.3 3 0.4 5 0 .4 5
Pipelines d . . . . . . . . . . . . . . . . . 0.1 0.1 1 0.1 1
Military Operation . . . . . . . . . . 0.3 3 0.3 4 0 .4 5
Total nonhighway . . . . . . . . 2.2 25C 2.7 35C3.3 45C
Total . . . . . . . . . . . . . . . . . 8.8 100 7.4-7.9 100 7.0-7.8 100aA\\ fuel consumption numbers, except for passenger cars, from J. K. Pollard, C. T. Phillips, R. C. Ricci, and N. Rosenberg,
“Transportation Energy Outlook: 1985-201M,” U.S. Department of Transportation, Transportation Systems Center, Cambridge,Mass., DOT-TSC-RS-112-55-81%, September 1981. Passenger-car fuel consumption from this study.blB - 5 . 9 MMBtu.csum~ may not agr~ due to round-off errors.dDoes not include naturai 9as.
SOURCE: Office of Technology Assessment.

8/14/2019 Increased Automobile Fuel Efficiency and Synthetic Fuels: Alternatives for Reducing Oil Imports
http://slidepdf.com/reader/full/increased-automobile-fuel-efficiency-and-synthetic-fuels-alternatives-for 134/292
130 Increased Automobile Fuel E f f i c i e n c y and Synthetic fuels: Alternatives for Reducing Oil Imports
Some o f the fue l eco nom y ga ins for other trans-portation modes—as for passenger cars—will beoffset by growth in miles traveled. Annual growthrates of 1 to 3 percent per year are expected formost modes of transport, although sales of lighttrucks have recently dropped to such an extentthat mileage traveled by such vehicles may de-
crease in the years ahead. In total, fuel consumedfor transportation is projected to decline from 8.8MMB/D in 1980 to the range of 7 to 8 MMB/Dby 2000, and then to rise slowly as diminishingreturns set in.
Because of the differing growth rates for the var-ious transportation modes and the differing mag-nitudes of the fuel economy improvements ex-pec ted , the distribution of fuel use b y mod e w illchange. Passenger cars now account for half of
a ll the fuel used in transporta tion. Their sha re willde c rea se to a bo ut 25 perc ent b y the early pa rt
of the next c entury. Med ium a nd he avy trucksc urrently consume 12 pe rc ent o f a ll transpo rta -tion fuel, a figure that could rise to 20 percent
by 2000. Likewise, the percentage of transportfuels used by aircraft could nearly double.
COSTS OF INCREASED FUEL EFFICIENCY
Overview
Automobile manufacturers spend for many
purposes–R&D, investment in plant and equip-ment, labor, materials, marketing, and adminis-tration. How much a particular manufacturerspends depends on the firm’s financial capabili-ties, the rate of technology change, initial charac-
teristics of the p rod uc t line, a nd the sta te o f ex-isting manufacturing facilities.
R&D on vehicle designs and manufacturingprocesses is an important spending area. Devel-opment—on which most R&D money is spent,research expenditures being small by comparison
—creates new product designs and productionmethods. Growth in R&D activity, required tosuppo rt rap id c hange s in vehicle de sign, will raiseboth the total costs of automobile production and
the proportion of development and other prepro-duction expenses.
In 1980, the four major domestic manufacturersspent a lmost $4.25 b illion (1980 dollars) on R&D.For individual firms, this spending amounted to2 to 5 percent of sales revenues. in addition, ma-
jor parts and equipment suppliers spent about$293 million on automo tive R&Din 1980. Tog eth -er, major automobile manufacturers and suppli-ers spent over $4.5 billion on R&D for automo-
biles and other vehicles.21
Capital investment levels are even greater.These e xpend itures, which go hand -in-hand withdesign and development activities, are the largest
single c ate gory of spe nding in autom ob ile m anu-facturing. Major categories of capital goods in-clude factory structures, production equipmentsuch as machine tools and transfer lines, and awide variety of special tools such as dies, jigs, andfixtures.
Ma nufac turers tod ay a re ma king investme ntsto imp rove prod uc t q uality, as we ll as increaseproductivity and cut costs. Flexible manufactur-ing is also becoming an increasingly attractive in-vestment. Such sophisticated facilities are relative-ly expensive but may yield low operating costs
and other long-term benefits. General Motors(GM), Ford, and Chrysler spent $10.8 billion(1980 dollars) on property, plant, equipment, andspec ial tooling in 1980.22
Financing is an important aspect of capital in-vestment. Historically, the automobile industryhas financed capital programs with retained earn-ings, except during recessions when low salesgene rated inad equate revenues. Several current,
and possibly enduring, factors—declining profit-ability, high inflation, slow market growth, market
volatility, and consumer resistance to real priceincreases—have eroded manufacturers’ ability to
financ e ma jor c ap ital program s from ea rnings (orby issuing stoc k), lead ing them to bo rrow funds
2]’’ R&D Scoreboard: 1979,” Business Week, July 7, 1980; “R&DScoreboard: 1980, ” Business Week, JuIy 6, 1981.
22Annual Reports for 1980.

8/14/2019 Increased Automobile Fuel Efficiency and Synthetic Fuels: Alternatives for Reducing Oil Imports
http://slidepdf.com/reader/full/increased-automobile-fuel-efficiency-and-synthetic-fuels-alternatives-for 135/292
Ch. 5—Increased Automobile Fuel Efficiency . 131
and therefore to face potentially higher costs ofcapital. GM and Ford each borrowed over $1 bil-lion during 1980; they may together borrow asmuch as $5 billion by the mid-1980’s. 23
Although domestic manufacturers have recent-
ly borrowed from foreign and other nontradition-al sources, they are able to borrow only a limitedportion of their capital needs (at acceptable inter-est ra tes). Borrow ing in the United Sta tes ha s re-ce ntly bec ome more co stly to a utomob ile ma nu-facturers because their bond ratings have been
lowered, in recognition of the low profitability,high spending levels, and high risks that charac-
terize tod ay’ s auto ma rket. Conseq uently, theyare obtaining cash by restructuring their physicaland financial operations (e.g., by selling assetsand changing the handling of accounts receiv-able), engaging in joint ventures, and selling tax
c redits (under Ec ono mic Rec ove ry Tax Ac t of1981 leasing rules).
Automotive fuel economy improvement affects
other costs as well, although not to the same ex-tent tha t it affec ts R&D and c ap ital investme nt,Costs for labor and materials depend on vehicledesign and on production volumes and proc-esses. For example, automated equipment re-duc es lab or c ontent; sma ll c a rs require less ma -terial; and lighte r bod y pa rts and more efficientengines may require new, relatively expensivema te ria ls (high-streng th steels, aluminum a lloys)and processes (heat treatments, longer weld cy-
cles, a greater number of forming operations,slower machining). Reductions in the amountsof lab or and ma terials used pe r ca r help offsetinfla tiona ry a nd real increa ses in the ir c osts. Labo r
costs, however, are slow to change in the shortterm because they are subject to union negotia-tions, and be c ause c ontrac tual p rovisions c on-strain layoffs and require compensation pay-ments.
Finally, spending on marketing and administra-
tion is not directly related to technological changeor to p rod uct ion; althoug h these e xpe nses ma ybe cut back to facilitate spending in other areas.During 1980, for example, auto manufacturersma de large c uts in white c ollar staffs to low er ad -
Z3AIS0 se e “producing More Fuel-Efficient Automobiles: A CoSt-
Iy Proposition, ” op. cit.
ministrative c osts. How eve r, marketing ac tivitiesmay increase because of heightened competition
or the introduction of new products.
The rema inder of this c hapter foc uses on c ap i-
tal costs, because they are the critical componentof the overall costs of changing automobile de-
signs. On a p er ca r basis, however, labor and ma-terials costs will remain higher than capital costsbecause of the ways different types of costs arealloc ate d. The c osts of c ap ital g ood s (includingfinanc ing) are rec overed throug hout their servic elife in vehic le prices. Since cap ital good s are used
to p rod uc e many vehicles over ma ny years (atleast 30 years for plants, 12 years for much pro-duc tion equipment, and 3 to 5 yea rs for spe c ialtooling), each vehicle bears a relatively small per-centage of the costs of capital to produce it. Incontrast, labor services and materials are effec-
tively bought to manufacture each car.Relative to other manufacturing costs, capital
costs are expected to undergo the greatest per-centage increase as manufacturers increase their
output of fuel-efficient vehicles. Moreover, capitalcosts are becoming proportionately greater be-cause capital goods are being purchased at fasterrates and at higher real prices than historically,and because automotive production is becomingmore capital-intensive as automation proceeds—i.e., more ca pital eq uipm ent is be ing used to p ro-
duce automobiles relative to labor, materials, andother inputs. Consequently, capital costs willhave an especially pronounced influence on thefinancial health of automobile manufacturers overthe next two decades.
Investments to Raise Fuel EconomyTechnology-Specific Costs
Table 30 presents capital cost estimates pre-pa red by O TA for the tec hnologies de sc ribe dearlier in this chapter, based on discussions withindustry analysts and the most recently published
analyses. However, they draw on the experienceand expectations of the mid and late 1970’s,
when limited consumer demand for fuel econ-omy led manufacturers to make conservative pro-
jections of vehicle design changes and high pro- jections of costs. Because of recent surges in the
demand for fuel economy and small cars, manu-facturers now expect to make substantial im-

8/14/2019 Increased Automobile Fuel Efficiency and Synthetic Fuels: Alternatives for Reducing Oil Imports
http://slidepdf.com/reader/full/increased-automobile-fuel-efficiency-and-synthetic-fuels-alternatives-for 136/292
132 Ž Increased Automobile Fuel Efficiency and Synthetic Fuels: Alternatives for Reducing Oil Imports
Table 30.—Post-1985 Automotive Capital Cost Estimates
$M/500,000 units Associated costs
Platform change Weight reduction, redesign . . . . . . . . . . . . . 500-1,000 R&Da, redesignMaterial substitution . . . . . . . . . . . . . . . . . . . 100-400 R&Da, materials, laborEngine change Improved Sib, diesel . . . . . . . . . . . . . . . . . . . 50-250
New Sib, diesel, DISCC
. . . . . . . . . . . . . . . . . . 400-700R&Da, redesign
Transmission change Improve contemporary drivetrains. . . . . . . . 100-400 R&Da, redesignNew drivetrains—CVTd, energy storage,
engine on-off. . . . . . . . . . . . . . . . . . . . . . . . 500-700 R&Da, redesign%apital costs for accessory and iubricant Improvements and aerodynamic and rolling resistance reductions are not Includedseparately. They may in total cost about S50M1500,000, an amount within the range of error impiied by the above estimates.Note: aerodynamic improvements will be carried out with weight-reducing design changes; iubricant end tin changes arealready being made by suppliers and may continue as a regular aspect of their businesses; and some accessory Improvements
. are made regularfy and as accompaniments to engine redesigns.%park ignition.cDirect injection stratified charge.d~ntinuoualy variable transmission.
SOURCE: Office of Technology Assessment.
provements in fuel ec onom y by the mid-1980’ sby accelerating technological change schedulesand by increasing the proportion of small cars inthe sales mix.
Note that increasing production volume for ex-
isting models is much cheaper than introducingnew mo dels; U.S. manu fac turers c ould p roba b ly
doub le their outp ut of m any existing mod els. Thecosts of design changes in the post-1985 periodnow seem even more uncertain, because earlier
achievements will leave fewer and generallymore costly options available.
Projecting costs for specific design changes is
difficult, for several reasons. First, the redesignof any one vehicle component or subsystem often
nec essitates rela ted changes elsewhere. Sec ond ,
such changes may require new production pro-c esses. Third , ac tua l co sts to individua l ma nufac -turers are technology-specific and sensitive to sev-
eral factors—technological development, produc-tion volume, vertical integration, the rate at which
changes penetrate the fleet, and available manu-facturing facilities. These factors are discussedbelow.
Technological Development.–Many technolo-
gies are inherently expensive due to materials re-
quirements or complexity of design or manufac-ture. The diesel engine for passenger cars is agood example. Over time, experience with a new
tec hnology m ay lead to some c ost reduction.
Production Volume.–Costs vary with p roduc -tion volume because equipment and processesare designed such that average product cost islowest once a threshold production volume isach ieved .24 Because this minimum volume orscale grows as the production process becomesmo re highly automa ted , the rising c ap ita l inten-siveness of automobile production increases the
sensitivity of unit costs to production volume.Operating costs (comprised of labor, materials,and allocated marketing and administration costs)per unit are sensitive to production volume in the
short term. For example, Ford’s operating costsper dollar of sales were estimated to be under$0.90 in the first quarter of 1979, but subsequentsales declines brought them close to $1.05 by thefourth quarter of 1980.25
The c ost e stima tes in ta b le 30 assume uniform500,000-unit capacities. * Cost estimates for uni-form or optimal capacity levels provide a bettermeasure for spending levels for the industry asa whole than for individual manufacturers be-c ause ind ividua l firms ac quire d ifferent levels ofcapacity at different costs according to their finan-
Z4S& K. Bhasker, “The Future of the World Motor Industry” (New
York: Nichols Publishing Co., 1980.) The optimum productionvolumes may change with manufacturing technology, however.‘s’’ Ford’s Financial Hurdle: Finding Money is Harder and Harder,”
Business Week, February 1981.*This procedure was aiso employed in the Mellon Institute study
(Ref. 32) which drew on data provided by automobile manufac-turers.

8/14/2019 Increased Automobile Fuel Efficiency and Synthetic Fuels: Alternatives for Reducing Oil Imports
http://slidepdf.com/reader/full/increased-automobile-fuel-efficiency-and-synthetic-fuels-alternatives-for 137/292
Ch. 5—Increased Automobile Fuel Efficiency 133
cial ability, sales volume, and technological op-
tions. The costs of acquiring more or less thanoptimal capacity, however, are not linearly re-lated to the level of capacity.
Vertical Integration. —Vertica l integ ration re-fers to the degree to which a manufacturer is self-
sufficient in production or distribution. integra-tion c an red uc e c osts in two wa ys: 1 ) by eliminat-ing activities and costs associated with the transferof goods between suppliers and distributors (deal-
ers), and the a utoma kers them selves; and 2) byena bling m anufa c turers to o ptimize the flow ofprod uc tion and d istribution. Major U.S. auto mo -bile manufacturers are highly integrated com-pared with firms in many other industries, al-though they are much less integrated than oilcompanies. Various U.S. automobile firms makesteel, glass, electronic components, and robots,but overall they buy about ha If of their materials
and other supplies. GM’s greater vertical integra-tion relative to other U.S. auto mo bile m anufa c -turers is one reason for its lower manufacturingcosts. The high e ffec tive degree o f vertical integra-
tion among Japanese auto manufacturers (over80 percent for some firms) helps to make autoproduction in Japan cheaper than in the UnitedStates. *
Rate of Change.–The rate at which new tech-nology is incorporated in automobiles influences
cost in three important ways. First, the faster adesign is implemented, the shorter are the prod-
uct development, product and process engineer-ing schedules, and the less likely is productionto b e a t m inimum c ost, given sc ale. Sec ond , in-creasing the rate of technological change raisesthe number and magnitude of purchases fromsuppliers. Third, a faster ra te o f c hange c an ma kefacilities and processes technologically obsolete,
necessitating investments in replacements before
original investments are recovered.
Available Facilities.—Opportunities for manu-facturers to redesign their product lines areshaped by the characteristics of their base vehi-
c les and existing p roduc tion fac ilities. The tec hno-logica l sc ena rios de sc ribe d at the b eg inning o f
*These conditions reflect peculiarly close relationships betweenJapanese manufacturer and supplier firms, even in the absence offormal linkages.
this chapter illustrate how paths of change maydiffer.
Estimates of manufacturing costs require evalu-
ation of the requirements for implementing eachcombination of new technologies. Investment bydifferent manufacturers to produce the same ve-
hicle w ill differ be c ause their initia l fac ilities andvehicle designs provide different bases forchange, and because manufacturers have choicesin the timing and extent of major facility renova-tions, in balancing plant renovation and new con-
struction, and the selection of new productionequipment—e.g., degree of automation. Differentproduction bases make rapid change more costly
for some manufacturers than for others.
The variability in actual facilities costs is illus-trated by recent projects associated with newvehicle designs. Chrysler spent over $50 million
to renovate its Newark assembly plant to produce1,120 K-cars per d ay. * Chrysler ma de simila r al-terations to its Jefferson Avenue (Detroit) assem-bly plant to enable K-car production at the samerate as at the Newark plant, but at a cost of$100million. GM plans to spend $300 million to $500million to build a new Cadillac assembly plant(replacing two old ones) on the Chrysler DodgeMain site in Michigan. The differences in thesespending levels reflect different starting points and
differing objectives. Since automation, qualitycontrol, and nonproduction aspects of the aboveprojects c ontribute to o ther goa ls in a dd ition to
higher fuel economy, these examples illustratehow d iffic ult it is to infer the spec ific c osts of in-vestments to raise fuel ec onom y.
New Car and Fleet Investments
The incremental investments manufacturersma ke to raise a utomob ile fuel effic iency will af-
fect the costs of producing new cars and new-
car fleets. To g ag e the effec t of changing automo-
tive technology on industry investment require-
ments, the costs of capacity associated with the
high- and low-estimate scenarios were estimated
*The project entailed new plant layout; body shop renovation;
conveyor system replacement and rearrangement; assembly tool-ing replacement; installation of automatic and computerized ma-chine welding, transfer, and framing equipment; installation of newpainting, front-end alignment, trim and cushion assembly equip-ment and additional quality control systems.

8/14/2019 Increased Automobile Fuel Efficiency and Synthetic Fuels: Alternatives for Reducing Oil Imports
http://slidepdf.com/reader/full/increased-automobile-fuel-efficiency-and-synthetic-fuels-alternatives-for 138/292
134 q Increased Automobile Fuel Efficiency and Synthetic Fuels: Alternatives for Reducing Oil Imports
by w eighting and ad ding the c osts of spe c ificc hang es. This proc ed ure p rod uces c rude esti-mates of the investments necessary to producecars at fuel efficiencies projected in the scenar-ios. * Tab le 31 presents investment p rojec tions byscenario and by 5-year periods, and tables 32-34present the derivation of table 31 in somewhat
more detail.
*Assuming that each technology is applied across the fleet at effi-cient volume, the calculations can be performed on a per-500,000unit basis and scaled up or down to determine overall or impliedper unit investments. The average investment to produce each sizeclass in each period with projected technological characteristicsmay be calculated by weighing the cost of each technology (table30) by its proportion of application and summing the weightedinvestments.
Adding the costs of specific technologies taken
sep arately—for which c ost d ata are a vailab le—isan imprecise way of estimating the costs of tech-nology combinations embodied in new automo-biles and fleets, because it does not capture thecosts of implementing changes together. Very ac-
curate investment estimates can be made by eval-
uat ing fo r spe c ific new auto mo bile d esigns thep lant-by-plant c hange s in co sts (for everythingfrom property and construction to engineeringand equipment to taxes), accounting for variouseconomies (concurrent and sequentially intro-duced technologies may share plant, equipment,even special tooling) and extra costs for minorc hang es to the c ar during p rod uction.
Table 31.—Summary of Investment Requirements Associated With Increased Fuel Efficiency
High estimatea Low estimatea
Year Units Large Medium Small Large Medium Small1985-90 . . . . . . . . . . . . $Mil./5OO,OOO 900-1,740 820-1,660 780-1,600 490-1,000 480-1,000 450-1,000$/car 180-350 160-330 150-320 100-200 100-200 90-200
1990-95 . . . . . . . . . . . . $Mil./5OO,OOO 570-1,100 570-1,100 610-1,200 520-940 520-930 500-900$/car 110-230 110-230 120-240 100-190 100-190 100-180
1995-2000 . . . . . . . . . . $Mil./5OO,OOO 350-950 370-980 350-050 480-860 520-930 500-900$/car 70-190 70-200 70-190 100-170 100-190 100-180
a
See table 23 and 24 for definitions of these scenarios.
SOURCE: Office of Technology Assessment.
Table 32.—Average Capital Investments Associated With IncreasedFuel Efficiency by Car Size and by Scenario (1985=90)
Percent of production facilities that incorporatenew technologies or are redesigned
High estimate Low estimate
Large Medium Small Large Medium Small
Engines SIE a $50-250M/500,000 . . . . . . . . . . . . . . . . . . . . 30 70 95 60 80 100Prechambe b $400-700 M/500,000. . . . . . . . . . . . 15 — 5 15 10Open chamberC $400-700M/500,000 . . . . . . . . . 30
—
20 —
Transmissions Four-speed auto and TCLUd
$300-500M/500,00 . . . . . . . . . . . . . . . . . . . . . . 70 70 70 50 50 50
Platform Various e $500-1,000 M/500,000 . . . . . . . . . . . . . . 100 100 100 50 50 50
Capital costs for technology changes weighted average)
Total $M/500,000. . . . . . . . . . . . . . . . . . . . . . . . . $905-1,740 $825-1,665 $778-1,623 $490-1,005 $480-1,020 $450-1,000Per car (total÷500,000÷10)f . . . . . . . . . . . . . . . $181-348 $165-333 $156-325 $98-201 $96-204 $90-200
%ark-ignition engine.
bPrechamber diesel.Cown chamber dlegel or open chamber stratified charge.dFour.g~~ automatic with torque converter lockup.weight reduction, material aubstitutlon, aerodynamic and rolling resistance reductions, improved lubricants end assessories.fvehicle change inve9tment9 are divided by 10 tO approximate amortization practices. Forty percent of capital spending goes for plant (30 year) and equipment (12
years), which may together be summarized as “fecllities” and amortized over 15 years (Ford Motor Co. interview) 0.4x3+0.6x 15 = 10.2 or about 10 years.
SOURCE: Office of Technology Assessment.

8/14/2019 Increased Automobile Fuel Efficiency and Synthetic Fuels: Alternatives for Reducing Oil Imports
http://slidepdf.com/reader/full/increased-automobile-fuel-efficiency-and-synthetic-fuels-alternatives-for 139/292
Ch. 5—Increased Automobile Fuel Efficiency 135
Table 33.—Average Capital Investments Associated With IncreasedFuel Efficiency by Car Size and by Scenario (1990-95)
Percent of production facilities that incorporatenew technologies or are redesigned
High estimate Low estimate
Large Medium Small Large Medium SmallEngines
SIE $400-700 M/500,000 . . . . . . . . . . . . . . . . . . . . 15 25 35 25 35 50Prechamber $400-700 M/500,000 . . . . . . . . . . . . – — — 30 20Open chamber $400-700 M/500,000 . . . . . . . . . . 40
—
30 30
Transmissions CVT, four-speed auto and TCLU
$500 -700 M/500,00 . . . . . . . . . . . . . . . . . . . . . . 35 35 35 50 50 50Engine on-off $500-700 M/500,000 ... , . . . . . . . 15 15 15
Platform Various $100-400 M/500,000 . . . . . . . . . . . . . . . . 100 50 50100 100 50
Capital costs for technology changes Total $M/500,000 . . . . . . . . . . . . . . . . . . . . . . . . . $570-1,135 $570-1,135 $610-1,205 $520-935 $520-935 $500-900
Per car(total =500,000 +10). . . . . . . . . . . . . . . . $114-227 - $104-187 $104-187 $100-180
SOURCE: Office of Technology Assessment.
Table 34.—Average Capital Investments Associated With IncreasedFuel Efficiency by Car Size and by Scenario (1995.2000)
Percent of production facilities that incorporatenew technologies or are redesigned
High estimate Low estimate
Large Medium Small Large Medium Small
Engines SIE $400-700 M/500,000 . . . . . . . . . . . . . . . . . . . .Open chamber $400-700 M/500,000 . . . . . . . . . .
1535
1540
35
15
1530
2530
1040
Transmissions CVT improved $100-400 M/500,00 . . . . . . . . . . .CVT $500-700 M/500,000 . . . . . . . . . . . . . . . . . . .Engine on-off $500-700M/500,000 . . . . . . . . . . .
Platform Various $100-400 M/500,000 . . . . . . . . . . . . . . . .
50 —
—
50 —
—
50 —
—3515
3515
35
15
100 100 100 50 50 50
Capita/ costs for technology changes Total $M/500,000 . . . . . . . . . . . . . . . . . . . . . . . . .Per car (total÷500,000÷ 10). . . . . . . . . . . . . . . .
$375-985$74-197
$350-950$70-190
$350-950$70-190
$480-865$96-173
$520-935$104-187
$500-900$100-180
SOURCE: Office of Technology Assessment.
The Transportation Systems Center of the U.S. engineering changes that are beyond the scopeDep artment o f Transporta tion, for exam ple, has of this report, and speculative for the 1990’s.developed a “surrogate plant” methodology to
do this. The a c c urac y of this ap proac h is based Note that investment figures presented here ap-
on detailed consideration of vehicle designs and ply only to investments required to raise the
the corresponding equipment and plant needs. fuel economy of cars sold in the United States.The metho dolog y req uires spec ific p rojec tions of Tota l ca pita l spe nd ing repo rted b y U.S. manufac-
98-281 f) - 82 - 10 : ;~ 3

8/14/2019 Increased Automobile Fuel Efficiency and Synthetic Fuels: Alternatives for Reducing Oil Imports
http://slidepdf.com/reader/full/increased-automobile-fuel-efficiency-and-synthetic-fuels-alternatives-for 140/292
136 . Increased Automobile Fuel Efficiency and Synthetic Fuels: Alternatives for Reducing Oil Imports
turers also includes investment in nonautomobile
projects (such as truck and military equipmentproduction), investments in foreign subsidiaries,and spe nding for normal rep lac ement of wo rn-out capital and for capacity improvement and ex-
pansion.
Note also that not all of a given investment maybe associated with fuel economy improvement.For example, engines, transmissions, and car bod-
ies a re red esigned pe riod ica lly. Chang es of thissort cannot always be distinguished from thosemade for increased fuel efficiency, so the full cost
of t he investments show n in ta b le 31 should notbe allocated solely to fuel economy improve-ments.
The d iffic ulty of a lloc at ing c osts whe n a singleinvestment produces several distinct results is awell-known problem of ac co unting,26 and thereis no fully satisfactory method for making the allo-
cations. For the purposes of the fuel savings costanalysis in the next sections, it is assumed thatthe percentages shown in table 35 represent theshare of investment costs attributable to increasesin fuel economy. Engine and body redesigns aremade for many reasons other than fuel efficien-c y. On the other hand, most of the advancedmaterials substitution (to plastics and aluminum)
Z6A ~. _fho-mas, “The Allocation Problem in Financial Account-
ing Theory” (Sarasota, Fla.: American Accounting Association,1969), pp. 41-57, and A. L. Thomas, “The Allocation Problem: Part
Two” (Sarasoto, Fla.: American Accounting Association, 1974.)
assumed in the scenarios, or automatic enginecutoff, probably would not be incorporated intoc ars by 2000 without t he imp etus for increasedfuel efficiency. Advanced transmissions representan intermediate case between these extremes.
The total capital investment associated with the
production of fleets of given size mix is calculatedby taking an appropriately weighted sum of in-vestments by size class. Assuming that U.S. new-car sales average 11.5 million units in 1985-90,11.7 million units in 1990-95, and 12.1 millionunits in 1995-2000 (conforming to growth ratesprojected earlier in this chapter); and assumingthat imports throughout the 1985-2000 period av-erage 25 percent of all sales (near recent levels),
foIlowing the high-estimate scenario for the 15-year period may require $30 billion to $70 billionin investments and R&D expenditures. Follow-ing the low-estimate scenario may require about
$25 billion to $50 billion (see table 36). if new-carsales are lower due to continued recession andconsumers’ stagnant real disposable income, thenthe investments would be proportionately small-er. For example, if domestic sales remain at 8 mil-lion vehicles per year (6 million domestically pro-duced) between 1985 and 2000, then capital in-vestments would be about two-thirds as large as
shown in table 36 (but R&D costs could remain
Table 36—Total Domestic Capital investments forChanges Associated With Increased Fuel
Efficiencya(billion 1980 dollars)
Table 35.—Percentage of Capital InvestmentsAllocated to Fuel Efficiency
Percentage of investmentCategory allocated to fuel efficiency
Engine. . . . . . . . . . . . . . . . . . . . 50Transmission:
CVT, four- and five-speedauto and TCLV . . . . . . . . 75
Energy storage andengine on-off . . . . . . . . . . 100
Platform:Weight reduction
(body redesign) . . . . . . . . 50Materials
substitution . . . . . . . . . . . 100
Composite of all efficiencyrelated investments:
1985-90 . . . . . . . . . . . . . . . . . 55-851990-95 . . . . . . . . . . . . . . . . . 70-801995-2000 . . . . . . . . . . . . . . . 65-75
SOURCE: Office of Technology Assessment.
Time of investment High estimateb Low estimateb
High car sales a
1985-90 . . . . . . . . . . . . . . .1990-95 . . . . . . . . . . . . . . .1995-2000 . . . . . . . . . . . . .
Total. . . . . . . . . . . . . . .
Low car sales 1985-90 . . . . . . . . . . . . . . .1990-95 . . . . . . . . . . . . . . .1995-2000 . . . . . . . . . . . . .
Total . . . . . . . . . . . . . . .
14-29
10-20
7-18
8-179-16916
31-67
10-20
7-14
4-12
21-46
26-49
6-126-116-11
18-34assumptions about car sales:
High car sales
1985-90 . . . 11.5 million cars/yr1990-05 . . . . . . 11.7 million cars/yr1995-2000. . . . 12.1 million cars/yr
Low car sales 1985-2000. . . . 8 million cars/yr
Estimates also assume that imports average 25 percent of total car salesbetween 1985 and 2000.
bWithin the uncertainties, the Investment requirements are the same for all threesales-mix scenarios.
SOURCE: Office of Technology Assessment.

8/14/2019 Increased Automobile Fuel Efficiency and Synthetic Fuels: Alternatives for Reducing Oil Imports
http://slidepdf.com/reader/full/increased-automobile-fuel-efficiency-and-synthetic-fuels-alternatives-for 141/292
Ch. 5—Increased Automobile Fuel Efficiency Ž 137 — .
the same). If this happens, total investments plus
R&D would be reduced by about 25 percent be-low those for the high car sales case.
The grea ter investments (pe r vehicle) a ssoc iated
with the high-estimate sc ena rio reflect t he fa c tthat the scenario contains more extensive
changes more often than the low-estimatescenario. In either case, however, there is nosignific ant differenc e in the tota l investme nt forincreased fuel efficiency for the different size-mix scenarios, since the rate of capital turnoverfor increased fuel efficiency is probably adequate
to a c c ommo da te the m ix shifts. *
OTA e stima tes of c umula tive investments im-ply that manufacturers would make capital invest-
ments of $2 billion to $5 billion per year (1980dollars) over about 15 years to implement thehigh-estimate scenario and about $2 billion to $3
billion per year to implement the low-estimatesc ena rio in the c ase of high c a r sa les. The c orre-sponding figures would be about $1.5 billion to$3 billion and $1billion to $2 billion, respective-ly, for low car sales.
Actual added capital spending levels by manu-facturers are likely to be lower than indicatedbecause some investments in technologies toraise fuel economy will take the place of invest-ments in more conventional technologies thatwould normally be made as plant and equipmentwear out. In fact, deducting the cost of changesthat wo uld ha ve bee n mad e under norma l cir-cumstances,** but are obviated by or could beincorporated in the investments shown in tables32-34, could reduce the added investment cost
of implementing the scenarios by two-thirds inthe high estimate and by about 80 percent in thelow estimate, leading to capital investments aver-
aging $0.3 billion to $0.7 billion pe r year for thelow estimate (high car sales) and $0.6 billion to$1.5 billion per year for the high estimate (highc ar sales) ab ove “ normal. ”
*On the average, over 50 percent of engines, transmissions, and
bodies are being redesigned during each 5-year period for increasedfuel efficiency, whereas the mix shift requires 10 to 20 percentchange during each 5-year period.
**Assuming “normal” capital turnover is: engines improved after6 years, on average, redesigned after 12 years; transmissions sameas engines; body redesigned every 7.5 years; no advanced materials
substitution.
Spe nding b y the a utomakers will be red uce dto the extent that they b uy rather than m ake va ri-
ous items; to the extent that U.S. suppliers pro-vide purchased items, the total investment levels
can be viewed as spending estimates for U.S.automakers and suppliers together. However,
joint ventures with foreign firms, erection offoreign p lants with foreign g overnment a id andrelatively labor-intensive designs, and purchases
of parts and knocked-down vehicle kits fromoverseas would all lower investment costs to U.S.firms. So would an increase in import penetra-tion. Finally, note that future levels of normalcapital spending, however they are determined,may be higher than past levels if competition fromforeign manufacturers makes it “normal” fre-quently spend to improve fuel ec onomy a nd tomodernize facilities.
Fuel Savings CostsTo c om pa re the costs and ga ins of sav ing fuel
by raising automobile fuel economy with thec osts and ga ins through o ther mea ns, it is usefulto express c osts in terms of a c om mo n mea suresuch as dollars per quantity of oil (gallons or bar-rels-per-da y) saved . To me asure t he total d ollars
per quantity of oil saved implied by raising fuelefficiency requires estimating changes in variable(labor and materials), fixed capital and R&D costs.
OTA was unab le to ob ta in or de velop reliab leva riab le c ost figures for te c hnolog ies d isc ussed
in this report, because information about variablecosts, which vary considerably between compa-nies, is proprietary and speculative for the 1990’s.
Four general observations about variable costsof raising fuel economy can be made: First, im-plementing some new technologies, includingcertain weight-reduction measures (e.g., smallerengines and body frames), will lower variablecosts by reducing labor and materials require-ments. Second, automation will lower labor re-quirem ents. Third , using som e new te c hno log ies,such as four- and five-speed transmissions anda lternative e ng ines, will raise va riab le c osts be-cause they are inherently more complex thanconventional technologies. Fourth, use of newma terials will ra ise va riab le c osts. The net c hangein variable costs is uncertain and will dependheavily on basic materials costs and the success
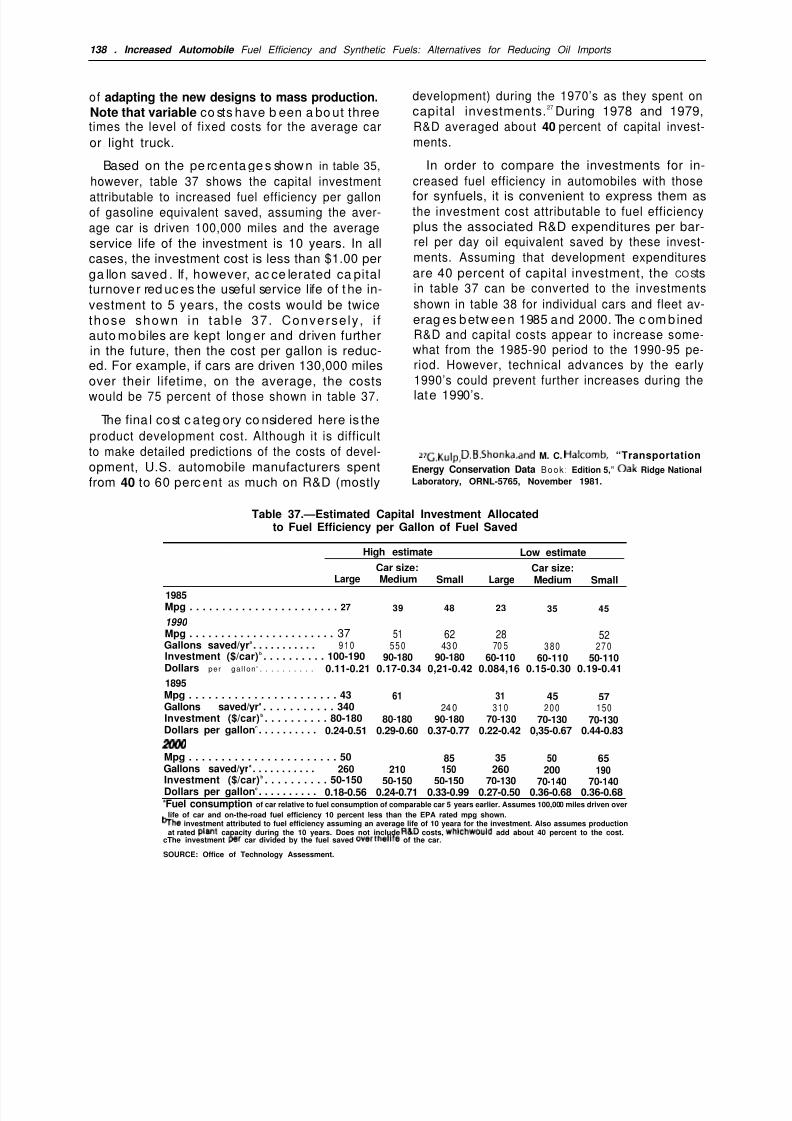
8/14/2019 Increased Automobile Fuel Efficiency and Synthetic Fuels: Alternatives for Reducing Oil Imports
http://slidepdf.com/reader/full/increased-automobile-fuel-efficiency-and-synthetic-fuels-alternatives-for 142/292
138 . Increased Automobile Fuel Efficiency and Synthetic Fuels: Alternatives for Reducing Oil Imports
of adapting the new designs to mass production.Note that variable co sts have b een a bo ut threetimes the level of fixed costs for the average car
or light truck.
Based on the pe rc enta ge s shown in table 35,
however, table 37 shows the capital investment
attributable to increased fuel efficiency per gallonof gasoline equivalent saved, assuming the aver-age car is driven 100,000 miles and the average
service life of the investment is 10 years. In allcases, the investment cost is less than $1.00 perga llon saved . If, however, ac ce lerated ca pitalturnover red uc es the useful service life of t he in-vestment to 5 years, the costs would be twicethose shown in tab le 37. Converse ly , i fauto mo biles are kept long er and driven furtherin the future, then the cost per gallon is reduc-ed. For example, if cars are driven 130,000 milesover their lifetime, on the average, the costswould be 75 percent of those shown in table 37.
The fina l co st c a teg ory co nsidered here is theproduct development cost. Although it is difficultto make detailed predictions of the costs of devel-
opment, U.S. automobile manufacturers spentfrom 40 to 60 perc ent as much on R&D (mostly
development) during the 1970’s as they spent oncapital investments.27 During 1978 and 1979,R&D averaged about 40 percent of capital invest-
ments.
In order to compare the investments for in-creased fuel efficiency in automobiles with those
for synfuels, it is convenient to express them asthe investment cost attributable to fuel efficiencyplus the associated R&D expenditures per bar-rel per day oil equivalent saved by these invest-ments. Assuming that development expenditures
are 40 percent of capital investment, the CO Stsin table 37 can be converted to the investments
shown in table 38 for individual cars and fleet av-erag es betw een 1985 and 2000. The c om b inedR&D and capital costs appear to increase some-what from the 1985-90 period to the 1990-95 pe-riod. However, technical advances by the early1990’s could prevent further increases during the
late 1990’s.
27G, Kulp, D. B. Shonka, an d M. C. Halcomb, “TransportationEnergy Conservation Data Book : Edition 5,” oak Ridge National
Laboratory, ORNL-5765, November 1981.
Table 37.—Estimated Capital Investment Allocatedto Fuel Efficiency per Gallon of Fuel Saved
High estimate Low estimate
Car size: Car size:Large Medium Small Large Medium Small
1985Mpg . . . . . . . . . . . . . . . . . . . . . . . 27 39 48 23 35 45
1990 Mpg . . . . . . . . . . . . . . . . . . . . . . . 37 51 62 28 52Gallons saved/yra . . . . . . . . . . . 9 10 55 0 430 70 5 3 80 27 0
Investment ($/car)b . . . . . . . . . . 100-190 90-180 90-180 60-110 60-110 50-110Dollars per ga l lon c . . . . . . . . . . 0.11-0.21 0.17-0.34 0,21-0.42 0.084,16 0.15-0.30 0.19-0.411895Mpg . . . . . . . . . . . . . . . . . . . . . . . 43 61 31 45 57Gallons saved/yra . . . . . . . . . . . 340 24 0 31 0 200 150
Investment ($/car)b . . . . . . . . . . 80-180 80-180 90-180 70-130 70-130 70-130Dollars per gallonc . . . . . . . . . . 0.24-0.51 0.29-0.60 0.37-0.77 0.22-0.42 0,35-0.67 0.44-0.83
Mpg . . . . . . . . . . . . . . . . . . . . . . . 50 85 35 50 65Gallons saved/yra . . . . . . . . . . . 260 210 150 260 200 190Investment ($/car)b . . . . . . . . . . 50-150
50-150 50-150 70-130 70-140 70-140Dollars per gallonc . . . . . . . . . . 0.18-0.56 0.24-0.71 0.33-0.99 0.27-0.50 0.36-0.68 0.36-0.68aFuel consumption of car relative to fuel consumption of comparable car 5 years earlier. Assumes 100,000 miles driven over
life of car and on-the-road fuel efficiency 10 percent less than the EPA rated mpg shown.%he investment attributed to fuel efficiency assuming an average life of 10 yeara for the investment. Also assumes production
at rated piant capacity during the 10 years. Does not include R&D costs, which wouid add about 40 percent to the cost.cThe investment ~r car divided by the fuel saved OVer t he life of the car.
SOURCE: Office of Technology Assessment.

8/14/2019 Increased Automobile Fuel Efficiency and Synthetic Fuels: Alternatives for Reducing Oil Imports
http://slidepdf.com/reader/full/increased-automobile-fuel-efficiency-and-synthetic-fuels-alternatives-for 143/292
Ch. 5—Increased Automobile Fuel Efficiency 139
Table 36.-Capital Investment Attributed toIncreased Fuel Efficiency Plus Associated
Development Costs per Barrel/Day of Fuel Saved
Capital investment plusNew-car fuel associated developmentefficiency at costs (thousand 1980$end of time per B/D oil equivalent
Car size period a (mpg) fuel saved)b
1985-90
Large. . . . . . . . .Medium . . . . . .Small. . . . . . . . .Average Ac . . . .Averge Bc . . . . .
1990-95 Large. . . . . . . . .Medium . . . . . .Small. . . . . . . . .Average A= . . . .Average Bc . . . .
1995-2000 Large. . . . . . . . .Medium . . . . . .
Small . . . . . . . .Average Ac . . . .Average Bc . . . .
28-3741-51
52-6238-4843-53
31-4345-6157-74
43-59
49-65
34-4950-71
65-8451-7058-78
19-5135-81
47-1oo21-57d
21-60d
53-12069-16089-200
58-120d
64-140 d
44-13057-17078-240
48-150d
50-150 d
“EPA rated 5W45 city/highway fuel efficiency of average car in each size class.bAsgume9 development costs total 40 percent of capital investments and that
a car is driven 10,000 miles per year on averge. A barrel of oil equivalent contains5.9 MMBtu.
c Averages A and B are based on the moderate and large mix shift scenarios,respectively.
d Averages are calculated by dividing average investment fOr technologicalimprovements by fuel savings for average carat end of time period relative toaverage car at beginning of time period. The resultant average cost per barrelpar day is lower than a straight average of the investments for each car sizebecause of mathematical differences in the methodology (I.e., average of ratiosv. ratio of averages) and because extra fuel is saved due to demand shift tosmaller cars. The averaging methodology used is more appropriated forcomparisons with synfuels because it relates aggregate investments toaggregate fuel savings. It should be noted that the cost of adjusting to the shiftin demand to smaller sized cars is not Inciuded. Only those investments whichincrease the fuel efficiency of a given-size car are included. However, giventhe rate of capitai turnover assumed for the scenarios, adjustments to the shift
In demand probably can be accommodated within the investment costs shown.SOURCE: Office of Technology Assessment.
Note that the costs and fuel savings benefit ofimproving fuel economy are incurred at differenttimes by different parties. Manufacturer (and sup-plier) investme nts are ma de prior to p rod uct ion:30 pe rc ent of c ap ita l spe nding o c c urs 12 to 24months before first production, 65 percent oc-curs within the 12 months preceding production,and 5 pe rc ent oc c urs afte r prod uc tion beg ins.28
R&D costs may occur 5 to 7 years before first pro-
duction. Fuel savings begin only after a vehicleis purchased, and they accrue over several years.Fuel savings benefit the consumer directly andthe industry only indirectly.
ZBHarbridge House, Inc., Energy C onservation and th e passengerCar: An Assessment of Existing Pub/ ic Po/icy, Boston, July 1979.
Consumer Costs
Automotive fuel economy improvements canaffect costs to consumers through changes in realcar purchase prices and changes in real costs ofmaintaining and servicing cars.
Prices
Trend s in ave rage c a r pric es a re e asier to p re-d ict than trend s in pric es for spec ific c a r classesor models, because manufacturers have flexibilityin pricing models and optional equipment. Real
car prices (on which consumers base their expec-tations) have been relatively stable over the last20 years (see fig. 12), although nominal car priceshave risen steadily since the mid-1960’s, because
of g ene ral inflation. Labo r and ma terials c ost in-creases are not necessarily passed on to consum-
ers. For example, the General Manufacturing
Manager of GM’s Fisher Body Division observedin a recent interview that although raw materials
and labor costs have been rising about 11 to 12percent annually, only 7 to 8 percent of thoseincreases have be en reco vered through p rice,with improvements in productivity helping tocontrol costs.
Figure 12.— Real and Nominal U.S. CarPrices, 1960-80
9
7
Price in 1980 dol lars (correc ted
6 with Consumer Pr ice - l r tdex) A
5
al
m 4
3
2
1
n1960 1965 1970 1975 1980
Year
SOURCE: Bob Clukas, Bureau of Economic Analysis, U.S. Department of Com-merce, private communication, 1981.

8/14/2019 Increased Automobile Fuel Efficiency and Synthetic Fuels: Alternatives for Reducing Oil Imports
http://slidepdf.com/reader/full/increased-automobile-fuel-efficiency-and-synthetic-fuels-alternatives-for 144/292
140 . Increased Automobile Fuel Efficiency and Synthetic Fuels: Alternatives for Reducing Oil Imports
W/here e xpenses increa se fa ster tha n p ric es,manufacturers can still make profits by charging
higher prices for those o pt ions or ca r mod els forwhic h c onsume r de ma nd is rela tively insensitiveto price. This flexibility is eroded when large pro-portions of automotive costs increase due to rapidand extensive c hange . Som e industry ana lysts ex-
pe c t that t hroug h the mid-1980’ s, large c ap italspending programs and real increases in laborand ma terials c osts will lead to increa ses in rea lc ar pric es of up to 2 perce nt pe r year (ap proxi-mately half of which reflects capital costs); more
rapid automotive change might lead to evengreater increases.29
Two pe rce nt of tod ay’ s average ca r price(about $8,000) is ab out $160, although p ric es ofindividual cars will rise by greater and lesseramounts. OTA’s scenario analysis suggests thatinvestment c osts alone for 5-yea r periods c ould
range fro-m $50 to $350 per car (assuming 10-yearam ortization p eriod s for plant a nd e quipme nt).The C ong ressional Budge t Offic e (C BO), for com -
parison, concluded that average automobile pro-
duc tion co sts ma y increa se b y ab out $560 be-tween 1985-95 because new technologies willco st that m uch (pe r ca r, on averag e) to imple-ment.
30These a nalyses ma y oversta te the ave rage
amount of capital cost increase, because whennew technologies replace old ones, the capital
costs charged to old “technologies” should drop
zgMaryann N. Keller, Status Report: Automobile Monthly Vehi -
c/ e Market Review, Paine Webber Mitchell Hutchins, Inc., NewYork, February 1981.
JoCongressional Budget O f f i c e , h./e/ ~COf10n7Y sta~~a~~s ‘or
Passenger Cars Afier 1985, 1980.
out of the vehicle cost calculation (unless oldequipment is made obsolete prematurely). Ac-tual cost increases will also depend on changesin variable costs, as illustrated below.
Table 39 show s two p lausible estima tes of c on-sumer costs (per gallon of fuel saved) for in-
creased fuel efficiency, based on the analysis inthis chapter. The lower costs are calculated as-suming that labor and material (variable) costs areno higher for more fuel-efficient cars than for cars
being produced in 1985.31 The higher costs in-clude variable cost increases that are twice aslarge as the c ap ital cha rge s assoc iated with in-creasing fuel efficiency .32
Although the range varies from costs that areeasily competitive with today’s gasoline prices tolevels much above those prices, OTA does notbelieve that future variable costs can be predictedwith sufficient accuracy to warrant more detailed
estima tes of va riab le costs. Tab le 39 should there-fore be viewed as illustrative; actual consumercosts will depend on many factors, including the
suc c ess of ne w prod uc tion tec hnologies.
31 Richard L, Strom botne, Director, Office of Automotive Fuel
Economy Standards, National Highway Traffic Safey Administra-tion, U.S. Department of Transportation, private communication,1981.JzRichard H. Shackson and H. James Leach, “Maintaining Auto-
motive Mobility: Using Fuel Economy and Synthetic Fuels to Com-pete With OPEC Oil,” Energy Productivity Center, Mellon Institute,Arlington, Va., Interim Report, Aug. 18, 1980. Variable cost changes
were deduced from the estimates of capital investment and changesin consumer costs by assuming an annual capital charge of 15 per-
cent of the investment and deducting this capital charge from theconsumer cost estimate.
Table 39.—Plausible Consumer Costs for Increased Automobile FuelEfficiency Using Alternative Assumptions About Variable Cost Increase
Consumer costa ($/gal gaso l ine saved)
Assuming no variable costAverage fuel efficiency at increase relative to 1985 Assuming variable cost increase equal
Time period Mix shift end of time period (mpg) variable costs of production to twice the capital charges
1985-90 . . . . . . Moderate 38-48Large 43-53 0.15-0.40 a
0.40-1 lob1990-95 . . . . . . Moderate 43-59
Large 49-65 0.35-0.85b
1.10-2.60b
1995-2000. . . . Moderate 51-70Large 58-78 0.30-0.95 b 0.90-2.80 b
“A”~u~e~ annual ~Wlt~ ~harwa of 015 times ~aplt”l investment ~loc”t~ to fuel efficiency, no discount of future savings, Md car drl~n 1(K),000 miles durtng itS lifetime.bwlthin the uncertalntieg the costs are the same for each mix shift.
SOURCE: Office of Technology Asseaament.
8/14/2019 Increased Automobile Fuel Efficiency and Synthetic Fuels: Alternatives for Reducing Oil Imports
http://slidepdf.com/reader/full/increased-automobile-fuel-efficiency-and-synthetic-fuels-alternatives-for 145/292
Ch. 5—increased Automobile Fuel Efficiency q 14 1
Individual car prices will not necessarily changein proportion to their costs, in any case. Spe-cifically, there are three reasons why it is difficultfor U.S. manufacturers to finance automotivechanges through price increases: competitionfrom lower cost imports, the relationship betweennew and used car prices, and limited consumer
willingness to tradeoff high car prices againstlower gasoline bills. First, because high fuel-economy imports from Japan cost about $1,000(1980 dollars) less than American-made cars,33
U.S manufacturers have little freedom to raiseprices without losing sales volume to imports (allthings equal). International cost differences maynarrow in the future, however, as foreign laborcosts rise and if U.S. productivity increases.
Second, the effective price of new cars for mostbuyers includes a trade-in credit on an older car.Decline in demand for used cars, which mightoccur if older cars were significantly less fuel effi-cient than new ones and if maximum fuel econ-omy were in demand, would effectively raise theprice of new cars. This phenomenon would hin-der a rapid mix shift.
Third, consumers may resist high prices for fuel-efficient cars because they tend to discount suchfuture events as energy cost savings rather heav-ily, by perhaps 25 percent or more,34 Discount-ing at high rates would cause consumers to de-mand relatively large amounts of fuel savings inreturn for a given increase in price. Each gallon
saved seems to cost more if consumers discountat high rates, because discounting reduces theperceived number of gallons saved over the lifeof the car.
This phenomenon can be illustrated as follows:The undiscounted lifetime fuel savings from rais-ing a car’s fuel economy from 45 to 60 mpg is557 gal; at a 25 percent discount rate the dis-counted savings is 227 gal (using a decliningschedule of yearly fuel consumption) or about
33LJ. S, ]ndustria/ Competitiveness: A Comparison of Stee( Ek -
tronics, and Automobiles, op. cit.34 Evidence of high consumer discount rates for energy- efficient
durable goods is presented in an article by J. A. Hausman, ‘Jlndivid-
ual Discount Rates and the Purchase and Utilization of Energy-UsingDurables,” Be//Journa/ of Economics, vol. 10, No. 1 (spring 1979),and in a “Comment” article by Dermot Gately in the same jour-nal, vol. 11, No. 1 (Spring 1980).
40 percent of the actual savings. If it costs $150to $350 per car to raise the fuel economy from45 to 60 mpg, the cost per gallon saved wouldbe $0.27 to $0.63 without discounting but about2.5 times as much, $0.66 to $1.54, if fuel savingsare discounted at 25 percent. Consumer behaviormay be at odds with the national interest, becausefuture savings of oil have a relatively low “social”discount rate for the Nation.
Maintenance
Automotive maintenance and service costs mayincrease with vehicle design change but theamount of increase depends on institutional aswell as technological change. Manufacturers aremodifying car designs to make servicing less fre-quent and less expensive, but—with more com-plex and expensive components in cars—thereis a definite potential for increased repair costs.
Also, use of new equipment, including electronicdiagnostic units, may lead to higher real costs forservice. For smaller shops, in particular, lack offamiliarity with new technologies and problemswith multiple parts inventories (necessary for serv-icing new- and old-technology cars) could addto consumer service costs. Because dealershipsand larger service firms are in a better positionto adjust to changing technology, they are likelyto gain larger shares of the service market.
Available estimates of service cost changes forfuture cars are very speculative. For instance,
CBO has estimated that maintenance and servicecosts associated with transmission improvements,adding turbochargers, and altering lubricantscould raise discounted lifetime maintenance costsof new cars by $40 to $90 on average (assuminga 10 percent discount rate). The actual changesin maintenance costs, however, will dependheavily on the success of development workaimed at maintaining automobile durability withchanging technology.
Electric and Hybrid Vehicles
Costs of producing electric (EV) and hybrid ve-hicles (EHV) will differ from those of producing
conventional vehicles. EVs substitute batteries,motors, and controllers for fuel-burning enginesand fuel tanks. Hybrid vehicles include most or

8/14/2019 Increased Automobile Fuel Efficiency and Synthetic Fuels: Alternatives for Reducing Oil Imports
http://slidepdf.com/reader/full/increased-automobile-fuel-efficiency-and-synthetic-fuels-alternatives-for 146/292
142 • Increased Automobile Fuel Efficiency and Synthetic Fuels: Alternatives for Reducing Oil Imports
all of the components of conventional vehiclesas well as EVs, but in modified forms. The com-ponents required for electric propulsion, whichcontribute directly to vehicle cost, further add in-directly to cost because they change the struc-tural requirements of the vehicle. The size andweight of batteries, in particular, increase the
need for space and structural strength,35
necessi-tating changes in vehicle design and weight in-creases.
Batteries are a major source of both direct andindirect cost. They may comprise 25 percent oftotal cost, depending on type, size, and capacity. *Batteries available for electric vehicles by 1990may be priced (1980 dollars) at $1,700 to $2,700(corresponding to production cost of $1,300 to$2,100) while advanced batteries available by2000 may be priced below $2,000 (with produc-tion cost around $1,500).36
Electric motors are smaller, lighter, and simplerthan internal combustion engines. Motor control-lers, however, are relatively bulky and may bemore expensive than the motors themselves, de-pending on their design. Motor-controller combi-nations likely to be available by 1990 may costaround $1 ,000. *
JSCBO, op. cit.*Batteries may comprise about 25 to 30 percent of the weight
of an electric vehicle and about 20 to 25 percent of the weight ofa hybrid vehicle. The electric motor and controller may compriseabout 10 percent of an electric or hybrid vehicle’s weight.
3qA/. M. Carriere, W . F. Hamilton, and L. M. Morecraft, General
Research Corp., Santa Barbara, Calif., “The Future Potential of Elec-tric and Hybrid Vehicles,” contractor report to OTA, August 1980.
*Battery size is a function of the number and size of constituentcells. Battery capacity—and therefore vehicle driving range—is afunction of the amount of energy deliverable by each pound ofbattery.
Estimates given in the report cited in footnote36 suggest that near-term EVs and EHVs wouldcost at least sO percent more than comparableconventional vehicles. Technological advancesin battery development could reduce electric andhybrid vehicle costs, however. Note that manu-facturers may initially set the prices of EVs close
to those of conventional cars to enhance theirappeal to consumers.
Methanol Engines
Production of automobiles designed to run onmethanol entails only minor modifications of theengine and fuel system. Consequently, the costincrease for engines designed to use methanolare minor. However, the cost of modifying an en-gine to operate efficiently on a fuel for which itwas not designed can be more significant. Oneestimate is that retrofitting a gasoline-fueled vehi-
cle for methanol use would cost $600 to $900,and redesigning an engine for methanol combus-tion would cost $50 to $100 per vehicle.37 Ford,which is converting several Escorts to methanolcombustion for the Los Angeles County EnergyCommission, estimates that necessary modifica-tions cost about $2,000 per vehicle, although theywould cost less if larger numbers of cars wereconverted.38
J~illiam Agnew, G.M. Research Laboratories, private communi-cation.36’’Ford Converts 1.6L Escorts for Methanol,” Ward’s Engine Up
date, Feb. 15, 1981.
APPENDIX A.–PROSPECTIVE AUTOMOBILE FUEL EFFICIENCIES
Table 5A-1 summarizes the prospective automobile The table indicates increases in fuel economy of 15fuel-efficiency increases used in OTA’s analysis. The percent at most for vehicles using improved S1 enginestechnologies involved are described in more detail compared with the baseline 1985 car—everything elsebelow. In addition, alternative heat engines are dis- remaining the same. Sources of such improvementscussed and the reasons for not including them in the include:
projections to 2000 are explained.q
More or Less Conventional Engines
There is more diversity among the engine technol- q
ogies listed in table 5A-1 than in any other category.
smaller engines, because lighter cars will not re-quire as much power and because the enginesthemselves will also continue to decrease inweight;decreases in engine friction–e. g., from new pis-ton ring designs, smaller journal bearing diame-

8/14/2019 Increased Automobile Fuel Efficiency and Synthetic Fuels: Alternatives for Reducing Oil Imports
http://slidepdf.com/reader/full/increased-automobile-fuel-efficiency-and-synthetic-fuels-alternatives-for 147/292
Ch. 5—increased Automobile Fuel Efficiency q 143
Table 5A-1.– Prospective Automobile Fuel= Efficiency Increases, 1986.2000
Percentage gain in fuel efficiency —
High estimate Low estimate
Technology 1986-90 1991-95 1996-20000 1986-90 1991-95 1996-2000
EnginesSpark-ignition (S1) . . . . . . . . . . . . . . . . . . . . . . . . 10 10-15 15 5 5-1o 5-1oDiesel:
Prechamber. . . . . . . . . . . . . . . . . . . . . . . . . . . . 15 15 15 15Open chamber . . . . . . . . . . . . . . . . . . . . . . . . . 25 35 35 20 20 25
Open chamber (S1) stratified charge (SC) . . . . 15 20Hybrid diesel/SC . . . . . . . . . . . . . . . . . . . . . . . . . 35
TransmissionsAutomatic with lockup torque converter . . . . . 5 5 5 5 5 5
Continuously variable (CVT). . . . . . . . . . . . . . . . 10 15 10Engine on-off . . . . . . . . . . . . . . . . . . . . . . . . . . . . 10 10 10
Vehicle systemWeight reduction (downsizing and
materials substitution) . . . . . . . . . . . . . . . . . . 8 13 18 4 8 10Resistance and friction (excluding engine)
Aerodynamics. . . . . . . . . . . . . . . . . . . . . . . . . . 2 3 4 1 2 3
Rolling resistance and lubricants . . . . . . . . . 2 3 1 1 2
Accessories . . . . . . . . . . . . . . . . . . . . . . . . . . . . . 2 3 4 1 1 2a Improvements in fuel efficiency are ~~pre~sed a9 percentage gain in mpg compared with an anticipated average 1985 passenger car. The 1985 average car used as
a reference has an inertia weight of about 2,500 lb, is equipped with spark-ignition engine, three-speed automatic transmission, and radial tires, and has an EPA mileagerating (55 percent city, 45 percent highway) of 30 mpg. The fuel efficiencies of the individual baseline cars, which are used to calculate future fuel efficiencies ineach size class, are given in tables 23 and 24. Percentages are given on an equivalent Btu basis where appropriate—e.g., for diasels, which use fuel having higherenergy content per gallon than gasoline, the percentage gain refers to miles per gallon of gasoline equivalent, which is 10 percent less than miles per gallon of dieselfuel. The table does not include efficiency improvements from alternate fuels such as alcohol.
SOURCE: Office of Technology Assessment
q
q
q
ters, increases in stroke-to-bore ratios, improvedengine oils;new combustion chamber designs, particularlyfast-burn chamber geometries that permit leanoperation at higher compression ratios;further refinements to electronic engine controlsystems (although most of the possible gains willhave been achieved by 1985); and
decreases in heat losses, consistent with allow-able thermal loadings of internal engine parts andthe octane ratings of available fuels.
Friction, which goes up with displacement, is a ma- jor source of losses in piston engines. Smaller enginescut friction losses, and also operate with less throt-tling—another source of losses—under normal driv-ing conditions. Turbocharging is one way to make theengine smaller, improving fuel economy without sacri-ficing performance-albeit at rather high cost. Addinga turbocharger can help a small engine meet transientpeak power demands and improve the driving-cyclefuel economy of both S1 and Cl engines by perhaps5 to 10 percent—provided economy and not perform-
ance is the goal. Further applications are possible ifthe benefits perceived by consumers outweigh theprice increases.
Bigger gains over the 1985 baseline S1 powered car
are possible with Cl engines (table 5A-1). In the past,most efforts on diesels have been directed at heavy-
duty applications such as trucks. Although the efficien-cy advantage of Cl engines relative to S1 engines de-creases as engines become smaller, considerablescope remains for improving the driving-cycle efficien-cy of passenger-car diesels. In particular, all dieselengines now used in passenger cars are based on a“prechamber” design (also termed indirect injection).The combustion chambers in such engines consist of
two adjoining cavities, with fuel injected into thesmaller prechamber. At present, prechamber engineshave several advantages for passenger vehicles. They
are quieter than open-chamber (or direct injection)diesels, have wider ranges of operating speeds, andlower-cost fuel injection systems; in addition, emis-sions control is easier and smoke limitations are notas serious. 39
As development of open-chamber diesels for pas-senger cars continues, substantial fuel-economy im-provements can be expected–perhaps 15 percentabove the levels that might be achieved with precham-ber diesels, themselves of course considerably betterthan S1 engines (table 5A-1 )—assuming NO X and par-
ticulate emissions can be controlled, and noise heldto acceptable levels. The efficiency advantages of the
open chamber engine stem largely from higher volu-metric efficiency, lower heat losses, and more rapid
39’’ Future Passenger Car Diesels May Be Direct injection, ” Auto-motive Engineering, June 1981, p. 51.

8/14/2019 Increased Automobile Fuel Efficiency and Synthetic Fuels: Alternatives for Reducing Oil Imports
http://slidepdf.com/reader/full/increased-automobile-fuel-efficiency-and-synthetic-fuels-alternatives-for 148/292
144 Increased Automobile Fuel Efficiency and Synthetic Fuels: Alternatives for Reducing Oil Imports
combustion. Estimates40
indicate that a 1.2-liter open
chamber diesel in an automobile with an inertiaweight of 2,000 lb should be able to achieve a 55/45EPA fuel-economy rating of 60 to 65 mpg (with a man-
ual transmission). Such estimates assume emissionsstandards for Cl engines that do not severely com-promise efficiency. Standards for NO X and for partic-
ulates—which, besides making diesel exhaust smoky,are health hazards—are the most difficult to meet. Ingeneral, measures that reduce NO X increase par-ticulate emissions, and vice versa. To some extent,diesel engines will probably face continuing sacrificesin fuel economy to meet emissions standards.
To emphasize efficiency gains rather than differ-ences in the energy content of various fuels, the dieselengine improvements listed in table 5A-1 are all based
on miles per gallon of gasoline equivalent. Becausediesel fuel contains more energy (Btu) per gallon thangasoline, miles per gallon of diesel fuel would be 10percent greater than miles per gallon of gasolineequivalent. For example, a 1990 prechamber diesel
is expected to be about 10 percent more efficient thanan S1 engine in the low estimate, but about 20 per-cent better in terms of miles traveled per gallon of fuel.
Stratified-charge (SC) engines (table 5A-1 ) are S1 en-gines that have some of the advantageous features ofdiesels–such as potentially higher efficiency and po-tentially easier control of emissions, although lowemissions levels have been difficult to achieve in prac-tice—as well as the disadvantages of diesels, such ashigher production costs. 41 SC engines, like diesels,operate with a heterogeneous distribution of fuel andair in the combustion chamber. But unlike diesels, theSC engines now in production burn gasoline and usespark plugs. SC engines, again like diesels, come in
two varieties–prechamber, such as the Honda CVCCengine that has been sold in the United States since1975, and open-chamber (also called direct injection).Prechamber engines have shown little if any fuel econ-
omy advantage, while open chamber SC enginespromise good efficiencies in theory but have not yetbeen successfully reduced to practice. As with open-chamber diesels, it has proven difficult to achievegood response and smooth operation over the rela-tively wide range of loads and speeds needed for pas-senger cars. Moreover, open-chamber SC engineshave the most potential in larger engine sizes; for asmaller engine operating at a higher load level—a situ-
ation now more prevalent—one of the major advan-
tages of the SC engine, its lower throttling require-ment, is less of a factor. Such an engine would be
401bid.
41J, A. Alic, op. cit.
more costly to produce than a conventional S1 engine,
though less expensive than a diesel.Another potential advantage of open-chamber SC
engines is their tolerance for a wide range of fuels—including both gasoline and diesel, as well as alcoholsand other energy carriers not necessarily based onpetroleum. The broad fuel-tolerance of SC engines has
led to a good deal of work directed at military applica-tions. Further, the low-emissions potential of SC en-gines provided early stimulus for R&D directed at auto-
motive applications. Open-chamber SC engines couldfind a place in passenger cars during the 1990’s if theremaining problems are overcome.
Another possible path leads to a merging of dieseland SC engine technologies (table 5A-1). This mightbe visualized as a diesel with spark-assisted ignition.Spark-ignition would increase the tolerance of the en-gine to fuels with poor ignition quality (i.e., to fuelswith a low cetane numbers such as gasoline or alco-hols), but the combustion process would be morenearly a constant pressure event, as in a diesel.
Gas Turbine, Brayton,and Stirling Engines
Prospects for other “alternate engines” remain dim;in particular, most alternatives to S1 and Cl enginesare poorly suited to small cars. Candidates include gas
turbines (i.e., those operating on a Brayton cycle), orthe Stirling cycle powerplants that have also beenwidely discussed for automotive applications. At pres-ent, such alternatives to S1 and Cl engines suffer manydrawbacks. Gas turbines, for example, would needceramic components to achieve high efficiencies atlow cost–most critically in the power turbine, be-
cause high turbine inlet temperatures are needed toraise the efficiency. Ceramics are inherently brittle,and a great deal of work remains to be done beforedurable and reliable engine parts can be mass-pro-duced from materials such as silicon nitride. The tech-nical problems are more severe for highly stressedmoving parts such as turbine rotors than for the appli-cations such as combustor heads envisioned for Stirl-ing engines. While the problems of developing toughceramics for high-temperature applications in energyconversion devices are receiving considerable R&Dsupport, success cannot be guaranteed. Even if the ce-ramics can be developed successfully this will not nec-
essarily suffice to make gas turbines (or Stirling-cycle
powerplants) practical for use in passenger cars.With or without ceramic components, automotive
gas turbines would, at least initially, be high in cost;and beyond high costs, they suffer a number of otherdisadvantages as automobile engines. Although gas

8/14/2019 Increased Automobile Fuel Efficiency and Synthetic Fuels: Alternatives for Reducing Oil Imports
http://slidepdf.com/reader/full/increased-automobile-fuel-efficiency-and-synthetic-fuels-alternatives-for 149/292
Ch. 5–Increased Autornobile Fuel Efficiency q 745
turbines are highly developed powerplants in the largesizes used for stationary power or for marine and air-craft applications (500 hp and above) and ceramiccomponents would allow higher operating tempera-tures and theoretically high efficiencies, turbineengines do not scale down in size as well as recipro-cating engines. Both compressors and power turbines
lose efficiency rapidly as their diameters decrease to-ward the sizes needed for smaller cars (75 hp andbelow). Brayton-cycle powerplants also have generally
poor part-load fuel economy–which is a severe dis-advantage in an automobile, where low-load opera-tion is the rule. Furthermore, they need complex trans-missions because the power turbine runs at speedsmuch higher than those of reciprocating engines.Fixed-shaft turbines, in particular, pose difficult prob-lems in matching engine operating characteristics toautomobile driving demands. But the most criticaldrawback of gas turbine powerplants is finally thatthey are unlikely to achieve competitive efficiencieswhen sized for small cars—those in the vicinity of
2,000 lb. As these size classes become a larger frac-tion of the market, the prospects for automotive gasturbines grow dimmer.
Stirling-cycle engines are at much earlier stages ofdevelopment. High efficiency in small sizes is a morerealistic possibility for a Stirling engine than for a gasturbine, but the costs of Stirling engines are likely tobe even higher than those for gas turbines 42 –and bothengines will probably always be more expensive tomanufacture than S1 engines. Like turbines, ceramiccomponents will be needed to achieve the best possi-ble efficiencies in Stirling-cycle powerplants–here themost immediate needs are probably in the heater headand preheater. Seals have also been a persistent block
to practical Stirling-cycle powerplants.Both gas turbine and Stirling engines–because com-
bustion is continuous–have intrinsic advantages inemissions control, and can burn a wide range of fuels.But intermittent-combustion engines (e.g., S1 and Cl)have thus far demonstrated levels of emissions con-trol adequate to meet regulations. Broad fuel toleranceis again not unique to gas turbine and Stirling engines.These advantages are probably not enough to over-come the drawbacks of such engines, at least over the
next 20 years.
Transmissions
Table 5A-1 lists a pair of developmental paths forautomatic transmissions. (Manual transmissions arenot explicitly included in the table; although more
42 ’’ Alternate Powerplants Revisited, ” Automotive Engineering,February 1980, p. 55.
American purchasers are now choosing manual trans-missions as small cars take a greater share of the mar-ket, automatics still predominate.) Geared automatictransmissions with lockup torque converters are al-ready available in some cars; these are straightforwardextensions of current technology, in contrast to contin-uously variable transmissions (CVTs). In principle, an
engine on-off feature—in which the powerplant canbe automatically shut off when not needed–could beimplemented with either system (or with manual trans-missions). Placing the engine drive shaft parallel towheel axles would also yield a small improvement infuel economy–because crossed axis gears could bereplaced by more efficient parallel axis gears, orchains.
Geared automatic transmissions with either three orfour speeds and a lockup torque converter-or witha split power path, an alternate method for m minimiz-ing converter slip and the consequent losses—arealready on the market. A fourth gear ratio gives a bet-ter match between engine operating characteristics
and road load demands. The fourth speed, for exam-ple, may function as an “overdrive” to keep engineload and efficiency high at highway driving speeds.Neither development—bypassing the torque converterwhen possible, or adding a fourth speed to an auto-matic transmission—is new, but the added costs ofsuch designs are now more likely to be judged worth-while. Many manual transmissions incorporate fiverather than four speeds for similar reasons—the added
gear benefiting fuel economy, as well as performanceat low power-to-weight ratios.
Although the efficiencies of manual transmissionsare greater than for automatics—that is, less of thepower passing through the transmission is dissipated–
the fuel economy achieved by many drivers may beas high or higher in cars equipped with an automatictransmission. By relying on the logic designed into thetransmission to chose the appropriate gear ratio forgiven conditions, wasteful driving habits–e.g., usinghigh engine speeds in intermediate gears–can oftenbe avoided.
Further improvements in the control systems forautomatic transmissions, as well as other changes suchas variable displacement hydraulic pumps, will helpto counterbalance their inherently lower efficiencies.In the past, automatic transmissions have dependedon hydromechanical control systems—just as engineshave. Hydromechanical control–although well devel-
oped and effective— limits the number of parametersthat can be sensed, as well as the logic that can be
employed. In the past, automatic transmissions havegenerally decided when to shift by measuring enginespeed, road speed, and throttle position. By movingto fully electronic control systems, a greater number

8/14/2019 Increased Automobile Fuel Efficiency and Synthetic Fuels: Alternatives for Reducing Oil Imports
http://slidepdf.com/reader/full/increased-automobile-fuel-efficiency-and-synthetic-fuels-alternatives-for 150/292
146 • Increased Automobile Fuel Efficiency and Synthetic Fuel: Alternatives for Reducing Oil /reports
of engine parameters can be measured, and moresophisticated control algorithms implemented—ena-bling the transmission to be “smarter” in selectingamong the available speeds. Electronics might also be
used with manual or semiautomatic transmissions tohelp the driver be “smarter.”
As pointed out above, increasing the number of
speeds in an automatic or manual transmission—fromthree to four or five–can help fuel economy. Althoughtrucks often have many more speeds (for reasons be-yond fuel economy), mechanical complexity (in auto-matics) and the demands on the driver (for manualtransmissions)—as well as rapidly diminishing returnswhen still more speeds are added—will probably con-tinue to limit the number of discrete gear ratios inpassenger-car transmissions to four or five. if, how-ever, discrete gearing steps can be replaced by a step-Iess CVT, then the engine could operate at the speedand throttle opening (or fuel flow for a diesel) thatwould maximize its efficiency for any road-load de-mand—i.e., engine speed would be largely independ-
ent of vehicle speed.43
If otherwise practical, such atransmission could give markedly better fuel economythan other automatic transmissions–provided the CVTitself was reasonably efficient. Smooth, shiftless opera-
tion is another potential advantage of CVTs.Continuously variable speed ratios can be accom-
plished in a variety of ways—e.g., the hydrostatic trans-missions sometimes used in farm and constructionequipment. A series hybrid electric vehicle—in whichthe engine drives a generator, with the wheelspowered by an electric motor, typically drawing frombatteries as well as the generator–in effect uses themotor-generator set as a CVT. Hydrostatic or electricCVTs are expensive and inefficient. CVTs used in past
applications to passenger cars have generally been all-mechanical—e.g., based on friction drives, or belts.Typically, such designs have been limited in powercapacity and life by wear and other durability/reliabil-ity problems.
At present, the most promising CVT designs arethose based on chains or belts. Continuing develop-ment may well overcome or reduce the significanceof their drawbacks relative to the fuel savings possi-ble. These fuel economy improvements could be ofthe order of 10 percent compared with a conventionalautomatic transmission—again, depending on the effi-ciency of the CVT. Fuel economy better than that ofa properly driven car with a manual transmission
would be more difficult to achieve. Although the CVT
43f3. C. chri~tenson, A. A. Frank, and N. H. Beachley, “The Fuel-
Saving Potential of Cars With Continuously Variable Transmissionsand an Optimal Control Algorithm, ” American Society of Mechani-cal Engineers Paper 75-WAIAut-20, 1975.
would permit the engine to operate more efficiently,poorer transmission efficiency would counterbalanceat least some of the savings. One reason that CVTsare expected to have lower efficiencies is the needfor a startup device, such as a torque converter, in ad-dition to the CVT mechanism itself. Given that the pro-duction costs of a CVT would also be higher than
those of a manual design—in part because of the start-up device—CVTs appear most likely to find a placeas replacements for conventional automatic transmis-sions.
The third transmission technology listed in table5A-1, engine on-off, has been placed in this sectiononly for convenience—it could just as well appear inthe engine category. “Engine on-off” systems, bywhich the powerplant can be automatically shut offduring coasting or when stopped at signal lights or intraffic, are in principle easy to implement. Indeed,when current engines are equipped with electronicfuel injection the fuel flow is sometimes cut off whencoasting above a predetermined speed. For an engine
on-off design to be practical (and safe), the enginemust restart quickly and reliably, and the operationof the system should not otherwise affect driveability—i.e., it should be operator-invisible, primarily a mat-ter of control system design. Engine on-off systems areunder development, and presumably will be imple-mented if the production costs prove reasonable com-pared with the expected fuel savings.
Vehicle Weight
The final group of technologies in table 5A-1–vehi-cle systems—includes several means of reducing pow-er demand, hence the fuel consumed in moving the
car. As discussed in the body of this chapter, the singlemost important means of reducing fuel consumptionis by reducing the weight of the vehicle; a 1 -percentdecrease in weight typically cuts fuel consumption by0.7 to 0.8 percent, provided engine size is reducedproportionately. Fuel consumption can also be les-sened by reducing air drag, frictional, and parasiticlosses–such as accessory demands.
The easiest way to decrease the weight of an auto-mobile is to make it smaller. In most newly designedcars, front-wheel drive is adopted to preserve interiorvolume, while considerable attention has been givento maximizing space utilization and removing un-needed weight. For cars of a given size, materials with
higher strength-to-weight ratios can be used wherecost effective, provided they meet requirements forcorrosion resistance and stiffness. Progress has alsobeen made by specifying less conservative margins ofsafety for structural design. Many of the steps takento reduce vehicle weight interact—i.e., taking weight

8/14/2019 Increased Automobile Fuel Efficiency and Synthetic Fuels: Alternatives for Reducing Oil Imports
http://slidepdf.com/reader/full/increased-automobile-fuel-efficiency-and-synthetic-fuels-alternatives-for 151/292
Ch. 5—Increased Automobile Fuel Efficiency q 14 7
out of one part of the car, perhaps by replacing 5-mphbumpers with 2-mph bumpers, allows secondaryweight savings elsewhere in the body and chassis.
In the future, big gains will be harder to achieve.Most of the waste space has already been taken outof newly designed American cars. Overhangs for styl-ing purposes are being reduced or eliminated, door
thicknesses decreased, space utilization in passengercompartments and trunks more carefully planned.Considerable progress can still be made through care-ful detail design, but the easiest steps are being taken.In the future, tradeoffs between space for passengersand luggage and the weight of the vehicle will be moredifficult to manage.
The two basic approaches to reducing weight are:1 ) to use materials which provide comparable per-formance characteristics but weigh less; and 2) todesign each component and subsystem with minimumweight as a primary objective—the latter more impor-tant now than in the past, when the costs associatedwith extra testing and analysis were harder to justify
through savings in materials and fuel. The first pathalso tends to raise the manufacturer’s costs becausesubstitute materials usually cost more.
Material characteristics most critical in automobilestructures are cost, strength, stiffness, and corrosionresistance. Costs—of the material itself, and of the fab-
rication processes that the choice of material entails—are in the end the controlling factors, as for most massproduced products. Nonstructural parts carry differentdemands but often less opportunity for saving weight(e.g., upholstery and trim, typically already plastics).
Iron and steel have been the materials of choice forbuilding cars and trucks–as for other mechanical sys-tems—because of their combination of good mechani-
cal properties and low cost. Iron castings have beenwidely used in engines and powertrain components,steel stampings and forgings in chassis members,bodies, and frames (now often unitized). Highlyloaded parts are generally made from heat treated al-loy steels–e.g., some internal engine components, aswell as gears, bearings, shafts. But elsewhere mild steelhas been chosen because it is cheap and easy to fabri-
cate; it can be easily formed and spot welded, givesa good surface finish, and takes paint well. Greaterquantities of high-strength, low-alloy steels are nowbeing specified–particularly for bumpers and morecritical structural applications such as door guardbeams; some new cars contain 200 lb of high-strength
steel, triple the amounts of a decade ago.44
Thinner
44H. E. Chandler, “Useage Update: Light, Longer Lasting SheetSteels for Autos, ” Meta/ Progress, October 1981, p. 24.
body parts with good corrosion resistance can bemade from galvanized or aluminized sheet steel.
The strength-to-weight ratio of inexpensive, low-strength steels can also be equaled or exceeded byalloys of aluminum and magnesium, as well as by non-metallic materials such as reinforced plastics. Alumi-num usage, now 115 to 120 lb per car, is expected
to reach 200 lb per car by 1990—mostly in the formof castings .45 Aluminum can substitute for iron andsteel in engines and transmissions—cylinder heads aswell as simpler, less critical components such as hous-ings, covers, and brackets. Magnesium and reinforcedplastics are other candidates for some of these appli-cations (use of magnesium is currently limited by highcosts, but these may come down in the future). How-ever, aluminum sheet for body parts and structuralmembers has been limited not only by high costs butby difficulty in spot welding–a problem that new alloycompositions are helping overcome.
A variety of plastics and fiber-reinforced composites –ABS, glass-reinforced polyester sheet molding com-
pound, reaction-injection molded polymers with orwithout reinforcement—are being specified for pro-duction parts; some have been used for years. Whilemore of these materials will be used in the future,GM’s Corvette–a high-priced specialty vehicle madein quantities small compared with most other domes-tic vehicles—remains the only mass-produced Ameri-can car with a glass-reinforced plastic body. Intro-duced nearly 30 years ago but never emulated, thisillustrates the continuing advantages of metals, particu-larly at high production levels.
In the past, plastics have generally been applied tononstructural parts. Polymer-matrix composites arenow candidates for some structural applications—one
1981 car had a fiberglass rear spring weighing 8 lb,compared with 41 lb for the steel spring it replaced. 46
Examples of related applications, none yet in produc-tion, are driveshafts and wheels. Other types of com-posites—i,e., laminates consisting of two metal layers,probably steel, sandwiching a plastic such as polypro-pylene–may have potential as body materials. Thethickness of the laminate makes it more rigid in bend-ing for a given weight, and the plastic dampens noiseand vibration; such laminates, like many other com-posite materials, are now too costly for widespreaduse. 47
4SH E chandler, “A Look Ahead at Auto Materials and f% OCeSSW
in the 80’s,” Meta/ Progress, May 1980, p. 24.4GI bid,47H. S. Hsia, “Weight Reduction for Light Duty Vehicles, 1980
Summary Source Document” (draft), Department of Transporta-tion, Transportation Systems Center, March 1981, p. 8-31.

8/14/2019 Increased Automobile Fuel Efficiency and Synthetic Fuels: Alternatives for Reducing Oil Imports
http://slidepdf.com/reader/full/increased-automobile-fuel-efficiency-and-synthetic-fuels-alternatives-for 152/292
148 q Increased Automobile Fuel Efficiency and Synthetic Fuels: Alternatives for Reducing Oil Imports
Improvements in steels and their applications stilloffer the greatest scope for near-term weight savingsin passenger cars—one reason is that the designer’s
job becomes more difficult when materials arechanged. But the manufacturing problems mentionedabove for aluminum as a body material—difficulty inspot welding, forming characteristics that call forchanges in die design—at least remain within therealm of conventional, mass production metalwork-ing techniques. Plastics and composites demand proc-
essing quite different from that used for metals—andhigh volume production of structural parts made fromsuch materials is new, not only for the automakers,but for virtually all industries. Furthermore, unconven-tional materials may need additional engineering anal-
ysis and testing–e.g., they are often susceptible to dif-ferent failure modes (such as environment-inducedembrittlement, or discoloring). In fact, the secondavenue for weight reduction is precisely an improve-ment in design methods.
With better methods for analyzing and controlling
the stress and deflection in the vehicle structure,weight can be reduced without sacrificing structuralintegrity. Through better understanding of the failuremodes of the materials used, as well as service load-ings, margins of safety can be reduced. Both analysisand testing are important to these objectives. Thegreatest strides have come from widespread adoptionby the automobile industry of finite-element methodsfor structural analysis, Not only can body and chassisstructures be designed with more precise control overstresses and deflections—eliminating unnecessary ma-
terial—but finite-element techniques can also help re-duce the weights of engines and other powertraincomponents; section sizes of engine blocks can be
decreased, for example.The weight reductions, hence fuel economy gains,that are possible through materials substitution arelimited primarily by costs–both material cost andmanufacturing cost. Graphite reinforcements for po-lymers perform better than glass, for example, but areconsiderably more expensive; at the highest strengthlevels, aluminum alloys, in addition to being expen-sive and difficult to form, cannot be welded. If thecosts justify the benefits in terms of fuel economy andother performance advantages—e.g., corrosion resist-ance—then automobile designers will choose new ma-
terials. In some cases, costs will come down as pro-duction volume increases, but there will always be a
point of diminishing returns. Nonetheless, continuedattention to detail design with conventional materials —with which the automakers have engineering andproduction experience–and improved methods ofstructural analysis, can give substantial reductions in
weight, as table 5A-1 indicates. Even though downsiz-ing and weight reduction will have proceeded consid-erably by 1985, improvements will continue—oftenrather gradually, as manufacturers gain confidence in,and experience with, new materials and improved de-sign methods.
Safety poses a further constraint on the selection ofstructural materials for automobiles. The tradeoffs be-tween vehicle size and occupant safety are discussedin chapters 5 and 10. For a vehicle of a given size,the mechanical properties of the structural materialsare one of the factors on which passenger protectiondepends. Because the structure needs to be able toabsorb large amounts of energy in a collision, thematerials should be capable of extensive plastic defor-mation, or else able to absorb energy by some alter-native process such as microfracturing while beingcrushed. This may limit applications of higher strengthmaterials—both metals and nonmetals—because ca-pacity for plastic deformation is inversely proportionalto strength; it may also pose difficult design problems
for some composite materials.
Aerodynamic Drag
A lighter automobile needs less power for accelera-tion and for constant speed travel and therefore con-sumes less fuel. A car with less aerodynamic dragburns less fuel at any given speed, but the powerneeded for acceleration is not directly affected.Because drag caused by air resistance is proportionalto frontal area and to speed squared, drag reductionhelps most at higher speeds–i.e., during highway driv-ing.
Smaller cars have less frontal area, hence less drag.But drag can also be reduced by making a car more“streamlined. ” This characteristic is quantified by thedrag coefficient-which has a value of 1.2 for a flatplate pushed through the air, but only 0.1 for a tear-drop shape. For complex geometries such as airplanes
or automobiles, drag coefficients can be preciselydetermined only by experiment. Extensive–and ex-pensive—wind tunnel testing is the basic techniquefor minimizing the drag coefficient of an automobile.
Theoretical aspects of the aerodynamics of groundvehicles are poorly understood, particularly for shapesas complex as automobile bodies. Interactions be-tween the stationary roadway and the moving car are
a particular problem. Drag reductions are sensitive notonly to overall vehicle shape—e.g., the sloped front-ends now common on passenger cars—but to relative-
ly subtle details–such as integration of the bumpersinto the front-end design, and the flow of air through

8/14/2019 Increased Automobile Fuel Efficiency and Synthetic Fuels: Alternatives for Reducing Oil Imports
http://slidepdf.com/reader/full/increased-automobile-fuel-efficiency-and-synthetic-fuels-alternatives-for 153/292
Ch. 5—increased Automobile Fuel Efficiency q 149
the radiator. Testing and experiment are required be-fore the final form can be chosen.
While typical cars of the early 1970’s had drag coef-ficients in the range of 0.50 to 0.60, many currentmodels have values closer to 0.45, or less; the 1982Pontiac 6000 has a claimed drag coefficient of 0.37. 48
Reductions to values of less than 0.35 are possible,
but eventually limited by practical compromises in-volving the utility of the vehicle (passenger and lug-gage space can suffer, as well as accessibility for re-pairs), safety (a streamlined design may compromisevisibility for the driver), and manufacturing costs(curved side glass can cut drag but is more expensive).’Even so, by 1990 drag coefficients may average 0.35or less. 49
Nonetheless, as table 5A-1 indicates, improvementsin fuel economy in the years past 1985 from continu-ing reductions in aerodynamic drag will be relativelysmall. The reasons are, first, that considerable progress
has already been made, and more can be expectedbetween now and 1985–and the returns from drag
reduction rapidly diminish (frontal areas are con-strained by the need to fit people into the car; no prac-tical vehicle could approach the lower limit drag co-efficient of the teardrop shape) —and, second, thatdrag reduction has the greatest benefits at high speeds,whereas most driving is done at lower speeds. In gen-eral, a 10-percent reduction in drag will yield an im-provement in driving-cycle fuel economy of perhaps2 percent. 50
Rolling Resistance
Even in the absence of air resistance, some fuelwould be burned in pushing a car at a constant speed.
This rolling resistance depends on tire characteristics,4BJ. Burton, “82 Pontiac 6000: A Step Further, ” Autoweek, Nov.
30, 1981, p. 10.49D. Scott, “Double LOOp cuts Wind Tunnel Size and Cost, ” Auto-
motive Engineering, May 1981, p. 69.SoAutomotive Fue/ Economy Program: Fitih Annual Report to the
Congress (Washington, D. C.: Department of Transportation, January1981), p. 119.
and on friction and drag in moving parts such as axlebearings. It also depends on the road surface (con-crete offers slightly less rolling resistance than asphalt).Most of the resistance is caused by deformation in thetires. Carcass design, tread pattern, and inflationpressure all affect resistance. Radial tires decrease re-
sistance compared with bias-ply carcasses, with fuel-economy improvements of 2 to 5 percent possible; 51
more aggressive tread patterns—e.g., snow tires—in-crease resistance; higher inflation pressures decreaseresistance.
Improved lubricants and bearing designs can alsocut resistance slightly, as can brakes with minimaldrag. However, more scope for fuel-economy im-provements through better lubricants exists elsewherein the vehicle—particularly in engines, but also intransmissions and rear axles—where more “slippery”oils, as well as design changes that minimize churn-ing and oil spray, can reduce viscous drag. Althoughdecreases in friction and rolling resistance benefit fueleconomy at low speeds almost as much as at high,
many of the possible gains have already beenachieved, or are in sight—thus, further improvementsafter 1985 will be small (table 5A-1).
Accessories
Some of the power produced by the engine is used,not to move the car or to overcome the engine’s inter-nal friction, but in driving pumps, fans, and acces-sories. To produce this power, fuel must be burned.Among the specific parasitic losses that automobiledesigners strive to minimize are those associated withcooling fans, air-conditioning compressors, power-steering pumps, and electrical loads supplied by the
alternator. Decreases are possible in many of these,as table 5A-1 indicates, though often at somewhatgreater cost. In some cases, downsizing the vehiclehelps to reduce or eliminate parasitic Iosses–e.g.,power steering may not be needed.
51 Ibid.
APPENDIX B.–OIL DISPLACEMENTPOTENTIAL OF ELECTRIC VEHICLES
Electric Vehicles and Electric Utilities petroleum-based electricity for vehicle recharging andthe fuel consumption of the car the EV replaces. Be-The extent to which electric vehicle (EV) technology cause of the limited performance of EVs, they would
can contribute to the national goal of reducing oil im- most likely be substitutes for relatively fuel-efficientports will depend on the availability and use of non- small cars. Also, because of the limited range and

8/14/2019 Increased Automobile Fuel Efficiency and Synthetic Fuels: Alternatives for Reducing Oil Imports
http://slidepdf.com/reader/full/increased-automobile-fuel-efficiency-and-synthetic-fuels-alternatives-for 154/292
150 q Increased Automobile Fuel Efficiency and Synthetic Fuels: Alternatives for Reducing Oil Imports
hauling capacity of EVs, it is assumed that they canreplace only 80 percent of the (10,000 miles per year)normal travel in a gasoline car. The remaining 2,000miles per year would have to be accomplished witha possibly rented gasoline-fueled car, which might beless fuel efficient than the small car that the EV re-placed. This latter complication was ignored, how-ever, so the results shown here are slightly more favor-
able in terms of net oil displacement than might bethe case in practice.
Figure 59-1 shows the consequences of introduc-ing EVs in terms of either increased petroleum use,or net petroleum savings, for alternative assumptionsabout automotive fuel economy. For example, refer-ring to the figure, if the fuel economy of the car re-placed by an EV is 60 mpg (case A), then one couldsave as much as 133 gal per year or increase petrole-um consumption by 123 gal (of gasoline equivalent)per year depending on whether, respectively, all ornone of the recharge electricity is petroleum-based. *As long as the fraction of petroleum used for generat-ing recharge energy for EVs in this case is less thanabout 50 percent, the introduction of EVs will resultin net petroleum savings. In case B, where a car thatachieves 40 mpg is replaced by an EV, the fractionof petroleum used for generating recharge energymust be less than about 80 percent to result in netpetroleum savings.
Utilities plan their capacity and operations to en-sure that the maximum instantaneous demand on thesystem, typically occurring at midday, can be met. This
*Assumes that electric vehicle recharge energy is 0.4 kWh/mile.
Figure 5B-1.-
implies that peakloads are satisfied with generatingcapacity that is idle at other times. A utility will thusrespond to demand fluctuations by using the most effi-
cient (“baseload” as well as “intermediate”) plantsas much as possible and progressively adding other“peaking” plants as loads increase. Baseload plants,which often cannot be adjusted rapidly (i.e., under2 hours) to respond to demand fluctuations, are eithernuclear, hydro, geothermal, or steam (oil, coal, or gas).Peaking plants can be operated for short-term re-sponse and are gas turbines fueled by oil or naturalgas and pumped-storage hydro. The ability of utilitiesto handle the additional load created by EVs will de-pend on such factors as total generation potential, theequipment and fuel mix, and the time pattern of de-mands. These characteristics generally vary by region(fig. 59-2) as illustrated in table 59-1,
Figure 59-3 shows a peak summer demand curveand equipment mix for an individual, representativeutility. Also shown are the likely changes in the loadprofile that would occur with the addition of EV loadsunder the following conditions: 1) recharging occursover 12 hours during the night when demands on thesystem are the smallest, 2) recharging occurs uniformly
during the day, and 3) recharging occurs during 2hours at midday. As long as the additional EV loadoccurs either at night or evenly throughout the day,this load could be accommodated by increasing base-Ioad output. Recharging over 2 hours during the daywould be satisfied with peaking plants.
Assuming that the available oil-fueled baseloadcapacity used for recharging EVs is proportional to theamount of oil-fueled baseload in the system, figure
‘Relationship Between the Net Fuel Savings From the Use oand the Fuel Used for Electric Generation
f EVs
I

8/14/2019 Increased Automobile Fuel Efficiency and Synthetic Fuels: Alternatives for Reducing Oil Imports
http://slidepdf.com/reader/full/increased-automobile-fuel-efficiency-and-synthetic-fuels-alternatives-for 155/292
Ch. 5—Increased Automobile Fuel Efficiency Ž 151
Figure 5B-2.— Regional Electric Reliability Council Areas
Council -
SOURCE: Department of Energy, Energy Information Administration, April 1978
5B-4 can be used to determine the fuel efficiency thatwould be required of a small automobile if the overaIloil consumption of the small automobile is to beequivalent to an EV in each region. For example, atone extreme, the Texas region uses not oil in its base-Ioad, so an EV always consumes less oil, and at theother extreme, in the northeast a gasoline-fueled carwould have to get about 50 mpg if it were to consume
an equivalent amount of oil as an EV. In terms of pre-mium fuel, * the extreme points are several hundredmpg in the midcontinent area and about 40 mpg in
the Texas region to achieve a fuel-use equivalence be-tween a small car and an EV.
The electricity requirements and oil/premium fuelsavings for an EV fleet which constitutes 20 percent*of the total vehicle fleet are shown in table 5B-2. Ascan be seen, as long as the EV fleet can be rechargedusing baseload capacity, regions should be able tomeet the additional load with existing available base-
Ioad capacity. In general, the Northeast, West, andSoutheast regions would utilize the greatest absoluteamounts of oil-fueled baseload capacity if EVs were
*A 20-percent market penetration is considered to be the upper*Oil + natural gas = premium fuel. bound on EV use through 2010,
~ B -291 ‘J - E 2 - 11 : ; 1, 3

8/14/2019 Increased Automobile Fuel Efficiency and Synthetic Fuels: Alternatives for Reducing Oil Imports
http://slidepdf.com/reader/full/increased-automobile-fuel-efficiency-and-synthetic-fuels-alternatives-for 156/292
152 . Increased Automobile Fuel Efficiency and Synthetic Fuels: Alternatives for Reducing Oil Imports
Table 5B-1.—Utility Capabilities by Region (contiguous United States) a
Percent of baseloadInstalled capacity Net capability Available baseload Available peaking that is fueled by:
Region b (x1O 3 MW) ( x 1 O3 MW) C capacity (x10 3 M W ) d capacity (x 1O 3 M W) eOil Gas
ECAR . . . . . . . . . . 84.9 79.1 19.6 1.3 6.7 0.2MAAC . . . . . . . . . . 44.0 40.6 7.1 2.2 35.3 0.0MAIN . . . . . . . . . . 43.1 39.9 7.6 0.6 12.7 1.1MARCA . . . . . . . . 25.4 24.4 5.1 0.8 2.5
0.9NPCC . . . . . . . . . . 50.9 49.8 11.4 2.3 60.4 0.0SERC . . . . . . . . . . 113.7 103.1 17.5 2.6 17.9 0.2SWPP . . . . . . . . . . 48.9 46.1 6.8 0.4 21.6 42.8ERCOT . . . . . . . . . 40.9 39.9 9.7 0,0 0.0 75.7WSCC . . . . . . . . . . 94.6 93.3 22.0 1.4 26.9 2.3
Total . . . . . . . . . 546.4 516.2 106.8 11.6 20,9 10.8%nless otherwlee indicated, data are taken from the 19M Summary, National Electric Reiiebility Council, Juiy 19S0.bSW att=h~ map in fia. 5B”2.
cNet cap~ility is calculated based on the ratio of Net Capability to Installed Capacity as reportad in the Electrlc paver A40rrtlr/Y, U.S. Department of l%erw, EmmyInformation Administration, August 19S0.dCalculation9 eggume that the total avaiiable capacity is atlocated between baseload and peaking capacity according to the ratio of peaking to baseioad CaPacltY within
the system. Total availabie capacity - (net capability) – (peakload).
SOURCE: Office of Technology Assessment.
Figure 5B=3.— Illustrative Load Profile With and Without Electric Vehicles
SOURCE: Office of Technology Assessmen\

8/14/2019 Increased Automobile Fuel Efficiency and Synthetic Fuels: Alternatives for Reducing Oil Imports
http://slidepdf.com/reader/full/increased-automobile-fuel-efficiency-and-synthetic-fuels-alternatives-for 157/292

8/14/2019 Increased Automobile Fuel Efficiency and Synthetic Fuels: Alternatives for Reducing Oil Imports
http://slidepdf.com/reader/full/increased-automobile-fuel-efficiency-and-synthetic-fuels-alternatives-for 158/292
Chapter 6
Synthetic Fuels

8/14/2019 Increased Automobile Fuel Efficiency and Synthetic Fuels: Alternatives for Reducing Oil Imports
http://slidepdf.com/reader/full/increased-automobile-fuel-efficiency-and-synthetic-fuels-alternatives-for 159/292
Page
Introduction . . . . . . . . . . . . . . . . . . . . . . . . 157Petroleum Refining . . . . . . . . . . . . . . . . . 157
Process Descriptions . . . . . . . . . . . . . . . . . 160Synfuels From Coal . . . . . . . . . . . . . . . . 161Shale Oil . . . . . . . . . . . . . . . . . . . . . . . . . 165
Synthetic Fuels From Biomass . . . . . . . . 167
Cost of Synthetic Fuels . . . . . . . . . . . . . . . 168Uncertainties. . . . . . . . . . . . . . . . . . . . . . 168Investment Cost . . . . . . . . . . . . . . . . . . . 170Consumer Cost. . . . . . . . . . . . . . . . . . . . 173
Developing a Synfuels Industry . . . . . . . . 175Constraints . . . . . . . . . . . . . . . . . . . . . . . 176Development Scenarios . . . . . . . . . . . . . 177
TABLESTable No. Page
40.
41.42.
43.
44.
45.
Analysis of Potential for UpgradingDomestic Refining Capacity . . . . . . . . 159Principal Synfuels Products . . . . . . . . . 160Average Cost Overruns forVarious Types of Large ConstructionProjects . . . . . . . . . . . . . . . . . . . . . . . . . 169
Selected Synfuels Processes andProducts and Their Efficiencies . . . . . . 171Best Available Capital and operatingCost Estimates for Synfuel PlantsProducing 50,000 bbl/d OilEquivalent of Fuel to End Users . . . . . 172Estimates of Cost Escalation in FirstGeneration Synfuels Plants . . . . . . . . . 172
Table No. Page
46.
47.
48.
494
50.
Consumer Cost of Various SyntheticTransportation Fuels . . . . . . . . . . . . . . 173Assumptions . . . . . . . . . . . . . . . . . . . . . 174
Effect of Varying Financial Parameters
and Assumptions on Synfuels’ Costs . 174Fossil Synthetic Fuels DevelopmentScenarios . . . . . . . . . . . . . . . . . . . . . . . 177
Biomass Synthetic Fuels DevelopmentScenarios . . . . . . . . . . . . . . . . . . . . . . . 180
FIGURES
Figure No. Page
13. Schematic Diagrams of Processes
14.
15
16
for Producing Various SynfuelsFrom Coal . . . . . . . . . . . . . . . . . . . . . . 162
Cost Growth in Pioneer EnergyProcess Plants . . . . . . . . . . . . . . . . . . . 169
Consumer Cost of Selected SynfuelsWith Various After tax Rates ofReturn on Investment . . . . . . . . . . . . . 174Comparison of Fossil SyntheticFuel Production Estimates . . . . . . . . . . 178
17. Synthetic Fuel Development
D.
Scenarios . . . . . . . . . . . . . . . . . . . . . . . 180
BOX
Page
Definitions of Demonstration andCommercial-Scale Plants . . . . . . . . . . . 179

8/14/2019 Increased Automobile Fuel Efficiency and Synthetic Fuels: Alternatives for Reducing Oil Imports
http://slidepdf.com/reader/full/increased-automobile-fuel-efficiency-and-synthetic-fuels-alternatives-for 160/292
Chapter 6
Synthetic Fuels
INTRODUCTION
Synthetic fuels, or “synfuels,” in the broadest
sense can include any fuels made by breakingcomplex compounds into simpler forms or bybuilding simple compounds into others morecomplex. Both of these types of processes are car-ried out extensively in many existing oil refineries.Current technical usage, however, tends to re-strict the term to liquid and gaseous fuels pro-duced from coal, oil shale, or biomass. This usagewill be followed in this report.
Synfuels production is a logical extension ofcurrent trends in oil refining. As sources of themost easily refined crude oils are being depleted,refiners are turning to heavier oils and tar sands.
Oil shale and coal, as starting materials for liquidhydrocarbon production, are extreme cases ofthis trend to heavier feedstocks.
Although synfuels production involves severalprocesses not used in crude oil refining, manycurrent oil refining techniques will be applied atvarious stages of synfuels processing. In order toindicate the range of currently used hydrocarbonprocessing techniques and to provide definitionsof certain terms used later in describing some syn-fuels processes, a brief description of common-ly used oil refining processes is given below. Fol-
lowing this are descriptions of coal, oil shale, andbiomass synfuels processes; an evaluation of syn-fuel economics; and a presentation of two plaus-ible development scenarios for a U.S. synfuelsproduction capacity.
Petroleum Refining
A petroleum refinery is normally designed toprocess a specific crude oil (or a limited selec-tion of crudes) and to produce a “slate” of prod-ucts appropriate to the markets being supplied.Refineries vary greatly in size and complexity. At
one extreme are small “topping” plants withproduct outputs essentially limited to the com-ponents of the crude being processed. At theother extreme are very large, complex refinerieswith extensive conversion and treating facilities
and a corresponding ability to produce a range
of products specifically tailored to changing mar-ket needs.
Refining processes include:
q
q
q
Atmospheric Distillation. –The “crude unit”is the start of the refining process. Oil underslight pressure is heated in a furnace andboiled into a column containing trays orpacking which serve to separate the variouscomponents of the crude oil according totheir boiling temperatures. Distillation (“frac-tionation”) is carried out continuously overthe height of the column. At several points
along the column hydrocarbon streams ofspecific boiling ranges are withdrawn for fur-ther processing.Vacuum Distillation. –Some crude oil com-ponents have boiling points that are too high,or they are too heat-sensitive, to permit dis-tillation at atmospheric pressure. In suchcases the so-called “topped crude” (bottomsfrom the atmospheric column) is further dis-tilled in a column operating under a vacuum.This lowers the boiling temperature of thematerial and thereby allows distillation with-out excessive decomposition.
Desulfurization. –Sulfur occurs in crude oilin various amounts, and in forms rangingfrom the simple compound hydrogen sulfideand mercaptans to complex ring com-pounds. The sulfur content of crude oil frac-tions increases with boiling point. Thus,although sulfur compounds in fractions withlow boiling points can readily be removedor rendered unobjectionable, removal be-comes progressively more difficult and ex-pensive with fractions of higher boilingpoints. With these materials, sulfur is re-moved by processing with hydrogen in thepresence of special catalysts at elevated tem-peratures and pressures. The “hydrofining,”“hydrodesulfurization,” “residuum hydro-treating, ” and “hydrodemetallation” proc-esses are examples. Nitrogen compounds
157

8/14/2019 Increased Automobile Fuel Efficiency and Synthetic Fuels: Alternatives for Reducing Oil Imports
http://slidepdf.com/reader/full/increased-automobile-fuel-efficiency-and-synthetic-fuels-alternatives-for 161/292
158 • Increased Automobile Fuel Efficiency and Synthetic Fuels: Alternatives for Reducing Oil Imports
and other undesirable components are alsoremoved in many of these hydrotreatingprocesses.Therma/ Cracking Processes, –Prior to thedevelopment of fluid catalytic cracking (seebelow), the products of distillation that wereheavier than gasol ine were commonly
“cracked” under high temperature and pres-sure to break down these large, heavy mole-cules into smaller, more volatile ones andthereby improve gasoline yields. Althoughthe original process is no longer applied forthis purpose, two other thermal crackingprocesses are being increasingly used. In vis-breaking, highly viscous residues from crudeoils are mildly cracked to produce fuel oilsof lower viscosity. In delayed coking, crudeunit residues are heated to high temperaturesin large drums and severely cracked to driveoff the remaining high-boiling materials forrecovery and further processing; the porousmass of coke left in the drums is used as asolid fuel or to produce electric furnace elec-trodes.Fluid Catalytic Cracking.—This process in itsvarious forms is one of the most widely usedof all refinery conversion techniques. It isalso undergoing constant development.Charge stocks (which can be a range of dis-tillates and heavier petroleum fractions) areentrained in a hot, moving catalyst and con-verted to lighter products, including high-octane gasoline. The catalyst is separatedand regenerated, while the reaction productsare separated into their various componentsby distillation.Hydrocracking. —This process converts awide range of hydrocarbons to lighter, clean-er, and more valuable products. By catalytic-ally adding hydrogen under very high pres-sure, the process increases the ratio of hydro-gen to carbon in the feed and produces low-boiling material. Under some conditionshydrocracking maybe competitive with fluidcatalytic cracking.Catalytic Reforming. –Reforming is a cata-lytic process that takes low-octane “straight-run” materials and raises the octane numberto approximately 100. Although severalchemical reactions take place, the predomi-
nant reaction is the removal of hydrogenfrom naphthenes (hydrogen-saturated ring-Iike compounds) and their conversion to aro-matics (benzene-ring compounds). In addi-tion to markedly increasing octane number,the process produces hydrogen that can beused in desulfurization units.
Isomerization, Catalytic Polymerization, andAlkylation. -These are specialized processesthat increase refinery yields of high-octanegasoline blending components from selectedstraight-chain liquids and certain refinerygases.
Historically, the U.S. refining industry has dealtprimarily with light, low-sulfur crudes. Usingprocesses described above, the industry achieveda balance between refinery output and markets.Adjustments have been made to meet the in-creasing demand for lead-free gasolines and to
the mandated reduction of lead in other gaso-lines. The heavy residual fuels, considerably high-er in sulfur content than treated distillate fuels,have continued to find a market as ships’ boilersand as fuels for utility plants that have not con-verted to coal. (In the latter market, it has some-times been necessary to blend in desulfurized fueloils to meet maximum fuel sulfur specifications.)In addition, large volumes of residual fuel oilshave continued to be imported, largely from Ven-ezuela and the Caribbean.
Now, however, the picture is changing. Due
to the limited availability of light crude oils, refin-eries are being forced to run increasing volumesof heavy crudes that are higher in sulfur and othercontaminants. With traditional processing meth-ods, these crudes produce fewer light productsand more heavy fuel oils of high sulfur content.On the other hand, fuel switching and conserva-tion in stationary uses will shift market demandincreasingly toward transportation fuels—gaso-Iine, diesel, and jet–plus petrochemical feed-stock.
Refiners are responding to this situation bymaking major additions to processing facilities.Although they differ in detail, the additions areintended to reduce greatly the production ofheavy fuel oil and to maximize the conversionand recovery of light liquids. For a typical major

8/14/2019 Increased Automobile Fuel Efficiency and Synthetic Fuels: Alternatives for Reducing Oil Imports
http://slidepdf.com/reader/full/increased-automobile-fuel-efficiency-and-synthetic-fuels-alternatives-for 162/292

8/14/2019 Increased Automobile Fuel Efficiency and Synthetic Fuels: Alternatives for Reducing Oil Imports
http://slidepdf.com/reader/full/increased-automobile-fuel-efficiency-and-synthetic-fuels-alternatives-for 163/292
160 . Increased Automobile Fuel Efficiency and Synthetic Fuels: Alternatives for Reducing Oil Imports
PROCESS DESCRIPTIONS
A variety of synthetic fuels processes are cur-rently being planned or are under development.Those considered here involve the chemical syn-thesis of liquid or gaseous fuels from solid materi-als. As mentioned above, the impetus for synthe-
sizing fluid fuels is to provide fuels that can eas-ily be transported, stored, and handled so as tofacilitate their substitution for imported oil and,to a lesser extent, imported natural gas.
The major products of various synfuels proc-esses are summarized in table 41. Depending onthe processes chosen, the products of synfuelsfrom coal include methanol (a high-octane gaso-line substitute) and most of the fuels derived fromoil* and natural gas. The principal products fromupgrading and refining shale oil are similar tothose obtained from conventional crude-oil refin-ing. The principal biomass synfuels are either
methanol or a low- to medium-energy fuel gas.Smaller amounts of ethanol (an octane-boostingadditive to gasoline or a high-octane substitute
*As with natural crude oil, however, refining to produce largegasoline fractions usually requires more refining energy and expensethan producing less refined products such as fuel oil.
for gasoline) and biogas can also be produced.Each of these fuels can be synthesized further intoany of the other products, but these are the mosteasily produced from each source and thus prob-ably the most economic.
In the following section, the technologies forproducing synfuels from coal, oil shale, and bio-mass are briefly described. Indirect and directcoal liquefaction and coal gasification are pre-sented first. Shale oil processes are described sec-ond, followed by various biomass synfuels. Hy-drogen and acetylene production are not in-cluded because a preliminary analysis indicatedthey are likely to be more expensive and less con-venient transportation fuels than are the syntheticIiquids.4
4For a more detailed description o f v a r i o u s pf’OCeSSeS, see:
Engineering Societies Commission on Energy, Inc., “Coal Conver-
sion Comparison, ” July 1979, Washington, D. C.; An Assessmentof Oil Shale Technologies (Washington, D, C.: U.S. Congress, Of-fice of Technology Assessment, June 1980), OTA-M-1 18; EnergyFrom Bio/ogica/ Processes (Washington, D, C.: U.S. Congress, Of-fice of Technology Assessment, July 1980), vol. 1, OTA-E-124; andEnergy From Biological Processes, Volume I/–Technical and En-
vironmenta/ Ana/yses (Washington, D. C.: U.S. Congress, Office of,Technology Assessment, September 1980), OTA-E-1 28.
Table 41 .—Principal Synfuels Products
Process Fuel production
Oil shale Gasoline, diesel and jet fuel,fuel oil, liquefiedpetroleum gases (LPG)
Fischer-Tropsch Gasoline, synthetic naturalgas (SNG), diesel fuel, andLPG
Coal to methanol, Mobil Gasoline and LPGmethanol to gasoline(MTG)
Coal to methanol Methanol
Wood or plant herbage tomethanol
Direct coal liquefaction
Grain or sugar to ethanol
SNG
Coal to medium- orlow-energy gas
Wood or plant herbategasification
Anaerobic digestion
Methanol
Gasoline blending stock, fueloil or jet fuel, and LPG
Ethanol
SNG
Medium- or low-energy fuelgas
Medium- or low-energy fuelgas
Biogas (carbon dioxide andmethane] and SNG
Comments
Shale oil is the synfuel most nearly like natural crude.
Process details can be modified to produce principallygasoline, but at lower efficiency.
LPG can be further processed to gasoline. Some processeswould also produced considerable SNG.
Depending on gasifier, SNG may be a byproduct. Methanolmost useful as high-octane gasoline substitute or gasturbine fuel, but can also be used as gasoline octanebooster (with cosolvents), boiler fuel, process heat fuel,and diesel fuel supplement. Methanol can also beconverted to gasoline via the Mobil MTG process.
Product same as above.
Depending on extent of refining, product can be 90 volumepercent gasoline.
Product most useful as octane-boosting additive togasoline, but can serve same uses as methanol.
Product is essentially indistinguishable from natural gas.Most common product likely to be close to synthesis gas.
Fuel gas likely to be synthesized at place where it is used.
Most products likely to be used onsite where produced.
SOURCE: Off Ice of Technology Assessment.

8/14/2019 Increased Automobile Fuel Efficiency and Synthetic Fuels: Alternatives for Reducing Oil Imports
http://slidepdf.com/reader/full/increased-automobile-fuel-efficiency-and-synthetic-fuels-alternatives-for 164/292
Ch. 6—Synthetic Fuels q 161
Synfuels From Coal
Liquid and gaseous fuels can be synthesizedby chemically combining coal with varyingamounts of hydrogen and oxygen, * as describedbelow. The coal liquefaction processes are gen-erally categorized according to whether liquidsare produced from the products of coal gasifica-tion (indirect processes) or by reacting hydrogenwith solid coal (direct processes). The fuel gases
*Some liquid and gaseous fuel can be obtained simply by heatingcoal, due to coal’s small natural hydrogen content, but the yieldis low.
from coal considered here are medium-Btu gasand a synthetic natural gas (SNG or high-Btu gas).Each of these three categories is consideredbelow and shown schematically in figure 13.
Indirect Liquefaction
The first step in the indirect liquefaction proc-esses is to produce a synthesis gas consisting of
carbon monoxide and hydrogen and smallerquantities of various other compounds by react-ing coal with oxygen and steam in a reaction ves-sel called a gasifier. The liquid fuels are produced
Photo credit: Fluor Corp
Synthesis gas is converted to liquid hydrocarbons inFischer-Tropsch type reactors

8/14/2019 Increased Automobile Fuel Efficiency and Synthetic Fuels: Alternatives for Reducing Oil Imports
http://slidepdf.com/reader/full/increased-automobile-fuel-efficiency-and-synthetic-fuels-alternatives-for 165/292
162 . Increased Automobile Fuel Efficiency and Synthetic Fuels: Alternatives for Reducing Oil Imports
Figure 13.—Schematic Diagrams of Processes for Producing Various Synfuels From Coal
SOURCE: Office of Technology Assessment.

8/14/2019 Increased Automobile Fuel Efficiency and Synthetic Fuels: Alternatives for Reducing Oil Imports
http://slidepdf.com/reader/full/increased-automobile-fuel-efficiency-and-synthetic-fuels-alternatives-for 166/292
Ch. 6—Synthetic Fuels Ž 163
by cleaning the gas, adjusting the ratio of carbonmonoxide to hydrogen in the gas, and pressuriz-ing it in the presence of a catalyst. Dependingon the catalyst, the principal product can begasoline (as in the Fischer-Tropsch process) ormethanol. The methanol can be used as a fuel
or further reacted in the Mobil methanol-to-gasoline (MTG) process (with a zeolite catalyst)to produce Mobil MTG gasoline. The composi-tion of the gasoline and the quantities of otherproducts produced in the Fischer-Tropsch proc-ess can also be adjusted by varying the temper-ature and pressure to which the synthesis gas issubjected when liquefied.
With commercially available gasifiers, part ofthe synthesis gas is methane, which can be puri-fied and sold as a byproduct of the methanol orgasoline synthesis. * However, the presence ofmethane in the synthesis gas increases the energyneeded to produce the liquid fuels, because itmust be pressurized together with the synthesisgas but does not react to form liquid products.Alternatively, rather than recycling purge gas(containing increasing concentrations of meth-ane) to the methanol synthesis unit, it can be sentto a methane synthesis unit and its carbon mon-oxide and hydrogen content converted to SNG.With “second generation” gasifiers (see below),little methane would be produced and the metha-nol or gasoline synthesis would result in relativelyfew byproducts.
There are three large-scale gasifiers with com-mercially proven operation: Lurgi, Koppers-Totzek, and Winkler. Contrary to some reportsin the literature, all of these gasifiers can utilizea wide range of both Eastern and Westerncoals, * * although Lurgi has not been commercial-
*For example, the synthesis gas might typically contain 13 per-cent methane. Following methanol synthesis, the exiting gases mightcontain 60 percent methane, which is sufficiently concentrated foreconomic recovery.
* qFor example, Sharman (R. B. Sharman, “The British Gas/Lurgi
Slagging Gasifier–What It Can Do,” presented at Coal Technology’80, Houston, Tex., Nov. 18-20, 1980) states: “h has been claimedthat the fixed bed gasifiers do not work well with swelling coals.
Statements such as this can still be seen in the literature and arenot true. In postwar years Lurgi has given much attention to theproblem of stirrer design which has much benefited the WestfieldSlagging Gasifier, Substantial quantities of strongly caking and swell-ing coals such as Pittsburgh 8 and Ohio 9, as well as the equivalentstrongly caking British coals have been gasified. No appreciableperformance difference has been noted between weakly cakingand strongly caking high volatile bituminous coals. ”
Iy proven with Eastern coals. In all cases, thephysical properties of the feed coal will influencethe exact design and operating conditionschosen * for a gasifier. For example, the coalswelling index, ease of pulverization (friability),and water content are particularly important pa-
rameters to the operation of Lurgi gasifiers, andthe Koppers-Totzek gasifier requires that the ashin the coal melt for proper operation, as do theShell and Texaco “second generation” designs.,
it is expected that the developing pressurized,entrained-flow Texaco and Shell gasifiers will besuperior to existing commercial gasifiers in theirability to handle strongly caking Eastern coalswith a rapid throughput. This is achieved by rapidreaction at high temperatures (above the ashmelting point). These temperatures, however, areachieved at the cost of reduced thermal efficiencyand increased carbon dioxide production.
The Fischer-Tropsch process is commercial inSouth Africa, using a Lurgi gasifier, but the UnitedStates lacks the operating experience of SouthAfrica and it is unclear whether this will poseproblems for commercial operation of this proc-ess in the United States. The methanol synthesisfrom synthesis gas is commercial in the UnitedStates, but a risk is involved with putting togethera modern coal gasifier with the methanol syn-thesis, since these units have not previously beenoperated together. Somewhat more risk is in-volved with the Mobil MTG process, since it has
only been demonstrated at a pilot plant level.Nevertheless, since the Mobil MTG process in-volves only fluid streams* * the process can prob-ably be brought to commercial-scale operationwith little technical difficulty.
Direct Liquefaction
The direct liquefaction processes produce a liq-uid hydrocarbon by reacting hydrogen directlywith coal, rather than from a coal-derived synthe-sis gas. However, the hydrogen probably will beproduced by reacting part of the coal with steam
to produce a hydrogen-rich synthesis gas, sothese processes do not eliminate the need for coal
*Including steam and oxygen requirements.**The physical behavior of fluids is fairly well understood, and
processes involving only fluid streams can be scaled up much morerapidly with minimum risk than processes involving solids.

8/14/2019 Increased Automobile Fuel Efficiency and Synthetic Fuels: Alternatives for Reducing Oil Imports
http://slidepdf.com/reader/full/increased-automobile-fuel-efficiency-and-synthetic-fuels-alternatives-for 167/292
164 q Increased Automobile Fuel Efficiency and Synthetic Fuels: Alternatives for Reducing Oil Imports
gasification. The major differences between theprocesses are the methods used to transfer thehydrogen to the coal, while maximizing catalystlife and avoiding the flow problems associatedwith bringing solid coal into contact with a solidcatalyst, but the hydrocarbon products are like-
ly to be quite similar. The three major direct liq-uefaction processes are described briefly below,followed by a discussion of the liquid product andthe state of the technologies’ development.
The solvent-refined coal (SRC I) process wasoriginally developed to convert high-sulfur, high-ash coals into low-sulfur and low-ash solid fuels.Modifications in the process resulted in SRC II,which produces primarily a liquid product. Thecoal is slurried with part of the liquid hydrocar-bon product and reacted with hydrogen at about850° F and a pressure of 2,000 per square inch(psi).5
AS it now stands, however, feed coal forthis process is limited to coals containing pyriticminerals which act as catalysts for the chemicalreactions.
The H-coal process involves slurrying the feedcoal with part of the product hydrocarbon andreacting it with hydrogen at about 650° to 700°F and about 3,000 psi pressure in the presenceof a cobalt molybdenum catalyst.6 A novel aspectof this process is the so-called “ebullated” bedreactor, in which the slurry’s upward flowthrough the reactor maintains the catalyst parti-cles in a fluidized state. This enables contact be-
tween the coal, hydrogen, and catalyst with a rel-atively small risk of clogging.
The third major direct liquefaction method isthe EXXON Donor Solvent (EDS) process. In thisprocess, hydrogen is chemically added to a sol-vent in the presence of a catalyst. The solvent isthen circulated to the coal at about 800° F and1,500 to 2,000 psi pressure.7 The solvent then,in chemical jargon, chemically donates thehydrogen atoms to the coal; and the solvent isrecycled for further addition of hydrogen. Thisprocess circumvents the problems of rapid cat-
alyst deactivation and excessive hydrogen con-sumption.
5Erlgineering societies Commission on Energy, Inc.) oP . cit.
Wameron Engineering, Inc., “Synthetic Fuels Data Handbook,”2d cd., compiled by G. L. Baughman, 1978.‘Ibid.
In all three processes, the product is removedby distilling it from the slurry, so there is no resid-ual oil* fraction in these “syncrudes. ” Becauseof the chemical structure of coal, the product ishigh in aromatic content. The initial product isunstable and requires further treatment to pro-
duce a stable fuel. Refining** the “syncrude”consists of further hydrogenation or coking (toincrease hydrogen content and remove impuri-ties), cracking, and reforming; and current indica-tions are that the most economically attractiveproduct slate consists of gasoline blending stockand fuel oil,8 but it is possible, with somewhathigher processing costs, to produce products thatvary from 27 percent gasoline and 61 percent jetfuel up to 91 percent gasoline and no jet fuel.9
The gasoline blending stock is high in aromat-ics, which makes it suitable for blending withlower octane gasoline to produce a high-octanegasoline. Indications are that the jet fuel can bemade to meet all of the refinery specifications forpetroleum-derived jet fuel.10 However, since themethods used to characterize crude oils and theproducts of oil refining do not uniquely determinetheir chemical composition, the refined productsfrom syncrudes will have to be tested in variousend uses to determine their compatibility withexisting uses. Because of the chemistry involved,these syncrudes appear economically less suita-ble for the production of diesel fuel.***
*ResiduaI oil is the fraction that does not vaporize under distilla-
tion conditions. Since this syncrude is itself the byproduct of distilla-tion, all of the fractions vaporize under distillation conditions.q *At present, it is not clear whether existing refineries will be
modified to accept coal syncrudes or refineries dedicated to thisfeedstock will be built. Local economics may dictate a combina-tion of these two strategies. Refining difficulty is sometimes com-pared to that of refining sour Middle East crude when no high-sulfurresidual fuel oil product is produced (i.e., refining completely tomiddle distillates and gasoline) (see footnote 8). This is moderate-ly difficult but well within current technical capabilities. One of theprincipal differences between refining syncrudes and natural crudeoil, however, is the need to deal with different types of metallicimpurities in the feedstock.BUC)p, Inc., and System Development Corp., “Crude oil VS. Coal
Oil Processing Compassion Study,” DOE/ET/031 17, TR-80/009-001,
November 1979.gChevron, “Refining and Upgrading of Synfuels From Coal and
Oil Shales by Ad~anced Catalytic Processes, Third Interim Report:Processing of SRC II Syncrude,” FE-21 35-47, under DOE contractNo. EF-76-C-01-2315, Apr. 30, 1981.‘oIbid.* * *Th e product is hydrogenated and cracked to form saturated,
single-ring compounds, and to saturated diolefins (which wouldtend to form char at high temperatures). The reforming step pro-

8/14/2019 Increased Automobile Fuel Efficiency and Synthetic Fuels: Alternatives for Reducing Oil Imports
http://slidepdf.com/reader/full/increased-automobile-fuel-efficiency-and-synthetic-fuels-alternatives-for 168/292
Ch. 6—Synthetic Fuels Ž165
None of the direct liquefaction processes hasbeen tested in a commercial-scale plant. All in-volve the handling of coal slurries, which arehighly abrasive and have flow properties that can-not be predicted adequately with existing theoriesand experience. Consequently, engineers cannotpredict accurately the design requirements of acommercial-scale plant and the scale-up must gothrough several steps with probable process de-sign changes at each step. As a result, the directliquefaction processes are not likely to make asignificant contribution to synfuels production be-fore the 1990’s. At this stage there would be asubstantial risk in attempting to commercializethe direct liquefaction processes without addi-tional testing and demonstration.
GasificationThe same type of gasifiers used for the liquefac-
tion processes can be used for the production ofsynthetic fuel gases. The first step is the produc-tion of a synthesis gas (300 to 350 Btu/SCF). *The synthesis gas can be used as a boiler fuel orfor process heat with minor modifications in end-use equipment, and it also can be used as achemical feedstock. Because of its relatively lowenergy density and consequent high transportcosts, synthesis gas probably will not be trans-ported (in pipelines) more than 100 to 200 miles.There is very little technical risk in this process,however, since commercial gasifiers could beused.
The synthesis gas can also be used to synthesizemethane (the principal component of natural gashaving a heat content of about 1,000 Btu/SCF).This substitute or synthetic natural gas (SNG) canbe fed directly into existing natural gas pipelinesand is essentially identical to natural gas. Thereis some technical risk with this process, since themethane synthesis has not been demonstrated ata commercial scale. However, since it only in-volves fluid streams, it probably can be scaled
duces aromatics from the saturated rings. The rings can also bebroken to form paraffins, but the resultant molecules and other par-affins in the “oil” are too small to have a high cetane rating (the
cetane rating of one such diesel was 39 (see footnote 9), whilepetroleum diesels generally have a centane of 45 or more (E. M.Shelton, “Diesel Fuel Oils, 1980, ” DOE/BETC/PPS-80/5, 1980)).Polymerization of the short chains into longer ones to produce ahigh-cetane diesel fuel is probably too expensive.
**Assuming the gas consists primarily of carbon monoxide andhydrogen.
up to commercial-scale operations without seri-ous technical difficulties.
As mentioned under “Indirect Liquefaction, ”there are several commercial gasifiers capable ofproducing the synthesis gas. The principal tech-nical problems in commercial SNG projects are
likely to center around integration of the gasifierand methane synthesis process.
Shale Oil
Oil shale consists of a porous sandstone thatis embedded with a heavy hydrocarbon (knownas kerogen). Because the kerogen already con-tains hydrogen, a liquid shale oil can be producedfrom the oil shale simply by heating the shale tobreak (crack) the kerogen down into smaller mol-ecules. This can be accomplished either with a
surface reactor, a modified in situ process, or aso-called true in situ process.
In the surface retorting method, oil shale ismined and placed in a metal reactor where it isheated to produce the oil. In the “modified insitu” process, an underground cavern is exca-vated and an explosive charge detonated to fillthe cavern with broken shale “rubble.” Part ofthe shale is ignited to produce the heat neededto crack the kerogen. Liquid shale oil flows to thebottom of the cavern and is pumped to the sur-face. In the “true in situ” process, holes are bored
into the shale and explosive charges ignited ina particular sequence to break up the shale. The“rubble” is then ignited underground, produc-ing the heat needed to convert the kerogens toshale oil.
The surface retort method is best suited to thickshale seams near the surface. The modified in situis used where there are thick shale seams deepunderground. And the true in situ method isbest suited to thin shale seams near the surface.The surface retorting method requires the min-ing and disposal of larger volumes of shale thanthe modified in situ method and the true in situmethod requires only negligible mining. It is moredifficult, using the latter two processes, however,to achieve high oil yields of a relatively uniformquality, primarily because of difficulties relatedto controlling the underground combustion and

8/14/2019 Increased Automobile Fuel Efficiency and Synthetic Fuels: Alternatives for Reducing Oil Imports
http://slidepdf.com/reader/full/increased-automobile-fuel-efficiency-and-synthetic-fuels-alternatives-for 169/292
166 • Increased Automobile Fuel Efficiency and Synthetic Fuels: Alternatives for Reducing Oil Imports
Photo credit: Department of Energy
Synthane pilot plant near Pittsburgh, Pa., converts coal to synthetic natural gas

8/14/2019 Increased Automobile Fuel Efficiency and Synthetic Fuels: Alternatives for Reducing Oil Imports
http://slidepdf.com/reader/full/increased-automobile-fuel-efficiency-and-synthetic-fuels-alternatives-for 170/292

8/14/2019 Increased Automobile Fuel Efficiency and Synthetic Fuels: Alternatives for Reducing Oil Imports
http://slidepdf.com/reader/full/increased-automobile-fuel-efficiency-and-synthetic-fuels-alternatives-for 171/292
168 Ž Increased Automobile Fuel Efficiency and synthetic Fuels: Alternatives for Reducing Oil Imports
Fuel Gases
By 2000, the principal fuel gases from biomassare likely to be a low-energy gas from airblowngasifiers and biogas from manure. Other sourcesmay include methane (SNG) from the anaerobicdigestion of municipal solid waste and possibly
kelp.A relatively low-energy fuel gas (about 200 Btu/
SCF) can be produced by partially burning woodor plant herbage with air in an airblown gasifier.The resultant gas can be used to fuel retrofittedoil- or gas-fired boilers or for process heat needs.Because its low energy content economically pro-hibits long-distance transportation of the gas,most users will operate the gasifier at the placewhere the fuel gas is used. Several airblown bio-mass gasifiers are under development, and com-mercial units could be available within 5 years.
Biogas (a mixture of carbon dioxide and meth-ane) is produced when animal manure or sometypes of plant matter are exposed to the appro-priate bacteria in an anaerobic digester (a tanksealed from the air). Some of this gas (e.g., fromthe manure produced at large feedlots) may bepurified, by removing the carbon dioxide, andintroduced into natural gas pipelines, but mostof it is likely to be used to generate electricity andprovide heat at farms where manure is produced.The total quantity of electricity produced this waywould be small and, to an increasing extent,
would be used to displace nuclear- and coal-gen-erated electricity. A part of the waste heat fromthe electric generation can be used for hot waterand space heating in buildings on the farm, how-ever.
14A small part of the biogas (perhaps 15 per-
cent corresponding to the amount occurring onlarge feedlots) could be purified to SNG and in-
troduced into natural gas pipelines.
Biogas can also be produced by anaerobic di-gestion of municipal solid waste in landfills andkelps. Any gas so produced is likely to be purifiedand introduced into natural gas pipelines.
Manure digesters for cattle manure are com-mercially available. Digesters utilizing othermanures require additional development, butcould be commercially available within 5 years.The technology for anaerobic digestion of munici-pal solid waste was not analyzed, but one system
is being demonstrated in Florida.15
In addition,if ocean kelp farms prove to be technically andeconomically feasible, there may be a small con-tribution by 2000 from the anaerobic digestionof kelp to produce methane (SNG),16 but thissource should be considered speculative at pres-ent.
14TRW, “Achievin g a production Goal of 1 Million B/D of coal
Liquids by 1990,” March 1980.’51. E., Associates, “Biological Production of Gas,” contractor re-
port to OTA, April 1979, available in Energy From Biologica/Proc-esses, Vol ///: Appendixes, Part C, September 1980,16Energy From Biological prOCeSSeS, OP. cit.
COST OF SYNTHETIC FUELS
There is a great deal of uncertainty in estimating charges can vary by more than a factor of 2. Incosts for synthetic fuels plants. A number of fac- many cases, differences in product cost estimatestors, which can be predicted with varying degrees can be explained solely on the basis of these dif-of accuracy, contribute to this uncertainty. Some ferences. For most of the biomass fuels, the costof the more important are considered below, fol- of the biomass feedstock is also highly variable,lowed by estimates for the costs of various syn- and this has a strong influence on the productfuels. cost.
Uncertainties The cost of synfuels projects, and particularly
the very large fossil fuel ones, is also affected by:For most of the synfuels, fixed charges are a 1) construction delays, 2) real construction cost
large part of the product costs. Depending on increases (corrected for general inflation) duringassumptions about financing, interest rates, and construction, and 3) delays in reaching full pro-the required rate of return on investment, these duction capacity after construction is completed,

8/14/2019 Increased Automobile Fuel Efficiency and Synthetic Fuels: Alternatives for Reducing Oil Imports
http://slidepdf.com/reader/full/increased-automobile-fuel-efficiency-and-synthetic-fuels-alternatives-for 172/292
Ch. 6—Synthetic Fuels Ž 169
due to technical difficulties. These factors are usu-ally not included in cost estimates, but they arelikely to affect the product cost.
Another factor that should be considered is thestate of development of the technology on whichthe investment and operating cost estimates are
based, As technology development proceeds,problems are discovered and solved at a cost, andthe engineer’s original concept of the plant isgradually replaced with a closer and closer ap-proximation of how the plant actually will look.Consequently, calculations based on less devel-oped technologies are less accurate. This usual-Iy means that early estimates understate the truecosts by larger margins than those based on moredeveloped and well-defined technologies. Thisis particularly true of processes using solid feed-stocks because of the inherent difficulty with scal-ing-up process streams involving solids. Figure 14illustrates cost escalations that can occur, by sum-
marizing the increases in cost estimates for vari-ous energy projects as technology developmentproceeded. Table 42 also illustrates this point byshowing average cost overruns that have oc-curred in various types of large constructionprojects.
It should be noted, however, that the periodof time in which most of the project evaluations
Table 42.-Average Cost Overruns for VariousTypes of Large Construction Projects
Actual cost dividedSystem type by estimated cost
Weapons systems. . . . . . . . . . . . . . . 1.40-1.89Public works . . . . . . . . . . . . . . . . . . . 1.26-2.14Major construction . . . . . . . . . . . . . . 2.18Energy process plants . . . . . . . . . . . 2.53SOURCES: Rand Corp., “A Review of Cost Estimates In New Technologies: lmpli-
cationa for Energy Process Piants,” prepared for U.S. Departmentof Energy, July 1979; Hufschmidt and Gerin, “Systematic Errors InCost Estimates for Public Investment Projects,” in The Ana/ys/s of
Pub//c Output, Columbia University Press, 1970; and R. Perry, et al.,“Systems Acqulsitlon Strategies,” Rand Corp., 1970.
Figure 14.—Cost Growth in Pioneer Energy Process Plants (constant dollars)
Initial Preliminary Budget Definitive Actual Add-on
Type of estimate
SOURCE: “A Review of Cost Estimation in New Technologies: Implications for Energy Process Plants,” Rand Corp. R-2481- DOE, July 1979,

8/14/2019 Increased Automobile Fuel Efficiency and Synthetic Fuels: Alternatives for Reducing Oil Imports
http://slidepdf.com/reader/full/increased-automobile-fuel-efficiency-and-synthetic-fuels-alternatives-for 173/292
170 q Increased Automobile Fuel Efficiency and Synthetic Fuels: Alternatives for Reducing Oil Imports
in table 42 were made had high escalation ratesfor capital investment relative to general econom-ic inflation. Historically this has not been the case;and if future inflation in plant construction morenearly follows general inflation, the expected syn-fuels investment increases from preliminary de-sign to actual construction would be lower thanis indicated in figure 14 and table 42.
When judging the future costs and economiccompetitiveness of synfuels, one must thereforealso consider the long-term inflation in construc-tion costs. To a very large extent, the ability toproduce synfuels at costs below those of petrol-eum products will depend on the relative infla-tion rates of crude oil prices and constructioncosts.
Although economies of scale are important forsynfuels plants, there are also certain disecon-omies of scale—factors which tend to increase
construction costs (per unit of plant capacity) forvery large facilities as compared with small ones.First, the logistics of coordinating constructionworkers and the timely delivery of constructionmaterials become increasingly difficult as the con-struction project increases in size and complex-ity. Second, construction labor costs are higherin large projects due to overtime, travel, and sub-sistence payments. Third, as synfuels plants in-crease in size, more and more of the equipmentmust be field-erected rather than prefabricatedin a factory. This can increase the cost of equip-ment, although in some cases components may
be “mass-produced” on site, thereby equalingthe cost savings due to prefabrications. Some ofthese problems causing diseconomies of scalecan be aggravated if a large number of synfuelsprojects are undertaken simultaneously.
Many of the above factors would tend to in-crease costs, but once several full-scale plantshave been built, the experience gained may helpreduce production costs for future generationsof plants. Delays in reaching full production ca-pacity can be minimized, and process innova-tions that reduce costs can be introduced. in ad-
dition, very large plants that fully utilize the avail-able economies of scale can be built with confi-dence. Consequently, the first generation unitsproduced are likely to be the most expensive, ifadjustments are made for inflation in construc-tion and operating costs.
An example of this can be found in the chem-ical industry, where capital productivity (outputper unit capital investment) for the entire industryhas increased by about 1.4 percent per year since1949.17 In some sectors, such as methanol syn-thesis, productivity has increased by more than4 percent per year for over 20 years.18 Much ofthis improvement is attributable to increasedplant size and the resultant economies of scale:Because the proposed synfuels plants are alreadyrelatively large, cost decreases for synfuels pIantsmay not be as large and consistent as those ex-perienced in the chemical industry in recentyears; however, because of the newness of theindustry, some decreases are expected.
Investment Cost
For purposes of cost calculations, previous OTAestimates 19 20 were used for oil shale and biomasssynfuels (adjusted, in the case of oil shale, to 1980dollars) and the best available cost estimates inthe public literature were used for coal-derivedsynfuels. These latter estimates were compared
21
to the results of an earlier Engineering Societies’Commission on Energy (ESCOE) study22 of coal-derived synfuels, which used preliminary engi-neering data. Since the best available cost esti-mates correspond roughly to definitive engineer-ing estimates, the ESCOE numbers were in-creased by 50 percent, the amount by which en-gineering estimates typically increase when go-
ing from preliminary to definitive estimates.When these adjustments were made and thecosts expressed in 1980 dollars, the two sourcesof cost estimates for coal-based synfuels producedroughly comparable results. *s
Table 43 shows the processes and productslates used for the cost calculations. As describedabove, a variety of alternative product slates arepossible, but these were chosen to emphasize theproduction of transportation fuels. Table 44 givesthe best available investment and operating costs
“E. J. Bentz & Associates, Inc., “Selected Technical and Economic
Comparisons of Synfuel Options, ” contractor report to OTA, 1981.lalbid.lgAn Assessment of Oil shale Technologies, op. cit.2oEnergy From Biological /%XeSSt%, OP . cit.ZI E. J. Bentz & Associates, Inc., op. cit.zzEnglneering societies Commission on Energy, InC., OP. cit.Z3E. J. Bentz & Associates, Inc., Op. cit.

8/14/2019 Increased Automobile Fuel Efficiency and Synthetic Fuels: Alternatives for Reducing Oil Imports
http://slidepdf.com/reader/full/increased-automobile-fuel-efficiency-and-synthetic-fuels-alternatives-for 174/292

8/14/2019 Increased Automobile Fuel Efficiency and Synthetic Fuels: Alternatives for Reducing Oil Imports
http://slidepdf.com/reader/full/increased-automobile-fuel-efficiency-and-synthetic-fuels-alternatives-for 175/292

8/14/2019 Increased Automobile Fuel Efficiency and Synthetic Fuels: Alternatives for Reducing Oil Imports
http://slidepdf.com/reader/full/increased-automobile-fuel-efficiency-and-synthetic-fuels-alternatives-for 176/292

8/14/2019 Increased Automobile Fuel Efficiency and Synthetic Fuels: Alternatives for Reducing Oil Imports
http://slidepdf.com/reader/full/increased-automobile-fuel-efficiency-and-synthetic-fuels-alternatives-for 177/292
174 . Increased Automobile Fuel Efficiency and Synthetic Fuels: Alternatives for Reducing Oil Imports
Table 47.—Assumptions Figure 15.—Consumer Cost of Selected SynfuelsWith Various Aftertax Rates of Return on Investment
1, Project life—25 years following 5-year construction periodfor fossil synfuels and 2-year construction period forbiomass synfuels.
2.10 year straight-line depreciation.3. Local taxes and property insurance as in K. K. Rogers,
“coal Conversion Comparisons,” ESCOE, prepared for U.S.Department of Energy under contract No. EF-77-C-01-2468,
July 1979.4.10 percent real rate of return on equity investment with:1) 100 percent equity financing, and 2) 75 percent debt/25percent equity financing with 5 percent real interest rate.
5.90 percent capacity or “onstream factor.”6. Coal costs $30/ton delivered to synfuels plant (1980 dollars).7.46 percent Federal and 9 percent State tax.8. Working capital = 10 percent of capital investment.SOURCE: Office of Technology Assessment.
Table 48.—Effect of Varying Financial Parametersand Assumptions on Synfuels’ Costs
Change Effect on synfuels cost
Plant operates at a 50 percent
on stream factor rather than90 percent . . . . . . . . . . . . . . . . . Increase 60-70%Increase capital investment by
50 percent . . . . . . . . . . . . . . . . . Increase 15-35%8-year construction rather than
5-year . . . . . . . . . . . . . . . . . . . . . Increase 5-20%Increase coal price by $15/ton . . Increase $5-7/bblSOURCE: Office of Technology Assessment.
Because cost overruns and poor plant perform-ance lower the return on investment, investorsin the first round of synfuels plants are likely torequire a high calculated rate of return on invest-ment to ensure against these eventualities. Put
another way, anticipated cost increases (table 45)would lead investors to require higher productprices than those in table 46 before investing insynfuels.
The effects on product costs of various ratesof return on investment are shown in figure 15for selected processes, and the effect of changesin various other economic parameters is shownin table 48. As can be seen, product costs couldvary by more than a factor of 2 depending on thetechnical, economic, and financial conditionsthat pertain.
Nevertheless, it can be concluded that factorswhich reduce the equity investment and the re-quired return on that investment and those whichhelp to ensure reliable plant performance are the
0 5 10 15 20 25
Real return on investment (o/o)
a5% real interest rate on debt.
SOURCE: Office of Technology Assessment
most significant in holding synfuels costs down.These factors do not always act unambiguously,however. Inflation during construction, for exam-ple, increases cost overruns, but inflation afterconstruction increases the real (deflated) returnon investment. The net effect is that the synfuelscost more than expected when plant production
first starts, but continued inflation causes theprices of competing fuels to rise and consequentlyallows synfuels prices—and returns on investment —to rise as well. Similarly, easing of environmen-tal control requirements can reduce the time andinvestment required to construct a plant, but in-adequate controls or knowledge of the environ-mental impacts may lead to costly retrofits whichmay perform less reliably than alternative, lesspolluting plant designs.
Another important factor influencing the costof some synthetic transportation fuels is the price
of coproduct SNG. In table 46 it was assumedthat any coproduct SNG would sell for the sameprice per million Btu (MMBtu) at the plant gateas the liquid fuel products, or from $4 to $9/

8/14/2019 Increased Automobile Fuel Efficiency and Synthetic Fuels: Alternatives for Reducing Oil Imports
http://slidepdf.com/reader/full/increased-automobile-fuel-efficiency-and-synthetic-fuels-alternatives-for 178/292
Ch. 6—Synthetic Fuels Ž 175
MMBtu, which compares with current well headprices of up to $9/MM Btu24 for some decontrolledgas. (These prices are averaged with much largerquantities of cheaper gas, so average consumerprices are currently about $3 to $5/MMBtu.)However, the highest wellhead prices may notbe sustainable in the future as their “cushion”of cheaper gas gets smaller, causing averge con-sumer prices to rise. This is because consumerprices are limited by competition between gasand competing fuels—e.g., residual oil—andprobably cannot go much higher without caus-ing many industrial gas users to switch fuels. Largequantities of unconventional natural gas mightbe produced at well head prices of about $10 to$1 l/MMBtu,25 so SNG coproduct prices are un-likely to exceed this latter value in the next twodecades. If the SNG coproduct can be sold foronly $4/MMBtu or less, synfuels plants that do
not produce significant quantities of SNG willlikely be favored. However, for the single-prod-uct indirect liquefaction processes, advancedhigh-temperature gasifiers, rather than the com-mercially proven Lurgi gasifier assumed for theseestimates, may be used. This adds some addition-al uncertainty to product costs.
Despite the inability to make reliable absolutecost estimates, some comparisons based on tech-nical arguments are possible. First, oil shale prob-ably will be one of the lower cost synfuelsbecause of the relative technical simplicity of theprocess: one simply heats the shale to producea liquid syncrude which is then hydrogenated toproduce a high-quality substitute for naturalcrude oil. However, handling the large volumesof shale may be more difficult than anticipated;and, since the high-quality shale resources arelocated in a single region and there is only a
ZAProcesS GaS Consumer Group, Process Gas Consumers Repofi,
Washington, D. C., June 1981.25J. F. Bookout, Chairman, Committee on Unconventional Gas
Sources, “Unconventional Gas Sources,” National Petroleum Coun-cil, December 1980.
limited ability to disperse plants as an en-vironmental measure, large production volumescould necessitate particularly stringent andtherefore expensive pollution control equipmentor increase waste disposal costs.
Second, regarding the indirect transportation
liquids from coal, the relative consumer cost (costper miles driven) of methanol v. synthetic gaso-line will depend critically on automotive technol-ogy. Although methanol plants are somewhat lesscomplex than coal-to-gasoline plants, the cost dif-ference is overcome by the higher cost of termi-nalling and transporting methanol to a service sta-tion, due to the latter’s lower energy content pergallon. With specially designed engines, how-ever, the methanol could be used with about 10to 20 percent higher efficiency than gasoline. Thiswould reduce the apparent cost of methanol,making it slightly less expensive (cost per mile)
than synthetic gasoline. * Successful developmentof direct injected stratified-charge engines wouldeliminate this advantage, while successful devel-opment of advanced techniques for using metha-nol as an engine fuel could increase methanol’sadvantage. * *
This analysis shows that there is much uncer-tainty in these types of cost estimates, and theyshould be treated with due skepticism. The esti-mates are useful as a general indication of thelikely cost of synfuels, but these and any othercost estimates available at this time are inade-quate to serve as a principal basis for policy deci-sions that require accurate cost predictions withconsequences 10 to 20 years in the future.
*lf gasoline has a $0.10/gge advantage in delivered fuel pricefor synfuels costing $1 .50/gge, methanol would have an overall$0.20/gge advantage when used with a specially designed engine.This could pay for the added cost of a methanol engine in 2 to 4years (assuming 250/gge consumed per year).
**For example, engine waste heat can be used to decomposethe methanol into carbon monoxide and hydrogen before the fuelis burned. The carbon monoxide/hydrogen mixture contains 20 per-cent more energy than the methanol from which it came, with theenergy difference coming from what would otherwise be waste heat.
DEVELOPING A SYNFUELS INDUSTRY
Development of a U.S. synfuels industry can and proven and commercial-scale operation es-be roughly divided into three general stages. Dur- tablished. The second phase consists of expand-ing the first phase, processes will be developed ing the industrial capability to build synfuels

8/14/2019 Increased Automobile Fuel Efficiency and Synthetic Fuels: Alternatives for Reducing Oil Imports
http://slidepdf.com/reader/full/increased-automobile-fuel-efficiency-and-synthetic-fuels-alternatives-for 179/292
176 q Increased Automobile Fuel Efficiency and Synthetic Fuels: Alternatives for Reducing Oil Imports
plants. in the third stage, ynfuels production isbrought to a level sufficient for domestic needsand possibly export. Current indications are thatthe first two stages could take 7 to 10 years each.Some of the constraints on this development areconsidered next, followed by a description of twosynfuels development scenarios.
Constraints
A number of factors could constrain the rateat which a synfuels industry develops. Thosementioned most often include:
q
q
q
Other Construction Projects. –Constructionof, for example, a $20 billion to $25 billionAlaskan natural gas pipeline or a $335 billionSaudi Arabian refinery and petrochemical in-dustry, if carried out, would use the sameinternational construction companies, tech-
nically skilled labor, and internationally mar-keted equipment as will be required for U.S.synfuel plant construction.26
Equipment. –Building enough plants to pro-duce 3 million barrels per day (MMB/D) offossil synfuels by 2000 will require significantfractions of the current U.S. capacity for pro-ducing pumps, heat exchangers, compres-sors and turbines, pressure vessels and reac-tors, alloy and stainless steel valves, drag-lines, air separation (oxygen) equipment, anddistillation towers.27 28 29 30
critical Materials. -Materials critical to the
synfuels program include cobalt, nickel,molybdenum, and chromium. Two inde-pendent analyses concluded that only chro-mium is a potential constraint.31 32 (Current-ly, 90 percent of the chromium used in theUnited States is imported.) However, devel-opment of 3 MMB/D of fossil synfuels pro-duction capacity by 2000 would require only
Zbgusiness Week, Sept. 29, 1980, P. 83.Zzjbido
zBBechtel International, Inc., “Production of Synthetic LiquidsFrom Coal: 1980-2000, A Preliminary Study of Potential impedi-
ments,” final report, December 1979.Z9TRW, op. cit.JoMechanical Technology, Inc., “An Assessment of Commercial
Coal Liquefaction Processes Equipment Performance and Supply,”January 1980.
31 [bid.
JzBechtel International, InC., op. cit.
q
q
q
q
q
q
7 percent of current U.S. chromium con-sumption .33
Technological Uncertainties. -The proposedsynfuels processes must be demonstratedand shown to be economic on a commer-cial scale before large numbers of plants canbe built.Transportation. — If large quantities of coalare to be transported, rail lines, docks, andother facilities will have to be upgraded.34
New pipelines for syncrudes and productswill have to be built.Manpower.–A significant increase in thenumber of chemical engineers and projectmanagers will be needed. For example,achieving 3 MMB/D of fossil synfuels capaci-ty by 2000 will require 1,300 new chemicalengineers by 1986, representing a 35-percentincrease in the process engineering work
force in the United States.
35
More of othertypes of engineers, pipefitters, welders, elec-tricians, carpenters, ironworkers, and otherswill also be needed.Environment, Health, and Safety. -Delays inissuing permits; uncertainty about standards,needed controls, and equipment perform-ance; and court challenges can cause delaysduring planning and construction (see ch.10). Conflicts over water availability couldfurther delay projects, particularly in theWest (see ch. 11).Siting. –Some synfuels plants will be built in
remote areas that lack the needed technicaland social infrastructure for plant construc-tion. Such siting factors could, for example,increase construction time and cost.Financial Concerns. –Most large synfuelsprojects require capital investments that arelarge relative to the total capital stock of thecompany developing the project. Conse-quently, most investors will be extremelycautious with these large investments andbanks may be reluctant to loan the capitalwithout extensive guarantees.
JJlbid.JdThe Direct Use of Coal: Prospects and Problems of Production
and Combustion, OTA-E-86 (Washington, D. C.: U.S. Congress, Of-fice of Technology Assessment, April 1979).JsBechtel International, Inc., Op. cit.

8/14/2019 Increased Automobile Fuel Efficiency and Synthetic Fuels: Alternatives for Reducing Oil Imports
http://slidepdf.com/reader/full/increased-automobile-fuel-efficiency-and-synthetic-fuels-alternatives-for 180/292
Ch. 6—Synthetic Fuels . 177
None of these factors can be identified as anoverriding constraint for coal-derived synfuels,although the need for commercial demonstrationand the availability of experienced engineers andproject managers appear to be the most impor-tant. There is still disagreement about how im-
portant individual factors like equipment avail-ability actually will be in practice. However, themore rapidly a synfuels industry develops, themore likely development will cause significant in-flation in secondary sectors, supply disruptions,and other externalities and controversies. But theexact response of each of the factors in synfuelsdevelopment is not known. For oil shale, on theother hand, the factor (other than commercialdemonstration) that is most likely to limit the rateof growth is the rate at which communities in theoil shale regions can develop the social infrastruc-ture needed to accommodate the large influx of
people to the region.36
The major impacts of developing a large syn-fuels industry are discussed in chapters 8 through10, while two plausible synfuels developmentscenarios are described below.
Development Scenarios
Based on previous OTA reports37 38 estimatesof the importance of the various constraints dis-cussed above, and interviews with Governmentand industry officials, two development scenarioswere constructed for synthetic fuels production.
It should be emphasized that these are not pro- jections, but rather plausible development sce-narios under different sets of conditions. Fossilsynthetics are considered first, followed by bio-mass synfuels; and the two are combined in thefinal section.
Fossil Synfuels
The two scenarios for fossil synthetics areshown in table 49 and compared with other esti-mates in figure 16. It can be seen that OTA sce-
— . — — .jbAn Assessment of Oi l shale Technologies, Op. cit.
Jzlbici.j8Energy From 6io/ogica/ f%m?Sses, Op. C It.
Table 49.—Fossil Synthetic FuelsDevelopment Scenarios (MMB / DOE )
Year
Fuel 1980 1985 1990 1995 2000
Low estimateShale oil . . . . . . . . . . . . . — O 0.2 0.4 0.5Coal liquids . . . . . . . . . . — — 0.1 0.3 0.8Coal gases . . . . . . . . . . . — 0.09 0.1 0.3 0,8
Total . . . . . . . . . . . . . . — 0.1 0.4 1.0 2.1
High estimateShale oil . . . . . . . . . . . . . — O 0.4 0.9 0.9Coal liquids . . . . . . . . . . — — 0.2 0.7 2.4Coal gases . . . . . . . . . . . — 0.09 0.2 0.7 2.4
Total . . . . . . . . . . . . . . — 0.1 0.8 2.3 5.7SOURCE: Office of Technology Assessment
narios are reasonably consistent with the otherprojections, given the rather speculative natureof this type of estimate.
In both scenarios, the 1985 production of fossilsynthetic fuels consists solely of coal gasificationplants, the only fossil synfuels projects that aresufficiently advanced to be producing by thatdate. For the high estimate it is assumed that eightoil shale, four coal indirect liquefaction, and threeadditional coal gasification plants have been builtand are operating by 1988-90. If no major tech-nical problems have been uncovered, a secondround of construction could proceed at this time.
Assuming that eight additional 50,000-bbl/dplants are under construction by 1988 and that
construction starts on eight more plants in 1988and the number of starts increases by 10 percentper year thereafter, one would obtain the quan-tities of synfuels shown for the high estimate. Ten-percent annual growth in construction starts waschosen as a high but probably manageable rateof increase once the processes are proven.
Oil shale is assumed to be limited to 0.9 MMB/ D because of environmental constraints and, pos-sibly, political decisions related to water availabil-ity. Some industry experts believe that neither ofthese constraints would materialize because, atthis level of production, it would be feasible tobuild aqueducts to transport water to the region,and additional control technology could limit

8/14/2019 Increased Automobile Fuel Efficiency and Synthetic Fuels: Alternatives for Reducing Oil Imports
http://slidepdf.com/reader/full/increased-automobile-fuel-efficiency-and-synthetic-fuels-alternatives-for 181/292
178 . Increased Automobile Fuel Efficiency and Synthetic Fuels: Alternatives for Reducing Oil Imports
Figure 16.—Comparison of Fossil Synthetic Fuel Production Estimates
plant emissions to an acceptable level. If this isdone and salt leaching into the Colorado Riverdoes not materialize as a constraint, perhapsmore of the available capital, equipment, andlabor would go to oil shale and less to the alter-natives.
The low estimate was derived by assuming thatproject delays and poor performance of the firstround of plants limit the output by 1990 to about0.4 MMB/D. These initial problems limit invest-ment in new plants between 1988-95 to about
the level assumed during the 1981-88 period, butthe second round of plants performs satisfactorial-Iy. This would add 0.6 MMB/D, assuming that thefirst round operated at 60 percent of capacity,on the average, while the second round operatedat 90 percent of capacity (i.e., at full capacity 90percent of the time). Following the second round,new construction starts increase as in the highestimate.
In both estimates, it is assumed that about halfof the coal synfuels are gases and half are liquids.

8/14/2019 Increased Automobile Fuel Efficiency and Synthetic Fuels: Alternatives for Reducing Oil Imports
http://slidepdf.com/reader/full/increased-automobile-fuel-efficiency-and-synthetic-fuels-alternatives-for 182/292
Ch. 6—Synthetic Fuels . 179
This could occur through a combination of plantsthat produce only liquids, only gases, or liquid/gascoproducts. Depending on markets for the fuels,the available resources (capital, engineering firms,equipment, etc.) could be used to construct facil-ities for producing more synthetic liquids and lesssynthetic gas without affecting the synfuels total
significantly.
When interpreting the development scenarios,however, it should be emphasized that there isno guarantee that even the low estimate will beachieved. Actual development will depend critic-ally on decisions made by potential investorswithin the next 2 years. I n addition to businesses’estimates of future oil prices, these decisions arelikely to be strongly influenced by availability ofFederal support for commercialization, in whichcommercial-scale process units are tested andproven. Unless several more commercial projects
than industry has currently announced are in-itiated in the next year or two, it is unlikely thateven the low estimate for 1990 can be achieved.
Biomass Synfuels
Estimating the quantities of synfuels from bio-mass is difficult because of
Box D.-Definitions of
and Commercial-Scale
the lack of data on
Demonstration
Plants. After laboratory experiments and bench-scale
testing show a process to be promising, ademonstration plant may be built to futher testand “demonstrate” the process, This plant is notintended to be a moneymaker and generally hasa capacity of several hundred to a few thousandbarrels per day. The next step may be variousstages of scale up to commercial scale, in whichcommercial-scale process units are used andproven, although the plant output is less thanwould be the case for a commercial operation.For synfuels, the typical output of a commercial
unit may be about 10,000 bbl/d. A commercialplant would then consist of several units oper-ating in parallel with common coal or shalehandling and product storage and terminal fa-cilities.
the number of potential users, technical uncer-tainties, and uncertainties about future croplandneeds for food production and the extent towhich good forest management will actually bepracticed. OTA has estimated that from 6 to 17quadrillion Btu per year (Quads/yr) of biomasscould be available to be used for energy by 2000,
depending on these and other factors. 39g At thelower limit, most of the biomass would be usedfor direct combustion applications, but therewould be small amounts of methanol, biogas, eth-anol from grain, and gasification as well.
Assuming that 5 Quads/yr of wood and plantherbage, over and above the lower figure for bio-energy, is used for energy by 2000 and that 1Quad/yr of this is used for direct combustion,then about 4 Quads/yr would be converted tosynfuels. If half of this biomass is used in airblowngasifiers for a low-Btu gas and half for methanolsynthesis (60 percent efficiency), this would resultin 0.9 million barrels per day oil equivalent(MMB/DOE) of low-Btu gas and 0.6 MMB/DOEof methanol (19 billion gal/yr). *
The 0.9 MMB/DOE of synthetic gas is about 5percent of the energy consumption in the resi-dential/commercial and industrial sectors, or 9percent of total industrial energy consumption.Depending on the actual number of small energyusers located near biomass supplies, this figuremay be conservative for the market penetrationof airblown gasifiers. Furthermore, the estimatedquantity of methanol is contingent on: 1) develop-
ment of advanced gasifiers and, possibly, prefab-ricated methanol plants that reduce costs to thepoint of being competitive with coal-derivedmethanol and 2) market penetration of coal-derived methanol so that the supply infrastruc-ture and end-use markets for methanol are readilyavailable. OTA’s analysis indicates that both as-sumptions are plausible.
In addition to these synfuels, about 0.08 to 0.16MMB/DOE (2 billion to 4 billion gal/yr) of etha-nol* * could be produced from grain and sugarJglbidO*If advanced biomass gasifiers methanol can be produced with
an overall efficiency of 70 percent for converting biomass to meth-anol, this figure will be raised to 0.7 MMB/DOE or 22 billion gal/yr.
**Caution should be exercised when interpreting the ethano( {ev-els, however, since achieving this level will depend on a complexbalance of various forces, including Government subsidies, marketdemand for gasohol, and gasohol’s inflationary impact on foodprices.

8/14/2019 Increased Automobile Fuel Efficiency and Synthetic Fuels: Alternatives for Reducing Oil Imports
http://slidepdf.com/reader/full/increased-automobile-fuel-efficiency-and-synthetic-fuels-alternatives-for 183/292
180 . Increased Automobile Fuel Efficiency and Synthetic Fuels: Alternatives for Reducing Oil Imports
crops, and perhaps 0.1 MMB/DOE of biogas andSNG from anaerobic digestion. * Taking thesecontributions together with the other contribu-tions from biomass synfuels results in the high andlow estimates given in table 50.
Summary
Combining the contributions from fossil andbiomass synfuels results in the two development
*The total potential from manure is about 0.14 MMB/DOE, butthe net quantitity that may be used to replace oil and natural gasis probably no more than so percent of this amount. In addition,there may be small contributions from municipal solid waste and,possibly, kelp.
Table 50.—Biomass Synthetic FuelsDevelopment Scenarios (MMB / DOE )
Year
Fuel 1980 1985 1990 1995 2000Low estimateMethanol ab. . . . . . . . . . . – (e) (e) (e) 0.1Ethanol c . . . . . . . . . . . . . (e) (e) (e) (e) (e)Low- and
medium-energyfuel gas a . . . . . . . . . . . (e) (e) ( e ) 0 . 1 0 . 1
Biogas and methane d . . (e) (e) (e) (e)
Total . . . . . . . . . . . . . . (e) (e) (e) 0.2 0.3
High estimateMethanol ab. . . . . . . . . . . – ( e ) 0 . 1 0 . 3 0 . 6Ethanol c . . . . . . . . . . . . . (e) (e) 0.1 . .Low- and
medium-energyfuel gas. . . . . . . . . . . . ( e ) 0 . 1 0 . 3 0 . 7 0 . 9
Biogas and methane d . . (e) ( e ) 0 . 1 0 . 2 0 . 2
Total . . . . . . . . . . . . . . (e) 0.1 0.6 1.3 1.8aFr~rn ~OOd and plant herbage and possibly municiPal solid waste.bEthanol could also be produced from wood and plant herbage, but methanol
Is likely to be a less expensive liquid fuel from these sources.cFrom grains and sugar croPs.dFrom an{mal msnure, municipal solid waste, and, possibly, kelp.eLess than 0,1 MMB/DOE.
SOURCE: Office of Technology Assessment.
scenarios shown in figure 17. Coal-derived syn-fuels provide the largest potential. Ultimately,production of fossil synfuels is likely to be limitedby the demand for the various synfuel products,the emissions from synfuels plants, and the costof reducing these emissions to levels required bylaw. Beyond 2000, on the other hand, synfuels
from biomass may be limited by the resourceavailability; however, development of energycrops capable of being grown on land unsuitablefor food crops, ocean kelp farms, and other spec-ulative sources of biomass could expand the re-source base somewhat.
1980 1985 1990 1995 2000
Year
SOURCE: Office of Technology Assessment.

8/14/2019 Increased Automobile Fuel Efficiency and Synthetic Fuels: Alternatives for Reducing Oil Imports
http://slidepdf.com/reader/full/increased-automobile-fuel-efficiency-and-synthetic-fuels-alternatives-for 184/292
Chapter 7
Stationary Uses of Petroleum
8/14/2019 Increased Automobile Fuel Efficiency and Synthetic Fuels: Alternatives for Reducing Oil Imports
http://slidepdf.com/reader/full/increased-automobile-fuel-efficiency-and-synthetic-fuels-alternatives-for 185/292
Contents
Page
Introduction . . . . . . . . . . . . . . . . . . . . . . . . . . . . . . . . . . . . . . . . . . . . . . . . . . . . . . . 183
Current Situation . . . . . . . . . . . . . . . . . . . . . . . . . . . . . . . . . . . . . . . . . . . . . . . . . . . 183
Future Demand . . . . . . . . . . . . . . . . . . . . . . . . . . . . . . . . . . . . . . . . . . . . . . . . . . . . 184
Fuel Switching . . . . . . . . . . . . . . . . . . . . . . . . . . . . . . . . . . . . . . . . . . . . . . . . . . . . . 185
Conservation . . . . . . . . . . . . . . . . . . . . . . . . . . . . . . . . . . . . . . . . . . .., O........ 188
Discussion . . . . . . . . . . . . . . . . . . . . . . . . . . . . . . . . . . . . . . . . . . . . . . . . . . . . . . . . 189
Summary . . . . . . . . . . . . . . . . . . . . . . . . . . . . . . . . . . . . . . . . . . . . . . . . . . . . . . . . . 191
TABLES
Table No. Page
51. U.S. Petroleum Demand . . . . . . . . . . . . . . . . . . . . . . . . . . . . . . . . . . . . . . . . . 18452. 1980 Petroleum Demand . . . . . . . . . . . . . . . . . . . . . . . . . . . . . . . . . . . . . . . . . 18453.1990 EIA Petroleum Demand Forecast for Stationary Fuel Uses . . . . . . . . . 18454. Summary of Energy Requirements for Displacing 1990 Fuel 0il . . . . . . . . . 18655. Annual Replacement Energy Requirements . . . . . . . . . . . . . . . . . . . . . . . . . . 18856. Investment Costs For Fuel Oil Replacement Energy . . . . . . . . . . . . . . . . . . . 18857. Energy Made Available by Conservation . . . . . . . . . . . . . . . . . . . . . . . . . . . . 189

8/14/2019 Increased Automobile Fuel Efficiency and Synthetic Fuels: Alternatives for Reducing Oil Imports
http://slidepdf.com/reader/full/increased-automobile-fuel-efficiency-and-synthetic-fuels-alternatives-for 186/292
Chapter 7
Stationary Uses of Petroleum
INTRODUCTION
Stationary users–buildings, industry, and elec-tric utilities—consumed about 8.1 million barrelsper day (MMB/D) of petroleum products in 1980.While the potential for reducing oil use by thesesectors is well recognized, it has not received asmuch attention as oil reduction opportunities intransportation. Indeed, U.S. energy policies in the1970’s implicitly encouraged increased oil use forstationary purposes. Lately, however, policy ob-
jectives have been set to encourage reduction inoil use by fuel switching and conservation. Theseobjectives include conservation goals and incen-tives to increase energy use efficiency by build-ings and industry, and fuel-switching goals to con-
vert utility and large industrial boilers from oil andnatural gas to coal.
This section examines the current mix of petro-leum products used in the stationary sector andrecent trends. A Department of Energy forecastof stationary demand on petroleum products wasselected to serve as a baseline. This will be usedto provide estimates of the volume of fuel oil thatcan be saved by either conservation or conver-sion to new natural gas and electricity. Readersshould note that these estimates only describereductions in oil use that are technically and eco-nomically plausible. Whether the estimated re-ductions are actually realized depends on hownumerous energy users and producers react to
Photo credit: Department of Energy
Cracks and very narrow spaces, such as those aroundwindow framing are insulated to increase
energy use efficiency
economic incentives and other factors affectingtheir choices. Some of these factors are discussedat the end of this section.
CURRENT SITUATION
Table 51 shows petroleum use by the stationaryand transportation sectors since 1965.
Stationary sectors have accounted for 45 to 48percent of total petroleum demand over this peri-od. Demand growth has occurred in industry and
electric utilities as a result of natural-gas curtail-ments during the 1970’s, environmental restric-tions on coal, and the rapid increase in electrici-ty demand since about 1973. The type of petro-leum product used is also important, since we
are primarily concerned with products most read-ily converted to transportation fuels. Table 52shows the distribution of major petroleum prod-ucts for 1980 among the stationary and transpor-tation sectors.
As fuel, the stationary sectors consume prin-cipally middle distillates and residual oil. Themajor components of the other category includespetrochemical feedstocks, asphalt, petroleumcoke, and refinery still gas. These are unlikely
183
98-281 0 - 82 - 13 : ~IL 3

8/14/2019 Increased Automobile Fuel Efficiency and Synthetic Fuels: Alternatives for Reducing Oil Imports
http://slidepdf.com/reader/full/increased-automobile-fuel-efficiency-and-synthetic-fuels-alternatives-for 187/292
184 Ž Increased Automobile Fuel Efficiency and Synthetic Fuels: Alternatives for Reducing Oil Imports
Table 51 .–U.S. Petroleum Demand (MMB/D)
Stationary Transportation
Year Industry Buildings Utilities Total Total
1965 2.2 3.0 0.3 5.5 6.01970 2.5 3.5 0.9 6.9 7.81975 2.8 3.2 1.4 7.4 8.91980 3.6 2.9 1.6 8.1 8.7
SOURCE: Department of Energy, Energy Information Administration, fWAmrua/Report to Congress, vol. Il.
candidates for conversion to transportation fuelsbecause modifications to refineries would be re-quired far beyond those needed to convert resid-ual fuel oil. ’ Further, some of these products,such as the petrochemical feedstocks and asphalt,could only be replaced by synthetic liquids. Theliquefied petroleum gases (LPGs) can be used di-rectly as a transportation fuel, as is the case withcars and trucks that have been modified to run
1 Refining Flexibility (Washington, D. C.: National Petroleum Coun-cil, 1980).
on propane. Widespread adoption will dependprincipally on the relative cost of propane com-pared with gasoline, diesel fuel, and methanolwhen the cost of motor vehicle conversion is in-cluded.
Since the current price of natural gas liquids–
the major source of propane–is and is likely toremain as high as the price of domestic crude oil,a significant shift to propane-powered vehiclesis not likely. Therefore, LPG was not consideredin this analysis of stationary fuel use. The majortarget of fuel switching and conservation, then,is the 4.4 MMB/D of distillate and residual fueloil in current use. They can be used as a transpor-tation fuel, although it will be necessary to up-grade residual fuel to gasoline and middle distil-lates by modifying the refinery process. Suchmodification is under way but will require con-siderable time and investment.2
20il and Gas Journa[ Jan. 5, 1981, p. 43.
Table 52.—1980 Petroleum Demand (MMBD )a
Stationary Transportation
Product Buildings Industry Electricity Total Total
Gasoline. . . . . . . . . . . . . . . . 0 0 0 0 6.3Distillate. . . . . . . . . . . . . . . . 1.0 0.7 0.2 1.9 0.95Residual . . . . . . . . . . . . . . . . 0.5 0.65 1.3 2.45 0.4Jet . . . . . . . . . . . . . . . . . . . . . o 0 0 0 1.1LPG . . . . . . . . . . . . . . . . . . . . 0.3 0.7 0 1.0 0Other. . . . . . . . . . . . . . . . . . . 0.7 2.0 0 2.7 0.2%iven in terms of product equivalent–5.5 million Btu per Barrel.
SOURCE: Department of Energy, Energy Information Administration, 1980 Annua/ Report to Congress, vol. Il.
Over the next decade some of this 4.4 MMB/Dwill be eliminated by fuel switching and conserva-tion as the price of oil rises. Indeed, a declineof 1.1 MMB/D took place between 1979 and1980.3 How much more is possible by 1990 de-pends on future oil prices, the costs of alterna-tives, the ability to finance these alternatives, andenvironmental and regulatory factors. The 1980
Energy Information Administration (EIA) estimateof 1990 demand is shown in table 53. This fore-
Table 53.—1990 EIA Petroleum a Demand Forecast forStationary Fuel Uses (MM B / D)b
Product Buildings Industry Electricity Total
Distillate. . . . . . . . 0.9 0.1 0.15 1.4Residual . . . . . . . . 0.3 0.2 0.9 1.15Total . . . . . . . . . . . 1.2 0.3 1.05 2.55
aThe “other” and LpG category of stationary petroleum demand is fOrecSSt toremain at its 1980 level of 3.8 MMB/D. This category, however, would then in-crease from 48 percent of all stationary uses in 1980 to 60 percent In 1990. It
has proven to be much less eiastlc to fuel price increases since 1973 than thedistillate–residuai fuel categow.
bBarrei of product—5.5 MMBtu Per barrel.
J 1980 Annua/ Repoti to Congress, VOI. 2, DOEIEIA-01 73(80)/2
(Washington, D. C.: U.S. Department of Energy, Energy informa-
tion Administration, 1980).SOURCE: Department of Energy, Energy Information Administration, Arrnua/
Report to Congress, vol. Ill.

8/14/2019 Increased Automobile Fuel Efficiency and Synthetic Fuels: Alternatives for Reducing Oil Imports
http://slidepdf.com/reader/full/increased-automobile-fuel-efficiency-and-synthetic-fuels-alternatives-for 188/292
Ch. 7—Stationary Uses of Petroleum • 185
cast is based on a 1990 oil price of $45 per bar-rel (bbl) (in 1980 dollars).
The forecast reduction of 1.8 MM B/D over thenext 10 years (from 4.4 MMB/D in 1980 to 2.6MMB/D in 1990) would be accomplished bymore efficient use, and by conversion to coal,
electricity, and natural gas. Beyond 1990, con-tinued reduction can be expected, particularlyin the electric utility sector, if the economic ad-vantages of alternate fuels and conservation con-tinue.
For the purpose of this study, OTA determinedthe technology (alternate fuels, conservation) andinvestment necessary to eliminate this 2.6-MMB/D usage during the 1990’s. This is aboutthe same level of reduction that can be achievedby going from a new-car fleet average of 30 milesper gallon (mpg) in 1985 to an average of 65 mpg
in 1995, * and is close to the target synthetic fuelsproduction level by 1992 set forth in the EnergySecurity Act.4 Therefore, it provides a good com-
*See ch. 5, p. 127.442 USC 8701, Energy Security Act, June 30, 1980.
parison for the remainder of the study. The restof this chapter describes how this eliminationmight be achieved and what it might cost.
First, fuel switching alone is considered, andsecond, conservation. OTA did not attempt toestimate a timetable other than to assume thatthe reductions take place throughout the 1990’s.This is consistent with the time needed to intro-duce similar savings from increased auto efficien-cy or from synthetic fuels production. * Wherepossible, serious time constraints that may ap-pear are mentioned. The focus, however, is oninvestment costs and resource requirements. Itis important to emphasize that because OTA’scalculations were based on the EIA 1990 forecast,costs of fuel switching and conservation neces-sary to go from the 1980 to 1990 levels of fueloil consumption were not counted. This some-what arbitrary decision will bias against conser-vation and fuel switching, since the least costlysteps are expected to be taken first, during the1980’s.
*See ch. 5, p, 127; ch. 6, p. 177.
FUEL SWITCHING
The prime candidates for eliminating this 2.6MMB/D of fuel oil by fuel switching are natural
gas, coal, and electricity from coal and naturalgas. Indeed, a considerable amount of the oilnow used by industry (about 20 percent) is aresult of converting from natural gas to oil dur-ing the mid-l970’s.5 This was partially a result ofthe Federal curtailment policy for natural gas thatgave low priority in many industrial applications(primarily boilers). Further, the uncertainty ofsupply that existed during that same periodcaused industry to switch other applications fromnatural gas to oil as well. In the buildings sector,“scarcity” of natural gas during the 1970’s, com-bined with the rapid rise in its price, caused atemporary halt in the growth rate of natural gas
51980 Annual Report to Congress, Vol. 2, op. cit., pp. 65 and107. This claim is inferred from these two tables which show a dropin natural gas consumption by industry between 1974 to 1979 ofover 20 percent and a corresponding increase in industrial oil con-
su mption.
use. There was no corresponding growth in pe-troleum use, however, unlike the case with in-
dustry, since electricity was the primary replace-ment energy.
Complete replacement of fuel oil in buildingsby natural gas alone would require about 2.4 tril-lion cubic feet per year (TCF/yr), assuming cur-rent end-use efficiency. If only electricity wereused, 425 billion kWh/yr of delivered electricenergy would be needed assuming an end-useefficiency increase of 67 percent. * By 1990, mostof the industrial processes that can use coal (pri-marily large boilers) will have been converted be-cause of the large difference in coal and oil prices
that currently exists.6
If all the remaining fuel oil — — - . —*Assuming heat pumps (water and space) with a seasonal per-
formance factor of 1.25 compared to oil furnaces with a seasonalperformance factor of 0.75.bcost and Qua/@ of Fuels for Electric Utility Plants, FebruaT 1981,
DOE/EIA-0075(81 /02) (Washington, D. C.: U.S. Department ofEnergy, Energy Information Administration, 1981), p. 3.
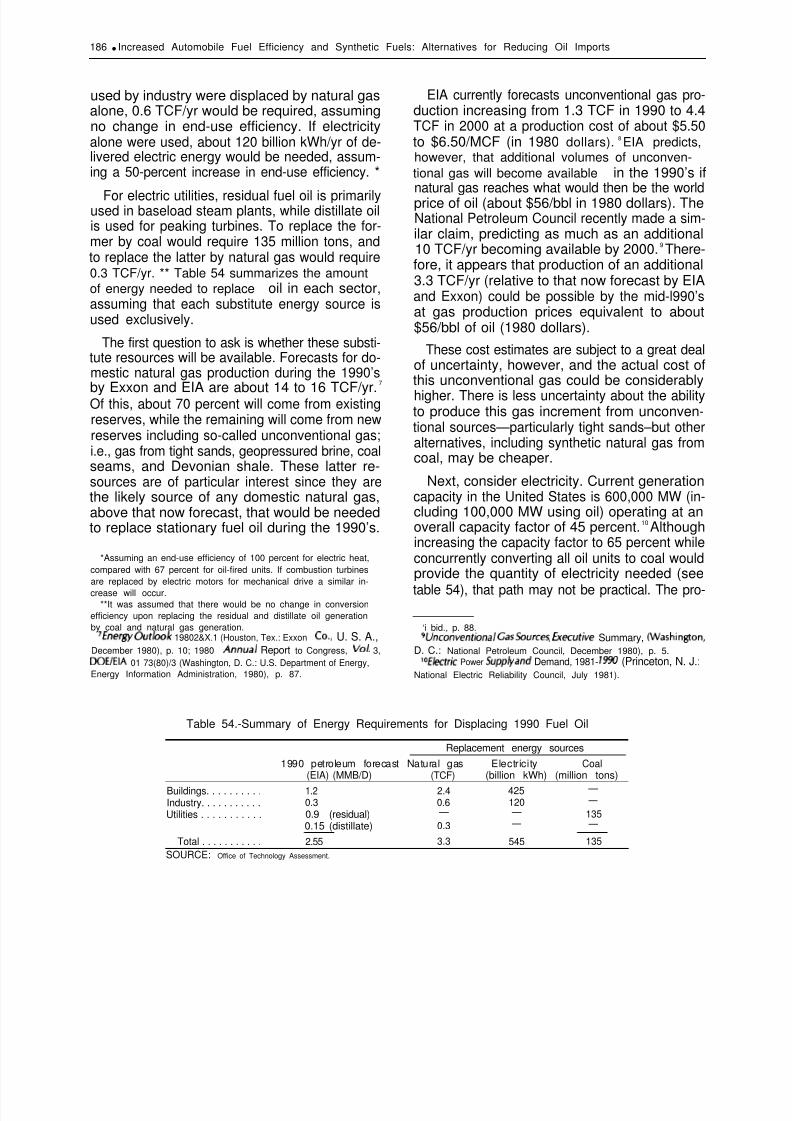
8/14/2019 Increased Automobile Fuel Efficiency and Synthetic Fuels: Alternatives for Reducing Oil Imports
http://slidepdf.com/reader/full/increased-automobile-fuel-efficiency-and-synthetic-fuels-alternatives-for 189/292
186 q Increased Automobile Fuel Efficiency and Synthetic Fuels: Alternatives for Reducing Oil Imports
used by industry were displaced by natural gasalone, 0.6 TCF/yr would be required, assumingno change in end-use efficiency. If electricityalone were used, about 120 billion kWh/yr of de-livered electric energy would be needed, assum-ing a 50-percent increase in end-use efficiency. *
For electric utilities, residual fuel oil is primarilyused in baseload steam plants, while distillate oilis used for peaking turbines. To replace the for-mer by coal would require 135 million tons, andto replace the latter by natural gas would require0.3 TCF/yr. ** Table 54 summarizes the amountof energy needed to replace oil in each sector,assuming that each substitute energy source isused exclusively.
The first question to ask is whether these substi-tute resources will be available. Forecasts for do-mestic natural gas production during the 1990’s
by Exxon and EIA are about 14 to 16 TCF/yr.
7
Of this, about 70 percent will come from existingreserves, while the remaining will come from newreserves including so-called unconventional gas;i.e., gas from tight sands, geopressured brine, coalseams, and Devonian shale. These latter re-sources are of particular interest since they arethe likely source of any domestic natural gas,above that now forecast, that would be neededto replace stationary fuel oil during the 1990’s.
*Assuming an end-use efficiency of 100 percent for electric heat,compared with 67 percent for oil-fired units. If combustion turbinesare replaced by electric motors for mechanical drive a similar in-
crease will occur.**It was assumed that there would be no change in conversion
efficiency upon replacing the residual and distillate oil generationby coal and natural gas generation.TEnergy Out/ook 19802&X.1 (Houston, Tex.: Exxon CO., U. S. A.,
December 1980), p. 10; 1980 Anrwa/ Report to Congress, Vo/. 3,DOE/EIA 01 73(80)/3 (Washington, D. C.: U.S. Department of Energy,
Energy Information Administration, 1980), p. 87.
EIA currently forecasts unconventional gas pro-duction increasing from 1.3 TCF in 1990 to 4.4TCF in 2000 at a production cost of about $5.50to $6.50/MCF (in 1980 dollars). 8 EIA predicts,however, that additional volumes of unconven-tional gas will become available in the 1990’s ifnatural gas reaches what would then be the world
price of oil (about $56/bbl in 1980 dollars). TheNational Petroleum Council recently made a sim-ilar claim, predicting as much as an additional10 TCF/yr becoming available by 2000.9 There-fore, it appears that production of an additional3.3 TCF/yr (relative to that now forecast by EIAand Exxon) could be possible by the mid-l990’sat gas production prices equivalent to about$56/bbl of oil (1980 dollars).
These cost estimates are subject to a great dealof uncertainty, however, and the actual cost ofthis unconventional gas could be considerablyhigher. There is less uncertainty about the abilityto produce this gas increment from unconven-tional sources—particularly tight sands–but otheralternatives, including synthetic natural gas fromcoal, may be cheaper.
Next, consider electricity. Current generationcapacity in the United States is 600,000 MW (in-cluding 100,000 MW using oil) operating at anoverall capacity factor of 45 percent.10 Althoughincreasing the capacity factor to 65 percent whileconcurrently converting all oil units to coal wouldprovide the quantity of electricity needed (see
table 54), that path may not be practical. The pro-
‘i bid., p. 88.qUnconventiona/ Gas %urces, boecutive Summary, Washington,
D. C.: National Petroleum Council, December 1980), p. 5.IOE/~trjc Power Supp/y and Demand, 1981- 19W (Princeton, N. J.:
National Electric Reliability Council, July 1981).
Table 54.-Summary of Energy Requirements for Displacing 1990 Fuel Oil
Replacement energy sources
1990 petroleum forecast Natural gas Electricity Coal(EIA) (MMB/D) (TCF) (billion kWh) (million tons)
Buildings. . . . . . . . . . 1.2 2.4 425 —
Industry. . . . . . . . . . . 0.3 0.6 120 —
Utilities . . . . . . . . . . . 0.9 (residual) — — 1350.15 (distillate) 0.3 — —
Total . . . . . . . . . . . 2.55 3.3 545 135
SOURCE: Office of Technology Assessment.

8/14/2019 Increased Automobile Fuel Efficiency and Synthetic Fuels: Alternatives for Reducing Oil Imports
http://slidepdf.com/reader/full/increased-automobile-fuel-efficiency-and-synthetic-fuels-alternatives-for 190/292
Ch. 7—Stationary Uses of Petroleum • 187
file describing the fuel oil load of buildings forheating peaks rather sharply during the winter,and nearly all of the electric energy required toreplace fuel oil would need to be generated dur-ing the 5 months of the heating season. Since theload profile is the primary determinant of the ca-
pacity factor, conversion to electric space andwater heating will likely do little to increase theoverall capacity factor. Therefore, as much as120,000 MW of new capacity may be needed.*,
The ease with which this much capacity couldbe added depends on the growth rate for elec-tricity for the remainder of the century in the ab-sence of this oil-to-electricity conversion (under-lying rate), and the financial health of the elec-tric utility industry. These two points are obvious-ly related because an industry which has difficultyraising capital, as is now the case, 11 will have dif-
ficulty meeting new generation requirements ofany kind. Currently forecasts of the electric de-mand growth rate range from near zero (by theSolar Energy Research Institute (SERl))
12to about
3.8 percent per year (by the National Electric Re-liability Council).13
In the latter case, capacity additions becomeso great during the 1990’s that the full incrementof capacity needed for fuel oil replacement(120,000 MW) could be met if the underlying ratedropped to 3.2 percent per year but the utilitiescontinued building at 3.8 percent per year. Ifgrowth of electricity demand in the absence ofour hypothetical fuel switching dropped to 2 per-cent per year, a capacity addition rate of 3 per-cent per year would meet both underlying de-mand and the fuel-switching demand. Underthese conditions, annual capital requirementswould be approximately $25 billion to $35 billion(1980 dollars) and annual capacity additionwould average about 27,000 MW. These are val-ues below those attained by the utility industry
*This is the capacity required to produce 54s billion kWh oper-ating at the current coal-fired average capacity factor of 52 percent.
11 “The Current Financial Condition of the Investor-Owned Elec-tric Utility Industry and Possible Federal Actions to Improve It, ”
Edison Electric Institute before the Federal Energy Regulatory Com-mission, Mar. 6, 1981.IZ~u;/~;ng a S~sta;na~/e Future, Vo/. Z, prepared by the Solar
Energy Research Institute, Committee on Energy and Commerce,U.S. House of Representatives, Washington, D. C., April 1981, p.837.13E/ectric power supply and Demand, 1981-1990, op. cit.
during the early 1970’s.14 This is manageable pro-vided the current financial problems are solved.If not, providing the replacement electricity fromnew capacity is unlikely.
Finally, there is the question of conversion ofthe electric powerplants that will still be burn-ing oil in 1990 to other fuels (primarily coal).There should be little difficulty producing the ex-tra coal for conversion of the plants burning resid-ual fuel oil.15 Further, as seen above, the naturalgas could be available as a fuel in those plantsburning distillate. There are barriers to convert-ing existing plants including environmental prob-lems of coal, the technical problems in actuallyconverting many of these powerplants, and diffi-culties in financing the conversion projects. Inmany cases it may be less costly to build a newpowerplant at a different site and retire the ex-isting oil-fired plant.
Considering the physical requirements alone,however, there could be adequate supplies, dur-ing the 1990’s, to replace 2.6 MMB/D of distillateand residual fuel oil by some combination of nat-ural gas and electricity along with coal (or pos-sibly nuclear) to replace the oil-fired electric utilityboilers.
Although the cost of this process is difficult tocalculate, it is possible to make an estimate bymaking several arbitrary, but plausible assump-tions based on the above analysis and current
operating conditions. First, it is assumed thatnatural gas replaces all of the fuel oil used by in-dustry and utility combustion turbines, and halfthe heating oil used by buildings. Second, it isassumed that electricity is used to replace theother half of the heating oil used by buildings.Finally, all electric powerplants using residual fueloil are replaced by coal conversions or new coal-fired powerplants. Table 55 summarizes thereplacement energy requirements for this sce-nario.
To estimate the costs of eliminating this 2.6
MMB/D of fuel oil by fuel switching, the follow-ing costs (in 1980 dollars) for the replacementenergy were used:
ldE/ectrjca/ World, Sept. 15, 1980, P. 69.
I SThe Direct Use of Coa[ OTA-E-86 (Washington, D. C.: U.S. con-
gress, Office of Technology Assessment, April 1979).

8/14/2019 Increased Automobile Fuel Efficiency and Synthetic Fuels: Alternatives for Reducing Oil Imports
http://slidepdf.com/reader/full/increased-automobile-fuel-efficiency-and-synthetic-fuels-alternatives-for 191/292
188 q Increased Automobile Fuel Efficiency and Synthetic Fuels: Alternatives for Reducing Oil /reports
Table 55.—Annual ReplacementEnergy Requirements a
ElectricBuildings Industry utilities Total
Natural gas (TCF) . . . 1.2 0.6 0.3 2.1Electricity (billion
kWh) . . . . . . . . . . . . 225 b – — 225
Coal (million tons) . . – – 135C
135aA99umes an increase in end-use efficiency of 67 percent when switching from
fuel oil to electdcity for space or water heating and no change when switchingfrom fuel oil to natural gee in any of the three sectors.
bRequ}re9 50,000 MW operating at a 50 percent capacity factor.c Assumes the l= oil-fired capacity, which is now forecast to OPerate at a 35
percent capacity factor (N ERC), can be replaced by 55,000 MW of coal-firedcapacity operating at 57.5 percent capacity factor.
SOURCE: Off Ice of Technology Assessment.
1. New coal-fired electric powerplants cost$900/kW, including all necessary environ-mental controls.16
2. Investment costs for natural gas from uncon-ventional sources (tight sands) are approxi-
mately $16,500/MCF per day. ” Operatingcosts, including transmission and distribu-tion, are about $1.30 / MCF.18
3. The investment cost for new coal surfacemines is approximately $9,000/ton of coalper day. Operating costs are about $6.50/ ton.19
4. The cost to convert oil fired capacity to coalis estimated at $600/kW.20
All of these costs are in 1980 dollars. Therefore,they will underestimate the actual costs of con-
IG~ec~~;Cal ASSeSS~e~t Guide, EPRI PS-1 201 -SR (Palo Alto, Calif.:
Electric Power Research Institute, July 1979), pp. 8-11.I TUnconventjona/ Ga s Sources, Tight Gas Reservoirs, Part 1, op.
cit., pp. E-1 15.la’’ Natural Gas Issues” (Arlington, Va.: American Gas Associa-
tion, May 1981), p. 8.19’’Comparative Analysis of Mining Synfuels” (Los Angeles, Calif.:
Fluor Corp., 1981).20’’The Regional Economic Impacts on Electricity Supply of the
Powerplant and Industrial Fuel Use Act and Proposed Amend-ments” (Washington, D. C.: Edison Electric Institute, April 1980),p. 37.
version in the 1990’s to the extent there are realincreases in these costs between new and themid-1990’s. Cost estimates are also needed forthe end-use equipment. This was simplified byassuming no change is needed for industry andcombustion turbines in converting from distillate
to natural gas. For buildings, heat pumps are usedwhen electricity is the new energy source, andnew gas furnaces are used for natural gas. Basedon current retail estimates these costs are $2,000and $1,200, respectively (1980 dollars), for unitscapable of delivering 100 million Btu of heat perheating season, and having the capacity to meetthe peak-hour heating Ioad.21 Table 56 summar-izes the investment costs per barrel per day re-placed for each sector.
The total investment, obtained by multiplyingthe per unit investment (table 56) by the amountof oil replaced (table 55), is about $230 billion(1980 dollars). These estimates include produc-tion of the energy resource (electric generatingplants, natural gas, and coal mines) and end-useequipment when needed. They do not includecosts to construct new transmission and distribu-tion facilities that might be needed. This omis-sion will be discussed below.
zlAcademy Airconditioning Co., Rockville, Md., private communi-
cation.
Table 56.—investment Costs ForFuel Oil Replacement Energy a b
Buildings Industry Utilities
Natural gas . . . . . . . . . . . . 121,000 100,000 90,000Electricity. . . . . . . . . . . . . . 110,000 – –Coal. . . . . . . . . . . . . . . . . . . – – 54,000aDollars per barrel of oil replaced per day.b Includes investment cost necessary to upgrade the replaced residual fuel oil
to gasoline and diesel where applicable. Cost is $14,000/bbi of residual per dayon the average, Purvin and Gertz, Inc., An Analysis of Potential for UpgradhrgOomest/c Refkrk!g Capacity, prepared for the American Gas Association, Ar-Ilngton, Va., March 1960.
SOURCE: Office of Technology Assessment.
CONSERVATION
The other major alternative for reducing oil use enough natural gas and electricity to substitutein the stationary sectors is conservation. Conser- for the remaining fuel oil. There have been nu-vation cannot completely eliminate fuel oil use merous estimates of conservation potential forby itself–but it can reduce it, and possibly free buildings and industry in the past several years.

8/14/2019 Increased Automobile Fuel Efficiency and Synthetic Fuels: Alternatives for Reducing Oil Imports
http://slidepdf.com/reader/full/increased-automobile-fuel-efficiency-and-synthetic-fuels-alternatives-for 192/292
Ch. 7—Stationary Uses of Petroleum • 189
The most detailed analysis is that recently com-pleted by SERI.22
The SERI estimates are used to examine thepossibility of and potential costs for eliminatingstationary uses of fuel oil over the period1990-2000. OTA has used the SERI analysis ofconservation measures in the buildings sector toobtain an approximation of the costs of eliminat-ing the remaining stationary uses of fuel oil in allsectors in the 1990-2000 period. These conserva-tion measures reduce the use of fuel oil, electri-city, and natural gas. The electricity and naturalgas saved is used to replace the fuel oil remain-ing after the conservation. In table 57, the SERIprojection for 2000 is given, by fuel, along withthe savings obtained relative to the 1990 baselinedemand (EIA forecast). The savings are the differ-ence between the SERI 2000 projection and the
EIA 1990 forecast. * As shown in table 57, conser-vation could eliminate 67 percent of the fuel oilused by buildings and provide more than enough
llBUllding-l Sustainable Future, op. cit., pp. s and 6.
*By using the 1990 EIA forecast rather than the 1990 SERI pro- jection as the starting point, we have compressed some of the sav-ings calculated by SE RI. They assumed that much of the savingswould occur between 1980 and 1990 with a result that their 1990projection of fuel oil use is considerably below the EIA forecast.Our calculation does not change the net savings but only the periodin which they could occur.
natural gas to eliminate the remaining fuel oilused in both buildings and industry, as well asdistillate used by electric utilities. Finally, enoughelectricity would be saved to replace the elec-tricity produced by oil-fired generation (see table54). The amount of natural gas and electricity
needed to do this are given in the last columnof table 57. About 65 percent of the SERI esti-mated savings for the buildings sector alone willachieve the goal.
The SERI study estimated an investment costof $335 billion (in 1980 dollars) to achieve theirsavings goals for 2000. * 23 If we arbitrarily allocatethese costs to the portion of the savings neededsolely for fuel oil elimination, the cost investmentfor the scenario is about $215 billion (65 percentof total). In addition, investment is needed in con-verting end-use equipment from fuel oil to natural
gas in buildings for oil not eliminated by conser-vation. Using the procedure described in the pre-vious section, this amounts to about $10 billion.The total investment for these measures is $225billion–equivalent to $88,000/bbl of oil replacedper day.
*Adjusted to reflect savings not accounted for by OTA’S choiceof base case.Zjlbld.
Table 57.—Energy Made Available by Conservation
SERI demand EIA demand Savings Savings used forEnergy source estimate (2000) estimate (1990) by 2000 oil substitutionFuel oil (MMB/D) . . . . . . . . . 0.4 1.2 0.8 —
Natural gas (TCF/yr). . . . . . . 4.5 7.8 3.3 1.7
Electricity (billion kWh/yr). . 1140 1580 440 250
SOURCE” Office of Technology Assessment.
DISCUSSION
The analysis described gives a plausible esti-mate of the technical and investment require-ments of eliminating stationary uses of oil be-tween 1990 and 2000. These requirements arenot forecasts, as mentioned above, but only de-scribe what is technically and economically with-in reason. There are several items, however, thatwere not considered in the calculation that willaffect these costs somewhat. In this section some
of the more important points are briefly dis-cussed.
In calculating the costs of conversion to natural
gas and electricity the possibility was ignored thatnew transmission and distribution equipmentwould be needed. This also holds for the conser-vation case, since natural gas freed by conserva-tion would need to be delivered to sites formerly

8/14/2019 Increased Automobile Fuel Efficiency and Synthetic Fuels: Alternatives for Reducing Oil Imports
http://slidepdf.com/reader/full/increased-automobile-fuel-efficiency-and-synthetic-fuels-alternatives-for 193/292
190 Ž Increased Automobile Fuel Efficiency and Synthetic Fuels: Alternatives for Reducing Oil Imports
using fuel oil, and it is likely that new transmis-sion and distribution facilities would be neededfor some of those locations. A transmission anddistribution operating cost for all the natural gasconversions was included but this is not likely tocover new construction where it is needed.
Similarly, the electricity made available by con-servation may not be able to substitute for oil-fired capacity without the construction of newtransmission lines. In a previous OTA study onsolar energy,24 the construction and operationcosts of both electric and natural gas transmis-sion and distribution systems were calculated.Using those values updated to 1980,25 it wasfound in the worst case–electricity used toreplace oil for heat in buildings—that the cost ofoil replaced should be increased by about 20 per-cent. In all other cases the adjustment is less than10 percent under the unlikely assumption thatall the replacement energy requires new transmis-sion and distribution facilities.
Another point concerns the choice of conserva-tion estimates. The SERI study is the most optimis-tic of several analyses which attempt to calculatethe potential for conservation under least costconditions. The calculations in the SERI study,particularly for buildings, are based on the mostcomplete analysis to date of the thermal charac-teristics of buildings, and include extensive ex-perimental data. Therefore, these engineeringand cost estimates can be considered as attain-
able.Though the SERI calculations were used, it is
not explicitly or implicitly claimed that SERI con-servation targets will be reached. In an OTA studyon building energy conservation recently com-pleted it is estimated that only about 40 percentof the targets will be reached under currentconditions.26 A number of economic constraintsand choices—including restrictive financial con-ditions, uncertainty of results, and high owner dis-count rates—will reduce the probability that these
zdApp/iCation of solar Technology to Today’s Ener~ Needs, VOI.1, OTA-E-66 (Washington, D. C.: U.S. Congress, Office of Technol-ogy Assessment, june 1978), p. 140.zSOi/ and Gas ]ourna~ Aug. 10, 1981, p. 76.zbThe Energy Efficiency of Buildings in Cities, OTA-E-168 (Wash-
ington, D. C.: U.S. Congress, Office of Technology Assessment,March 1982).
goals can be met. Even though it was not neces-sary to use the entire SERI estimate of savings toachieve OTA’s hypothetical goal of eliminatingstationary fuel oil use, more than two-thirds wasstill required. Therefore, while it is technicallypossible to eliminate all stationary fuel oil usethrough conservation, this is not likely to happen
under current conditions.
The final point concerns conversion of oil-firedelectric generation capacity to coal. Although thehigh end of the range of estimates for conversioncosts was used, in some instances even this willbe insufficient. There will be sites where conver-sion is impossible because of lack of coal storagefacilities or inadequate coal transportation, orwhere excessive derating of the boiler would benecessary. In such cases, it will make more senseto retire the plant and replace it with new capaci-ty built elsewhere. For these cases, the replace-
ment cost will equal the cost of new capacity,including any needed transmission costs. Itshould be expected, however, that new coal ornuclear generation will have a much higher ca-pacity factor than current oil generation becauseof the former’s lower cost of producing energy.
it should be remembered, however, that theload profile will dictate the capacity factor to agreat extent. With the large amount of capacityunder discussion, it can be expected that therewill be sufficient load diversity so that powertransfers between regions will allow for an in-
crease in capacity factor to a level that now ex-ists for coal-fired powerplants (about 57 percent).
The possibility of power transfers was assumedand accounted for in the calculation by assum-ing the 57-percent capacity factor. The result isthat less capacity is needed to replace the elec-tricity produced by the oil-fired generation thatis expected to be on-line in 1990. To some degreethis capacity reduction will take care of some ofthe site-specific problems described above.
Another point to be considered is whether coal-fired electricity will be less expensive than thatgenerated from residual fuel oil in the 1990’s. Be-cause of the continuing decline in crude oil qual-ity27 —i.e., lower gravity—it will be increasingly
zTOil and Gas Journa[ Apr. 20, 1981, p. 27.

8/14/2019 Increased Automobile Fuel Efficiency and Synthetic Fuels: Alternatives for Reducing Oil Imports
http://slidepdf.com/reader/full/increased-automobile-fuel-efficiency-and-synthetic-fuels-alternatives-for 194/292
Ch. 7—Stationary Uses of Petroleum q 191
more costly to refine this oil up to the point whereno residual oil remains. Currently, the averagecost of converting residual fuel oil to middledistillates and gasoline is about $10,000 to$14,000/bbl/d.28 The marginal cost, however, ismuch higher and will grow as more and more
residual oil is transformed and as the crude oilfeed becomes heavier.——ZeAn Ana/yS;~ of potentja/ for Upgrading Domestic Refining
Capacity, op. cit.
Consequently, it is possible that it would becheaper to use the residual oil directly in boilers,as it is used now, and produce the lighter fuelsfrom oil shale or by way of methanol from coal.To reach that point, residual fuel oil would haveto be priced below coal as a boiler fuel because
the residual oil would have no other market. Noattempt was made to determine when or to whatextent this may occur.
SUMMARY
Elimination of fuel oil use in the stationary sec-tors (buildings, industry, electric utilities) appearsto be technically plausible by 2000. The cost foreither the conservation or fuel-switching scenario
would be high. As shown, the total cost for the1990-2000 period would be about $225 billionto $230 billion to eliminate the 2.6 MM B/D fore-cast still to be in use by 1990. These costs are con-sistent with estimates for synthetic fuels produc-tion and automobile efficiency improvement thatwould produce about the same amount of oil. *In addition, reduction from current use of 4.4MMB/D to the 1990 level will also require severaltens of billions of dollars. As noted earlier, the1980-90 costs were not taken into account in thecalculations.
Uncertainties about these estimates for station-ary fuel oil elimination by conversion arise fromchanges in powerplant construction costs, in coalprices, in the cost of producing natural gas fromtight sands, and in the discovery rate of new
*See ch. 5, p. 139; ch. 6, p. 172.
natural gas. All or any of these couId cause signif-icant swings in the cost of displacing oil, most like-ly upward. In the absence of information aboutthese uncertainties, the estimates given here,
which represent the best analyses to date, canbe considered as reasonable. Similarly, for con-servation, uncertainties about the conservationpotential of buildings exist which can only becleared up as more and more buildings are ac-tually retrofit. Preliminary audits of buildingsalready retrofitted have indicated a range of en-ergy savings from 80 percent less than predictedto 50 percent more.29 The sample for this meas-urement was small, but it does indicate the levelof uncertainty.
The estimates that were derived are plausibletargets. They are not forecasts or even necessarilydesirable goals. That will have to be decided with-in the context of all the economic choices possi-ble and within the country’s policy objectivesabout oil imports.
ZgEnergy Effjc/ency of Buildings in Cities, op. cit.

8/14/2019 Increased Automobile Fuel Efficiency and Synthetic Fuels: Alternatives for Reducing Oil Imports
http://slidepdf.com/reader/full/increased-automobile-fuel-efficiency-and-synthetic-fuels-alternatives-for 195/292
Chapter 8
Regional and National Economic Impacts

8/14/2019 Increased Automobile Fuel Efficiency and Synthetic Fuels: Alternatives for Reducing Oil Imports
http://slidepdf.com/reader/full/increased-automobile-fuel-efficiency-and-synthetic-fuels-alternatives-for 196/292
Page
Introduction . . . . . . . . . . . . . . . . . . . . . . . . . . . . . . . . . . . . . . . . . . . . . . . . . . . . . . . 195
Economic impacts of Automotive Change . . . . . . . . . . . . . . . . . . . . . . . . . . . . . . 195Overview . . . . . . . . . . . . . . . . . . . . . . . . . . . . . . . . . . . . . . . . . . . . . . . . . . . . . . . 195Manufacturing Structure . . . . . . . . . . . . . . . . . . . . . . . . . . . . . . . . . . . . . . . . . . . 196
Manufacturer Conduct . . . . . . . . . . . . . . . . . . . . . . . . . . . . . . . . . . . . . . . . . . . . 197Other Firms . . . . . . . . . . . . . . . . . . . . . . . . . . . . . . . . . . . . . . . . . . . . . . . . . . . . . 198
Economic lmpacts of Synfuels . . . . . . . . . . . . . . . . . . . . . . . . . . . . . . . . . . . . . . . . 203The Emerging Industrial Structure of Synfuels. . . . . . . . . . . . . . . . . . . . . . . . . . 204Potential Resource Bottlenecks and Inflation . . . . . . . . . . . . . . . . . . . . . . . . . . 209Finance Capital and Inflation . . . . . . . . . . . . . . . . . . . . . . . . . . . . . . . . . . . . . . . 214Final Comments About inflation and Synfuels . . . . . . . . . . . . . . . . . . . . . . . . . 215
TABLES
Table No. Page
58. GM’s Major Materials Usage . . . . . . . . . . . . . . . . . . . . . . . . . . . . . . . . . . . . . . 198
59. 1980 Motor Vehicles (MVs) and Parts Supplier Trade . . . . . . . . . . . . . . . . . . 19960. Examples of Supplier Changes and Associated New Capacity Investment . 20161. 1980 Auto Repair Facilities . . . . . . . . . . . . . . . . . . . . . . . . . . . . . . . . . . . . . . . 20162. Potentially Critical Materials and Equipment for Coal Liquids
Development. . . . . . . . . . . . . . . . . . . . . . . . . . . . . . . . . . . . . . . . . . . . . . . . . . . 21263. Peak Requirements and Present Manufacturing Capacity for Heat
Exchangers . . . . . . . . . . . . . . . . . . . . . . . . . . . . . . . . . . . . . . . . . . . . . . . . . . . . 213
FIGURES
Figure No. Page
18. Tire Industry Trends . . . . . . . . . . . . . . . . . . . . . . . . . . . . . . . . . . . . . . . . . . . . . 200
19. Time Series Comparison: Construction Costs and Consumer Prices . . . . . . 216

8/14/2019 Increased Automobile Fuel Efficiency and Synthetic Fuels: Alternatives for Reducing Oil Imports
http://slidepdf.com/reader/full/increased-automobile-fuel-efficiency-and-synthetic-fuels-alternatives-for 197/292
Chapter 8
Regional and National Ecomomic Impacts
INTRODUCTION
This chapter examines the types, timing, and
distribution of economic impacts associated withboth development of a synthetic fuels industryusing national coal and oil shale resources, andimproved automobile fuel efficiency. identifyingand assessing these impacts are difficult because:impacts are not distributed evenly in time oracross regions, so that people may not receivebenefits in proportion to the adverse conse-quences they experience; impacts are not trans-latable into directly comparable terms (e.g., dol-lars); the evaluation of impacts is subjective,based on perceptions of the uncertain benefits
cumulative and may be difficuIt to monitor or at-
tribute solely to a particular technology choice.This chapter assesses the broad economic im-
pacts of synfuels and changes in auto technology.Chapter 9 further analyzes employment effectsand discusses other social impacts of these tech-nological developments. Decisions about synfuelsand making cars more efficient will require trade-offs in terms of energy use, economic growth, andsocial welfare and equity. There will be both ben-eficial and adverse social consequences for theNation as it moves towards energy independ-
and costs of new technologies;
ECONOMIC
Overview
and impacts are ence.
IMPACTS OF AUTOMOTIVE CHANGE
The economic impacts of improving automo-tive technology result primarily from two factors:the large investments that will be required forassociated capacity, and changes in the goodsand services purchased by the auto manufactur-ers. Large investments increase financial risk, ex-haust profits, and influence the ability of firms toraise outside capital. Changes in goods and serv-ices used by manufacturers affect suppliers and,in turn, local economies. As automotive fueleconomy increases, the structure and conductof the auto industry and the relationship of thedomestic auto industry to the general economychange. Radical increases in demand for fueleconomy, induced either by changes in consum-er preferences or by Government mandates,would lead to greater industry change, most likelyin the form of acceleration or exacerbation of cur-rent trends.
Changes in the auto industry stem from bothtechnological developments and new markettrends, including strong competition from foreignmanufacturers. Large increases in demand for fueleconomy, and for small cars relative to large cars,
encourage the industry to improve the fuel econ-omy of all car classes and to invest in the pro-duction of small cars. These activities help domes-tic manufacturers to satisfy relatively new de-mands, but at the cost of diminished profits dur-ing at least the short term. Profits can fall whenmanufacturers prematurely write off large-car andother capacity investments and change their pric-
ing strategies to replace large-car profits withsmall-car profits.
Meanwhile, manufacturers lose money whensales of their least efficient models decline. Highfixed costs and scale economies make their prof-itability vulnerable to sales declines of even a fewpercent. Profits would therefore also fall ifdomestic manufacturers lost market share to for-eign firms. Future opportunities to gain marketshare and profits will be limited by slowing mar-ket growth. *
*Th e u s auto market is nearly saturated (there were 0.73 cars
for every licensed driver in 1979, accordin g to the Motor VehicleManufacturers Association) and the U.S. population is growing slow-ly. Therefore, auto sales will grow at lower rates than in past dec-ades, probably averaging 1 to 1.5 percent per year.
195

8/14/2019 Increased Automobile Fuel Efficiency and Synthetic Fuels: Alternatives for Reducing Oil Imports
http://slidepdf.com/reader/full/increased-automobile-fuel-efficiency-and-synthetic-fuels-alternatives-for 198/292
—
196 Ž Increased Automobile Fuel Efficiency and Synthetic Fuels: Alternatives for Reducing Oil Imports
Manufacturing Structure
The U.S. automotive industry includes threemajor manufacturers—General Motors (GM),Ford, and Chrysler-plus a smaller manufacturer,AMC (now almost half-owned by Renault, a
French firm) and some very small specialty carmanufacturers. The three major manufacturershave historically been characterized by moderatelevels of vertical integration and broad productlines that include trucks and other vehicles as wellas automobiles. During the past few decades,GM’s operations have been the most extensiveboth vertically and horizontally; Chrysler’s havebeen the least extensive.
Because of the high costs of productionchange, U.S. auto manufacturers are becomingless vertically integrated, relying increasingly onsuppliers to. make components and other vehi-cle parts. For example, the Department of Trans-portation (DOT) reported that in late 1980 alone,domestic manufacturers announced purchasingagreements with foreign suppliers for over 4million 4-cylinder gasoline engines plus severalhundred thousand units of other engines andparts. Reliance on outside suppliers, referred toas “outsourcing,” relieves short-term spendingpressures on manufacturers. By spending less ini-tially to buy parts rather than new plants andequipment (in which to make parts), manufac-turers can afford to make more production
changes while exposing less cash to the risk offinancial loss due to limited or volatile consum-er demands.
On the other hand, outsourcing may causemanufacturers to lose control over product qual-ity. Also, manufacturers may incur higher vehi-cle manufacturing costs in the longer term be-cause the price of purchased items includes sup-plier profits as well as production costs. Becauseof more severe financial constraints, Ford andChrysler tend to rely on suppliers more than GM.In the future, all domestic manufacturers mayoutsource more from domestic suppliers, foreign
firms, or foreign facilities owned by domesticmanufacturers as a means of reducing capital in-vestments and thus short-term costs.
Manufacturers are consolidating their opera-tions across product lines and engaging in joint
ventures, primarily with foreign manufacturers.While there appears to be no up-to-date sourceof data aggregating these changes, trade journalsand the business press report that American firmsare sharing production and research activitieswith foreign subsidiaries, with foreign firms i n
which they have equity (Ford with Toyo Kogyo,GM with Isuzu and Suzuki, Chrysler with Mitsu-bishi and Peugeot, AMC with Renault), and withother foreign firms. Joint ventures are also increas-ingly common between non-American firms,which have historically been highly intercon-nected.
Cooperative activity among auto firms world-wide is likely to grow. Many firms will be unableto remain competitive alone, because of thegrowing costs and risks of improving automotivetechnology and increasing competition in mar-kets around the world. The quickest way for U.S.manufacturers to respond to a mandated or de-mand-induced fuel economy increase would beto use foreign automotive concepts directly, bylicensing designs, assembling foreign-made auto-mobile kits, or marketing imported cars undertheir own names. GM and Ford, for example, as-semble Japanese-designed cars in Australia andAMC sells Renaults in the United States.
Domestic companies can make profits by mere-ly selling foreign-designed cars. They can gain ad-ditional manufacturing profits without risking ad-ditional capital if they sell cars made by com-
panies in which they have equity. Cooperativeactivity (and, in the extreme, mergers and acquisi-tions) allows firms to pool resources, afford largeinvestments in research and development (R&D)or in plant and equipment, gain scale economies,and spread large financial risks. It is consistentwith the reduction in the number of autonomousauto producers widely predicted by industry ana-lysts.
Although the number of automotive manufac-turing entities is declining worldwide, there maybe continued growth in the number of firms pro-
ducing and selling in the United States. Already,Volkswagen produces cars in Pennsylvania andis building a plant in Michigan; Honda is plan-ning to build cars in Ohio; and Nissan is buildinga light truck plant in Tennessee. There are nowabout 23 different makes of foreign cars sold in

8/14/2019 Increased Automobile Fuel Efficiency and Synthetic Fuels: Alternatives for Reducing Oil Imports
http://slidepdf.com/reader/full/increased-automobile-fuel-efficiency-and-synthetic-fuels-alternatives-for 199/292
Ch. 8—Regional and National Economic Impacts q 19 7
the United States, excluding “captive imports”sold under domestic manufacturers’ nameplates(e.g., the Plymouth Colt, which is made by Mitsu-bishi).’ Manufacturers of captive imports, includ-ing Isuzu and Mitsubishi, are already preparingto enter the U.S. market directly.
Manufacturer Conduct
U.S. auto manufacturers are fundamentally al-tering their product, production, and sales strat-egies as automobile technology and consumerdemand change. Several changes in product pol-icy include the following.
First, the number and variety of models is fall-ing. The highest number of models offered by do-mestic manufacturers was 375 in 1970; 255 wereoffered in 1980.2 Manufacturers might sharplyreduce the number of available models to in-crease fuel economy quickly, by producing rela-tively efficient models on overtime and ceasingproduction of relatively inefficient models.
Second, while cars of all size classes are shrink-ing in number, small cars are becoming moreprominent in number, share of capacity, and con-tribution to revenues relative to large cars. Re-cent changes in price strategy have led to smallerprofit differentials by vehicle size and higher ab-solute and relative small-car prices. As individualmodels become more alike in size, manufacturerswill differentiate models by visible options and
design.
Third, manufacturers may introduce new, oil-conserving products such as very small “mini”cars (e.g., GM’s P-car and Ford’s Optim projects)and vehicles powered by electricity as well as al-ternating fuels.
Cost-reducing alterations to the physical andfinancial characteristics of individual firms–wide-Iy reported in trade journals, the business press,and company publications—help manufacturersadjust to declines in sales and profits and grow-ing investment requirements. Cost-cutting efforts
‘Automotive News, /98 1 Market Data nook (Detroit, Crain Com-munications, Inc., Apr. 29, 1981 ).
2Maryann N. Keller, “Status Report: Automobile Monthly Vehi-cle Market Review” (New York: Paine, Webber, Mitchell, Hutchins,Inc., February 1981).
include reductions in white-collar employmentand elimination of relatively inefficient or un-needed capacity. During the last couple of yearsGM, Ford, and Chrysler have sold or announcedplans to sell several manufacturing and officefacilities. One investment analyst estimates that
sales of assets may have provided over $600 mil-lion to GM and Ford during 1981.3
Efforts to reduce long-term costs focus on meas-ures to improve productivity and reduce laborcosts per unit. To improve productivity, manufac-turers (and suppliers) are already investigating andbeginning to use new types of equipment, plantdesigns, and systems for materials handling, qual-ity control, and inventory management. Industryanalysts and firms also expect that improved coor-dination between management and labor, ven-dors, and Government will be important meansfor improving productivity and competitiveness.Finally, manufacturers maintain that reductionsin hourly labor costs (wages and/or benefits) areessential for making U.S. cars competitive withJapanese cars. Whether, when, and how muchlabor costs are lowered depends on negotiationsbetween manufacturers and the United AutoWorkers union.
Another cost-cutting measure is reduction inplanned capital spending, Spending cutbacks af-fect firms differently, depending on their context.For example, Chrysler reduced 1980 plannedcapital spendings by $2 billion, halting a diesel
engine project and others.4 GM has announcedcutbacks that take the form of spending defer-rals and cancellations of planned projects (withlittle effect on immediate cash flow, however).
Another factor which complicates the evalua-tion of cutbacks is that U.S. projects abroad are,and could be, used to supply the U.S. market.Foreign projects are relatively cheap where for-eign partners or foreign governments share in orsubsidize investments. Cost-cutting efforts areconsistent with growth in the share of U.S. autoinvestment and production abroad, because facil-
ities in Central and South America, Asia, and inparts of Europe generally produce at lower costs
3MarYann N. Keller, personal communication, 1981.
4Ward’s Automotive Reports, June 15, 1981.

8/14/2019 Increased Automobile Fuel Efficiency and Synthetic Fuels: Alternatives for Reducing Oil Imports
http://slidepdf.com/reader/full/increased-automobile-fuel-efficiency-and-synthetic-fuels-alternatives-for 200/292
198 Ž Increased Automobile Fuel Efficiency and Synthetic Fuels: Alternatives for Reducing Oil Imports
and sell in home markets that are more profitablethan the U.S. market.
Some analysts believe that if extreme pressureswere placed on U.S. manufacturers to make siz-able investment in brief periods of time, Ford andGM (at least) would reduce U.S. production in
favor of foreign production (Chrysler has divestedforeign facilities to obtain cash). U.S. manufac-turers and suppliers are already operating withhigh fixed costs, large investment requirements,weak demand, and labor costs higher than for-eign competitors. If there are sharp increases infuel economy demand, or if there are othersources of growth in perceived investment re-quirements–without offsetting changes in manu-facturing and demand/market share–these devel-opments might give auto firms additional incen-tives to curb, if not abandon, auto production inthe United States. If U.S. production were cur-
tailed, it would affect production of new, veryefficient small cars while U.S. production of largerand specialty cars would probably continue.Large and specialty cars are characterized by con-sumer demand that is relatively insensitive toprice and in many cases limited to U.S. carbuyers.
Other Firms
Suppliers
Automobile suppliers manufacture a wide vari-
ety of products, including textiles, paints, tires,glass, plastics, castings and other metal products,machinery, electrical/electronic items, and oth-ers. Changes in the volumes of different materialsused to produce cars and the ways in which carsare produced are changing the demands on sup-pliers. In the near term, for example, GM predictsthat the average curb weight of its cars will fall21 percent, from 3,300 lb in 1980 to about 2,600lb in 1985, with up to 67 percent more aluminum,48 percent more plastics, and 30 percent less ironand steel, by weight. Rubber use will also fall.GM predicts that steel will comprise a relatively
constant proportion of car weight, while the pro-portion of iron will fall and aluminum and plas-
tics proportions may even double by 19855 (seetable 58).
Changes in demands for materials and othersupplies create pressures on traditional suppliersto close excess capacity and invest to developor expand capacity for new or increasingly impor-
tant products. They also create new business op-portunities for firms whose products becomenewly important to auto manufacturers, such assemiconductor and silicone producers. The de-gree of hardship on individual traditional suppli-ers depends on how much of their business isautomotive and on their resources for change.Like the auto manufacturers, suppliers operatein the context of a cyclical market which cancause their cash flow to be unstable. Table 59indicates the dependence of different suppliergroups on automotive business as of 1980.
The steel and rubber industries have alreadybeen adversely affected by changing auto de-mands together with stronger import competi-tion. Tire manufacturers have suffered with therise in popularity of radial tires (which are re-placed less frequently than bias ply tires and re-quire different production techniques) and thefall in rubber use per vehicle. Between 1975 and1980, over 20 tire plants (about one-third of thedomestic total) were closed, one major tire manu-
5“GM Sees Big Gain for Aluminum, Plastics in ‘Typical’ 1985,”Ward’s Automotive Reports, Apr. 27, 1981.
Table 58.—GM’s Major Materials Usage(per typical car, 1980 v. 1985)
1980 1965
Percent PercentMaterials Pounds total Pounds totalIron. . . . . . . . . . . . . 500 15%0 250-300 10-12%Steel. . . . . . . . . . . . 1,900 58 1,450 58Aluminum . . . . . . . 120 4 145-200 6-8Glass . . . . . . . . . . . 92 3 60Plastics . . . . . . . . . 203 6 220-300 8-12Rubber. . . . . . . . . . 86 3 88 a 3 a
Other . . . . . . . . . . . 377 11 277 11
Total . . . . . . . . . . 3,300 100% 2,600 100%
%M projects actual rubber use to be less than SS lb in 19S5.
SOURCE: General Motors Corp., reported in Wards Automotke Reports, Apr. 27,1981.

8/14/2019 Increased Automobile Fuel Efficiency and Synthetic Fuels: Alternatives for Reducing Oil Imports
http://slidepdf.com/reader/full/increased-automobile-fuel-efficiency-and-synthetic-fuels-alternatives-for 201/292

8/14/2019 Increased Automobile Fuel Efficiency and Synthetic Fuels: Alternatives for Reducing Oil Imports
http://slidepdf.com/reader/full/increased-automobile-fuel-efficiency-and-synthetic-fuels-alternatives-for 202/292
200 Ž Increased Automobile Fuel Efficiency and Synthetic Fuels: Alternatives for Reducing Oil Imports
260
240
220
200
Figure 18.—Tire Industry Trends
Consumption patterns for automotive tires
Year
80
20
Major tire manufacturer earnings fall,July 1979 to June 1980, as the table below shows:
Company
Armstrong. . . .Cooper . . . . . .Dunlop . . . . . .Firestone . . . .General . . . . . .Goodrich . . . . .Goodyear . . . .Mohawk . . . . .Uniroyal . . . . .
SOURCE: U.S. Department of Commerce, Bureau of Industrial Economics
strengthening their international operations,diversifying away from the U.S. market. Small-and medium-size firms are likely to follow automanufacturers in undertaking joint R&D and pro-duction ventures, while mergers and acquisitionsand even closings or bankruptcies are likely. * TheA&M survey predicted that decline in the num-
bers of suppliers will lead to increased verticalintegration among suppliers, while strong import
Change in earnings
1981 U.S Industrial Outlook January 1981.
competition and other market changes will mo-tivate increases in supplier productivity.
Sales and Service
Other segments of the auto industry includedealers and replacement part and service firms.The latter group, which serves consumers after
they buy their cars, is called the automotive after-market.
*According to Dun & Bradstreet, transportation equipment firms,primarily including auto suppliers, suffered financial failure at a rateof 101 per 10,000 in 1960, as compared with a rate of 42 per 10,000for all manufacturers.
Dealer sales activities are not necessarily af-fected by changing auto technology per se. Salesdepend on consumer income and general eco-

8/14/2019 Increased Automobile Fuel Efficiency and Synthetic Fuels: Alternatives for Reducing Oil Imports
http://slidepdf.com/reader/full/increased-automobile-fuel-efficiency-and-synthetic-fuels-alternatives-for 203/292
Ch. 8—Regional and National Economic Impacts • 201
Table 60.—Examples of Supplier Changes and Associated New Capacity Investment a
Approximate capital requirements forCharacteristics property, plant, and equipment
Foundries90 percent of auto castings use iron, 92 percent of which
are sand cast, and auto manufacturers operate about 20percent of U.S. sand casting capacity
Downsizing and production of smaller parts generatesexcess capacityMaterials substitution reduces sand casting with iron and
increases die casting with aluminum
Metal stampingAutos have had up to 3,000 stampings and auto
manufacturers produce about 60 percent of all stampingsby weight
Materials substitution decreases carbon steel, increaseshigh-strength steel and aluminum for stampings
Plastics processingInjection molding
Compression molding
Reaction injection molding
$21 million (typical independent die cast foundryproducing 15,000 tons/year)
$67 million (typical captive plant producing stampingsfor 175,000 cars/year; independent plants aresmaller and cheaper)
$31 million (typical plant producing 65 million lbparts/year)
$43 million (typical plant producing 60 million lbcompound/year
$19 million (typical plant producing 30 million lb
parts/year)aFi~u~~~ for comp le t e l y new fdities.
SOURCE: Booz-Allen & Hamilton, Inc.. Automotive Marrufactudna Processes, meDared for the Department of TransDotiation, National Hiahwav Traffic Safetv Adminis-.tration, February 1961.
nomic conditions (including the availability ofcredit), demographic conditions (includinghousehold size), the price of fuel, and vehicleprice and quality attributes. Although consumershave responded to recent gasoline price increasesby demanding relatively fuel-efficient cars, the ex-perience of the recent recession illustrates thatoverall sales levels in a given year are primarilydetermined by consumer finances and not by ve-
hicular technology.There are about 300,000 automobile repair fa-
cilities in the United States11 (see table 61). Newautomobile technology affects them becauseautomobile design and content are changing. Forexample, problems in new, computer-controlledcomponents will be diagnosed with computer-ized equipment, and plastic parts will be repairedwith adhesives rather than welding. Componentsare more likely to be replaced than repaired onthe vehicle or even at the repair shop. Whileautomobile service firms will have to invest in
new equipment and skills to service new cars,continued service needs of older cars may easethe transition,
11 “Auto Repair Facilities Total 300,000, ” Warcl’s Automotive Re-
ports, Apr. 6, 1981.
Table 61 .—1980 Auto Repair Facilities
Type of facility QuantityDealers . . . . . . . . . . . . . . . . . . . . . . . . . . . . . . . . . . . 26,000Auto repair shops (independent and franchised) 170,000Tire—battery-accessory outlets . . . . . . . . . . . . . 18,850Other auto and home supply stores . . . . . . . . . . 1,860Gasoline stations . . . . . . . . . . . . . . . . . . . . . . . . . . 70,000General merchandise stores . . . . . . . . . . . . . . . . . 3,500All others . . . . . . . . . . . . . . . . . . . . . . . . . . . . . . . . . 1,430
Total . . . . . . . . . . . . . . . . . . . . . . . . . . . . . . . . . . . 292,240
Total including facilities selling only parts,accessories . . . . . . . . . . . . . . . . . . . . . . . . . . . 331,090
SOURCE: Wards Autornotlve Reports, Apr. 6, 1981.
However, the concurrent operation of very dif-ferent types of cars requires firms to double theirparts inventories to service both types. The dollarvalue of parts and the frequency of repairs arealso likely to differ between new and old cartypes. Manufacturers are attempting to curb serv-ice cost growth by designing cars for easy servic-ing. For example, the Ford Escort and Lynx andthe Chrysler K and Omni/Horizon cars were de-
signed so that servicing during the first 50,000miles would cost less than $150.12
— - . —‘zFrancis j. Gaveronski, “Ford’s New Escort, Lynx Designed for
Easy Service,” Automotive News, May 19, 1980, and “Chrysler K-
car to Stress Ease of Diagnosis, Repair, ” Automotive News, June
16, 1980.

8/14/2019 Increased Automobile Fuel Efficiency and Synthetic Fuels: Alternatives for Reducing Oil Imports
http://slidepdf.com/reader/full/increased-automobile-fuel-efficiency-and-synthetic-fuels-alternatives-for 204/292
202 Ž Increased Automobile Fuel Efficiency and Synthetic Fuels: Alternatives for Reducing Oil Imports
The effects of new repair and service practiceson the structure of the aftermarket are uncertain.During the past decade, repair and service activ-ity shifted from dealers to service centers run bygeneral retailers (e.g., Sears) and tire retailers(e.g., Firestone) and to specialized franchised cen-ters for tune-ups, body work, or component serv-ice (e.g., AAMCO Transmissions and Midas Muf-fler). Both of these trends help to moderate serv-ice cost increases because of scale economies inplanning and management. However, the inti-mate and advance knowledge of new technolo-gies held by manufacturers is likely to help dealersregain repair and service business. While dealersnow perform about 20 percent of auto repairs,they are expected to gain a greater share by themid-1980’s. Meanwhile, scale economies in ad-vertising and inventory management may pro-mote consolidation among parts firms.13
Prospects
Further financial strain on the domestic autoindustry is not likely to lead to financial failureof major manufacturer and supplier firms (exceptperhaps Chrysler, but Government interventionmakes its future hard to predict). However, thecontinued viability of many smaller auto suppliersis becoming especially uncertain because auto-motive technology changes make products andcapacity obsolete. While the industry may con-tinue to contract, “collapse” of its leading firmsis not likely because major and even intermedi-ate-sized firms can make at least partial adjust-ments to automotive market changes; adjust-ments are already under way. Reduction in theU.S. activities of domestic firms and failure orcontraction of smaller firms would, nevertheless,severely affect employment and local economies.
In contemplating the future of the industry itis important to appreciate what financial failuremeans. In a technical sense, businesses fail whenthey are unable to make scheduled payments.If this inability is temporary, firms can usuallynegotiate with creditors or seek protection from
bankruptcy courts to relieve immediate creditor
13M~Vann N. Keller, “Status Report: Auto Parts Industry Automo-tive Aftermarket Quarterly Review” (New York: Paine, Webber,Mitchell, Hutchins, Inc., July 29, 1980).
demands. In many cases, bankrupt firms are suc-cessfully reorganized, structurally as well as finan-cially. However, some firms find that the stigmaof bankruptcy makes producing and selling espe-cially difficult. * If selling a firm’s assets generatesmore value than using them for production bythe firm, the firm is fundamentally unviable, and
there are financial and economic grounds forliquidating it.
Barring Government support or merger, Chrys-ler is the large automotive firm most likely to failif viability in the U.S. market entails large invest-ments that it cannot afford. AMC has been at leasttemporarily rescued by the French Government-backed Renault. Because Chrysler’s financialweakness has been known for years, the magni-tude of the potential social and economic effectsof its failure has been diminishing as Chrysler hascut back its operations and suppliers have re-
duced their dependence on Chrysler as a cus-tomer.
In mid-1979, when Data Resources, Inc., pre-pared for the U.S. Department of the Treasurya simulation of the macroeconomic effects of aChrysler bankruptcy and liquidation, it found thatonly temporary macroeconomic instability waslikely to result, although 200,000 people mightbe permanently unemployed. Dependence ofworkers and businesses on Chrysler has dimin-ished since that simulation was done, althoughsmall firms for which Chrysler is a primary cus-
tomer remain vulnerable. If Chrysler were to liq-uidate, its exit from the U.S. market would pro-vide opportunities to domestic and foreign manu-facturers to expand market share and purchaseplant and equipment at relatively low cost. Thiscould relieve financial pressures on Ford and GM.
While contraction of the U.S. auto industry mayresult in fewer, healthier firms, employment andlocal economies will suffer.** Loss of jobs will re-
*When Lockheed and Chrysler appealed for Government aid,they both argued that their customers would not buy from firms
in bankruptcy. This is more likely to be a problem for automobile(or aircraft) manufacturers than for their suppliers, given the differ-ence in size of customer purchase and producer liability.
**Also, change in the amount of U.S manufacturer operationsin Canada (not considered “foreign”) could imply violation of ourobligations under the Automotive Products Trade Act agreementswith Canada.

8/14/2019 Increased Automobile Fuel Efficiency and Synthetic Fuels: Alternatives for Reducing Oil Imports
http://slidepdf.com/reader/full/increased-automobile-fuel-efficiency-and-synthetic-fuels-alternatives-for 205/292
Ch. 8—Regional and National Economic Impacts . 203
suit predominantly from supplier-firm difficuIties.Unemployment of auto industry workers mayalso affect the performance of the national econ-omy. Unemployment causes a more than pro-portionate decline in aggregate production,because slack demand reduces average hours perworker, output per worker, and entry into thelabor force, The reduction in disposable personalincome (DPI) because of unemployment reducespersonal consumption spending. Reduced per-sonal consumption (and business fixed invest-ment) spending reduces gross national product(GNP), causing DPI to fall, and so forth. Both per-sonal and corporate tax revenues decline, whiletransfer payments to unemployed workers andeconomically depressed communities rise.
The national economy can better adjust to autoindustry trauma than local and regional econo-mies because the national economy is more di-
versified, and because, over time, national eco-
nomic sensitivity to auto industry problems hasbeen diminishing. Since World War II, manufac-turing employment in the Midwest (and North-east) has been declining as a percent of nationalmanufacturing employment; it has declined in ab-solute volume since 1970 because job opportu-nities have not been growing, foreign and domes-
tic firms have located facilities in other regions,and other industries primarily located elsewherehave been growing in their importance to theeconomy. * In this context of structural change,the 1975 recession seems to have been a turn-ing point for traditional Midwest manufacturing,accelerating a trend of decline that was furtheraggravated by the 1979-80 oil crisis and recession.
*Electronics, computing equipment, chemicals and plastics, aero-space equipment, and scientific instruments have been the leadinggrowth industries in the postwar period. These industries are bothoutlets for diversification by auto-related firms and competitors totraditional auto-related firms in automotive supply.
ECONOMIC IMPACTS OF SYNFUELS
Because large blockssynfuels projects, theyeconomic activity even
of capital are required forwill be visible centers offrom a national viewpoint
and, in fact, for’ people outside of the synfuelsindustry, the economic costs and benefits of syn-fuels may be more easily understood in terms ofregional and national impacts.
Despite the absence of commercial experience,an outline of the synfuels industry emerges withcomparisons to coal mining, conventional oil andgas production, chemicals processing, and elec-tric power generation. By itself, this new industrialorganization is an important economic impact,as it changes the way economic decisions aremade regarding the supply of premium fuels. Fur-thermore, along with the technologically deter-mined menu of resource requirements, industrialorganization determines the major regional andnational economic impacts of synfuels deploy-
ment.potential regional and national economic im-
pacts are then explored through comparisons ofaggregate resource demands and supplies. Sinceplans call for very large mines and processing
plants, and perhaps many construction projectsin progress at once, the emphasis is on potentialbottlenecks which could delay deploymentschedules and drive up project costs. If severeresource bottlenecks do occur, the resulting in-flation in the prices of these resources will spreadthrough the economy, driving up prices and costs
for a broad range of goods and services.These resource costs add up in the next sec-
tion of this chapter to financial requirements forprojects and for the industry as a whole. To theextent that the Federal Government does not in-tervene, individual firms must compete in finan-cial markets with all other products and all otherfirms for limited supplies of debt and equity cap-ital. With the important exception of methanoland ethanol from biomass, * the large scale andlong Ieadtimes of synfuels projects may make itdifficult to raise capital, especially during the next
*Ethanol from biomass is not included in this discussion becausewith current technology its potential production is limited by theavailability and price of feed-grain feedstocks. However, if economicprocesses for converting Iigno-cellulose into ethanol are developed,ethanol could compete with methanol as a premium fuel frombiomass.

8/14/2019 Increased Automobile Fuel Efficiency and Synthetic Fuels: Alternatives for Reducing Oil Imports
http://slidepdf.com/reader/full/increased-automobile-fuel-efficiency-and-synthetic-fuels-alternatives-for 206/292
204 • Increased Automobile Fuel Efficiency and Synthetic Fuels: Alternatives for Reducing Oil /reports
decade, when important technological uncertain-ties are likely to remain. Federal subsidies or loanguarantees will speed synfuels deployment–butonly by reducing capital available to other typesof investments, by reducing other Federal pro-grams, by increasing taxes, or by increasing theFederal deficit. Depending on general economicconditions, each of these different market inter-ventions may be inflationary.
Each of these areas of regional and nationaleconomic impacts—industrial structure, poten-tial resource bottlenecks, finance capital, and in-flation as related to synfuels development–is dis-cussed below.
The Emerging IndustrialStructure of Synfuels
Synfuels are fundamentally different from con-
ventional oil and gas because they are manufac-tured from solid feedstocks and because synfuelseconomics may lead to the replacement of con-ventional fuels by methanol and low- or medium-Btu gas in the future. Liquids from coal and oilshale, the feedstocks with a natural resource basesufficient to fully displace petroleum in the longrun, involve economies of scale which encourageownership concentration. The methanol option,however, provides offsetting opportunities forlarge chemical firms to enter the liquid fuel busi-ness and, based on biomass feedstocks, it mayalso allow many small producers to supply local
markets throughout the Nation.The following discussion is broken down into
the four stages of synfuels production. While thisbreakdown is convenient, it should be under-stood that several stages of production may beperformed on the same site in order to minimizehandling, transportation, and management costs.
Mining Coal and Shale
Mining for synfuels will closely resemble min-ing for any other purpose except that the mines
dedicated to synfuels production will be relativelylarge .14 It takes approximately 2.4 million tons of
IQFOr an extensive discussion of mining techniques and costs, see
The Direct Use of Coal: Prospects and Problems of Production andCombustion, OTA-E-86, (Washington, D. C.: U.S. Congress, Officeof Technology Assessment, June 1979), chs. Ill and IV.
coal per year to fire an 800 MWe generator andabout three times that much to feed a 50,000 bar-rels of oil equivalent per day (BOE/D) coal syn-fuels plant, and about four to eight times as muchoil shale (by weight) for the same output of liquidfuel produced by surface retorting. *
Capital costs for development of a coal minedepend primarily on the depth and thickness ofthe coal seam. Average investment cost data canbe misleading, since each mine is unique, but ittakes about $60 of investment per annual ton ofcoal mined underground (1981 dollars). Withcoal preparation and loading facilities, invest-ments at the mine site may approach $100 perannual ton, or about $750 million for capacitysufficient to supply a 50,000 bbl/d synfuels plant.Western surface mining may in certain cases besubstantially less expensive. * * Furthermore, sub-stantial synfuels production may be achieved on
the basis of existing excess mining capacity.***In the absence of commercial experience, in-
vestment cost estimates are unavailable for shalemining. It is clear, however, that they can beeither larger or smaller than for coal, dependingon two opposing factors. First, investments costscould be much higher because of the low energydensity of shale. Hence, much more materialmust be mined per barrel of oil equivalent. Sec-ond, shale investment costs could be lower be-cause major shale resources lie in very thick
*This range is determined by the Btu content of coal and shaleand by the efficiencies of converting a Btu of solids into a Btu offinished liquid fuels. If we just compare shale oil and methanol (thetwo liquid synfuel options which are best understood and probablyof least cost), conversion efficiencies are comparable, so the dif-ference in feedstock rates is entirely a matter of the energy densityof the feedstock. Coal has 16 to 30 MMBtu/T with Western coaltypically on the lower end of the range. Shale, which is presentlyconsidered suitable for retorting, has 3.6 to 5.2 MM Btu/T. Hence,the ratio of shale to coal inputs can be as low as 4.2 and as highas 8.3.
**Investment cost data were obtained from National Coal Associa-tion. Federal surface mine regulations have increased investmentrequirements in increasing the equipment required to operate amine and to reclaim land after coal has been removed, by increas-ing the amount of premining construction and equipment requiredto establish baseline data, and by extending the required develop-
ment period.* * *Th e National Coal Association estimates excess CiipaCity at
100 million to 150 million tons per year. The low end of the rangeis calculated on the basis of the number of mines closed and thenumber of workers working short weeks. The high end of the rangeis calculated by comparing peak weekly production to average an-nual output per week.

8/14/2019 Increased Automobile Fuel Efficiency and Synthetic Fuels: Alternatives for Reducing Oil Imports
http://slidepdf.com/reader/full/increased-automobile-fuel-efficiency-and-synthetic-fuels-alternatives-for 207/292
Ch. 8—Regional and National Economic Impacts q 205
seams (in some areas over 1,000 ft thick) andoften relatively near the surface. Estimates for thefirst commercial shale project indicate that min-ing investments for a 50,000 bbl/d project maybe substantially below $750 million. * Further-more, if in situ retorting techniques fulfill optimis-tic expectations, shale mining could become rela-tively inexpensive as mining and retorting opera-tions are accomplished together underground.
Mine investment is important in project plan-ning, but its share in total investment is still usuallyless than a third. (Notice that in the estimated in-vestment costs for coal-based synthetics in ch.8, the cost of the mine was not included. It is in-cluded in ch. 4 in the discussion of total invest-ment costs. ) Beyond actual costs, the activity ofmining itself is important in the synthetic fuelcycle because of its previous absence in the U.S.oil and gas industry. I n fact, the entire sequence
of economic events associated with extraction ofcoal and shale contrasts sharply with the extrac-tion of conventional petroleum and natural gas.The key difference is that oil and gas reservesmust be discovered, with potentially large re-wards for the discoverer, whiIe the location andmorphology of coal and shale resources havebeen known for a long time.
A wildcat driller, looking for an oil or gasdeposit, can rent and operate a drilling rig witha relatively small initial investment. Since the mostpromising prospects have already been drilled in
this country, exploration typically is a high-riskgamble and, although investment is small com-pared with development of resources, it can stillrequire large sums of money in frontier areas suchas deep water or the Arctic. The uncertainty isa deterrent to investment, but potentially largepayoffs and special Federal tax incentives con-
“The Denver office of Tosco Corp. estimates that mine costs forthe Colony project, which is the first shale project to proceed withcommercial development, could be as low as $250 million. Thatparticular site has the advantage that large-scale open pit miningequipment can be used in an underground mine, since the seamis horizontal and the mine can be entered via portals opened in
a canyon wall. This means that the reclamation costs of a surfacemine can be avoided as well as the costly mine shaft of a conven-tional underground mine. Furthermore, the site is propitious be-cause there is virtually no methane trapped in the shale, so safetymeasures are minimal. In the future, mine costs as well as conver-sion costs may be held down by in situ liquefaction, but this tech-nology remains unproven.
tinue to attract large numbers of investors andlarge sums of capital.15 Furthermore, the wildcat-ted can induce cooperation from landowners,local government officials, and any other power-ful local interests by promising royalty payments,or at least a rapid expansion of local business ac-tivity, without serious environmental impacts.Only after a substantial reservoir has been dis-covered is it necessary to make relatively largeinvestments in development wells, processingequipment, and pipelines.
In mining, there is nothing comparable to theopportunity and uncertainty of discovery wells.Most of the business parameters of a potentialmine site are evident to the landowner and toall potential mining companies, which means thatprofit margins are generally limited by competi-tive bidding.
As discussed below, mines also typically em-ploy more labor per million Btu of premium fuelproduced than oil and gasfields16 and they havemany more adverse environmental impacts (e.g.,acid drainage, subsidence, etc). For both reasons,interests external to the firm are more likely tooppose and perhaps interrupt mining operations.Investors realize such contingencies and see themas risks for which they expect compensation.
This discussion of relative payoffs and risks isby no means complete or conclusive, but it doessuggest that private investors may exploit min-
151 n 1979, approximately $12.5 billion was invested in explora-
tion for oil and gas in the United States. That includes (in billions),$5.4 for lease acquisition, !$4.5 for drilling, $2.3 for geological andgeophysical activity, and $0.3 for lease rentals. (See Capita/ /inves-tments of the World Petro/eum /ndustry, 1979, Chase Manhat tenBank, p. 20, and Basic Petro/eum Data Book, American PetroleumInstitute, vol. 1, No. 2, sec. Ill, table 8a). $12.5 billion is about 3percent of total gross domestic investment ($387 billion). (See 1980Statistical Abstract, p. 449.)
The oil and gas industry receives special tax treatment mainlyin terms of expensing intangible expenditures of exploration, eventhough they are surely treated as capital expenses in corporateaccounts.IGA[though oil and ga s ha s been closing steadily, in 1979 it took
approximately 14,500 workers (miners and associated workers) toproduce a Quad of coal and about 11,500 workers to produce a
Quad of oil and gas. However, the labor intensity of mining forsynfuels is actually 160 to 200 percent greater than for coal alone,since only about 50 to 60 percent of the energy in coal feedstock
remains in the finished synfuel product. See 1980 Statistical Abstract,p. 415, for employment data and 1980 Annual Report to Congress,Energy Information Administration, p. 5, for production data. Seenote 2, ch. 9 for further discussion of labor productivity.

8/14/2019 Increased Automobile Fuel Efficiency and Synthetic Fuels: Alternatives for Reducing Oil Imports
http://slidepdf.com/reader/full/increased-automobile-fuel-efficiency-and-synthetic-fuels-alternatives-for 208/292
206 • Increased Automobile Fuel Efficiency and Synthetic Fuels: Alternatives for Reducing Oil Imports
ing prospects for synfuels much more slowly thanprospects for conventional oil and gas, or that in-vestors will accept much greater risks with con-ventional oil and gas prospects because of theoffsetting chances of striking it rich. Synfuelscapacity could still expand rapidly, but probablynot without very high profit incentives to reorient
investors who have traditionally been in oil andgas exploration.
Conversion Into Liquids and Gases
During the second stage of production, solidfeedstocks are converted into various liquids andgases. Current synfuels project plans indicate thatcoal or shale conversion plants will resemblecoal-fired electric power stations in the sense thatboth convert a large volume of solid feedstockinto a premium form of energy. They will resem-ble chemical processing (in products such as am-
monia, ethylene, and methanol from residual oilor natural gas) and petroleum refining facilitiesin their use of equipment for chemical conver-sions at high temperatures and pressures. *
Of the $2 billion to $3 billion (1981 dollars) re-quired overall for a 50,000 BOE/D shale project,between one-third and one-half goes into surfaceretorts which decompose and boil liquid kerogenout of the shale rock. A larger fraction of totalproject costs is required to obtain methanol fromcoal, but with subsequent avoidance of the up-grading and refining costs.** In general (but with
the exception of in situ mining shale), the con-version step alone requires investments compar-able to a nuclear or coal power station of 1 GWecapacity or to outlays for a 200 to 400,000 bbl/dpetroleum refinery .17
Factors other than economy of scale dominatethe economics of syngas production, as demon-
*Refineries typically use lower pressures than chemical plants andlower than what is expected for synfuels conversion.
* * For a breakdown of methanol costs, see ch. 8.I ZAS discussed in ch. 8, a[l synfuek capital cost e5timates are very
uncertain because none of these technologies has been used com-mercially. Furthermore, engineering cost estimates available to OTAtypically do not clearly differentiate costs by stages of production.Nevertheless, the conversion step, going from a solid feedstock toa gas or a liquid product, is undoubtedly the most expensive singlestep in synfuels production. For presentation of costs for electricpower stations see Technica/Assessment Guide, Electric Power Re-search Institute, July 1979.
strated by the existence of many small gasifica-tion plants across the country.18 Two factors ac-count for this. First, gasification is only the firststage in the production of either methane ormethanol, so costs of the second stage can beavoided and system engineering problems areless complex and more within the technical ca-pabilities of smaller users. Airblown gasifiers in-volve the least engineering, since they do not re-quire the production of oxygen, but only certainonsite end users such as brick kilns can use thelow-Btu gas. The second reason involves trans-portation and end-use economics.
In many industrial applications, natural gas(methane) has been the preferred fuel or feed-stock, but medium-Btu gas is an effective substi-tute in existing installations because it requiresrelatively minor equipment changes. Either low-or medium-Btu gas may be used in new installa-
tions, depending on the industrial process andsite-specific variables. However, since thesemethane substitutes cannot be transported overlong distances economically, conversion facilitiesmust be located near the end users.
The size of the conversion facility is thereforedetermined by the number and size of gas con-sumers within a given area, and this often dic-tates conversion plants that are small in compari-son with a 50,000 bbl/d liquid synfuels plant.Consequently, industrial gas users may chooseto locate near coalfields in order to produce and
transport their own gas or to contract from dedi-cated sources. Either approach assures securityof supply and availability over many years.
Upgrading and Refining of Liquids
As discussed in chapter 6, raw syncrudes fromoil shale and direct liquefaction must be up-graded and refined to produce useful products.Technically, these activities are quite similar topetroleum refining, and this affords a competitiveadvantage to large firms already operating major,integrated refineries. This bias toward large, es-
tablished firms is reinforced in the case of directIasee National Coal Association, “Coal Synfuel Facility Survey,”
August 1980, for a listing and discussion of between 15 to 20 low-
Btu gas facilities coupled with kilns, small boilers, and chemicalfurnaces.

8/14/2019 Increased Automobile Fuel Efficiency and Synthetic Fuels: Alternatives for Reducing Oil Imports
http://slidepdf.com/reader/full/increased-automobile-fuel-efficiency-and-synthetic-fuels-alternatives-for 209/292
Ch. 8—Regional and National Economic Impacts q 207
coal liquids by the apparent cost reduction if up-grading and refining are fully integrated with con-version, thus making it difficult for smaller firmsto specialize in refining as some do today. Up-graded shale oil, on the other hand, is a high-grade refinery feedstock that can be used by mostrefineries.
Downstream Activities: Transportation,Wholesaling, and Retailing
As long as synthetic products closely resembleconventional fuels, downstream activities will berelatively unaffected. However, medium- or low-Btu gas and methanol are sufficiently different torequire equipment modifications, and they maybe sufficiently attractive as alternative fuels to in-duce changes in location of business and struc-ture of competition.
Depending.on the market penetration strategy,methanol may be mixed with gasoline or han-dled and used as a stand-alone motor fuel. As amixture, equipment modifications will involve in-stallation of corrosion-resistant materials in thefuel storage and delivery system. As a stand-alonefuel, methanol may have its own dedicated pipe-line and trucking capacity and its own pump atretail outlets, and auto engines may eventuallybe redesigned to obtain as much as 20 percentadded fuel economy, primarily by increasingcompression ratios and by using leaner air-fuelmixtures when less power is required. *
If firms currently producing methanol for chem-ical feedstocks should enter fuel markets,
19drivers
stand to gain from the increased competitionamong the resulting larger number of major fuel-producing companies and by competition be-tween methanol and conventional fuel. Further-more, with coal-based methanol providing a criti-cal mass of potential supply, drivers across theNation may be able to purchase fuel from smalllocal producers (using biomass feedstocks), a sit-uation which has not obtained since the demiseof the steam engine.
*See ch. 9 for further information about methanol vehicles.lgAt the present time, approximately 1.2 x 10⁹ gal barrels of meth-
anol (1 1 x 1 @ BOE) are produced domestically, primarily fromnatural gas, and used almost exclusively as a chemical feedstock.
See Chemical and Engineering News, )an. 26, 1981.
Medium- or low-Btu gases are effective substi-tutes for high-Btu gas (methane) but, as discussedabove, their relatively low energy density pro-hibits mixing in existing pipelines and generallyrestricts the economical distance between pro-ducer and consumer (the lower the Btu contentthe shorter the distance). Hence, deployment ofthese unconventional gases will require dedicatedpipelines, relocation of industrial users closer tocoalfields, or coal transport to industrial gas-users.
Conclusion and Final Comment
Massive financial and technical requirementsfor synthetic liquids from oil shale and coal en-courage ownership that is more concentratedthan has been typical in conventional oil and gasproduction. Large firms, already established inpetroleum or chemicals, have three major advan-tages.
First, they can support a large in-house techni-cal staff capable of developing superior technol-ogy and capable of planning and managing verylarge projects. Second, they can generate largeamounts of investment capital internally, whichis especially important during the current periodof high inflation (inflation drives up interest onborrowed capital, making it much more expen-sive for smaller firms who must supplement theirmore limited internal funds).
Third, such firms already have powerful prod-uct-market positions where synthetic liquids mustcompete, so entry by new firms involves a greaterrisk that synthetic products cannot be sold at aprofit. * The second and third advantages may be
*Predicting investment behavior is always difficult, but barringFederal policy to the contrary, the most likely group of potentialinvestors are the 26 petroleum and chemical firms, each with 1981assets of $5 billion or more (see list below). Seven chemical firmswere included in this list primarily because they may be in a strongposition to produce and market fuel methanol, based on their ex-perience with methanol as a chemical feedstock.
Foffune, May 4, 1981, presents a listing of the 26 largest (in termsof total assets) petroleum and chemical firms: Exxon, Mobil, Tex-aco, Standard Oil of California, Gulf Oil, Standard Oil of Indiana,Atlantic Richfield, Shell Oil, Conoco, E. 1. du Pent de Nemours, *
Phillips Petroleum, Tenneco, * Sun, Occidental Petroleum, Stand-ard Oil of Ohio, Dow Chemical, * Getty Oil, Union Carbide, * UnionOil of California, Marathon Oil, Ashland Oil, Amerado Hess, CitiesService, Monsanto, * W. R. Grace, * and Allied Chemical. * Asteriskindicates firm primarily in the chemicals industry.
This conclusion about the dominance of larger companies holdsdespite the fact that current synfuels projects planned or under study
(continued on next page)

8/14/2019 Increased Automobile Fuel Efficiency and Synthetic Fuels: Alternatives for Reducing Oil Imports
http://slidepdf.com/reader/full/increased-automobile-fuel-efficiency-and-synthetic-fuels-alternatives-for 210/292
208 . Increased Automobile Fuel Efficiency and Synthetic Fuels: Alternatives for Reducing Oil Imports
nullified if several smaller firms can effectivelyband together into consortia, but it maybe muchmore difficult for a consortium to build a tech-nical staff which can develop superior technologyand manage large projects during the next dec-ade, when there will be many technical risks.
Ownership concentration is an important as-pect of industrial organization in an economy or-ganized on classical economic principles of anon-ymous competition, market discipline, and con-sumer sovereignty. Very large synfuels projectsowned by very large energy corporations andconsortia of smaller firms would not be anony-mous, even from the viewpoint of the nationaleconomy, and they would have leverage to dic-tate terms in their input and output markets.
Conversely, once companies have made verylarge investments in new synfuels projects, they
become visible targets for political action whichmight significantly raise costs or reduce output.Visible producers may not in fact allocate re-sources much differently than if there were onlyanonymous competitors, but at least the oppor-tunity to manipulate markets exists where itwould not otherwise—and just the appearanceof doubt about the existence of consumer sover-eignty can raise serious political questions.
The capital intensity of synfuels will also changethe financial structure of the domestic liquid andgaseous fuel industry. Compared with invest-ments in conventional oil and gas during the last20 years, investment in synfuels per barrel of oilequivalent of productive capacity (barrels of oilper day) will increase by a factor of 3 to 5.
20 While
involve many relatively small firms. For example, three of the fourmajor parties in the Great Plains Gasification Project are primarilyinvolved with either gas-distribution or transmission: American Nat-ural Resources Co., Peoples Energy Corp., and Transco Cos, Inc.American Natural Resources is associated with gas-distribution firmsoperating in Michigan and Wisconsin; Peoples Energy Corp. is asso-ciated with Northern Natural Gas, a major distributor in the Mid-west; and Transco is the parent company of Transcontinental GasPipeline Co., a major operator of transmission lines. The fourth part-ner, Tenneco, is also a major transmission company, but it was in-
cluded in the group of top 26 firms listed above because of its chem-ical processing business. Undoubtedly, all four firms’ participationis predicated upon the existence of Government subsidies and loanguarantees, but that is especially true for the three smaller firms.z~omparison based on data for total costs of oil and gas wells,
plus estimated costs for predrilling activities over the period from1959-80. Capital outlays per barrel oil equivalent of reserves over
all such calculations are of necessity very impre-cise, the order of magnitude is confirmed by datacontained in the 1980 Annual Report of ExxonCorp. As of 1980, Exxon’s capitalized assets inU.S. production of oil and gas totaled $11.5 bil-lion, and its average daily production rate (ofcrude oil and natural gas) was about 1.4 millionBOE; so its ratio of capital investment to daily out-put was $8,200.21 A 50,000 BOE/D synfuels plantat $2.2 billion implies a ratio more than five timeslarger ($44,000/BOE/D).
In other words, switching from conventionalto synthetic liquids and gases amounts to a sub-stitution of financial capital (and the labor anddurable goods it buys) for a depleting stock ofsuperior natural resources. A parallel substitutionof investment capital for natural resources is oc-curring as conventional resources are increasinglyhard or expensive to find and develop because
of the depletion of the finite stockpile of naturalresources.
As long as the United States could keep discov-ering and producing new oil and gas at relative-ly low cost, energy supplies did not impose seri-ous inflexibilities on our economy. When weneeded more we could get it without makingmuch of a sacrifice. With synfuels, it is necessaryto plan ahead, making sure that capital resourcesare indeed available to supply synfuels projects,and that product demand is also going to be avail-able at least a decade into the future so that large
synfuels investments can be amortized.The current financial situation of many elec-
tric utilities in the United States illustrates the risksentailed when plans depend on long-term priceand quantity predictions which may prove to bewrong. It was not long ago that utility investmentswere considered almost risk-free, and the industryhad for decades raised all the debt it wished atlow rates. Needless to say, the utility situation hasnow dramatically reversed as the result of sharplyrising costs embodied in new, long-lived gener-
the past 20 years averaged about $1.60. Depending on the syn-fuels option, a synfuels plant would have a comparable ratio of $5.4o
to $7.00/BOE of “reserves.” Well-drilling and other exploration costswere obtained from Society of Exploration Geophysicists, AnnualReports and from joint Association Survey of the U.S. Oil and GasProducing Industry.ZISee 1980 Annua/ Report of Exxon cOtpOrdtiOn, pp. 34, 44, 51.

8/14/2019 Increased Automobile Fuel Efficiency and Synthetic Fuels: Alternatives for Reducing Oil Imports
http://slidepdf.com/reader/full/increased-automobile-fuel-efficiency-and-synthetic-fuels-alternatives-for 211/292
Ch. 8–Regional and National Economic Impacts q 209
ating capacity. while it may be premature todraw an analogy with synfuels, it is clear that syn-fuels will tie up capital in considerably largerblocks and for considerably longer periods thanwas true for conventional oil and gas reservesover the last 30 years.
Compared with synthetic petroleum, methanolpresents two opportunities to partially offset thetendency toward industrial concentration. First,as indicated above, its present use as a majorchemical feedstock provides an opportunity forlarge chemical firms to enter the liquid fuelbusiness. Second, since methanol can be pro-duced from wood and other solid biomass, small-scale conversion plants (approximately $1 O-mil-lion investments) operated by relatively small en-trepreneurs may be able to take advantage oflocal conditions across the country. * Assumingcost competitiveness, having a mixture of small-
and large-scale methanol producers may rein-force the attractiveness of downstream equip-ment investments (e. g., retail pumps and engineimprovements), thus making it more likely thatdrivers will indeed have an attractive methanolopt ion.
Besides methanol, synthetic gases may attractadditional large and small firms from outside thepetroleum and chemical industries. Dependingon the deregulated “well head” price of naturalgas (relative to fuel liquids) and depending onregulatory policy regarding utility pricing, syn-
thetic natural gas and synthetic medium-Btu gasmay become profitable investments for gas util-ities. Indeed, the first synthetic gas project toreach the final planning stage has substantial gasutility ownership, * * Syngas may become attrac-tive as a methanol coproduct or as a primaryproduct, in either case taking advantage of capitalsavings and higher conversion efficiencies thanif methanol or gasoline is the sole product of in-direct liquefaction.
*One domestic company, International Harvester, is presentlydeveloping technology to mass-produce this equipment and trans-
port it to the purchaser’s location in easily assembled modules.* *This compares with total private domestic investment in 1980of about $395 billion, and out of that total about $294 billion wentfor nonfarm investments in new plant and equipment. Also in 1980,two large blocs of energy investments were $34 billion for oil andgas exploration and production and $35 billion for gas and elec-tric utilities.
A final comment can be made about the loca-tion of the synfuels industry. Shale oil produc-tion will be concentrated in Colorado and Utah,since that is where superior shale resources ex-ist and since unprocessed shale cannot beshipped as a crushed rock without driving up
costs prohibitively, Coal-based synfuels offer thepossibility of spreading liquid fuel productionover a wider cross section of the Nation. This isespecially important for the Northeast and NorthCentral section of the United States, where thereremain substantial coal deposits in Pennsylvania,Ohio, and Illinois, States which have by this timedepleted most of their original petroleum re-serves.
Unlike their shale counterparts, coal-con-version facilities and subsequent upgrading andrefining plants need not be immediately adjacentto the mine mouth, since coal’s shipping costsper Btu are less than for shale. Location offacilities and, hence, their regional impacts willdepend on site-specific factors and the availablemodes of transportation. Location of facilities toconvert biomass into methanol will be deter-mined primarily by local availability and cost ofbiomass feedstocks. This restriction is imposedby the dispersed location of plant material, ratherthan by differences in energy density (biomassfeedstocks such as wood have an energy densi-ty only marginally lower than some Westerncoals).
Potential Resource Bottlenecksand Inflation
Technology, ownership concentration, and (incertain important cases) regional concentration,all combine to impose heavy demands on labor,material, and financial resources relative to cur-rent and potential new supplies of the same re-sources. If deployment plans fail to account forsupply limitations, long project delays and largecost overruns can occur.
Anytime a capital-intensive industry attemptsto start up quickly, temporary factor input short-ages can be expected—if not more extreme “bot-tlenecks” or chronic shortages which generallydisrupt construction schedules. Ideally, shortagesand, certainly, bottlenecks can be avoided by ad-

8/14/2019 Increased Automobile Fuel Efficiency and Synthetic Fuels: Alternatives for Reducing Oil Imports
http://slidepdf.com/reader/full/increased-automobile-fuel-efficiency-and-synthetic-fuels-alternatives-for 212/292
210 q Increased Automobile Fuel Efficiency and Synthetic Fuels: Alternatives for Reducing Oil imports
vanced planning and giving suppliers purchasecontracts years in advance if necessary to ensureavailability. However, while such planning andlong-term commitments minimize shortage risks,they also increase risks of loss should plans betechnically ill-conceived and commitments aremade to projects with actual costs much largerthan planned. These two sets of risks must beweighed against each other, but at the presenttime technical risks clearly are more significant.
In order to predict resource bottlenecks andtheir impacts, the full array of supplier marketdynamics must be understood. In this limited dis-cussion, one can only begin to compare poten-tial demands and supplies for key synfuels re-sources.
As a final introductory remark, it should beclear that factor price inflation drives up costs in
many industries, not just for builders of synfuelsplants. Industries that appear most vulnerable toinflation resulting from synfuels deployment willbe identified. However, in general, a much largerstudy would be necessary to trace inflationarypressures through complex interindustry transac-tions.
Experienced Project Planners,Engineers, and Managers
As planned, the construction of oil shale andcoal liquids projects requires the mobilization ofthousands of skilled workers and massive quan-tities of equipment and materials. Of all these syn-fuels investment resources, the supplies of skilledengineers and project managers are the most diffi-cult to measure, and in the final analysis, it is leftup to the large investing firms to decide for eachproject when a critical mass of talent has beenassembled. While individual firms may have ex-cellent engineering departments, the possibilityof supply bottlenecks for chemical engineeringservices, across the full spectrum of chemicalprocessing industries, must be of concern be-cause of the potential financial risks due to design
errors and because of the length of time requiredto educate and train new people. *
q Well-trained engineers and project planners can still make majormistakes, but risks due to miscalculations and design errors are con-trolled by careful training and building up experience incremen-
t the present time, only one of the country’s10 major architectural and engineering (A&E)firms22 has actually built a synfuels plant. * Nocommercial-scale plant has been built. Given thisgeneral inexperience, and making the reasonableassumption that A&E firms will not be short ofwork worldwide, it seems highly unlikely that syn-
fuels construction contracts for the first round ofa rapid deployment scheme will be able to holdbuilders to binding cost targets and completiondates. Consequently, those who would actuallytake investment risks may be extremely skepticalof builders’ qualifications and judgment, and thismay severely limit the apparent supply of quali-fied engineers and engineering firms.
Furthermore, if synfuels projects proceed aheadat a rapid pace despite the technical uncertain-ties and commercial inexperience, it could driveup the A&E costs for other large, new process-
ing facilities which rely on the same limited groupof A&E firms and the same pool of skilled workers.Of all synfuels resource markets, the possibilities
tally. Commonly accepted periods for obtaining a bachelor’s degreeand subsequent on-the-job training range from 6 to 10 years.
Several recent examples illustrate that errors in the design of largemining and chemical processing plants do occur and can causesevere cost overruns and project delays. Perhaps the most extremecase was the Midwest (nuclear) Fuel Reprocessing Plant built forGeneral Electric. Construction started in 1968, with completionplanned for 1970 at an estimated cost of $36 million. Unfortunate-ly, expected time for major technical component failure in the newpIant was less than the time required to achieve stable operatingconditions. The project was abandoned and the company estimated
that an additional expenditure of between $9o million and $130million would have been required to redesign and rebuild.Additional examples include a municipal solid waste gasifier in
Baltimore begun in 1973 which never achieved its major goal ofcommercial steam production, an oil sands project in Canada whichundetwent extensive retrofit when the teeth of its large mining shov-els were worn away in a matter of weeks by frozen oil sands, andso on. Clearly, major design errors have happened in the past andare likely in the future, with the number and severity of such errorsincreasing if a shortage of experienced design engineers develops,
For further information about these and other examples of designerrors, see Edward Merrow, Stephen Chapel, and ChristopherWorthing, A Review of Cost Estimation in New Technologies: Implkcation for Energy Process Plants and Corporations, july 1979.ZZACCOrding to Business Wee/q Sept. 29, 1980, p. w, the 10 major
A&E firms, in order of their largest projects to date, are: Fluor, Par-sons, Bechtel, Foster Wheeler, C-E Lummus, Brown and Root,
Pullman Kellog, Stone and Webster, CF Braun, and Badger.*The Fluor Corp. built Sasol I and II in South Africa and will un-doubtedly sell this technology and its unique experience in theUnited States. However, different resource endowments can causevery different engineering economics in different countries, andthus this existing technical base may have to be adapted to theUnited States by investing in significant additional engineering.

8/14/2019 Increased Automobile Fuel Efficiency and Synthetic Fuels: Alternatives for Reducing Oil Imports
http://slidepdf.com/reader/full/increased-automobile-fuel-efficiency-and-synthetic-fuels-alternatives-for 213/292
Ch. 8—Regional and National Economic Impacts q 217
for propagation of inflation from synfuels into therest of the economy is greatest here. Petrochemi-cals, oil refining, and electric power generationare all industries which depend on the same engi-neering resources in order to build new facilities.in 1979, these three industries accounted formore than 25 percent of the total investment innew plant and equipment.23
Mining and Processing Equipment,Including Critical Metals for Steel Alloys
The construction of massive and complex syn-fuels plants will require equally massive and di-verse supplies of processing equipment and con-struction materials. Some of this equipment mustmeet high performance standards for engineer-ing, metals fabrication, component casting, andfinal product assembly because it must withstandcorrosive and abrasive materials under high pres-
sure and temperature.Potential supply problems can be identified first
by comparing projected peak annual equipmentdemand (for each deployment scenario) to cur-rent annual domestic production. While projec-tions were not done specifically for OTA’s lowand high scenarios, useful information can be ex-trapolated from an earlier projection for the de-ployment of coal Iiquids.24 In that analysis, whichpostulated 3 million barrels per day (MMB/D) ofsynfuels by 2000, 7 of 18 input categories wereidentified as questionable because projected syn-
fuels demands account for a significant fractionof domestic production. * Supply problems forzJFor data see Statistical Abstract, 1980, p. 652.ZdData obtained from “A Preliminary Study of Potential impedi-
ments,” by Bechtel National, Inc., which is one part of a three-
part compendium, Achieving a Production Goal of 1 Million BID
of Coal Liquids by 1990, TRW, March 1980. We can extrapolatefrom coal liquids to all other synfuels because subsequent research(by E. 1. Bentz & Associates, OTA contractor) indicates that shaleoil, coal liquids, and coal gases are all quite similar in their totaluse of processing equipment per unit output (measured in dollars)and in their mix of processing equipment. Furthermore, the Bechtel
study remains useful, despite its age, since subsequent incrementsin synfuels plant costs do not add items to this list or significantlyincrease demand requirements for the group of seven critical items.In other words, recent escalations in plant costs are primarily related
to increases in the expected prices of components and to increas-ing demands for certain components which are insignificant whencompared with productive capacity nationwide.
*Significance in this case means that projected synfuels demandexceeds 1 to 2 percent of domestic production. Since this is arelatively low threshold, this list should stay about the same for bothscenarios.
chromium, the one item in this group of sevenwhich is not a manufactured piece of equipment,would not be caused by synfuels deployment,since synfuels requirements would amount to lessthan 3 percent of domestic consumption, butsupplies may nevertheless be difficult to obtainbecause U.S. supply is imported, much of it from
politically unstable southern Africa.25
For the six types of equipment identified, theactual occurrence of bottlenecks will depend onthe ability of domestic industry to expand withsynfuels demand. In all cases, including draglinesand heat exchangers—where coal synfuels re-quirements exceed 75 percent of current domes-tic production even in the low scenario—thereappear to be no technical or institutional reasonswhy, if given notice during the required projectplanning period, supplies should not expand tomeet demand with relatively small price incen-tives.
In general, this optimistic conclusion is basedon the fact that Ieadtimes for expanding capac-
~ity to produce synfuels equipment are shorterthan the Ieadtimes required to definitely plan andthen build a synfuels plant.26 The fact that manyplants would be built at the same time does notnullify this basic comparison as long as all syn-fuels construction projects are visible to supplierindustries, as they should be. Furthermore, for-eign equipment suppliers can be expected tomake up for deficiencies in domestic supply if not
actually displace domestic competitors.For example, consider the case of heat ex-
changers. As indicated in table 62, coal synfuels
zSThe chief use of chromium is to form alloys with iron, nickelor cobalt. In the United States, deposits of chromite ore are foundon the west coast and in Montana. However, domestic produc-tion costs are much higher than in certain key foreign countries.In 1977, South Africa produced about 34 percent of total worldproduction, with the U.S.S.R. and Albania producing another 34percent. Other major producers are Turkey, the Phillipines, andZimbabwe. See Minerals in the U.S. Economy: Ten-Year Supply-Demand Profiles for Nonfuel Mineral Commodities (1968-77),Bureau of Mines, U.S. Department of Interior, 1979.Zbone can never be certain about how well industrial systems
will adapt to rapidly expanding demand for a limited number ofhighly engineered types of equipment which must be producedwith stringent quality control, However, informal surveys of equip-ment manufacturers have not revealed substantial reasons whyequipment supplies should not be responsive to moderate priceincentives. See Frost and Su Ilivan, Coa/ Liquefaction and Gasifica-tion: Plant and Equipment Markets 1980 Z(X?0, August 1979.

8/14/2019 Increased Automobile Fuel Efficiency and Synthetic Fuels: Alternatives for Reducing Oil Imports
http://slidepdf.com/reader/full/increased-automobile-fuel-efficiency-and-synthetic-fuels-alternatives-for 214/292
212 q Increased Automobile Fuel Efficiency and Synthetic Fuels: Alternatives for Reducing Oil Imports
Table 62.—Potentially Critical Materials and Equipment for Coal Liquids Development
(A) (B)Category Units Peak annual requirements U.S. production capacity (A)/(B) (percent)
1. Chromium . . . . . . . . . . . . . . . . . . . . . . . . . . . .2. Valves, alloys, and stainless . . . . . . . . . . . .3. Draglines. . . . . . . . . . . . . . . . . . . . . . . . . . . . .4. Pumps and drivers (less than 1,000 hp). . .5. Centrifugal compressors (less than
10,000 hp. . . . . . . . . . . . . . . . . . . . . . . . . . . . .6. Heat exchangers . . . . . . . . . . . . . . . . . . . . . .7. Pressure vessels (1.5 to 4 inch walls) . . . .8. Pressure vessels (greater than
4 inch walls) . . . . . . . . . . . . . . . . . . . . . . . . . .
tonstonsydhp
hpft 2
tons
tons
10,4005,9002,200
830,000
1,990,00036,800,00082,500
30,800
070,000
2,50020,000,000
11,000,00050,000,000671,000
240,000
—
888
4
187412
13
SOURCE: Achieving a Production Goal of f Million S/0 of Coal Liquids by 19%), draft prepared for the Department of Energy by TRW, Inc. and Bechtel National, Inc.,March 1980, pp. 4-28. Although these projections apply to the achievement of 3 MM B/D of coal liquids, and not specifically to the low and high productionscenarios Postulated in this reDort, they nevertheless Indicate rouah orders of maanitude for eaui Dment demand. See footnote 16 of this chaDter for furtherdiscussion of alternative synfuels projmtlons.
requirements for the low scenario could accountfor about 75 percent of current domestic U.S.production. Extrapolation from table 62 indicatesthat requirements for the high scenario couldamount to 150 percent of current production
and, as data in table 63 indicate, even in the lowscenario, synfuels demand could exceed currentU.S. production for “fin type” heat exchangers.However, productive capacity can expand as rap-idly as machine operators and welders can betrained, which for an individual worker is meas-ured in terms of weeks and months. Additionalheat-treated steel and aluminum inputs will alsobe required, as well as manufacturing equipment,but in all cases supplies of these inputs shouldexpand with demand .27
This generally optimistic assessment does not
mean that temporary shortages could not occurand temporarily drive up equipment prices ifprospects for synfuels deployment should im-
ZTcOrnpared With the full range of heat exchangers used in indus-
trial and utility applications, those likely to be used in synfuels plantswill operate at relatively low temperatures. Low-temperature unitsare made primarily out of carbon steel, low-alloy steel, and enamelsteel, all of which are readily available in commodity markets wheredemand for heat exchangers is a small fraction of the total. Hence,material inputs are unlikely to restrain expansion of heat exchangersupplies.It is also unlikely that skilled labor or manufacturing plant and
equipment will limit supplies, because the required welding andmachine operator skills can be learned in a period of weeks if nec-essary, and manufacturing facilities are not highly specialized. Back-ground information about the heat exchanger industry, and syn-
fuels technology in particular, was obtained by private communica-tion with James Cronin, Manager of Projects, Air Preheater Divi-sion, Combustion Engineering, Wellsville, N.Y.
prove dramatically.28 However, as orders for newequipment skyrocket, new capacity should be-come available in time so that extremely highequipment prices can be avoided if project man-agers are willing to accept relatively brief (meas-
ured in months) delays in delivery.
Skilled Mining and Construction Labor
Construction workers and their families canmove with employment opportunities, but mov-ing is costly and especially burdensome if jobsin an area last for only a period of months. Inorder to induce essential migration, synfuels proj-ects must incur high labor costs in the form oftravel and subsistence payments as well as
28A commonly cited example of a temporary inflationary spurt,
caused by a construction boom, occurred in the U.S. petrochemi-cals industry in 1973-75. Over the period from the mid-1 960’s tomid-1 970’s, the following three price indices show a distinctive pat-tern for chemical process equipment:
Chemical process All machineryYear equlpmenta Producer goodsb and Equipment1 9 6 7 . . . 100 100 1001 9 7 0 81 110 1111971 . 86 119 1181 9 7 2 74 135 1221 9 7 3 91 160 1391 9 7 4 139 175 1611975 . . . . 167 183 1711976 . . . . . . 188 194 1821977 ., . . . 154 209 206
‘Data obtained from Annual Survey of Manufacturers, Bureau of Census, U S. Depan-ment of Commerce, SIC No. 35591 (xJ5, as reported In ASM-2.
bData obtalrlecj from U S Statistical Abstract, 1979, PP 477-79.
In words, chemical process equipment pr ices reversed a decline
in 1973, increased by more than 150 percent through 1976, and
then tapered of f again in 1977. This compares with a steady up-
ward trend from both producer goods and all machinery and equip-
m e n t .

8/14/2019 Increased Automobile Fuel Efficiency and Synthetic Fuels: Alternatives for Reducing Oil Imports
http://slidepdf.com/reader/full/increased-automobile-fuel-efficiency-and-synthetic-fuels-alternatives-for 215/292
Ch. 8—Regional and National Economic Impacts q 213
Table 63.—Peak Requirements and PresentManufacturing Capacity for HeatExchangers (Million Square Feet)
Peakrequirementsfor 3 MMB/D
of coal liquids U.S. manufacturing(1985)” capacity
1. Process shellsand tubes. . . . . . . . 22.0 27
2. Fin type . . . . . . . . . 9.2 83. Condensers . . . . . . 4.4 15
36.8 50apeak requirements indicate maximum CapaCity requirements If synfuets Proj -
ects are to maintain production schedules.
SOURC E: Achieving a Production Goal of 1 Million B/Do fCoal Liquids by 19$X),
draft prepared for the Department of Energy by TRW, Inc. and BechtetNational, Inc., March 1980, pp. 4-28.
“scheduled overtime. ” * However, while the in-flux of people and the relatively high paymentsto workers may cause severe local inflation, re-gional and national impacts should not be signifi-
cant. Confidence in this conclusion is based pri-marily on the fact that training in constructionskills can be obtained in the period of weeks andmonths and that, if anything, there is an oversup-ply of people willing to enter these trades.29
Miners will be expected to move into a newarea and stay permanently. Although it wouldseem reasonable to suppose that workers would
—*Apparently, it is important for major employers to emphasize
that they do not pay premium wages and salaries for large construc-tion projects, but instead there are various special considerations.Whatever it is called, total worker remuneration appears to pro-vide an abnormally large incentive.zgBechtel’s experience at nuclear powerplant sites in Michigan,
Pennsylvania, and Arizona has demonstrated that a person withlimited welding experience can be upgraded to “nuclear quality”in 6 to 12 weeks of intensive training. See Bechtel, “Productionof Synthetic Liquids, ” pp. 4-23. Actual training periods are influ-enced by various institutional factors. For further discussion of laborproductivity see K. C. Kusterer, Labor Productivity in Heavy Con-struction: Impact on Synfuels Program Employment, Argonne Na-tional Laboratory, ANL/AA-24, U.S. Department of Energy.
The supply of people willing to work on large construction proj-ects seems to be very price-elastic. In other words, large numbersof skilled or “able-and-willing-to-learn” workers will migrate to evenremote construction sites if wage incentives exceed going rates else-where in the Nation by 20-30 percent. Although it is difficult toconfirm this conclusion in published literature, it appears to be com-monly held among university-based experts as well as in the con-struction industry, Information was obtained from private com-munications with j. D. Borcherding, Department of Civil Engineer-ing, University of Texas in Austin; Richard Larew, Department ofCivil Engineering, Ohio State University; John Racz{ Synfuels Proj-ect Manager, Exxon USA in Houston; and Dan Mundy, BuildingConstruction Trades Department, AFL-CIO, in Washington, D.C.
be reluctant to mine underground, where work-ing conditions can be unpleasant and hazardous,historical experience suggests otherwise. In theEastern mines, with present wages about 140 per-
cent of the national average in manufacturing,labor shortages have not been a serious prob-lem.30
Basic Construction Materials
Among all synfuels resources, basic construc-tion materials (primarily steel and concrete) areleast likely to cause serious bottlenecks. The morerapid the pace of deployment, the more likelya premium price must be paid for steel and ce-ment, but supplies of both should be highly re-sponsive to price incentives.
Mineral resources for the manufacture of Port-land cement (the class of hydrolic cement usedfor construction) are widely distributed across all
regions of the Nation. The same is true for thesand and gravel that are mixed with cement andwater to make concrete. The only constraint onsupplies of cement or concrete is the time re-quired to construct new capacity, which takesat most 3 years for a new cement plant and muchless than that for a concrete mixing facility.
31Since
these times are short relative to the constructionperiod for a synfuels project, cement shortagesshould not be a serious problem.
Steel supplies, on the other hand, may be in-sufficient in certain regions because required re-
sources such as iron ore, scrap, and coking coalare not widely distributed. However, steel canbe shipped long distances without dramaticallyraising costs. For example, unfabricated structuralshapes and plates (e.g., 1 beams) are valued todayat approximately $25 per hundred pounds FOB
mAs prescribed in the new United Mine Workers/Bituminous OP-
erators Association contract, dated june 6, 1981, undergroundminers presently earn $10 to $11.76 per hour and surface miners$11.15 to $12.53. This compares with the national average wagein manufacturing of $7.80 and the average wage in constructionof $9.90, both calculated for March 1981. See Monthly La borReview, May 1981, p. 84, for additional wage data. The generaliza-tion, that labor supply has not been a serious problem, is a con-
clusion reached but stated only implicitly in an OTA report, The
Direct Use of Coa[ op. cit.31 Information abut the resource base and construction leadtirnes
obtained by private communication with Richard Whitaker, Director
of Marketing and Economic Research, Portland Cement Associa-
tion, Skokie, III,

8/14/2019 Increased Automobile Fuel Efficiency and Synthetic Fuels: Alternatives for Reducing Oil Imports
http://slidepdf.com/reader/full/increased-automobile-fuel-efficiency-and-synthetic-fuels-alternatives-for 216/292
214 . Increased Automobile Fuel Efficiency and Synthetic Fuels: Alternatives for Reducing Oil Imports
(freight on board at the factory) and they are com-monly shipped from Bethlehem, Pa., to Salt LakeCity, Utah, for another $4 per hundred pounds.In other words, even if local production is insuf-ficient to meet the needs of synfuels deployment,vast additional supplies from a national networkof suppliers can be shipped into the area without
driving up costs excessively .32
Final Comments
Despite OTA’s conclusions that resource short-ages other than engineering skills need not ob-struct synfuels deployment, it does not follow thatrapid synfuels deployment would not be inflation-ary for a broad range of resource inputs. Disre-garding the prospect of Federal intervention tospeed up deployment or to alleviate impacts, rap-id deployment could cause bursts of inflation inan economy where certain suppliers have domi-
nant market positions at least within regions,where skilled workers are reasonably well orga-nized, and where people have grown accus-tomed to inflation. In such circumstances, itwould be surprising if those with power to negoti-ate their revenues and incomes did not exerciseit to their advantage when demand for their prod-uct and services is rapidly expanding.
Another caveat should also be made concern-ing the importation of processing equipment. Ifforeign suppliers compete successfully and be-come major suppliers of synfuels equipment, as
they have already demonstrated in the GreatPlains Gasification Project, rapid deploymentcould result in substantial foreign payments.33
Depending on the general balance of paymentspicture, this could devalue the dollar in foreign
JZData obtain~ from American Meta/Market, June 16, 1981, andfrom Bethlehem Steel, Washington Office. It should be noted thatfabricated steel or steel which has been tailored to specific applica-tions can cost as much as $75 Wr hundred pounds and hence shipping costs may add much less to delivered costs (on a percentagebasis).JJln this first major synfuels project, the japanese IOW bid was
substantially below apparent costs. Among other things, this in-dicates the competitive determination of at least one foreign sup-
plier to capitalize on synfuels deployment. For related commentsby U.S. Steel firms, see Meta/s Dai/y, Sept. 4, 1980; and the ChicagoTribune, Aug. 30, 1980. For a general analysis of the U.S. steel in-dustry and its competition from abroad, see Technology and5tee/
/ndustry Competitiveness, OTA-M-122 (Washington, D. C.: U.S.Congress, Office of Technology Assessment, June 1980).
exchange markets and thus increase the price ofall imports into the United States. Perhaps offset-ting this concern about balance of payments, thesuccess of equipment imports may have a salutaryeffect on domestic producers by inducing themto improve their products and lower their costs.
Finance Capital and InflationIn addition to potential shortages among re-
source inputs, the deployment of synfuels capac-ity may be restrained by the limited availabilityof financial capital. Such a limit has already beenmentioned for small companies which cannotraise $2 billion to $3 billion and for any companytrying to borrow at presently inflated interestrates.
Limits may also be imposed by financial mar-kets that compare synfuels against all other types
of investments. If synfuels projects are indeed un-profitable, the number of projects funded maybe small or, if they are profitable, the number maybe large. In this sense, a market-based synfuelsdeployment scenario should be self-correcting,with the lure of profits attracting new investmentwhen expansion is warranted and the pain oflosses driving investors away and thus curtailingdeployment. Any of the previously discussedshortage possibilities, should they arise, will beperceived sooner or later by investors and thenumber of projects reduced as a result.
Whether or not deployment is by market incen-tives or Government policy, the adjustment andpossible disruption of financial markets requiredby synfuels deployment can be discussed in termsof gross investment data. Assume that on the av-erage, during its 5-year construction period, a$2.5-billion synfuels project requires $500 millionin outlays annually. This compares with total pri-vate domestic investment in 1980 of about $395billion, of which total about $294 billion went fornonfarm investments in new plant and equip-ment. Also in 1980, two large blocs of energy in-vestments were $34 bilion for oil and gas explora-
tion and production and $35 billion for gas andelectric utilities.34
J4AII investment data except for oil and gas were obtained fromthe Survey of Current Business, Bureau of Economic Analysis, U.S.Department of Commerce, September 1981, pp. 9, S1. Oil and gas

8/14/2019 Increased Automobile Fuel Efficiency and Synthetic Fuels: Alternatives for Reducing Oil Imports
http://slidepdf.com/reader/full/increased-automobile-fuel-efficiency-and-synthetic-fuels-alternatives-for 217/292
Ch. 8—Regional and National Economic Impacts q 21 5
In other words, 12 fossil synfuels plants underconstruction at the same time would account forabout 18 percent of the 1980 investments for theproduction of petroleum and natural gas, about17 percent of 1980 investments by electric util-ities, or about 5 percent of the total investment
in manufacturing. At this pace, assuming 5-yearconstruction periods, approximately 2 MMB/Dcapacity could be installed over the next 20 years(the low scenario). Almost three times this manyplants on the average must be under construc-tion at one time, and about three times as muchcapital must be committed to achieve the goalof just under 6 MM B/D by 2000 (high scenario).In either case, this average would be achievedby means of a relatively gradual startup, as tech-nologies are proven and experience is gained inconstruction, followed by a rapid buildup as allsystems become routine.
The question remains: Can funding be reason-ably expected for scenarios presented in thisreport? The answer depends on the future growthof GN P and the future value of liquid fuels relativeto other fuels and to all other commodities. With-out trying to predict the future, the question maybe partially answered by showing that such a di-version of funds to energy applications has prec-edents in recent history.
From 1970 to 1978, investments in oil and gasgrew at a rate of about 7.5 percent per year andinvestments in electric utilities grew at about 5percent per year, both in constant dollars. 35 Aglance back at synfuels requirements as fractionsof existing energy investments shows that it wouldtake only about 2.5 years of 7.5 percent growthin oil and gas investments or about 3.5 years of5 percent growth in electric utility investmentsto provide sufficient incremental funds to supportthe low scenario, and about three times as manyyears of growth in each case to fund the high sce-nario.
investment data were obtained from Petro/eurn /rrc/ustry hwestrnentsin the 80’s, Chase Manhatten Bank, October 1981. The total of $34billion is broken down into $22 billion for service equipment, $6.3billion for lease bonuses, and $3.1 billion for geological andgeophysical data gathering.
35 Energy investment growth data obtained from 1978 AnnualReport to Congress, Energy Information Administration, p. 128.
In other words, another 5-year period of expan-sion in energy investments, similar to their growthin 1970-78 with oil and gas and electricity addedtogether, could provide more than enough fundsannually to reach the goal of about 6 MMB/D ofsynfuels by 2000 (high scenario), assuming that
this higher level of investment were sustained forthe next 20 years. Furthermore, if such rapid de-ployment were economically justified (i.e., othercosts were rising sufficiently to make synfuels rel-atively low-cost options) there would be an eco-nomic incentive to divert funds to synfuels whichhad been devoted to conventional fuels.
Final Comments AboutInflation and Synfuels
In an inflating economy, all price incrementstend to be viewed as inflationary. However, this
appearance obscures the fact that some price in-creases are necessary adjustments in relativeprices in order to reduce consumption and to in-crease production. The latter will be true if syn-fuels place large, long-term, new demands onscarce human and material resources.
On the other hand, construction costs havegrown faster than the general rate of inflationsince the mid-1960’s.
36(See fig. 19.) Recently, the
reverse has been true but there is reason to beconcerned that rapid synfuels deployment couldexacerbate what has been a serious inflationary
problem. In any case, rising real costs of construc-tion has been one of the major reasons why “cur-rent” estimates of synfuels costs have more orless kept pace with rising oil prices. (See ch. 6for more detailed discussion.)
Finally, although most of this discussion has ex-plored how synfuels deployment may aggravateinflation, the cause and effect couId be reversedif deployment of first generation plants is tooslow. That is, if the promise of synfuels remains
JbcOrlSUrner price Index obtained from 1980 U.S. Statistic/
Abstract, p. 476. Construction Cost Index obtained from EngineeringNews Record, McGraw Hill, Dec. 4, 1981, Market Trends Section.The actual data series published in this journal has been convertedfrom a base year of 1916 to a base year of 1977. There are severalconstruction cost indices published by reputable sources, but onlythe ENR was reproduced here because the data available to OTAsuggest that all such series reflect more or less the same trends.
98-281 0 - 82 - 15 : c L 3

8/14/2019 Increased Automobile Fuel Efficiency and Synthetic Fuels: Alternatives for Reducing Oil Imports
http://slidepdf.com/reader/full/increased-automobile-fuel-efficiency-and-synthetic-fuels-alternatives-for 218/292
216 • Increased Automobile Fuel Efficiency and Synthetic Fuels: Alternatives for Reducing Oil Imports
Figure 19.—Time Series Comparison: Construction in the distant future and conservation attemptsCosts and Consumer Prices
_ Construction cost index of Enginee ring I
News Record
--- Consumer Price Index
/
are clearly insufficient to balance oil supply anddemand worldwide, there will be no market-im-posed lid on the price of oil and no reason to ex-pect that sharp oil import price increases will notcontinue to destabilize domestic prices. In thatcase, the inflationary impacts of rapid deployment
may appear to be much more acceptable.
SOURCE: U.S. Bureau of Labor Statistics, “Monthly Labor Review and Handbookof Labor Statistics,” annual, and “BM and ID Investment Manual,” /n-vestrnent Enghwedng, sec. 1, part 6, item 614, pg. 1, Apr. 16, 1961.

8/14/2019 Increased Automobile Fuel Efficiency and Synthetic Fuels: Alternatives for Reducing Oil Imports
http://slidepdf.com/reader/full/increased-automobile-fuel-efficiency-and-synthetic-fuels-alternatives-for 219/292
Chapter 9
Social Effects and Impacts

8/14/2019 Increased Automobile Fuel Efficiency and Synthetic Fuels: Alternatives for Reducing Oil Imports
http://slidepdf.com/reader/full/increased-automobile-fuel-efficiency-and-synthetic-fuels-alternatives-for 220/292

8/14/2019 Increased Automobile Fuel Efficiency and Synthetic Fuels: Alternatives for Reducing Oil Imports
http://slidepdf.com/reader/full/increased-automobile-fuel-efficiency-and-synthetic-fuels-alternatives-for 221/292
Chapter 9
Social Effects and Impacts
INTRODUCTION
Increased automotive fuel efficiency and pro- producing synthetic fuels will be felt primarily in
duction of synthetic fuels will both give rise to communities which experience rapid surges anda variety of social impacts. The impacts of increas- declines in population as plants are built anding fuel efficiency will occur primarily as changes begin to operate.in employment conditions, while the impacts of
SOCIAL IMPACTS OF CHANGINGAUTOMOTIVE TECHNOLOGY
Overview
The characteristics and uses of automobilessold in the United States indicate that historical-ly Americans have valued automobiles not onlyfor personal transportation but also as objects ofstyle, comfort, convenience, and power. Substan-tial increases in the costs of owning and operatingautomobiles that occurred during the 1970’s, andthat are expected in the future, are motivatingconsumers to change their attitudes and behaviorin order to reduce spending on personal transpor-tation. Some have purchased smaller, more fuel-efficient vehicles. Others have chosen to keeptheir present vehicles longer. Large numbers aresimply driving less. Since January 1979, the com-bined subcompact and compact share of totalsales has climbed from 44 to 61 percent, and gas-oline consumption has declined 12 percent.About one-half to three-quarters of these fuel sav-ings can be attributed to increased fuel efficien-cy of the automobile fleet.
Although about 12 percent of personal con-sumption expenditures has historically gone toautomobile ownership and operation, rising costsmay ultimately induce consumers to spend asmaller share of their budgets on automobiles or —at least—not to let that share increase. Recentincreases in the small-car proportion of new-car
sales suggest that consumers are prepared totrade cargo space and towing capability for highfuel economy and the prospect of relatively lowoperating costs. in the future, instead of buyingvehicles designed for their most demanding trans-
portation needs, people may buy small vehiclesfor daily use and rent larger vehicles for infre-quent trips with several passengers, bulky or
heavy cargo, or towing. The movement towardsmall cars is slowed by the tendency for peopleto retain cars longer than before. * Purchases offuel-efficient vehicles and ownership of severalvehicles, each suited for different transportationneeds, would be facilitated by improved econom-ic conditions.
Ridesharing and mass transit use have becomemore common and could increase further. Sincethe 1973-74 oil embargo public transit ridershiphas increased 25 percent.
1Ridesharing and transit
use are limited by the dispersion of residencesand jobs, and, for transit, by the adequacy andavailability of facilities. Mass transit capacity islimited during peak commuting periods and oftenis unavailable or scheduled infrequently in areasoutside of central cities.
It should be noted that low-income people arelikely to have the fewest options for adjusting torising automobile costs. People with low incomesalready tend to own fewer vehicles, have relative-ly old vehicles (which were typically boughtused), travel less, and share rides or use publictransit more than the affluent.
Consumers are likely to respond differently toelectric vehicles (EVs) and small conventionally
*Thirty-five percent of private vehicles were over 5 years old in1969, 51 percent were over 5 years old in 1978.
‘American Public Transit Association.
21 9

8/14/2019 Increased Automobile Fuel Efficiency and Synthetic Fuels: Alternatives for Reducing Oil Imports
http://slidepdf.com/reader/full/increased-automobile-fuel-efficiency-and-synthetic-fuels-alternatives-for 222/292
220 q Increased Automobile Fuel Efficiency and Synthetic Fuels: Alternatives for Reducing Oil Imports
powered cars (using internal combustion engines)because of different cost, range, and refuelingattributes (see table 64). The conventionallypowered car would have two significant advan-tages over an EV: unlimited range (with refuel-ing) and substantially lower first cost. The EV, on
the other hand, would offer the advantage ofbeing powered by a secure source of energy(electricity) and therefore assure mobility in theevent of disruption of gasoline supplies. It is notclear how the consumer would weigh these twooptions, although the degree to which EV man-ufacturers can reduce the cost differential is cer-tain to be very important.
Employment
In 1980, the Bureau of Labor Statistics estimatedthat there were fewer than 800,000 people em-
ployed in primary automobile manufacturing andautomotive parts and accessories manufacturing.This compares with employment levels over900,000 during the peak automobile productionperiod, 1978-79.2 These figures, however, pre-sent an incomplete picture of employment. Al-though the Bureau of the Census counts employ-ees in industries producing various primary prod-
2Bureau of Labor Statistics, Current Employment Statistics Pro-gram data.
ucts, it does not identify how many workers con-tribute to intermediate products used in auto-mobiles or other finished goods. Thousands ofautomotive people perform work in support ofautomobile manufacturing within industriesotherwise classified—producing, for example,
glass vehicular lighting, ignition systems, storagebatteries, and valves. Thus, the Department ofTransportation estimated that during 1978 to 1979about 1.4 million people were employed by autosuppliers overall.3
Historically, the growing but cyclical nature ofthe auto market resulted in a pattern of periodicgrowth and decline in auto-related employment(see table 65). Current and projected trends forstrong import sales, decline in the growth rateof the U.S. auto market, increased use of foreignsuppliers and production facilities, and adoptionof more capital-intensive production processes
and more efficient management by auto manu-facturers and suppliers will contribute to a generaldecline in auto industry employment.
Specific changes in employment will dependon the number of plants closed or operating un-
3U. S. Department of Transportation, The U.S. Autorrrobi/e /ndus-try, 1980: Repori to the President from the Secretary of Transporta-tion (Washington, D.C: Department of Transportation, January1981 ).
Table 64.—initial and Lifecycle Costs of Representative Four-Passenger Electric Cars
Near term Advanced
Pb-Acid Ni-Fe Ni-Zn Zn-CL 2 (ICE) Zn-CL 2 Li-MS (ICE)
Initial cost, dollars . . . . . . . . . . . . . . . . . . . . . . . . . 8,520Vehicle . . . . . . . . . . . . . . . . . . . . . . . . . . . . . . . . . 6,660Battery . . . . . . . . . . . . . . . . . . . . . . . . . . . . . . . . . 1,860
Lifecycle cost, cents per mile . . . . . . . . . . . . . . . 23.9Vehicle . . . . . . . . . . . . . . . . . . . . . . . . . . . . . . . . . 5.0Battery . . . . . . . . . . . . . . . . . . . . . . . . . . . . . . . . . 3.0Repairs and maintenance . . . . . . . . . . . . . . . . . 1.5Replacement tires . . . . . . . . . . . . . . . . . . . . . . . 0.6Insurance . . . . . . . . . . . . . . . . . . . . . . . . . . . . . . . 2.2Garaging, parking, tolls, etc.. . . . . . . . . . . . . . . 3.1Title, license, registration, etc.. . . . . . . . . . . . . 0.7Electricity. . . . . . . . . . . . . . . . . . . . . . . . . . . . . . . 2.3Fuel and oil . . . . . . . . . . . . . . . . . . . . . . . . . . . . . —Cost of capital . . . . . . . . . . . . . . . . . . . . . . . . . . 5.5
8,4005,9502,45024.9
4.54.81.50.52.23.10.62.2 —
5.5
8,1305,7202,41026.6
4.37.01.50.52.23.10.62.0 —
5.4
8,1205,5402,58022.0
4.22.31.50.52.23.10.62.2 —
5.4
4,7404,740—
21.44.3 —
3.90.42.23.10.6—4.03.0
7,0505,4101,64019.4
4.11.41.50.42.23.10.51.7—4.5
6,8105,1801,63020.1
3.92.61.50.42.23.10.51.5 —
4.4
5,1405,140—
21.84.7 —
3.90.42.23.10.5 —
3.73.3
NOTE: All costs are In mid-19S0 dollars. Annual travel 10,000 miles
Assumptions: Car end battery salvage value 10 percentElectrlclty price S0.03 per kilowatt-hour Cost of capitalGasoline price $1.25 per gallon
10 percent per yearCar and battery purchases are 100 percent financed over their useful lives.
Electrlc vehicle life 12 years Electricity cost includes a road use tax equal to that paid by typical gasolineInternal combustion engines vehicles of equal weight vla State and Federal geso[lne taxes.
vehicle life 10 years
SOURCE: General Research Corp. Cost categories and many entries, such as tire% Insurance, 9araOin0, etc., are based on periodic cost analyses by the Departmentof Transportation (see footnote 13). All costs shown were computed by the Electric Vehicle Weight and Cost Model (EVWAC) (see footnote 14).

8/14/2019 Increased Automobile Fuel Efficiency and Synthetic Fuels: Alternatives for Reducing Oil Imports
http://slidepdf.com/reader/full/increased-automobile-fuel-efficiency-and-synthetic-fuels-alternatives-for 223/292
Ch. 9—Social Effects and Impacts . 221
Table 65.—Auto Industry Employment Data
(2)(1) Average annual
Average annual employment in primaryunemployment rate in auto manufacturing and
the motor vehicle parts and accessoriesindustry SIC 371 manufacturing, SIC
Year (percent) 3711 and SIC 3714 (000)1970. . . . 7.0 733.41971 . . . . 5.1 781.31972 . . . . 4.4 798.21973. . . . 2.4 891.51974 . . . . 9.3 818.91975. . . . 16.0 727.81976. . . . 6.0 814.91977 . . . . 3.9 869.51978. . . . 4.1 921.71979. . . . 7.4 908.61980 . . . . 20.3 775.6
SOURCE Column 1 data are from the Bureau of Labor Statistics, household sam-ple survey Column 2 data are from the Bureau of Labor Statisticsestablishment survey, Data in the two columns are not directly com-parable. “SIC” refers to “Standard Industrial Classification.”
der capacity, the capacity of the plants, and thedegree to which production at affected plants islabor-intensive. The long-term effects on workersdepend on personal characteristics such as skills(many production workers have few transferableskills), the levels of local and national unemploy-ment, information about job opportunities, andpersonal mobility (greatest for the young, theskilled, and those with some money).
The Department of Transportation estimatesthat each unemployed autoworker costs Federaland State Governments almost $15,000 per year
in transfer payments and lost tax revenues. Thisestimate implies, for example, that if 100,000 to500,000 manufacturer and supplier workers areunemployed for a year their cost to governmentis about $1.5 billion to $7.5 billion. During 1980,payments to unemployed workers of GeneralMotors (GM), Ford, and Chrysler in Michigan in-cluded about $380 million in unemployment in-surance, $100 million in extended benefits, and$800 million in “trade adjustment assistance”(provided by a program established in the TradeExpansion Act of 1962 and modified by the TradeAct of 1974).4
Growing use of labor-saving machinery by automanufacturers and major suppliers to implement
4Michigan Employment Security Commission, personal communi-cation.
complex technologies, cut costs, and improveproduct quality is reducing job opportunities inthe auto industry. GM, for example, expects toinvest almost $1 billion by 1990 for 13,000 newrobots for automobile assembly and painting andparts handling. A new robotic clamping and
welding system developed by GM and RobogateSystems, Inc., will enable GM to reduce laborcosts for welding by about 70 percent, improvewelding consistency, and reduce vibration andrattling in finished automobiles. s
MacLennan and O’Donnell, analysts at DOT,have calculated that today’s new and refurbishedplants can assemble 70 cars/hour with an averageemployment level of 4,500, while older plantstypically produce 45 to 60 cars/hour using about5,400 workers. Such plant modernization impliesthat three fewer assembly plants and 23,000 few-er workers are needed to assemble 2 million cars
annually. 6 The United Auto Workers estimatesthat labor requirements in auto assembly, whichhas been a relatively labor-intensive aspect ofauto manufacture, will be reduced by up to 50percent by 1990 through the use of robots andother forms of automation. ’
Foreign-designed automobiles manufactured inthe United States also provide jobs. Current andanticipated local production by foreign firms (onlyVolkswagen (VW) to date) largely involves vehi-cle assembly, using primarily imported compo-nents and parts. VW’s Pennsylvania plant em-
ploys 7,500 workers to assemble over 200,000cars and contributes to about 15,000 domesticsupplier jobs; 8 a comparably sized domestic--owned plant would support a total of about35,000 domestic jobs. New U.S. manufacturingand supplier jobs will grow with local produc-tion and purchasing from U.S. suppliers by for-eign firms in proportion to the amount of localproduction content in the automobiles. Theplanned increase in local content for Rabbitsmade here by VW—from 70 percent in model
5“GM’s Ambitious Plans to Employ Robots, ” Business Week, Mar.
16, 1981.‘Carol MacLennan and ]ohn O’ Donnell, “The Effects of the Auto-
motive Transition on Employment: A Plant and Community Study”(Washington, D.C: U.S. Department of Transportation, December1980).
7Business Week, op. cit.8Department of Transportation, op. cit.

8/14/2019 Increased Automobile Fuel Efficiency and Synthetic Fuels: Alternatives for Reducing Oil Imports
http://slidepdf.com/reader/full/increased-automobile-fuel-efficiency-and-synthetic-fuels-alternatives-for 224/292
year 1981 to 74 percent in model year 1983–implies more work in the United States.9
The Departments of Labor and Transportationestimate that there are between one and two sup-plier jobs overall for each primary auto manufac-turing job.10 Change in supplier employment as-sociated with declining manufacturing employ-ment is uncertain, and will depend on the natureof the supplied product, how it is made, and theamount that auto manufacturers buy. While some
supplier jobs, like auto manufacturing jobs, de-
9“VW Projects Increases in U.S. Content,” Ward’s AutomotiveReports, May 27, 1981.IOMac Lennan and O’Donnell, Op. cit.
penal on production volume, other supplier jobs(e.g., in machine tool manufacture and plasticsprocessing) are tied to the implementation of newtechnology. Trends toward foreign sourcing andvehicle production and automation among sup-pliers suggest that supplier employment overallwill decline.
Steel and rubber industry jobs are especiallyvulnerable to automotive weight and volume re-ductions. Many of these supplier jobs have al-ready been lost with automotive weight reduc-tions during the 1970’s. For example, MacLen-nan and O’ Donnell estimate that reduced auto-motive use of iron and steel in 1975 to 1980 ledto a permanent loss of 20,000 jobs, a loss only

8/14/2019 Increased Automobile Fuel Efficiency and Synthetic Fuels: Alternatives for Reducing Oil Imports
http://slidepdf.com/reader/full/increased-automobile-fuel-efficiency-and-synthetic-fuels-alternatives-for 225/292

8/14/2019 Increased Automobile Fuel Efficiency and Synthetic Fuels: Alternatives for Reducing Oil Imports
http://slidepdf.com/reader/full/increased-automobile-fuel-efficiency-and-synthetic-fuels-alternatives-for 226/292
224 q Increased Automobile Fuel Efficiency and Synthetic Fuels: Alternatives for Reducing Oil Imports
Figure 20.–Auto, Steel, and Tire Plant Changes, 1975=80
SOURCE: U.S. Department of Transportation, “The U.S. Automobile industry, 1980,” DOT-P-1 O-81-O2, p. xviii, January 1981.
Table 66.—Factors to Consider inLocating Parts-Supplier Plants
Relative ranking
Factor 1970’s 1980’s
Availability and cost of skilled labor . . . .Availability and cost of energy . . . . . . . . . 2;
State and local taxes, incentives . . . . . . . 3Availability and cost of raw materials . . . 2Work ethic of area . . . . . . . . . . . . . . . . . . . 4State and local permits, regulations . . . . 5Worker’s compensation insurance . . . . . . 7Availability and cost of capital . . . . . . . . . 7Right-to-work state (union relations) . . . . 6Freight costs . . . . . . . . . . . . . . . . . . . . . . . . 10
Quality of living environment . . . . . . . . . . 8Community attitude ., . . . . . . . . . . . . . . . . 9Customer service . . . . . . . . . . . . . . . . . . . . 12Available land . . . . . . . . . . . . . . . . . . . . . . . 11
1
23456789
10
11111112
SOURCE: Arthur Andersen & Co. and the Michigan Manufacturer Association,Woddwlde Corrrpetltlveness of the U.S. Automotive Industry and ItsParts Suppliers During the 1930s, Februa~ 1981.
in automobile-related employment. Because oflocal and regional employment dependence onone industry—motor vehicles—other businesses(such as retail and service establishments) andtheir employment also suffer as employment inthe local population declines.
Unemployment and out-migration will jeopard-ize other businesses and strain local tax bases,and Michigan will be especially vulnerable. Lossof employment, population, and business recent-ly induced Moody’s Investers Service, Inc., to
lower bond ratings for Akron, Ohio, which hasdepended on the tire and rubber industry for itseconomic vitality; bond ratings for other auto-dependent cities have also been lowered.

8/14/2019 Increased Automobile Fuel Efficiency and Synthetic Fuels: Alternatives for Reducing Oil Imports
http://slidepdf.com/reader/full/increased-automobile-fuel-efficiency-and-synthetic-fuels-alternatives-for 227/292
Ch. 9—Social Effects and Impacts q 225
Photo credit: Michigan Employment Security Commission
Shifts in plant location associated with investments in fuel efficiency may create unemployment problems intraditional manufacturing centers
SOCIAL IMPACTS OF SYNFUELS DEVELOPMENT
Overview
The principal social consequences of develop-ing a synthetic fuels industry arise from largeand rapid population increases and fluctuationscaused by the changing needs of industry for em-ployees during a facility’s useful life. Such popula-tion changes disproportionately affect small, ruralcommunities that have limited capacity to absorband manage the scale of growth involved; these
types of communities characterize the locationswhere oil shale and many coal deposits arefound.
In general, whether the consequences ofgrowth from synfuels development will be
beneficial or adverse will depend on the abilityof communities to manage the stresses which ac-company rapid change. Although impacts can begenerally characterized, the extent and nature oftheir occurrence will be site-specific dependingon both community factors (size, location, taxbase) and technology-related factors (the loca-tion, size, number, and type of synfuels facilities;the rate and timing of development; and associ-ated labor requirements).
Growth will tend to concentrate in establishedcommunities where services are already availa-ble, if they are within commuting distance to syn-fuels facilities. New towns may be established to

8/14/2019 Increased Automobile Fuel Efficiency and Synthetic Fuels: Alternatives for Reducing Oil Imports
http://slidepdf.com/reader/full/increased-automobile-fuel-efficiency-and-synthetic-fuels-alternatives-for 228/292
226 . Increased Automobile Fuel Efficiency and Synthetic Fuels: Alternatives for Reducing Oil Imports
accommodate growth in some areas. Large townswill serve as regional service centers. Isolatedcommunities will more likely experience greaterimpacts than areas where well-linked communi-ties can share the population influx. Energy con-version facilities which are sited near mines will
result in the greatest concentration of local im-pacts.
Most synfuels production from oil shale in theNation will be concentrated in four Westerncounties, affecting about a dozen communitiesin sparsely populated areas of northwestern Col-orado and northeastern Utah, and eventuallysouthwestern Wyoming. These communities arewidely separated, are connected by a skeletaltransportation network, and have had historicallysmall populations. Oil shale cannot be economic-ally transported offsite because of the large quan-tities of shale involved per barrel of product.
Coal presents a more flexible set of options thanoil shale with respect to the location of conver-sion facilities in relation to mines. The coal usedfor synfuels production will most likely be dis-persed among all the Nation’s major coal regions.
In the West, coal sites will be in the oil shaleStates (Colorado, Utah, and Wyoming) as wellas in Montana, North Dakota, and New Mexico.Most of the increase in Western coal productionfor synfuels will be in Wyoming and Montana.19
Midwestern sites will most likely be in Illinois,
western Kentucky, and Indiana. The coal coun-ties to be most severely affected in Appalachiawill be in rural parts of southwestern Pennsyl-vania, southern West Virginia, and eastern Ken-tucky. Parts of Illinois will also be affected. In cen-tral Appalachia, communities are typically small,congested, and in rural mountain valleys.
The major differences between the Eastern andWestern coalfields, in general, are that in theWest, counties are larger, towns are smaller andmore scattered, the economic base is more diver-sified, more land is under Federal jurisdiction,water is relatively more scarce, and the terrainis less rugged and variable. To the extent that coal
lgE. j. Bentz & Associates, Inc., “Selected Technical and EconomicComparisons of Synfuel Options,” contractor report to OTA, April1981.
is transported, there could be additional environ-mental and safety hazards, noise, and disruptionor fragmentation of communities, farms, andranch lands.
The social consequences of producing synthet-ic fuels from biomass are discussed in detail in
a previous OTA report, Energy From BiologicalProcesses. Unlike the social consequences associ-ated with fossil fuels, the social impacts of bio-mass arise from production rather than process-ing. For example, 90 percent of the employmentimpacts from biomass are expected from cultiva-tion and harvesting (mostly forestry).
Manpower Requirements
Manpower requirements for synfuels produc-tion are generally of two types: 1) labor is re-quired for the construction of energy facilities and
supporting service infrastructures, and 2) workersare needed for the operation and maintenanceof facilities. As discussed in chapter 8, the abilityto attract and retain an adequate labor force—particularly experienced chemical engineers andskilled craftsmen, who are already in short supply —could become a constraint on synfuels develop-ment.
Construction manpower requirements for sin-gle projects lead to large, rapid, yet temporary,increases in the local population. The construc-tion phase usually lasts 4 to 6 years, peaking over
a 2- to 4-year period as construction activitiesnear completion.20 The shorter the scheduledconstruction period, the higher the peak laborforce.21 Labor requirements will change signifi-cantly during the construction phase, in terms ofboth size and occupational mix. Labor require-ments for the daily, routine operation and mainte-nance of a plant are relatively stable during theuseful life of the facility; scheduled yearly and ma-
jor maintenance work would cause only brief in-creases in the operations labor force.
Estimates of manpower requirements for gener-
ic 50,000 barrel per day (bbl/d) synthetic fuelZolbid.21 peter D. Miller, “stability, Diversity, and Equity: A Comparison
of Coal, Oil Shale, and Synfuels,” in Supporting Paper 5: Socio-political Effects of Energy Use and Policy, CONAES, Washington,D. C., 1979.

8/14/2019 Increased Automobile Fuel Efficiency and Synthetic Fuels: Alternatives for Reducing Oil Imports
http://slidepdf.com/reader/full/increased-automobile-fuel-efficiency-and-synthetic-fuels-alternatives-for 229/292

8/14/2019 Increased Automobile Fuel Efficiency and Synthetic Fuels: Alternatives for Reducing Oil Imports
http://slidepdf.com/reader/full/increased-automobile-fuel-efficiency-and-synthetic-fuels-alternatives-for 230/292
228 q Increased Automobile Fuel Efficiency and Synthetic Fuels: Alternatives for Reducing Oil Imports
for support services in nearby communities in-creases with the absolute size of the work forceduring the peak construction period. The largerthe work force required during peak construc-tion relative to that required for operations andmaintenance, the greater the likelihood that near-by communities will experience large populationfluctuations.
In general, if several facilities are located in thesame area, the impacts from population growthand fluctuation could be disproportionately largeunless construction and operation activities arecoordinated; on the other hand, populationgrowth associated with construction can be stabi-lized if an indigenous construction work forcedevelops. *
Estimates of population increases associatedwith the fossil synfuels development scenarios
presented in chapter 6 are shown in table 68. Ona regional basis, population growth associatedwith oil shale will be concentrated in only severalcounties in the Mountain Region (see fig. 21).population increases associated with coal-basedsynfuels will be dispersed throughout the Nation,with the East North Central experiencing the big-gest population increases and the West SouthCentral experiencing the smallest population in-creases.
Table 69 shows energy-related populationgrowth during the last decade in selected com-munities. In small communities, and in sparsely
populated counties and States, energy-relatedpopulation growth could represent a significantproportion of future population growth. For ex-ample, official population projections by the Col-orado West Area Council of Governments(CWACOG) show increases by 1985, relative to1977, of up to 400 percent in Rio Blanco County(1977 special census population was 5,100) and300 percent in Garfield County (1 977 special cen-sus population was 18,800), assuming the indus-try develops according to the 1979 plans of com-panies active in the area.
*A succession of projects in an area should lead to an indigenousand more stable construction manpower work force, dependingon whether workers perceive a permanence of industrial expan-sion in the area. Some proportion of the construction work forcemay also be employed in operations and maintenance activitiesonce construction is completed.
Table 68.—Estimates of Regional PopulationGrowth Associated With Fossil Synfuels
Development a (thousands)
1990 1995 2000
Low estimate:South Atlantic . . . . . . . . . . . 4-6 12-20 30-51East North Central . . . . . . . 14-24 46-76 115-192
East South Central . . . . . . . 5-9 17-28 42-71West North Central . . . . . . . 5-9 17-28 42-71West South Central. . . . . . . 2-3 6-10 15-25Mountain:
Coal . . . . . . . . . . . . . . . . . . 7-12 23-38 58-96Shale . . . . . . . . . . . . . . . . . 66-110 90-150 81-135
Total . . . . . . . . . . . . . . . . . 103-173 211-350 383-641
High estimate:South Atlantic.. . . . . . . . . . . 11-18 33-55 86-144East North Central . . . . . . . 33-56 105-174 275-458East South Central . . . . . . . 11-18 33-55 86-144West North Central . . . . . . . 17-29 54-90 141-235West South Central. . . . . . . 5-8 15-25 39-65Mountain:
Coal . . . . . . . . . . . . . . . . . . 19-32 60-100 122-203Shale . . . . . . . . . . . . . . . . . 132-220 213-355 108-180
Total . . . . . . . . . . . . . . . . . 228-381 513-854 857-1,429aEstimate are relative to 1985 (for plants coming online in the Year shown) and
are based on OTA’s development scenarios presented in ch. 8. Populationmultipliers of 3 and 5 were applied to develop the ranges shown. Aggregatedestimates should not be extrapolated to determine the ability of any State orlocality to absorb this population.bproduction iS distributed among the regions, according to the low and high
scenario distributions used In the Bechtel report for, respectively, the low andhigh scenarios developed herein (Bechtel National, Inc., December 1979). It isfurther assumed that direct and indirect iiquids wiil be representad equally. Onlydally, routine O&M requirements are included.Regional estimates are for coal processes unless other wise indicated.
SOURCE: Office of Technology Assessment.
Under CWACOG’s high-growth scenario(500,000 bbl/d in 1990 and 750,000 bbl/d in 1995and 2000), increases of up to 800 percent in RioBlanco County and 350 percent in Garfield Coun-ty are projected.26 In three counties in Kentuckywhere the construction of four major synfuelsplants had recently been planned to commence(H-Coal, SRC-1, W. R. Grace, and Texas Eastern),the expected maximum number of synfuels work-ers (excluding accompanying family members)was projected to increase 1980 population levelsby about 3 percent in Daviess County (1 980 cen-sus population was 86,000) to over 30 percentin Breckinridge County (1980 census populationwas 17,000) and over 50 percent in Henderson
County (1980 census population was 41 ,000);population increases during the operation phase
ZbAn Assessment of oil Shale Technologies, OTA-M-1 18
(Washington, D. C.: U.S. Congress, Office of Technology Assess-ment, June 1980).

8/14/2019 Increased Automobile Fuel Efficiency and Synthetic Fuels: Alternatives for Reducing Oil Imports
http://slidepdf.com/reader/full/increased-automobile-fuel-efficiency-and-synthetic-fuels-alternatives-for 231/292
Ch. 9—Social Effects and Impacts . 229
Figure 21 .—Census Regions and Geographic Divisions of the United States
- ..
0
H
SOURCE: U.S. Department of Commerce, Bureau of the Census.
Table 69.–Population Growth in Selected Communities, 1970-80
Percent increasePopulation b
Average annualState City Energy resource impact a 1970 1980 Total (compounded)
West Virginia
Kentucky
Utah
Wyoming
North Dakota
Montana
Colorado
Buckhannon, Upshur County(Union District)
Caseyville, Union County
Huntington, Emergy CountyOrangeville, Emery CountyHelper, Carbon CountyDouglas, Converse CountyGillette, Campbell CountyRocksprings, Sweetwater County
Washburn, McLean CountyBeulah, Mercer CountyForsyth, Rosebud CountyHardin, Big Horn CountyColstrip, Rosebud County c
Craig, Moffat CountyRifle, Garfield CountyHayden, Routt County
coal
coal
coal, powerplantcoal, powerplantcoal
coal, uranium, oil, gascoal
coal, oil, gas, trona,powerplant, uranium
coal, powerplantcoal, powerplantcoal, powerplant
coalcoal, powerplantcoal, powerplant
oil shale, minerals, coalcoal, powerplant
248 587 136.7
87.0
857 2,316 170.2511 1,309 156.21,964 2,724 38.72,677 6,030 125.37,194 12,134 68.7
11,657 19,458 66.9
8041,3441,8732,733<2004,2052,150
763
1,767 119.82,878 114.12,553 36.33,300 20.73,500 1,650.08,133 93.43,215 49.51,720 125.4
9.0
6.5
10.59.93.38.55.45.3
8.27.93.21.9
33.16.84.18.5
aldentified by the Department of community Development within the respective States.bBureau of the Census, 19s0 Cansus of Population and Housing, Advance RepOffs.CEStirnates by sunllght Development, Inc.
SOURCE: Office of Technology Assessment.

8/14/2019 Increased Automobile Fuel Efficiency and Synthetic Fuels: Alternatives for Reducing Oil Imports
http://slidepdf.com/reader/full/increased-automobile-fuel-efficiency-and-synthetic-fuels-alternatives-for 232/292
230 q Increased Automobile Fuel Efficiency and Synthetic Fuel Alternatives for Reducing Oil Imports
were projected to be respectively 0.4, 4, and 15percent (excluding accompanying family mem-bers).
27Table 70 shows statewide population esti-
mates, based on an extrapolation of only demo-graphic trends, for some of the States that aremost likely to experience population increasesfrom synfuels development.
Small rural communities (under 10,000 resi-dents) that experience high population growthrates are vulnerable to institutional breakdowns.Such breakdowns could occur in the labor mar-ket, housing market, local business activities, pub-lic services, and systems for planning and financ-ing public facilities. Symptoms of social stress(such as crime, divorce, child abuse, alcoholism,and suicide) can be expected to increase.
The term “modern boomtown” has been usedto describe communities that experience strains
on their social and institutional structure fromsudden increases and fluctuations in the popula-tion. Communities are also concerned about thepossibility of a subsequent “bust.” Large fluctua-tions in population size could lead to a situationwhere a community expands services at onepoint in time only to have such services under-utilized in the future if demands fail to materializeor be sustained.
ZZC. Gilmore Dutton, “Synfuel Plants and Local Government FiscalIssues, ” memorandum to the Interim Joint Committee on Appropria-tions and Revenue, Frankfort, Ky., Dec. 18, 1980.
Private Sector Impacts
The principal social gains from synfuels devel-opment in the private sector are increased wagesand profits; direct and secondary employmentopportunities will be created and expanded; dis-posable income will increase; profits from energy
investments should be realized; and local tradeand service sectors will be stimulated. The abil-ity of the private sector to absorb growth will de-pend, in large part, on the degree of economicdiversification already present. Western commu-nities, in general, have more diversified econo-mies and broader service bases than those in theEast, where many communities (as in central Ap-palachia) have historically been economicallydependent on coal.
Many private sector benefits, however, will notbe distributed to local communities, at least dur-
ing the early periods of rapid growth. For exam-ple, synfuels development would be located inareas where the required manpower skills arealready scarce; unemployment in local communi-ties may thus not be significantly lowered unlesslocal populations can be suitably trained. Wheresynfuels development competes with other sec-tors for scarce labor, fuel and material inputs, andcapital resources, traditional activities may be cur-tailed and the price of the scarce resources in-flated. Local retail trade and service industriesmay experience difficulties in providing and ex-panding services to keep pace with demands, re-
Table 70.—Statewide Population Estimates
Total State Statewide population percent Projected State
population 1980 a increase 1970-80 population 2000 b
State (millions) Total Annual compounded 1990 2000
Kentucky . . . . . . . . . 3.66 13.7 1.3 4.08 4.43West Virginia. . . . . . 1.95 11.8 1.1 2.08 2.20Colorado . . . . . . . . . 2.89 30.7 2.7 3.50 4.00Montana. . . . . . . . . . 0.79 13.3 1.3 0.90 0.98North Dakota. . . . . . 0.65 5.6 0.5 0.70 0.73Wyoming . . . . . . . . . 0.47 41.6 3.5 0.54 0.60Utah . . . . . . . . . . . . . 1.46 37.9 3.3 1,73 1.95aeureau of the Census, 1980 census of Population and Housing, Advanced Reports.
beureau of the census, ///ustrat/ve Projections of State Populations by Age, Race, and Sex: 1975 fO ~. Projected estimatesare from Series II-B which assumes a continuation from 1975 through 2000 of the civilian non-college interstate migrationpatterns by age, race, and sex observed for the 1970-75 period. Has been corrected by the percent difference between the1980 projections and the 19S0 census. Note that these projections are extensions of recent trends with respect to demographicfactors only.
SOURCE: Office of Technology Assessment.

8/14/2019 Increased Automobile Fuel Efficiency and Synthetic Fuels: Alternatives for Reducing Oil Imports
http://slidepdf.com/reader/full/increased-automobile-fuel-efficiency-and-synthetic-fuels-alternatives-for 233/292
Ch. 9—Social Effects and Impacts q 23 1
cruiting and retaining employees, and competingwith out-of-State concerns. Both the Eastern andwestern sites for synfuels development have gen-erally depended on imported capital, and prof-its to and reinvestments of the energy companiesare likely to be distributed to locations remotefrom plant sites.
High local inflation rates often accompany rap-id growth, due to both excess demand for goodsand services and high industrial wage rates. Localinflation penalizes those whose wages are inde-pendent of energy development and those onfixed incomes.28
Housing can be a major problem for the privatesector in areas that grow rapidly from synfuelsdevelopment: the existing housing stock is usuallyalready in short supply and often of poor qual-ity; local builders often lack the experience andcapability to undertake projects of the large scalerequired; shortages of construction financing andmortgage money are common; and land may notbe available for new construction because of ter-rain, land prices, or overall patterns of owner-ship. Housing shortages have already led to dra-matic price increases in the Western oil shaleareas. The need for temporary housing for con-struction workers aggravates housing supplyproblems, and mobile homes are often used byboth temporary and permanent workers.
Public Sector Impacts
Communities experiencing rapid growth arevulnerable to the overloading of public facilitiesand services, due both to large front-end capitalcosts and to constraints which limit a communi-ty’s ability to make the necessary investments ina timely fashion. * Ability of a community to ab-sorb and provide for a growing population willbe community-specific and depend on many fac-tors—such as the size of the predevelopment taxbase, availability of developable land, existing
ZoAn Assessment of Oi l Shale Technologies, Op. Cit.
*investments in the public sector can be constrained by, as ex-amples, existing tax bases, debt limitations, bonding capacity, andthe 2- to 5-year Ieadtime typically required for planning and imple-menting services. In addition, ceilings are often established on therate of expansion of local government budgets, and there is a tend-ency either not to tax or to undervalue undeveloped mineral wealth.
social and institutional structure, extent and rateof growth of demand for public services, localplanning capabilities and management skills, andpolitical attitudes.
In the long run, local governments should ben-efit from expanded tax bases arising from the cap-
ital intensity of energy facilities and the establish-ment of associated economic activity. In the ag-gregate, sufficient additional tax revenue shouldbe produced to pay for the upgrading and expan-sion of public facilities and services as requiredfor the growing population.29
In the short run,however, raising local revenues under conditionsof rapid growth is often made difficult becauseof the unequal distribution of incurred costs andrevenue-generating capacity among different lev-els of government.
For example, energy development activities aretypically sited outside municipal boundaries, withthe result that revenues go to the county, schooldistrict, and/or State. However, the populationgrowth accompanying this energy development,and hence the need for services, typically occurswithin cities and towns that do not receive addi-tional revenues from the new industry. The sepa-ration between taxing authority and public serv-ice responsibility can also occur across State lines.In addition, the availability of local tax revenuescan lag behind the need for services, because in-dustrial taxes are often based on assessed prop-erty values and are not received until full plant
operation. * Note also that the total tax burdenon the mineral industry and the proportion ofState taxes distributed to localities vary from Stateto State.
There is no clear consensus on the cost of pro-viding additional new public facilities and servicesin communities affected by energy development.The economics of the decision to expand froman existing service base, or to build a new town,will depend on such factors as the availability ofland, accessibility to employment, extent and
ZgManagement of Fue/ and Nonfuel Minerals in Federal Lands,OTA-M-88 (Washington, D. C.: U.S. Congress, Office of TechrrcdogyAssessment, April 1979).
*Note that mobile homes generate little, if any, property taxes;and local governments have had difficulty in providing services tosuch sites.
98-281 0 - 82 - 16 : QL 3

8/14/2019 Increased Automobile Fuel Efficiency and Synthetic Fuels: Alternatives for Reducing Oil Imports
http://slidepdf.com/reader/full/increased-automobile-fuel-efficiency-and-synthetic-fuels-alternatives-for 234/292
232 . Increased Automobile Fuel Efficiency and Synthetic Fuels: Alternatives for Reducing Oil Imports
Synfuels development will require the creation of new communities in sparsely populated areas

8/14/2019 Increased Automobile Fuel Efficiency and Synthetic Fuels: Alternatives for Reducing Oil Imports
http://slidepdf.com/reader/full/increased-automobile-fuel-efficiency-and-synthetic-fuels-alternatives-for 235/292
Ch. 9—Social Effects and Impacts q 233
recovery or other funding/revenue mechanismshave been applied.
Health care is particularly vulnerable to over-loading from rapid growth because rural commu-nities often have inadequate health services priorto development and experience difficulties in at-
tracting and retaining physicians. Synfuels devel-opment will change the health care needs of localcommunities because of the influx of young fam-ilies, the increase in sources of social stress, andnew occupational environments that will give riseto special health care needs. Hospital facilitiesas well as health, mental health, and social serv-ices will be required. Educational facilities are alsolikely to be overloaded. Both Eastern coal com-munities and Western oil shale communities arepresently having difficulty in attracting and retain-ing personnel and in funding the provision andexpansion of facilities and programs,
Public sector dislocations caused by synfuelsdevelopment on Indian lands could be more se-vere than on other rural areas. Tribes have limitedability to generate revenues, there will be largecultural differences between tribal members andworkers who immigrate to an area to work ona project, and land has religious significance tosome tribes and individual landownership is com-monly prohibited (so that, for example, conven-tional patterns of housing development may notbe possible).
Most reservations are also sparsely populated,with few towns, and public services and facilitiesare severely inadequate and overburdened. Sig-nificant amounts of coal are owned by Indiansin New Mexico and Arizona, lesser amounts inMontana, North and South Dakota, and Colo-
rado. Although in the aggregate current coalleases represent only a fraction of the total coalunder lease, Indian leases are important becauseof their size and coherence. About 8 percent ofthe oil-shale mineral rights in the Uinta Basin areowned by Indians, but most of the associateddeposits are of low grade.32
Managing Growth
Unmanaged growth, although not well under-stood, appears nevertheless to be a leadingsource of conflict and stress associated with ener-gy development. All involved parties-the Feder-al, State, and local governments; industry; andthe public—have an interest in and are contribut-ing in varying degrees to growth management byproviding planning, technical, and financial assist-ance to communities experiencing the effects of
synfuels development. These mechanisms, whichvary among States in terms of their scope, detail,and development, are discussed in detail in previ-ous OTA reports.
333435 I n general, the effective-
ness of existing mechanisms has yet to be testedin the face of rapid and sustained industrial ex-pansion. Major issues to be resolved include whowill bear the costs of and responsibilities for bothanticipating and managing social impacts, andhow up-front capital will be made available whenneeded to finance public services.
32u .s. Geological survey, Synthetic Fuels Development, Earth-
Science Considerations, 1979.JJAn Assessment of Oil Shale Technologies, Op. cit.
JaManagernent of Fue/ and Nonfuel Minerals in Federal Lands,
op. cit.M The Direct Use of coal: Prospects and Problems of Production
and Combustion, OTA-E-86 (Washington, D. C.: U.S. Congress, Of-fice of Technology Assessment, April 1979).

8/14/2019 Increased Automobile Fuel Efficiency and Synthetic Fuels: Alternatives for Reducing Oil Imports
http://slidepdf.com/reader/full/increased-automobile-fuel-efficiency-and-synthetic-fuels-alternatives-for 236/292
Chapter 10
Environment, Health, and SafetyEffects and Impacts

8/14/2019 Increased Automobile Fuel Efficiency and Synthetic Fuels: Alternatives for Reducing Oil Imports
http://slidepdf.com/reader/full/increased-automobile-fuel-efficiency-and-synthetic-fuels-alternatives-for 237/292
Contents
Page
Introduction . . . . . . . . . . . . . . . . . . . . . . . . 237
Auto Fuel Conservation. . . . . . . . . . . . . . . 237Motor Vehicle Safety . . . . . . . . . . . . . . . 237Mining and Processing New Materials . 243
Air Quality . . . . . . . . . . . . . . . . . . . . . . . 244
Electric Vehicles. . . . . . . . . . . . . . . . . . . . . 245Power Generation . . . . . . . . . . . . . . . . . 245Resource Requirements . . . . . . . . . . . . . 246Noise . . . . . . . . . . . . . . . . . . . . . . . . . . . . 247Safety . . . . . . . . . . . . . . . . . . . . . . . . . . . . 247Occupational and Public Concerns . . . 247
Synthetic Fuels From Coal . . . . . . . . . . . . 248Mining . . . . . . . . . . . . . . . . . . . . . . . . . . . 250Liquefaction . . . . . . . . . . . . . . . . . . . . . . 253Conventional Impacts . . . . . . . . . . . . . . . 253Environmental Management . . . . . . . . . 261Transport and Use . . . . . . . . . . . . . . . . . 264
Oil Shale . . . . . . . . . . . . . . . . . . . . . . . . . . . 266
Biomass Fuels . . . . . . . . . . . . . . . . . . . . . . . 268Obtaining the Resource . . . . . . . . . . . . . 268Conversion . . . . . . . . . . . . . . . . . . . . . . . 269
Appendix 10A. —Detailed Descriptionsof Waste Streams, Residuals ofConcern, and Proposed ControlSystems for Generic indirect andDirect Coal Liquefaction Systems . . . 271
TABLES
Table No. Page
71 . Material Substitutions for VehicleWeight Reductions . . . . . . . . . . . . . . . 243
72.
73.
74.
75.
76.
77.
78.
79.
Emissions Characteristics ofPage
Alternative Engines . . . . . . . . . . . . . . . 245Increase in U.S. Use of Key Materialsfor 20 Percent Electrification of
Light-Duty Travel . . . . . . . . . . . . . . . . . 247Major Environmental Issues forCoal Synfuels . . . . . . . . . . . . . . . . . . . . 249Fatality and Injury Occurrencefor Selected Industries, 1979 . . . . . . . 252Two Comparisons of theEnvironmental impacts of Coal-BasedSynfuels Production and Coal-FiredElectric Generation . . . . . . . . . . . . . . . 257Potential Occupational Exposuresin Coal Gasification . . . . . . . . . . . . . . . 258Occupational Health Effects ofConstituents of indirect Liquefaction
Process Streams . . . . . . . . . . . . . . . . . . 259Reported Known Differences inChemical, Combustion, and HealthEffects Characteristics of SynfuelsProducts and Their PetroleumAnalogs . . . . . . . . . . . . . . . . . . . . . . . . . 265
FIGURES
Figure No. Page
22.
23.
Passenger-Car Occupant Deathper 10,000 Registered Cars by Car
Size and Crash Type; Cars 1 to 5Years Old in Calendar Year 1980 . . . 238Size Ranges of New Coal-FiredPowerplants With Hourly EmissionsEqual to 50,000 bbl/day SynfuelsPlants . . . . . . . . . . . . . . . . . . . . . . . . . . 254

8/14/2019 Increased Automobile Fuel Efficiency and Synthetic Fuels: Alternatives for Reducing Oil Imports
http://slidepdf.com/reader/full/increased-automobile-fuel-efficiency-and-synthetic-fuels-alternatives-for 238/292

8/14/2019 Increased Automobile Fuel Efficiency and Synthetic Fuels: Alternatives for Reducing Oil Imports
http://slidepdf.com/reader/full/increased-automobile-fuel-efficiency-and-synthetic-fuels-alternatives-for 239/292
238 • Increased Automobile Fuel Efficiency and Synthetic Fuels: Alternatives for Reducing Oil Imports
Iy estimated that a continuing shift to smallervehicles could result in an additional 10,000 traf-fic deaths per year (with total annual road fatal-ities of 70,000) by 1990 unless compensatingmeasures are taken.
In light of these concerns, OTA examined avail-
able evidence on the relationship between vehi-cle size and occupant safety in today’s auto fleet,and reviewed some attempts—including theNHTSA estimate—to extrapolate this evidence toa future, downsized fleet.
Occupant Safety and VehicleSize in Today% Fleet
Much of the current concern about the safetyof small cars is based on statistical analysis of na-tional data from the Fatal Accident Reporting Sys-tem (FARS), which contains information on fatalmotor vehicle accidents occurring in the United
States. For example, an analysis of FARS data onautomobile occupant deaths conducted by theInsurance Institute for Highway Safety (IIHS) (fig.22) shows that deaths per registered vehicle in-crease substantially as vehicle size (measured bylength of wheelbase) decreases.4 Furthermore,this trend occurs for both single- and multiple-
3National Highway Traffic Safety Administration, Traft7c SafetyTrends and Forecasts, DOT-HS-805-998, October 1981.Zlnsurance Institute for Highway Safety, Status Report, vol. 17,
No. 1, Jan. 5, 1982.
Photo credit: National Highway Traffic Safety Administration
Crash tests sponsored by the National Highway Traffic SafetyAdministration are an important source of information for
understanding the mechanics of crashes andevaluating auto safety features
vehicle crashes. The trend is so strong that theannual occupant deaths per registered small sub-compact are more than twice as high as the ratefor full-size cars–3.5 per 10,000 cars comparedwith 1.6 per 10,000.
The relationships illustrated in figure 22 tempt
one to conclude that small cars are much less safethan large cars in virtually all situations. For a vari-ety of reasons, however, the information in thefigure must be interpreted with care. First, the re-cent crash tests sponsored by NHTSA
5(new cars
were crashed head-on into a fixed barrier at 35miles per hour) seemed to indicate that the differ-
5The crash tests are described in several references. A useful, clear
reference is “Which Cars Do Best in Crashes?” in the Apdl 1981issue of Consumer Reports. Also see M. Brownlee, et al., “implica-
tions of the New Car Assessment Program for Small Car Safety, ”in proceedings of the Eighth International Technical Conferenceon Experimental Safety Vehicles, Wolfsburg, Germany, Oct. 21-24, 1980, NHTSA report.
Figure 22.—Passenger-Car Occupant Death per10,000 Registered Cars by Car Size and Crash Type:
Cars 1 to 5 Years Old in Calendar Year 1980-
2
1
0Subcompact Intermediate
Small Compact Full-sizesubcompact
SOURCE: Insurance Institute for Highway Safety.

8/14/2019 Increased Automobile Fuel Efficiency and Synthetic Fuels: Alternatives for Reducing Oil Imports
http://slidepdf.com/reader/full/increased-automobile-fuel-efficiency-and-synthetic-fuels-alternatives-for 240/292
Ch. 10—Environment, Health, and Safety Effects and Impacts q 239
ences in expected occupant injuries between ve-hicles in the same size class–i.e., differencescaused by factors other than size—can be greaterthan any differences between the size classes. im-
portantly, the results imply that relatively minorchanges in engineering and design, such as inex-pensive improvements in the steering columnand changes in the seatbelt mechanisms, can pro-duce improvements in vehicle crashworthinessthat may overwhelm some of the differencescaused by size alone. The results of the tests canbe applied only to occupants wearing seatbelts(11 percent of total occupants), however, andonly to new cars in collisions with fixed objects.
Another reason to be cautious is that the IIHSanalysis may be overlooking the effect of variablesother than car size. For example, the age of driv-ers and occupants is a critical determinant of fatal-ity rates. Younger drivers tend to get into more
serious accidents,7 and younger occupants areless likely than older ones to be killed or seriouslyinjured in otherwise identical crashes.8 Becausethe average age of drivers and occupants is notuniform across car size classes—it is believed thatsmaller cars tend to have younger drivers andoccupants—the observed differences in fatalityrates may be functions not only of the physicalcharacteristics of the cars but also of differencesin the people in those cars.
Other variables that should be considered ininterpreting injury and fatality statistics include
safety belt usage (drivers of subcompact cars havebeen reported to use seatbelts at a significantlyhigher rate than drivers of intermediate and largecars9), the average number of occupants per car,and differences in maneuverability and brakingcapacity (i. e., crash avoidance capability) be-tween big and small cars. *
‘R. H. Stephenson and M. M. Finkelstein, “U.S. GovernmentStatus Report,” in proceedings of the Eighth International TechnicalConference on Experimental Safety Vehicles, op. cit.
7H. M. Bunch, “smaller Cars and Safety: The Effect of Downsiz-ing on Crash Fatalities in 1995, ” HSRI Research Review (Universityof Michigan), vol. 9, No. 3, November-December 1978.elbid.
%tephenson and Finkelstein, op. cit.*The effect of improved crash avoidance capability and other
safety factors may be perverse. To the extent that drivers may takemore chances in reaction to their perception of increased safety,they can negate the effectiveness of safety improvements. The tend-ency of drivers of large cars to use seatbelts at a lower rate thandrivers of small cars may be an indicator of such a reaction.
Several analyses have tried to account for theeffect of some of these variables.10 However,these analyses use different data bases (e.g., Statedata such as that available from North Carolina,and other national data bases such as the Nation-al Accident Sampling System and the NationalCrash Severity Study), different measures of vehi-
cle size (wheelbase, the Environmental Protec-tion Agency (EPA) interior volume, weight, etc.),different formulations of safety (e.g., deaths per100,000 registered vehicles, deaths per vehicle-mile driven, deaths per crash), and in additiontheir data reflect different time frames. Few anal-yses correct for the same variables. Consequently,it is extremely difficult to compare these analysesand draw general conclusions.
Also, credible data on total accident rates forall classes of cars, and more detailed data on ac-cident severity, are not widely available. This type
of data would allow researchers to distinguish be-tween the effects of differences in crashworthi-ness and differences in accident avoidance capa-bility in causing the variations in fatalities meas-ured in the FARS data base. For example, studiesof accident rates in North Carolina indicate thatsubcompacts are involved in many more acci-dents than large cars.11 Consequently, the rela-tionship between fatalities per registered vehicleand car size, and that between fatalities per crash
and car size could be significantly different forthis data set, with the latter relationship indicatingless dependence between safety and vehicle sizethan appears to be the case in the former. Unfor-tunately, such data are available only in a few
jurisdictions and cannot be used to draw nation-wide conclusions.
Finally, the existing data base reflects only cur-rent experience with small cars. In particular, thedata reflect no experience with the class of ex-tremely small sub-subcompacts that currently aresold in Japan and Europe but not in the UnitedStates. it is conceivable that widespread introduc-tion of such cars into the U.S. fleet, triggered by
ICIA variety of these are described in j. R. Stewart and J. C. Stutts,“A Categorical Analysis of the Relationship Between Vehicle Weightand Driver Injury in Automobile Accidents, ” NHTSA reportDOT-HS-4-O0897, May 1978.llj. R. Stewart and C. L. Carroll, “Annual Mileage Comparisons
and Accident and Injury Rates by Make, Model, ” University ofNorth Carolina Highway Safety Research Center.

8/14/2019 Increased Automobile Fuel Efficiency and Synthetic Fuels: Alternatives for Reducing Oil Imports
http://slidepdf.com/reader/full/increased-automobile-fuel-efficiency-and-synthetic-fuels-alternatives-for 241/292

8/14/2019 Increased Automobile Fuel Efficiency and Synthetic Fuels: Alternatives for Reducing Oil Imports
http://slidepdf.com/reader/full/increased-automobile-fuel-efficiency-and-synthetic-fuels-alternatives-for 242/292
Ch. 10—Enviromnent, Health, and Safety Effects and Impacts • 241
Because of the weaknesses in available quanti-tative projections of future fatality rates, OTA ex-amined current injury/fatality data and othersources for further evidence of whether or r-totdownsizing and a mix shift to smaller size classeswould have a significant effect on safety. In par-ticular, the following observations are importantto answering this question:
1.
2.
A safety differential between occupants ofsmall and large cars in multiple-car collisionsdoes not necessarily imply that reducing thesize of all cars will result in more deaths inthis class of accidents. Although availabledata clearly imply that reducing a vehicle’ssize will tend to increase the vulnerabilityof that vehicle’s occupants in a car-to-carcollision, the size reduction also will makethe vehicle less dangerous to the vehicle itcollides with. Under some formulations ofaccident exposure and fatality risk, these twofactors may cancel each other out. For ex-ample, Volkswagen has calculated the effectof increasing the proportion of subcompactsin today’s fleet. Using FARS data and fore-casting assumptions that are well within theplausible range, Volkswagen concluded thatan increase in subcompacts would actuallylead to a decrease in traffic fatalities in car-to-car collisions.21 Other models using differ-ent formulations and data bases might cometo different conclusions. For example, mod-els using traffic safety data from NorthCarolina probably would arrive at a differentresult. In this historical data set, subcompactscolliding with subcompacts have been foundto have a considerably greater probability ofcausing a fatality than collisions between twofull-size cars.22 Presumably, models usingthis data set would be likely to forecast thata trend toward more subcompacts wouldlead to an increase in car-to-car crash fatal-ities.If small cars are less safe than large cars insingle-car accidents, then a decrease in the
average size of cars in the fleet with no com-
21 Dreyer, et al., Op. Cit.2*K. Digges, “Panel Member Statement,” Panel on ESV/RSV Pro-
gram, in proceedings of the Eighth International Technical Confer-ence on Experimental Safety Vehicles, op. cit.
pensatory improvements in crashworthinessclearly should imply an increase in injuriesand fatalities in this class of accidents. As justdiscussed, some studies suggest that a con-sistent relationship between size and safetydoes not exist for compact, midsize, and full-
size cars in single-car accidents.
23
On theother hand, subcompacts do fare worse thanthe other classes in these studies. 24 Conse-quently, if these studies are correct, a generaldownsizing of the fleet might have only asmall effect on fatalities in single-car acci-dents, while a drastic shift to very small carscould cause a large increase in such fatalities.
The results of these studies may not bewidely applicable. Other studies observe adefinite size/safety relationship across all sizeclasses.
25And some factors tend to favor this
alternative conclusion. For example, the
higher seatbelt usage in smaller cars shouldtend to make small cars appear safer in theraw injury data, and thus tend to hide orweaken a positive size/safety relationship.Taking differences in seatbelt usage into ac-count might expose or strengthen such a re-lationship.26 Also, analysis of FARS data thatincludes only vehicles up to 5 years old pro-duces a stronger size/safety relationship thananalysis of the whole fleet.
27Most studies use
the whole fleet, but the more limited dataset might prove to be better for a projectionof the future because it reflects only newer-
design automobiles. Finally, as discussed inchapter 5, the larger crush space and passen-
ger compartment volume available to thelarger cars should give them, at least theoret-ically, a strong advantage in the great major-ity of accidents. On the other hand, an op-posing factor favoring those studies show-ing less dependence between vehicle sizeand crashworthiness is the limited evidenceof increasing accident rates with decreasingcar sizes. 28 This offers a reason other than
ZJStewa~ and Stutts, op. cit.Wbid.25Supra 14,
ZGstephenSOn arid Finkelstein, Op . Cl t ,
27 Based on a comparison of II HS’S analysis, op. cit., and Engel’s
analysis, op. cit.za’jtewa~ and Carroll, op. `cit.

8/14/2019 Increased Automobile Fuel Efficiency and Synthetic Fuels: Alternatives for Reducing Oil Imports
http://slidepdf.com/reader/full/increased-automobile-fuel-efficiency-and-synthetic-fuels-alternatives-for 243/292
242 . Increased Automobile Fuel Efficiency and Synthetic Fuels: Alternatives for Reducing Oil Imports
3.
4.
(or in addition to) differences in crashworthi-ness for the differences in fatalities amongthe various auto size classes.Although most arguments about downsizingand traffic safety have focused on vehicle oc-cupants, the inclusion of pedestrian fatalitieswill affect the overall argument. About 8,000
pedestrians were killed by motor vehicles in1980,29 and analysis of FARS data indicatesthat pedestrian fatalities per 100,000 regis-tered cars increase as car size increases
30 —
i.e., reducing the average size of cars in thefleet might decrease pedestrian fatalities be-cause of the reduced “aggressiveness” ofsmaller cars towards pedestrians. If policyconcern is for total fatalities, this effectshould lessen any overall adverse safety ef-fect of downsizing the fleet.Much of the available data implies that traf-fic fatalities will rise if the number of colli-sions between vehicles of greatly differentweights increases. This points to three dan-gers from a downsized fleet. First, for a Iim-ited period of time, the number of collisionsof this sort might increase because of thelarge number of older, full-size cars left inthe fleet. This problem should disappearwithin a decade or two when the great ma-
jority of these older cars will have beenscrapped. Second, a more permanent in-crease in fatalities could occur if large num-bers of very small sub-subcompacts–cars
not currently sold in the U.S. market—wereadded to the passenger vehicles fleet. Thepotential for successful large-scale sales ofsuch vehicles will depend on their prices—they may be significantly less expensive thancurrent subcompacts—as well as future oilprices and public perceptions of gasolineavailability. Third, car-truck collisions, whichtoday represent a significant fraction of occu-pant fatalities (car-to-other-vehicle accidentsaccount for about 25 percent of total occu-pant fatalities31), may cause more fatalitiesunless the truck fleet is downsized as well.
Subcompacts fare particularly poorly in car-
29 NWSA, Fatal Accident Reporting System 1980.
JoBased on an analysis of data presented in Engel, OP. cit.31 NHTSA, op. cit.
truck collisions, and a large increase in thenumber of vehicles in this size class couldcreate substantial problems.
The available statistical and physical evidenceon auto safety suggest that a marked decrease inthe average vehicle size in the automobile fleet
may have as a plausible outcome an increase invehicle-occupant fatalities of a few thousand peryear or more. This outcome seems especially like-ly during the period when many older, heaviervehicles are still on the road. Also, such an out-come seems more likely if the reduction in aver-age size comes mainly from a large increase inthe number of very small cars in the fleet, ratherthan from a more general downsizing across thevarious size categories in the fleet.
The evidence is sufficiently ambiguous,however, to leave open the possibility that onlya minor effect might occur. And, as discussed in
the next section, improvements in the safetydesign of new small vehicles (possibly excludingvery small sub-subcompacts) probably couldcompensate for some or all of the adverse safetyeffect associated with smaller size alone. Someautomobile analysts feel that significant safety im-provements are virtually inevitable, even withoutadditional Government pressures. For example,representatives of Japanese automobile com-panies have stated32 that the present poor recordof Japanese cars in comparison with Americansmall cars is unacceptable and will not be al-
lowed to continue. Major improvements in Japa-nese auto safety would seem likely to force aresponse from the American companies. Also,General Motors has begun to advertise the safe-ty differentials between its cars and Japanesemodels, an indication that American manufac-turers may have decided that safety can sell. Onthe other hand, because of its severe financial dif-ficulties, the industry may be reluctant to pursuesafety improvements that involve considerablecapital expenditures.
Safer Design
Increases in traffic injuries and fatalities neednot occur as the vehicle fleet is made smaller in
JzRepOrted in the April 1981 Con sum er Reporfs, OP. cit.
IJlbid., and IIHS, op. cit.

8/14/2019 Increased Automobile Fuel Efficiency and Synthetic Fuels: Alternatives for Reducing Oil Imports
http://slidepdf.com/reader/full/increased-automobile-fuel-efficiency-and-synthetic-fuels-alternatives-for 244/292
Ch. 10—Enviromnent, Health, and Safety Effects and Impacts Ž 243
size. Numerous design opportunities exist to im-prove vehicle safety, and some relatively simplemeasures could go a long way towards compen-sating for adverse effects of downsizing and shiftsto smaller size classes.
Increased use of occupant restraint systems
would substantially reduce injuries and fatalities.NHTSA analysis indicates that the use of air bagsand automatic belts could reduce the risk of mod-erate and serious injuries and fatalities by about30 to 50 percent. 34
Simple design changes in vehicles may substan-tially improve occupant protection. As noted inevaluations of NHTSA crash tests, design changesthat are essentially cost-free (changing the loca-tion of restraint system attachment) or extreme-ly low cost (steering column improvements to fa-cilitate collapse, seatbelt retractor modifications
to prevent excessive forward movement)
35
appearto be capable of radically decreasing the crashforces on passenger-car occupants.
A variety of further design modifications to im-prove vehicle safety are available. As demon-strated in the NHTSA tests,36 there are substan-tial safety differences among existing cars of equalweight. One important feature of the safer cars,for example, is above-average length of exteriorstructure to provide crush space. Also, the Re-search Safety Vehicle Program sponsored by theDepartment of Transportation shows that smallvehicles with safety features such as air bags, spe-cial energy-absorbing structural members, anti lac-eration windshields, improved bumpers, doorsdesigned to stay shut in accidents, and other fea-tures can provide crash protection considerablysuperior to that provided by much larger cars.
Two forms of new automotive technology in-troduced for reasons of fuel economy could alsohave important effects on vehicle safety. First, theincorporation of new lightweight, high-strengthmaterials may offer the automobile designer newpossibilities for increasing the crashworthiness of
MR . ). Hitchcock and C. E. Nash, “Protection of Children andAdults in Crashes of Cars With Automatic Restraints, “ in Eighth inter-
national Technical Conference on Experimental Safety Vehicles,op. cit.jSBrownlee, et al., Op. cit.3blbid.
the vehicle. Because some of the plastics andcomposite materials currently have problems re-sisting certain kinds of transient stresses, however,their use conceivably could degrade vehicle safe-ty unless safety remains a primary considerationin the design process. Second, the use of elec-tronic microprocessors and sensors, which is ex-pected to become universal by 1985 to 1990 tocontrol engine operation and related drivetrainfunctions, could eventually lead to safety devicesdesigned to avoid collisions or to augment driverperformance in hazardous situations.
Modifications to roadways can also play a sig-nificant role in improving the safety of smaller ve-hicles. For example, concrete barriers and road-way posts and lamps designed to protect largervehicles have proven to be hazards to subcom-pacts
37in single-vehicle crashes, and redesign and
replacement of this equipment could lower future
injury and fatality rates.
Mining and Processing New Materials
Aside from the beneficial effects of downsizingon the environmental impacts of mining—by re-ducing the volume of material required–vehicledesigners will use new materials to reduce weightor to increase vehicle safety. Table 71 shows fourcandidates for increased structural use in automo-biles and the amount of weight saved for every100 lb of steel being replaced.
It appears unlikely that widespread use of thesematerials would lead to severe adverse impacts.Magnesium, for example, is obtained mostly fromseawater, and the process probably has fewerpollution problems than an equivalent amountof iron and steel processing, Most new aluminum
3711HS, op. cit.
Table 71 .—Material Substitutionsfor Vehicle Weight Reductions
Weight saved/100 lbStructural material steel replaced
Magnesium . . . . . . . . . . . . . . . . . . . . . . 75Fiberglass-reinforced composites. . . 35-50Aluminum . . . . . . . . . . . . . . . . . . . . . . . 50-60High-strength low-alloy steel . . . . . . . 15-30SOURCE: M. C. Flemming and G. B. Kenney, “Materials Substitution and
Development for the Light-Weight, Energy-Efficient Automobile,” OTAcontractor report, February 1980
8/14/2019 Increased Automobile Fuel Efficiency and Synthetic Fuels: Alternatives for Reducing Oil Imports
http://slidepdf.com/reader/full/increased-automobile-fuel-efficiency-and-synthetic-fuels-alternatives-for 245/292

8/14/2019 Increased Automobile Fuel Efficiency and Synthetic Fuels: Alternatives for Reducing Oil Imports
http://slidepdf.com/reader/full/increased-automobile-fuel-efficiency-and-synthetic-fuels-alternatives-for 246/292
Ch. 10—Environment, Health, and Safety Effects and Impacts q 245
Table 72 briefly describes some of the emissionscharacteristic of current and new engines forlight-duty vehicles. The potential emission prob-lem with diesels appears to be the major short-term problem facing auto manufacturers todayin meeting vehicle emission standards. There ap-pears to be substantial doubt that diesels cancomply with both NO X and particulates standardswithout some technological breakthrough, be-cause NO X control, already a problem in diesels,conflicts with particulate control. This problemis especially significant because diesel particulateare small enough to be inhaled into the lungs andcontain quantities of potentially harmful organiccompounds.
The effect on human health of a substantial in-crease in diesel particulate emissions is uncertain,because clear epidemiologic evidence of adverseeffects does not exist and because there is doubt
about the extent to which the harmful organicsin the emissions will become biologically avail-able—i.e., free to act on human tissue *—afterinhalation.39 However, a sharp increase in thenumber of diesel automobiles to perhaps 25 per-
*Initially, the organics adhere to particulate matter in the exhaust.In order for them to be harmful, they must first be freed from thismatter. In tissue tests outside the human body (“in vitro” tests),they were not freed, i.e., they did not become biologically active.This may be a poor indicator of their activity inside the body,however.JgHealth Effects Panel of the Diesel Impacts Study Committee
(H. E. Griffin, et al.), National Research Council, /-/ea/th .Effects ofExposure to Diesel Exhaust, National Academy of Sciences, Wash-
ington, D. C., 1980.
Table 72.—Emissions Characteristicsof Alternative Engines
Current spark ignition. — Meets currently defined 1983 stand-ards.
Current (indirect injection) diesel.—Can meet CO and HCstandards, but NO X remains a problem. NO X control con-flicts with HC and particulate control. Future particulatestandards could be a severe problem.
Direct-injection diesel. —Meets strictest standards proposedfor HC and CO. NO X limit 1 to 2 g/mile depending on vehi-cle and engine size. Possible future problems with particu-Iates, odor, and perhaps other currently unregulatedemissions.
Direct-injection stratified-charge.— Needs conventionalspark-ignition engine emission control technology to meetstrict HC/CO/NO x standards. Better NO X control thandiesel. In some versions particulate likely to be problem.
Gas turbine-free shaft.—Attainment of 0.4 g/mile NO X limita continuing problem, appears solvable, maybe withvariable geometry. Other emissions (HC, CO) no problem,
Sing/e shaft. —Same basic characteristics as comparable freeshaft. Better fuel economy may help lower NO X emissions.
Sing/e shaft (advanced). – N OX emissions aggravatedbecause of higher operating temperatures.
Stirling engine (first generation).—Early designs have hadsome NO X problems, but should meet tightest proposedstandards on gasoline, durability probably no problem,emissions when run on other fuels not known.
SOURCE: Adapted from: J. B. Heywood, “Alternative Automotive Engines andFuels: A Status Review and Discussion of R&D Issues,” contractorreport to OTA, November 1979.
cent of the market share, which appears possi-ble by the mid-1990’s, probably should be con-sidered to represent a significant risk of adversehealth effects unless improved particulate con-trols are incorporated or unless further researchprovides firmer evidence that diesel particulate
produce no special hazard to human health.
ELECTRIC VEHICLES
The substitution of electric vehicles (EVs) fora high percentage of U.S. automobiles and lighttrucks may have a number of environmental ef-fects. The reduction in vehicle-miles traveled byconventional gasoline- and diesel-powered vehi-cles will reduce automotive air pollution, whereasthe additional requirements for electricity will in-
crease emissions and other impacts of power gen-eration. Changes in materials use may have envi-ronmental consequences in both the extractiveand vehicle manufacturing industries. The use oflarge numbers of batteries containing toxic chem-icals may affect driver and public health and safe-
ty. The different noise characteristics of electricand internal combustion engines imply a reduc-tion in urban noise levels, while differences insize and performance may adversely affect driv-ing safety. Finally, there may be a variety of lessereffects, for example, safety hazards caused by in-stallation and use of large numbers of charging
outlets.
Power Generation
As discussed in chapter S, utilities should haveadequate reserve capacitv to accommodate high
8/14/2019 Increased Automobile Fuel Efficiency and Synthetic Fuels: Alternatives for Reducing Oil Imports
http://slidepdf.com/reader/full/increased-automobile-fuel-efficiency-and-synthetic-fuels-alternatives-for 247/292
246 q Increased Automobile Fuel Efficiency and Synthetic Fuels: Alternatives for Reducing Oil /reports
levels of vehicle electrification without addingnew powerplants. For example, if the utilitiescould use load control and reduced offpeakprices to confine battery recharging to offpeakhours, half of all light-duty vehicular traffic couldbe electrified today without adding new capac-ity. Given the probable constraints on EVs, how-ever, a 20-percent share probably is a more rea-sonable target for analysis. *
The effects on emissions of a 20-percent electri-fication of vehicular travel are mixed but generallypositive. If present schedules for automotive pol-lution control are met and utilities successfullyrestrict most recharging to offpeak hours, this lev-el of electrification would, by the year 2010, leadto the following changes in emissions** com-pared with a future based on a conventional fossilfuel-powered transportation system:
less than a l-percent increase in sulfur diox-ides (SO2),about a 2-percent decrease in NOX,about a 2-percent decrease in HC,about a 6-percent decrease in CO, andlittle change in particulates.40
The positive effects on air quality may in real-ity be more important than these emission figuresimply. The addition of emissions due to electricityproduction occurs outside of urban areas, andthe pollution is widely dispersed, while the vehi-cle emissions that are eliminated occur at groundlevel and are quite likely to take place in denseurban areas. Thus, the reduction in vehicularemissions should have a considerably greater ef-fect on human exposure to pollution than thesmall increase in generation-related emissions.Also, any relaxation of auto emissions standardswill increase the emissions reductions and airquality benefits associated with “replacement”of the (more polluting) conventional autos. Onthe other hand, future improvements in automo-bile emission controls–certainly plausible given
*As noted elsewhere, however, this is still an extremely optimisticmarket share even for the long term, unless battery costs are sharply
reduced and longevity increased, or gasoline availability decreases.**Assuming existing emission regulations for powerplants.40W. M. Carriere, et al., The Future Potentia/of E/ectric and Hybrid
Vehic/es, contractor report by General Research Corp. to OTA,forthcoming.
progress during the past decade–might decreasethe air quality benefits of electrification. *
Other effects of increased electricity demandmust also be considered. Most importantly, a 20-percent electrification of cars will lead to substan-tial increases in utility fuel use, especially for coal.
Although the extent of increased coal use will de-pend on the distribution of EVs, if the vehicleswere distributed uniformly according to popula-tion, coal would supply about two-thirds of theadditional power necessary in 2010,41 requiringthe mining of about 38 million additional tons peryear. ** If the EVs replaced gasoline-powered carsgetting 55 mpg, the gasoline savings obtained bythe coal-fired electricity—about 36 billion gal/yr– could also have been obtained by turning thesame amount of coal into synthetic gasoline.***
Resource Requirements
EVs will use many of the same materials, in sim-ilar quantities, as conventionally powered vehi-cles, but there will be some differences whichmay create environmental effects. EVs, for exampie, will require more structural material thantheir conventional counterparts because of thesubstantial weight of the batteries (at least withexisting technology). More importantly, the bat-teries themselves will require some materials inquantities that may strain present supply. Table73 shows the increase in U.S. demand for bat-tery materials for 20-percent electrification of
light-duty vehicular travel by 2000.The effect on the environment of increases in
materials demand is difficult to project becausethe increased demand can be accommodated ina number of ways. In several cases, although U.S.
“It is equally reasonable to speculate about future improvementsin powerplant emission controls. For example, more stringent con-trols on new pIants as well as efforts to decrease SOZ emissions from
existing plants in order to control acid rain damages could increasethe benefits of electrification.
41 Ibid.
**Assumptions: 12,000 Btu/lb coal; vehicle energy required =
0.4 kWh/mile at the outlet; total 2010 vehicle miles = 1.55 trillionmiles, 20 percent electric; electrical distribution efficiency = 90percent; generation efficiency = 34 percent.
***Assuming a synfuels conversion efficiency of coal into gasolineof 50 percent.

8/14/2019 Increased Automobile Fuel Efficiency and Synthetic Fuels: Alternatives for Reducing Oil Imports
http://slidepdf.com/reader/full/increased-automobile-fuel-efficiency-and-synthetic-fuels-alternatives-for 248/292
Ch. 10—Enviroment, Health, and Safety Effects and Impacts . 247
Table 73.—increase in U.S. Use of Key Materialsfor 20 Percent Electrification of Light-Duty
Travel (year 2000)
PercentBattery type Material increase a
Lead-acid . . . . . . . . . . . . . . . . . . . . . . LeadNickel-iron . . . . . . . . . . . . . . . . . . . . . Cobalt
LithiumNickel
Nickel-zinc . . . . . . . . . . . . . . . . . . . . . CobaltNickel
Zinc-chloride . . . . . . . . . . . . . . . . . . . GraphiteLithium metal sulfide . . . . . . . . . . . . Lithium
31.218.214.321.331.834.350.0
103.6aAssuming l(Jopercent of the batteries are of the category shown ... the parcent
increases thus are rrot additive for the same materials.
SOURCE: W. M. Carrier, et al,, The Future Potential of Electric and HybridVehicles, contractor report to OTA by General Research Corp., forth-coming.
and world identified reserves currently are insuf-ficient, increased demand probably will be metby identifying and exploiting new reserves. Theenvironmental effects would then be those of ex-
panding mining and processing in the UnitedStates or abroad. In other cases, mining of sea-bed mineral nodules or exploitation of lowerquality or alternative ores (e.g., kaolin-type claysinstead of bauxite to produce aluminum) couldoccur. Supplies of some materials may be madeavailable for cars by substituting other materialsfor nonautomotive demands.
In general, the potential for finding additionalresources and the long-range potential for recy-cling indicate that major strains on resources—and, consequently, environmental impacts of un-usual concern—appear to be unlikely with levelsof electrification around 20 or 30 percent. Localareas subject to substantially increased mining ac-tivity could, however, experience significant im-pacts.
Noise
EVs are generally expected to be quieter thancombustion-engine vehicles, and electrificationshould lower urban noise. The effect may not,however, be large. Although automobiles ac-count for more than 90 percent of all urban traf-fic, they contribute only a little more than halfof total urban traffic noise and a lesser percent-age of total urban noise. A recent calculation ofthe effect on noise levels of 100-percent conver-sion of the automobile fleet to electric vehicles
predicts a reduction in total traffic noise of only13 to 17 percent.42
Safety
EVs will affect automotive safety because oftheir lower performance capabilities and different
structural and material configuration. Lower ac-celeration and cruising speed, for example, couldpose a safety problem because it could increasethe average velocity differential among highwayvehicles and make merging more difficult. ManyEVs will be quite small and, as discussed in thesection on auto fuel conservation, this may de-grade safety. On the other hand, compensatingchanges in driver behavior or redesign of roadsin response to EVs could yield a net positiveeffect.
Similarly, the net effect of materials differencesis uncertain. The strong positive effect of remov-ing a gas tank containing highly flammable gaso-line or diesel fuel will be somewhat offset by theaddition of the battery packs, which containacids, chlorine, and other potentially hazardouschemicals. Collisions involving EVs may result inthe generation of toxic or explosive gases or thespillage of toxic liquids (e.g., release of nickel car-bonyl from nickel-based batteries). Finally, thenecessity to charge many of the vehicles in loca-tions that are exposed to the weather creates astrong concern about consumer safety from elec-trical shock.
Occupational and PublicHealth Concerns
In addition to the potential danger to drivers(and bystanders) from release of battery chemi-cals after collisions, there are some concernsabout the effects of routine manufacture, use, anddisposal of the batteries. Manufacture of nickel-based batteries, for example, may pose problemsfor women workers because several nickel com-pounds that may be encountered in the manufac-turing process are teratogens (producers of birth
defects). Also, because many potential batterymaterials (lead, nickel, zinc, antimony) are per-
4ZW M. Carriere, General Research Corp., perSOnal communica-tion, June 19, 1981.
98-281 0 - 82 - 17 : QL 3

8/14/2019 Increased Automobile Fuel Efficiency and Synthetic Fuels: Alternatives for Reducing Oil Imports
http://slidepdf.com/reader/full/increased-automobile-fuel-efficiency-and-synthetic-fuels-alternatives-for 249/292
248 . Increased Automobile Fuel Efficiency and Synthetic Fuel Alternatives for Reducing Oil Imports
sistent, cumulative environmental poisons, theprevention of significant discharges during manu-facture as well as proper disposal (preferably byrecycling) must be assured. Finally, routine vent-ing of gases during normal vehicle operationsmay cause air-quality problems in congestedareas.
These risks do not appear to pose difficult tech-nological problems (most have been rated as“low risk” in the Department of Energy’s (DOE)Environmental Readiness Document for EVS
43)
and existing regulations such as the ResourceConservation and Recovery Act provide an op-portunity for strict controls, but institutional prob-lems such as resistance to further Governmentcontrols on industry obviously could increase thelevel of risk. Recycling could pose a particularproblem unless regulations or scale incentives re-
strict small-scale operations, which are often diffi-cult to monitor and regulate.
43u.s. Department Of Energy, Etw;mmnental Readiness fkKwment, Electric and Hybrid Vehicles, Commercialization Phase III
P/arming DOE/ERD-0004, September 1978.
SYNTHETIC FUELS FROM COAL
Development of a synthetic fuels industry willinevitably create the possibility of substantial ef-fects on human health and the environment froma variety of causes. A 2 million barrels per day(MMB/D) coal-based synthetic liquid fuels indus-try will consume roughly 400 million tons of coaleach year, * an amount equal to roughly half ofthe coal mined in the United States in 1980. Theseveral dozen liquefaction plants required to pro-duce this amount of fuel will operate like largechemical factories and refineries, handling multi-ple process and waste streams containing highlytoxic materials and requiring major inputs of
water and other valuable materials and labor.Transportation and distribution of the manufac-tured fuels not only require major new infrastruc-ture but are complicated by possible new dangersin handling and using the fuels. Table 74 listssome of the major environmental concerns asso-ciated with coal-based synfuels. Note that theseverity of these concerns is sharp/y dependenton the level of environmental control and man-agement exerted by Government and industry.
*This corresponds to an average process efficiency of about 55percent and coal heat content of about 20 x 10 6 Btu/ton. The ac-tual tonnage depends on the energy content of the coals, the con-version processes used and the product mixes chosen. Process effi-ciencies will vary over a range of 45 to 65 percent (higher if largequantities of synthetic natural gas are acceptable in the productstream), and coal heat contents may vary from 12 million to 28million Btu/ton.
The health and environmental effects of thesynfuels fuel cycle can be better understood bydividing the impacts into two kinds. Some of theimpacts are essentially identical in kind (thoughnot in extent) to those associated with more con-ventional combustion-related fuel cycles such ascoal-fired electric power generation. These “con-ventional” impacts include the mining impacts,most of the conversion plant construction im-pacts, the effects associated with population in-creases, the water consumption, and any impactsassociated with the emissions of environmentalresiduals such as SO2 and NOX that are normal-
ly associated with conventional combustion offossil fuels.
Another set of impacts more closely resemblessome of the impacts of chemical plants and oilrefineries. These include the effects of fugitive HCemissions and the large number of waste andprocess streams containing quantities of tracemetals, dangerous aromatic HCs, and other tox-ic compounds. These are referred to as “noncon-ventional” impacts in this section.
This distinction between “conventional” and“nonconventional" impacts is continued
throughout this discussion. In particular, for theconventional impacts, synfuels plants are explicit-ly compared with coal-fired powerplants. A fur-ther understanding of the scale of coal-fired pow-erplants should allow this comparison to better

8/14/2019 Increased Automobile Fuel Efficiency and Synthetic Fuels: Alternatives for Reducing Oil Imports
http://slidepdf.com/reader/full/increased-automobile-fuel-efficiency-and-synthetic-fuels-alternatives-for 250/292

8/14/2019 Increased Automobile Fuel Efficiency and Synthetic Fuels: Alternatives for Reducing Oil Imports
http://slidepdf.com/reader/full/increased-automobile-fuel-efficiency-and-synthetic-fuels-alternatives-for 251/292

8/14/2019 Increased Automobile Fuel Efficiency and Synthetic Fuels: Alternatives for Reducing Oil Imports
http://slidepdf.com/reader/full/increased-automobile-fuel-efficiency-and-synthetic-fuels-alternatives-for 252/292
Ch. 10—Environment, Health, and Safety Effects and Impacts • 251
vulnerable areas—arid lands and alluvial valleyfloors in the West, prime farmland in the Mid-west, and hardwood forests, steep slope areas,and flood-prone basins in Appalachia. Althoughmost of these areas are afforded special protec-tion under SMCRA, the extent of any damage willdepend on the adequacy of the regulations andthe stringency of their enforcement. Recent at-tempts in the Congress to change SMCRA andadministration actions to reduce the Office of Sur-face Mining’s field staff and to transfer enforce-ment responsibilities to State agencies have raisedconcerns about the future effectiveness of this leg-islation.
Acid Mine Drainage.Acid mine drainage, if not
controlled, is a particularly severe byproduct ofmining in those regions—Appalachia and partsof the interior mining region (indiana, Illinois,Western Kentucky) —where the coal seams arerich in pyrite. The acid, and heavy metals leached
into the drainage water by the acid, are directlytoxic to aquatic life and can render water unfitfor domestic and industrial use. Zinc, nickel, and
other metals found in the drainage can becomeconcentrated in the food chain and cause chronicdamage to higher animals. An additional impactin severe cases is the smothering of stream bot-tom-dwelling organisms by precipitated iron salts.
Acid drainage is likely to be a significant prob-lem only with underground mines, and only afterthese mines cease operating. Assuming strong en-forcement of SMCRA, acid drainage from activesurface and underground mines should be col-lected and neutralized with few problems. onlya very small percentage of inactive surface mines
may suffer from acid seepage. Undergroundmines, however, are extremely difficult to seal
off from air and water, the causal agents of aciddrainage. Some mining situations do not allowadequate permanent control once active mining

8/14/2019 Increased Automobile Fuel Efficiency and Synthetic Fuels: Alternatives for Reducing Oil Imports
http://slidepdf.com/reader/full/increased-automobile-fuel-efficiency-and-synthetic-fuels-alternatives-for 253/292
252 Increased Automobile Fuel Efficiency and Synthetic Fuels: Alternatives for Reducing Oil Imports
and water treatment cease. A significant percent-age of the mines that are active at present or thatwill be opened in this century will present aciddrainage problems on closure.
In a balancing of costs and benefits, it may notbe appropriate to assign to synfuels development
the full acid damage associated with synfuelsmines, even though these mines will have aciddrainage problems. This is because drainageproblems may taper off as shallower reserves areexhausted and new mines begin to exploit coalseams that are deeper than the water table. Manyof these later mines will be flooded, reducing theoxidation that creates the acid drainage. It ispossible that many or most acid drainage-pronemines dedicated to a synfuels plant would havebeen exploited with or without synfuels develop-ment.
Subsidence.–Another impact of underground
mining that will not be fully controlled is subsi-dence of the land above the mine workings. Sub-sidence can severely damage roads, water andgas lines, and buildings; change natural drainagepatterns and river flows; and disrupt aquifers. Un-fortunately, there are no credible estimates ofpotential subsidence damage from future under-ground mining. However, a 2 MMB/D industrycould undermine about a hundred square milesof land area (about one-tenth the area of RhodeIsland) each year, * most of which would be apotential victim of eventual subsidence.
Subsidence, like acid drainage, is a long-termproblem. However, SMCRA does not hold devel-opers responsible for sufficient time periods toensure elimination of the problem, nor does itspecifically hold the developer responsible to thesurface owner for subsidence damage. The major“control” for subsidence is to leave a large partof the coal resources—up to 50 percent or more —in place to act as a roof support. There is obvi-ously a conflict between subsidence preventionand removal of the maximum amount of coal.Moreover, the supports can erode and the roofcollapse over a long period of time. The resulting
intermittent subsidence can destroy the value ofthe land for development. An alternative mining
*Assuming half of the coal is produced by eastern and centralunderground mining, 18,000 acres undermined per 10 15 Btu of coal.
technique called Iongwall mining deals with someof these problems by actually promoting subsi-dence, but in a swifter and more uniform fashion.Longwall mining is widely practiced in Europebut is in limited use in the United States. It is notsuitable for all situations.
Aquifer Disruption.–Although all types ofmining have the potential to severely affectground water quantity and quality by physical dis-ruption of aquifers and by leaching or seepageinto them, this problem is imperfectly under-stood. The shift of production to the West, whereground water is a particularly critical resource,will focus increased attention on this impact. Aswith other sensitive areas, SMCRA affords specialprotection to ground water resources, but theadequacy of this protection is uncertain becauseof difficulties in monitoring damages and enforc-ing regulations and by gaps in the knowledge of
aquifer/mining interactions,Occupational Hazards.–Occupational haz-
ards associated with mining are a very visible con-cern of synfuels production, because coal work-ers are likely to continue to suffer from occupa-tional disease, injury, and death at a rate wellabove other occupations (see table 75), and thetotal magnitude of these impacts will grow alongwith the growth in coal production.
The mineworker health issue that has receivedthe most attention is black lung disease, the non-
Table 75.—Fatality and Injury Occurrencefor Selected Industries, 1979
Fatalities Nonfatal injuriesNumber Rate a Number Rate a
Undergroundbituminous. . . . . . . 105 0.09 14,131 12.30
Surface bituminous . 15 0.02 2,333 3.47All bituminous coal c
(and lignite) . . . . . . . 137 0.064 16,464 10,20Other surface mining b
(metal, nonmetal,stone, etc.). . . . . . . . 97 0.07 8,121 5.82
Petroleum refining c . . 20 0.0011 8,799 5.30Chemical and allied
products c . . . . . . . . . 55 0.0025 78,700 7.20All industries . . . . . . .
4,950 0.0086 5,956,000 9.20aRate per 200,000 worker-howa (100 workef-yeara).bFor all companies.CFOr companies with 11 or more workers; fatallty data Include deaths due to job-related accident and Illness.
SOURCE: Bureau of Labor Statlstlcs, personal communication, 19S1; and Staff,Mine Safety end Health Administration, personal communlcatlon, 19S1.

8/14/2019 Increased Automobile Fuel Efficiency and Synthetic Fuels: Alternatives for Reducing Oil Imports
http://slidepdf.com/reader/full/increased-automobile-fuel-efficiency-and-synthetic-fuels-alternatives-for 254/292
Ch. 10—Environment, Health, and Safety Effects and Impacts q 253
clinical name for a variety of respiratory illnessesaffecting underground miners of which coalworkers’ pneumoconiosis (CWP) is the mostprominent. Ten percent or more of working coalminers today show X-ray evidence of CWP, andperhaps twice that number show other black lungillnesses—including bronchitis, emphysema, andother impairments. so
To prevent CWP from disabling miners in thefuture, Congress mandated a 2-mg/m3 standardfor respirable dust (the small particles that causepneumoconiosis). However, critics now questionthe inherent safeness of this standard and thesoundness of the research on which it is based.Furthermore, other coal mine dust constituents—the large dust particles (that affect the upper res-piratory tract) and trace elements–as well asfumes from diesel equipment also represent con-tinued potential hazards to miners.
Mine safety–as distinct from mine health–hasshown a mixed record of improvement since the1969 Federal Coal Mine Health and Safety Actestablishing the Mining Enforcement and SafetyAdministration was passed. The frequency ofmining fatalities has decreased for both surfaceand underground mines, but no consistent im-provement has been seen in the frequency of dis-abling injuries, Coal worker fatalities numbered139 in 1977, and disabling injuries approached15,000.51 Each disabling injury resulted in an aver-age of 2 months or more of lost time. The number
of disabling injuries has been increasing as moreworkers are drawn to mining and accident fre-quency remains constant.
As shown in table 75, surface mining is severaltimes safer than underground mining. But someunderground mines show safety records equal toor better than some surface mines. Generally,western surface mines are safer than eastern sur-face mines. As western surface-mine productionassumes increasing prominence, accident fre-quency industrywide is likely to decline when ex-
SONational I r-rstitute for Occupational Safety and Health, NationalStudy of Coa/ Workers’ F%eurnoconiosis, unpublished reports onsecond round of examinations, 1975. Cited in The Direct Use ofCoal op. cit.StMine !jafety and Health Administration, “1 njury Experience at
All coal Mines in the United States, by General Work Location,1977, ” 1978. Cited in The Direct Use of Coa[ op. cit.
pressed as accidents per ton of output. But thisstatistical trend may conceal a lack of improve-ment in safety in deep mines.
Liquefaction
Coal liquefaction plants transform a solid fuel,
high in polluting compounds and mineral mat-ter, into liquid fuels containing low levels of sul-fur, nitrogen, trace elements, and other pollut-ants. In these processes, large volumes of gas-eous, liquid, and solid process streams must becontinuously and reliably handled and separatedinto end-products and waste streams. Simultane-ously, large quantities of fuel must be burned toprovide necessary heat and steam to the process,and large amounts of water are consumed forcooling and, in direct liquefaction processes, asraw material for hydrogen production. Theseprocesses, coupled with the general physicalpresence of the plants and their use of a largeconstruction (up to 7,000 men at the peak for asingle 50,000 bbl/d plant) and operating force (upto 1,000 workers per plant), lead to a variety ofpotential pathways for environmental damage.
As noted previously, the following discussiondivides impacts into “conventional” and “non-conventional” according to the extent to whichthe effects resemble those of conventional com-bustion systems. The discussion does not consid-er the various waste streams in detail because oftheir complexity. Appendix 10-A lists the gaseous,
liquid, and solid waste streams, the residuals ofconcern, and the proposed control systems forgeneric indirect and direct liquefaction systems.DOE’s Energy Technologies and the Environmenthandbook, 52 from which appendix 1O-A is de-rived, describes these streams in more detail.
Conventional Impacts
An examination of the expected “convention-al” impacts reveals that, with a few exceptions,they are significant mainly because the individualplants are very large and national synfuels devel-
opment conceivably could grow very rapidly—
5ZU. S. Depafirnent of Energy, Energy Technologies and the Envi-ronment, Enviromnenta/ Information Handbook DOE/EV/74010-l,December 1980.

8/14/2019 Increased Automobile Fuel Efficiency and Synthetic Fuels: Alternatives for Reducing Oil Imports
http://slidepdf.com/reader/full/increased-automobile-fuel-efficiency-and-synthetic-fuels-alternatives-for 255/292
254 q Increased Automobile Fuel Efficiency and Synthetic Fuels: Alternatives for Reducing Oil Imports
not because the impacts per unit of productionare particularly large.
Air Quality.– Emissions of criteria air pollut-ants* from synfuels generally are expected to belower than similar emissions from a new coal-fired powerplant processing the same amount of
coal.53
A 50,000 bbl/d synfuels plant processesabout as much coal as a 3,000 MWe power-plant,** but (as shown in fig. 23) emits SO2 andNOX in quantities similar to those of a plant of onlya few hundred megawatts or less. For particulate,synfuels plant emissions may range as high asthose from a 2,200-MWe plant, but emissions formost synfuels plants should be much lower.
In any case, particulate standards for new plantsare quite stringent, so even a 2,200-MWe plant(or a “worst case” synfuels plant) will not havehigh particulate emissions. CO emissions fromsynfuels plants are expected to be extremely low,
and are likely to be overwhelmed by a varietyof other sources such as urban concentrations ofautomobiles. HC emissions, on the other hand,conceivably could create a problem if fugitiveemissions—from valves, gaskets, and sources oth-er than smokestacks—are not carefully con-trolled. Although the level of fugitive HC emis-sions is highly uncertain, emissions from a 50,000bbl/d SRC II plant could be as high as 14 tons/ day–equivalent to the emissions from severallarge coal-fired plants–if the plant’s valves andother equipment leaked at the same rate as
equipment in existing refineries.
54
The broad emission ranges shown in figure 23reflect very substantial differences in emissionprojections from developers of the various proc-
*“Criteria air pollutants” are pollutants that are explicitly regulatedby National Ambient Air Quality Standards under the Clean Air Act.Currently, there are seven criteria pollutants: SOl, CO, NO,, pho-tochemical oxidants measured as ozone (Oj), nonmethane HC, andlead.53M. A. Chaflock, et al., Environment/ /sSues of Synthetic
Transportation Fue/s From Coa& Background Report, University ofOklahoma Science and Public Policy Program, report to OTA,forthcoming.
**The actual range is about 2,500 to 3,600 MW for synfuels proc-
ess efficiencies of 45 to 65 percent, powerplant efficiency of 35 per-cent, synfuels load factor of 0.9, powerplant load factor of 0.7.Sdoak Estimate of Fugitive Hydrocar-
bon Emissions for SRC II Demonstration P/ant, for U.S. Departmentof Energy, September 1980. Based on “unmitigated” fugitiveemissions.
Figure 23.-Size Ranges of New Coal-FiredPowerplants With Hourly Emissions Equal to
50,000 bbl/day Synfuels Plants
2200
2000
600
400 -
200 -
Sox NO X Particulate
SOURCE: M. A. Chartock, et al., “Environment Issues of Synthetic Tranporta-tlon Fuels From Coal,” contractor report to OTA, table revieed by OTA.
esses. OTA’s examination of the basis for theseprojections leads us to believe that the differencesare due less to any inherent differences amongthe technologies and more to differences in de-veloper control decisions, assumptions about theeffectiveness of controls, and coal characteristics.The current absence of definitive environmen-tal standards for synfuels plants will tend to aggra-vate these differences in emission projections,because developers have no emissions targets orapproved control devices to aim at. EPA has been
working on a series of Pollution Control GuidanceDocuments (PCGDs) for the several synfuels tech-nologies in order to alleviate this problem. Theproposed PCGDs will describe the control sys-tems available for each waste stream and the level

8/14/2019 Increased Automobile Fuel Efficiency and Synthetic Fuels: Alternatives for Reducing Oil Imports
http://slidepdf.com/reader/full/increased-automobile-fuel-efficiency-and-synthetic-fuels-alternatives-for 256/292
Ch. 10—Enviroment, Health, and Safety Effects and Impacts q 255
of control judged to be attainable. However, thePCGDs became embroiled in internal and in-teragency arguments and apparently may not becompleted and published in the foreseeablefuture.
The air quality effects of synfuels plants on their
surrounding terrain vary because of differencesin local conditions—terrain and meteorology—as well as the considerable range of possible emis-sion rates. Some tentative generalizations can,however, be drawn from the variety of site-specif-ic analyses available in the literature. One impor-tant conclusion from these analyses is that indi-
vidual plants generally should be able to meetprevention of significant deterioration (PSD) Class
II limits* for particulate and SO2 with plannedemission controls, although in some cases (e.g.,the SRC II commercial-scale facility once plannedfor West Virginia) a major portion of the limitcould be used up.55 In addition, NOX and COemissions are unlikely to be a problem for indi-vidual pIants in most areas, while regulated HCemissions should remain within ambient air qual-ity guidelines if fugitive HC emissions are mini-mized. 56
Restrictions will exist, however, near PSD ClassI areas in the Rocky Mountain States and nonat-tainment areas in the eastern and interior coalregions. Several of the major coal-producingareas of Kentucky and Tennessee are currentlyin nonattainment status, and siting of synfuels
plants in those areas is virtually impossible with-out changes in current regulations or future airquality improvement.57 Finally, failure to controlfugitive HC emissions conceivably could lead toviolations of the Federal shot-t-term ambientstandards near the plant because, as noted above,the potential emission rate is quite high and
*PSD regulations limit the increases in pollution concentrationsallowed in areas whose air quality exceeds national ambient stand-ards. Class I areas, generally national parks and other areas wherepristine air quality is valued very highly, are allowed only minimalincreases. Class III areas are areas designated for industrial develop-ment and allowed substantial increases. Most parts of the country
presently are designated Class II areas and allowed moderate in-creases in concentrations. PSD limits are under intense scrutiny byCongress and appear to be primary candidates for change underthe Clean Air Act reauthorization.sscha~ock, et al., op. cit.561 bid.571 bid.
because the emissions are released near groundlevel and will have a disproportionately large ef-fect on local air quality .58
Some potential restrictions on siting maybe ob-scured in current analyses by the failure to con-sider the short-term air quality effects of upsets
in the conversion processes. For example, underextreme upset conditions, the proposed (but nowcanceled) Morgantown SRC II plant would haveemitted as much S02 in 2 hours as it would haveemitted during 4 to 10 days of normal opera-tion.59 Unfortunately, most environmental analy-ses of synfuels development have tacitly assumedthat control devices always work properly andpIant operating conditions always are normal.These assumptions may be inappropriate, espe-cially for the first generation of plants and partic-ularly for the first few years of operating experi-ence.
On a wider geographic scale, most analysesshow that the emissions impact of a synfuels in-dustry will be moderate compared with totalemissions from all sources. For example, DOE hasestimated 1995 emissions from all major sourcesfor particulate, SO2, and NOX. Its calculationsshow that a 1.3 MM B/D synfuels industry (com-bining gasification, liquefaction, and oil shale)would represent less than 1 percent of nationalemissions for all three pollutants.60 A more inten-sive development—a 1 MM B/D liquefaction in-dustry concentrated in Wyoming, Montana, and
North Dakota—would represent a 7.7 percent(particulate), 9.8 percent (SO2), 32 percent(Nox), and 1,7 percent (HC) increase over 1975emissions in a region where existing develop-ment—and thus the existing level of emissions—isquite Iow.61 These additional emissions are notinsignificant, and there has been speculation thathigh levels of development could cause someacid rain problems in the West, especially from
Sal. L. white, et al., Energy From the West, Impact Analysis Report
Volume /, /introduction arrd Summary, U.S. Environmental Protec-tion Agency report EPA-600/7-79-082a, March 1979.
59u .s, @partrnent of Energy, Drafi Appendix C of Fjna/ Environ-mental Impact Statement: SRC-11 Demonstration Plant, Plant Designand Characterization of Effluents, 1980.60U.S, Department of Energy, Synthetic Fuels and the Environ-
ment, An Envkonmentaland Regulatory Impacts Analysis, DOE/EV-0087, june 1980.Glchafiock, et al., op. Cit.
8/14/2019 Increased Automobile Fuel Efficiency and Synthetic Fuels: Alternatives for Reducing Oil Imports
http://slidepdf.com/reader/full/increased-automobile-fuel-efficiency-and-synthetic-fuels-alternatives-for 257/292
256 . Increased Automobile Fuel Efficiency and Synthetic Fuels: Alternatives for Reducing Oil Imports
NOX. * Nevertheless, if control systems work asplanned and facility siting is done intelligently,coal-based synfuels plants do not appear to repre-sent a severe threat to air quality.
Water Use. -Water consumption has also beensingled out as a significant impact of a large-scale
synfuels industry, especially in the arid West. Syn-fuels plants are, however, less intensive consum-ers of water than powerplants consuming similaramounts of coal. A 3,000-MWe plant—whichprocesses about as much coal annually as a50,000 bbl/d facility–will consume about 25,000acre-feet of water per year (AFY), whereas thesynfuels facility is unlikely to consume more than10,000 AFY and may consume considerably lessthan this if designed with water conservation inmind. According to current industry estimates,a standard 50,000 bbl/d facility will consumeabout as much water as a 640 to 1,300-MWe
plant. Using stricter water conservation designs,the facility may consume as much water as a 400-to 700-MWe plant.62 Achieving an annual syn-fuels production of 2 MMB/D might require 0.3million AFY, or only about 0.2 percent of the pro-
jected national freshwater consumptive use of151 million AFY in 2000.63
Environmental impacts associated with synfuelswater requirements are caused by the water con-sumption itself and by the wells, pipelines, dams,and other facilities required to divert, store, andtransport the necessary water.
The impacts associated with consumption de-pend on whether that consumption displaces oth-er offstream uses for the water (e.g., the devel-oper may buy a farmer’s water rights) or is addi-tive to existing uses. In the former case, the im-pact is caused by eliminating the offstream use;
*Current understanding of the transformation of NO X emissionsinto nitrates and into acid rain is not sufficient to allow a firm judg-ment to be made about the likelihood of encountering an acid rainproblem under these conditions.6ZH. Gold, et al., Water Requirements for Stearn-~/ectriC power
Generation and Synthetic FuelPlants in the Western United States,U.S. Environmental Protection Agency report EPA-600/7-77-037,
April 1977. Assumes powerplant load factor of 70 percent, synfuelsload factor 90 percent. Synthoil is used as a baseline liquid fuelsplant.63U, S. Water Resources Council, ~ond Nat;ona/ Water Assess-
ment, The Nation’s Water Resources 1975-2MXI, Volume 11,
December 1978.
in displacing farming, for example, the impactmay be a reduction in soil salinization that wasbeing caused by irrigation as well as a reductionin water contamination caused by runoff of fertil-izers and pesticides. Any calculation of impactsis complicated, however, by the probability thatlarge reductions in economic activities (such as
farming) in one area will result in compensatingincreases elsewhere as the market reacts to de-creases in production.
if the water consumption is additive to existinguses, it will reduce downstream flows. In surfacestreams or tributary ground waters connected tothese streams, the consumption may have ad-verse effects on the ability of the stream to dilutewastes and to support recreation, fishing, andother instream uses downstream of the withdraw-al. Also, consumption of ground water, if exces-sive, may lead to land subsidence and saltwater
intrusion into aquifers.The impacts associated with wells, dams, and
other infrastructure may also be significant. im-properly drilled wells, for example, can lead tocontamination of drinking water aquifers. Damsand other storage facilities will increase evapora-tive and other losses (e.g., Lake Powell is under-laid with porous rock and “loses” large amountsof water to deep aquifers). In many cases, thelands submerged by reservoirs have been valu-able recreational or scenic areas. In addition, insome circumstances dams can have substantial
impacts, including drastic changes in the natureof the stream, destruction of fish species, etc. Onthe other hand, the ability of dams to regulatedownstream flow may help avoid both floodingand extreme low-flow conditions and thus im-prove instream uses such as recreation andfishing.
Although consumptive water use by synfuelswill be small on a national basis, local and evenregional effects may be significant. Prediction ofthese effects is made difficult, however, by a num-ber of factors, including substantial uncertainties
in water availability assessments, levels of disag-gregation in many assessments that are insuffi-cient to allow a prediction of local and subregion-al effects, and the variety of alternative supply op-tions available to developers. Water availability
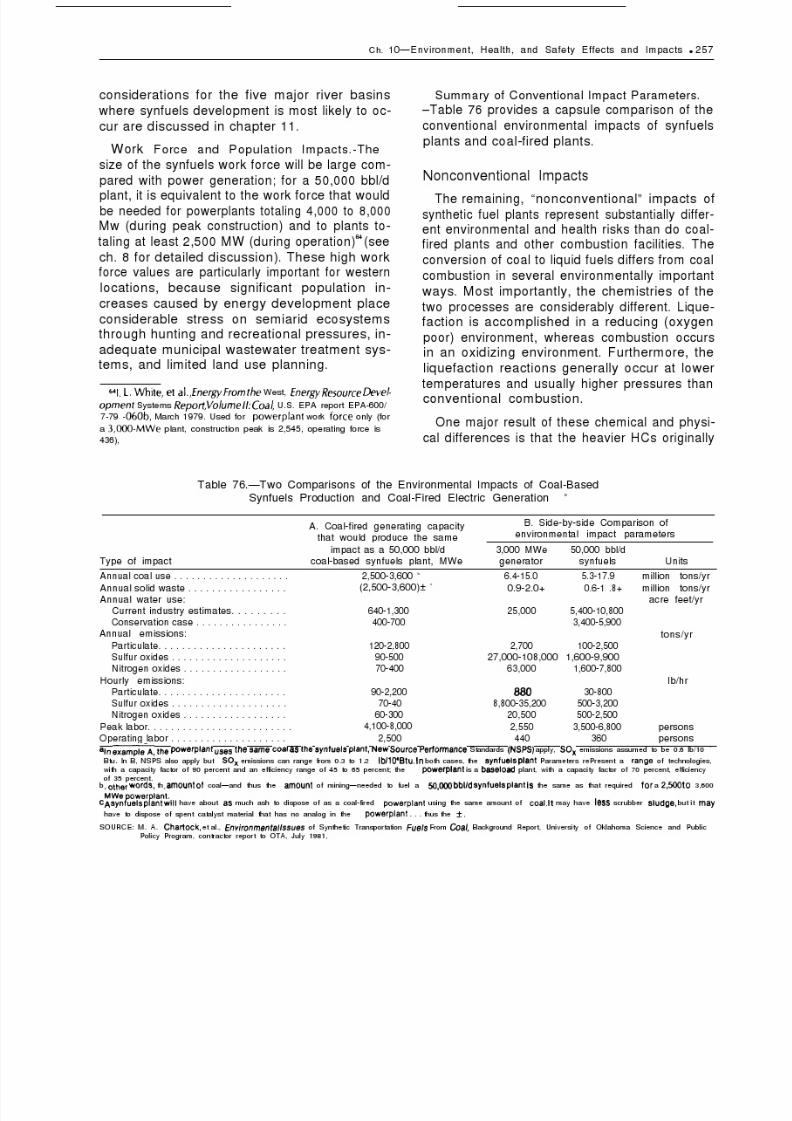
8/14/2019 Increased Automobile Fuel Efficiency and Synthetic Fuels: Alternatives for Reducing Oil Imports
http://slidepdf.com/reader/full/increased-automobile-fuel-efficiency-and-synthetic-fuels-alternatives-for 258/292

8/14/2019 Increased Automobile Fuel Efficiency and Synthetic Fuels: Alternatives for Reducing Oil Imports
http://slidepdf.com/reader/full/increased-automobile-fuel-efficiency-and-synthetic-fuels-alternatives-for 259/292
258 . Increased Automobile Fuel Efficiency and Synthetic Fuels: Alternatives for Reducing Oil Imports
in the coal or formed during the reactions are notbroken down as effectively in the liquefactionprocess as in combustion processes, and thusthey appear in the process and waste streams.The direct processes (see ch. 6 for a brief descrip-
tion of the various coal liquefaction processes)and those indirect processes using the lower tem-perature Lurgi gasifier are the major producersof these HCs; indirect processes using high-tem-perature gasifiers (e.g., Koppers-Totzek, Shell,Texaco) are relatively free of them.
The liquefaction conditions also favor the for-mation of metal carbonyls and hydrogen cyanide,which are hazardous and difficuIt to remove.Trace elements are less likely to totally volatilizeand may be more likely to combine with or dis-solve in the ash. The solids formed under theseconditions will have different mineralogical andchemical form than coal combustion ash, and the
volubility of the trace elements, which generallyis low in combustion ash, is likely to be different.Consequently, solid waste disposal is complicatedby the possibility that the wastes may be morehazardous than those associated with conven-tional combustion.
Finally, the high pressure of the processes, theirmultiplicity of valves and other vulnerable com-ponents, and, for the direct processes, their needto handle liquid streams containing large amountsof abrasive solids all increase the risk of accidentsand fugitive emissions.
The major concerns from the “nonconvention-al” waste streams are occupational hazards fromleaks of toxic materials, accidents, and handlingof process intermediates, and ground and surfacewater contamination (and subsequent health andecological damage) from inadequate solid wastedisposal, effluent discharges, and leaks and spills.
Occupational Hazards.–Coal synthetic fuelplants pose a range of occupational hazards fromboth normal operations and upset conditions.Aside from risks associated with most heavy in-dustry, including exposure to noise, dusts, andheat, and falls from elevated areas, synfuels work-ers will be exposed to gaseous and liquid fugitiveemissions of carcinogenic and other toxic materi-als. During upset conditions, contact with hot gasand liquid streams and exposure to fire and ex-
plosion is possible. Table 77 lists some of the po-tential exposures from coal gasification plantsdocumented by the National Institute for Occu-pational Safety and Health. Table 78 lists thepotential occupational health effects associatedwith the constituents of indirect liquefaction proc-ess streams. Similar exposure and health-effectpotentials would exist for any coal liquefactionprocess.
Although the precise design and operation ofthe individual plant is a critical factor in determin-ing occupational hazards, there are certain gener-ic differences in direct and indirect technologiesthat appear to give indirect technologies someadvantages in controlling health and safety risks.
The advantages of indirect technologies includethe need to separate only gases and liquids (thesolids are eliminated in the very first gasification
step) in contrast with the gas/liquid/solid phaseseparation requirements of direct processes; few-er sites for fugitive emissions than the direct proc-esses; lower processing requirements for theprocess liquids produced (direct process liquidsrequire additional hydrogenation); the abrasive
Table 77.—Potential OccupationalExposures in Coal Gasification
Coal handling, feeding, and preparation.—Coal dust, noise,gaseous toxicants, asphyxia, and fire
Gasifier/reactor operation. —Coal dust, high-pressure hot gas,high-pressure oxygen, high-pressure steam and liquids, fire,
and noiseAsh removal, —Heat stress, high-pressure steam, hot ash, and
dustCatalytic conversion. —High-pressure hot gases and liquids,
fire, catalyst, and heat stressGas/liquids cooling. —High-pressure hot raw gas and liquid
hot tar, hot tar oil, hot gas-liquor, fire, heat stress, and noiseGas purifica tion. —Sulfur-containing gases, methanol,
naphtha, cryogenic temperature, high-pressure steam, andnoise
Methanol formation.—Catalyst dust, fire, and noiseSulfur removal — Hydrogen sulfide, molten sulfur, and sulfur
oxidesGas-liquor separation. —Tar oil, tar, gas-liquor with high con-
centrations of phenols, ammonia, hydrogen cyanide,hydrogen sulfide, carbon dioxide, trace elements, and noise
Phenol and ammonia recovery. -Phenols, ammonia, acid
gases, ammonia recovery solvent, and fireByproduct storage. —Tar, oils, phenols, ammonia, methanol,
phenol recovery solvent and fireSOURCE: Adapted from U.S. Department of Health, Education and Welfare, “Cri-
teria for a Recommended Standard . . . Occupational Exposures In coalGaslficatlon Plants” (Clncinnatl: National Institute of OccupationalSafety and Health, Center for Disease Control, 19S43).

8/14/2019 Increased Automobile Fuel Efficiency and Synthetic Fuels: Alternatives for Reducing Oil Imports
http://slidepdf.com/reader/full/increased-automobile-fuel-efficiency-and-synthetic-fuels-alternatives-for 260/292
Ch. 10—Environment, Health, and Safety Effects and Impacts Ž 259
Table 78.—Occupational Health Effects of Constituents of Indirect Liquefaction Process Streams
Constituents Toxic effects Stream or area
InorganicAmmonia
Carbon disulfide
Carbon monoxide
Carbonyl sulfideHydrogen sulfide
Hydrogen cyanide
Mineral dust and ash
Nickel carbonyl
Trace elements: arsenic, beryllium,cadmium, lead, manganese, mercury,selenium, vanadium
Sulfur oxides
OrganicAliphatic hydrocarbons
Aromatic amines
Single-ring aromatics
Aromatic nitrogen heterocyclics
Phenols
Polycyclic aromatic hydrocarbons (PAH)
Acute: respiratory edema, asphyxia,death
Chronic: no evidence of harm fromchronic subirritant levels
Acute: nausea, vomiting, convulsionsChronic: psychological disturbances,mania with hallucinations
Acute: headache, dizziness, weakness,vomiting, collapse, death
Chronic: low-level chronic effects notestablished
Little data on human toxicityAcute: collapse, coma, and death may
occur within a few seconds.Insidious, may not be detected bysmell
Chronic: possible cocarcinogenAcute: headache, vertigo, nausea,
paralysis, coma, convulsions, deathChronic: fatigue, weaknessChronic: possible vehicle for polycyclic
aromatic hydrocarbons andcocarcinogensAcute: highly toxic, irritation, lung
edemaChronic: carcinogen to lungs and
sinuses(Complex)
Acute: intense irritation of respiratorytract
Chronic: possible cocarcinogen
Most not toxic. N-Dodecane potentatesskin tumors
Acute: cyanosis, methemoglobinemia,vertigo, headache, confusion
Chronic: anemia, skin lesions (aniline)Benzidine and beta-naphthylamine are
powerful carcinogensAcute: irritation, vomiting, convulsionsChronic: bone-marrow depression,
aplasiaAcute: skin and lung irritantsChronic: possible cocarcinogensChronic: possible carcinogens, skin
and lungsChronic: skin carcinogens, possible
respiratory carcinogens
Gas liquor
Concentrated acid gas
Coal-lockhopper vent gasRaw gas from gasifier
Concentrated acid gasCoal-lockhopper vent gasRaw gas from gasifierConcentrated acid gasCatalyst regeneration off-gas
Concentrated acid gasCoal-lockhopper vent gas
Ash or slag
Catalyst regeneration off-gas
Bottom ashFly ashGasifier ashSolid waste disposalCombustion flue gases
Evaporative emissions from productstorage
Coal-lockhopper vent gasGas liquor
Coal-lockhopper vent gasGas liquor
Gas liquorCoal-lockhopper vent gasGas liquor
Gas liquorCoal-lockhopper vent gasRaw gas
SOURCE: US. Department of Energy, Energy Technologies and the Environment. Environmental Information Handbook DOE/EV/74O1O-1, Decemb er 1980.
nature of the direct process stream (which con- streams. Lurgi gasifiers, however, produce atains entrained solids); and fewer dangerous aro- wider range of organic compounds than the high-matic compounds, including polynuclear aromat- er temperature gasifiers and as a result are moreics and aromatic amines, than in direct process comparable in health risk to direct processes.

8/14/2019 Increased Automobile Fuel Efficiency and Synthetic Fuels: Alternatives for Reducing Oil Imports
http://slidepdf.com/reader/full/increased-automobile-fuel-efficiency-and-synthetic-fuels-alternatives-for 261/292
260 • Increased Automobile Fuel Efficiency and Synthetic Fuels: Alternatives for Reducing Oil Imports
In sum, however, the indirect processes appearto have a lower potential for occupational healthand safety problems than the direct processes.In actual practice other factors—such as differ-ences in the selection of control equipment andin plant design, maintenance procedures, andworker training—conceivably could outweighthese differences. In fact, developers of liquefac-tion processes appear to be aware of the poten-tial hazards and are taking preventive action suchas providing special clothing and providing fre-quent medical checkups. Nevertheless, the occu-pational health risk associated with synthetic fuelplants must be considered a major concern.
Ground and Surface Water Contamination.– A portion of the solid waste produced by liquefac-tion plants is ash-bottoms, fly ash, and scrubbersludge from the coal-fired boilers—materials thatare routinely handled in all coal-fired powerplants
today. Much of the waste, however, is ash or slagfrom the gasifiers producing synthesis gas or hy-drogen and chars or “bottoms” from the directprocesses (although much of the latter materialis expected to be recycled to the gasifies), Asnoted previously, this material is produced in areducing atmosphere and thus contains organiccompounds as well as trace elements whose solu-bility may be different from that produced in theboiler.
Other solid wastes that may create disposalproblems more severe than those of powerplant
waste include spent catalysts and sludges fromwater treatment. Total solid wastes from a 50,000bbl/d plant range from 1,800 to 5,000 or moretons per day.
65At these rates, a 2 MM B/D industry
would have to dispose of between 26 million and72 million tons of wastes per year. The major con-cern from these materials is that water percolatingthrough landfill disposal areas may leach the toxicorganic compounds and trace elements out ofthe wastes and into the ground water. Current-ly, the extent of this risk is uncertain, althoughtests of EDS66 and SRC-II67liquefaction reactor
bscha~ock, et al., op. Cit.66R. C. Green, “Environmental Controls for the Exxon Donor SOl-
vent Liquefaction Process, ” Second DOE Environmental ControlSymposium, Reston, Va., Mar. 19, 1981.b7Supra 59.
wastes and gasifier ash from several gasifiersbayielded Ieachates that would not have been ratedas “hazardous” under Resources Conservationand Recovery Act criteria. *
One major problem with permanent landfilldisposal, however, is that damage to ground wa-
ter may occur at any future time when the land-fill liner may be breached–many of the toxic ma-terials in the wastes are either not degradable orwill degrade very slowly, and may last longer thanthe design life of the liner.
Liquid effluent streams from liquefaction plantsalso pose potential water pollution problems. Al-though there are a number of wastewater sourcesthat are essentially conventional in character—cooling tower and boiler blowdown, coal storagepile runoff, etc.—the major effluent streams, fromthe scrubbing of the gases from the gasifiers andfrom the water separation streams in the directprocesses, contain a variety of organics and tracemetals that will pose difficult removal problems.The direct processes are expected to have thedirtiest effluent streams, the indirect systemsbased on Lurgi gasifiers will also pose some prob-lems because of their high production of organics,and the systems based on high-temperature gasi-fiers should have only moderate treatment re-quirements. 69
Although total recycle of water is theoreticallypossible, in practice this is unlikely and “zero dis-charge” will only be achieved by using evapora-
tion ponds. Aside from the obvious danger ofbreakdown of the pond liner and subsequentground water contamination (or overflows fromflooding), evaporation ponds may pose environ-mental problems through the formation of toxicgases or evaporation of volatile liquids. The com-plex mixture of active compounds in such a pondcreates a particular hazard of unforeseen reac-tions occurring.
ba/nside EPA, Sept. 26, 1980. As reported, researchers from TRWand Radian Corps. have tested ash from Lurgi, Wellman-Galusha,and Texaco gasifiers.
*Wastes are rated as “hazardous” and will require more secure(and more expensive) disposal if concentrations of pollutants in theIeachates are greater than 100 times the drinking water standard.‘9H. Gold, et al., “Fuel Conversion and Its Environmental Effects,”
Chemical Engineering Progress, August 1979.

8/14/2019 Increased Automobile Fuel Efficiency and Synthetic Fuels: Alternatives for Reducing Oil Imports
http://slidepdf.com/reader/full/increased-automobile-fuel-efficiency-and-synthetic-fuels-alternatives-for 262/292
Ch. 10—Environment, Health, and Safety Effects and Impacts q 261
Although the use of ponds to achieve zero dis-charge is practical in the West because of the lowrainfall and rapid evaporation rates, zero dis-charge may be impractical at eastern sites with-out artificial evaporation, which is expensive andenergy-intensive. Consequently, it appears prob-
able that continuous or intermittent effluentdischarges will occur at eastern plants, withadded risks from control system failures as oneresuIt.
Environmental Management
The likelihood of these very serious potentialenvironmental and health risks turning into actualimpacts depends on a variety of factors, and par-ticularly on the effectiveness and reliability of theproposed environmental controls for the plants,the effectiveness of environmental regulationsand scientists’ ability to detect damages and as-certain their cause.
In general, synfuels promoters appear to beconfident that the control systems proposed fortheir processes will work effectively and reliably.They tend to view synfuels processes as variationsof current chemical and refinery operations, al-beit variations that will require careful design andhandling. Consequently, the environmental con-trols planned for synthetic fuels plants are large-ly based on present engineering practices in thepetroleum refining, petrochemical, coal-tar proc-essing, and power generation industries.
There are reasons to be concerned about con-trol system effectiveness and reliability, however,especially for the first generation of commercialplants. First, few of the wastewater effluents fromeither direct or indirect processes have been sentthrough a complete environmental control sys-tem such as those designed for commercial units.Process waste streams from several U.S. pilotplants have been subjected only to laboratory andbench-scale cleanup tests or else have been com-bined with waste streams from neighboring refin-eries and treated, with a poorly understood level
of success, in the refinery control systems.Second, scaling up from small-scale operations
is particuIarly difficult for the direct processes,because of the entrainment of solids in the liquidprocess streams. Engineering theory for the scale
up of solids and mixed solids/liquids processesis not well advanced. For the most part, the prob-lem of handling liquid streams containing largeamounts of entrained solids under high-tempera-ture and pressure conditions is outside of currentindustrial experience.
Third, currently available refinery and petro-chemical controls are not designed to capture thefull range of pollutants that will be present in syn-fuels process and waste streams. Several of thetrace elements as well as the polycyclic aromatichydrocarbons (PAHs) are included in this group,although techniques such as hydrocracking areexpected to help eliminate PAHs when they ap-pear in process streams. (As noted previously,problems with the trace organics generally arefocused on the direct and on low-temperatureindirect processes, because high-temperature gas-ifiers should effectively destroy most of these
compounds.)Fourth, in some cases, compounds that gener-
ally are readily controlled when separately en-countered appear in synfuels process and wastestreams in combinations that complicate control.For example, current processes for removing hy-drogen sulfide, carbonyl sulfide, and combusti-bles tend to work against each other when thesecompounds appear in the same gas stream,70 asthey do in synfuels plants. Also, the high levelof toxics that appear in the waste streams maycreate reliability problems for the biological con-trol systems.
Fifth, as noted earlier, the high pressures, multi-plicity of valves and gaskets, and (for the directprocesses) the erosive process streams appear tocreate high risks of fugitive emissions. plans forcontrol of these emissions generally depend on“directed maintenance” programs that stress fre-quent monitoring and inspection of vulnerablecomponents. Although it appears reasonable toexpect that a directed maintenance program cansignificantly reduce fugitive emissions, rigorousspecifications for such a program have not beenpublished,71 and some doubts have been raised
Zocongressional ReSearCh Service, Synfue/s From COa/ and theNational Synfuels Production Program: Technical Environmentaland Economic Aspects, December 1980 (Committee Print 11-74No. 97-3, january 1981, U.S. Congress).
TI u .S . @panrnent of Energy, Fina/ Environrnenta/ /rnpaCt S~ate-
ment: Solvent Refined Coal-n Demonstration Project, Fort Martin,Monongalia County, W, Va., 2 VOIS., 1981.

8/14/2019 Increased Automobile Fuel Efficiency and Synthetic Fuels: Alternatives for Reducing Oil Imports
http://slidepdf.com/reader/full/increased-automobile-fuel-efficiency-and-synthetic-fuels-alternatives-for 263/292
262 . Increased Automobile Fuel Efficiency and Synthetic Fuels: Alternatives for Reducing Oil Imports
about the adequacy of proposed monitoring forpioneer plants.
The significance of these technological con-cerns is uncertain. As noted previously, industryrepresentatives generally have dismissed the con-cerns as unimportant, at least with regard to the
extent to which pollution control needs might becompromised. Government researchers at EPAand DOE
72have expressed some important reser-
vations, however. On the one hand, they are con-fident that each of the synfuels waste streams isamenable to control, usually with approachesthat are not far different from existing approachesto control of refinery and chemical processwastes. On the other hand, they have reserva-tions about whether or not the industry’s con-trol program, as it is currently constituted, willachieve the high levels of control possible. Poten-tial problem areas (some of which are related)
include wastewater treatment, ’J control systemreliability, and pollution control during processupsets.
Virtually all of the Government researchersOTA contacted were concerned that the industryprograms were not addressing currently unregu-lated pollutants but instead were focusing almostexclusively on meeting immediate regulatory re-quirements. Several expressed special concernabout the failure of some developers to exploitall available opportunities to test integrated con-trol systems; they expected these integrated sys-
tems to behave differently from the way the indi-vidual devices behave in tests.
The above concerns, if well founded, imply thatenvironmental control problems could have seri-ous impacts on the operational schedules of thefirst generation of commercial plants. These im-pacts could range from extentions in the normalplant shakedown periods to extensive delays forredesign and retrofit of pollution controls.74 Be-Zzpersonal Communications with headquarters and field person-
nel, EPA and DOE.zJThe draft of EPA’s Pollution Control Guidance Document on
indirect liquefaction also expressed strong concerns about waste-
water treatment. /nside EPA, Sept. 12, 1980, “Indirect Liquids DraftSees Zero Wastewater Discharge, Laments Data Gap.”z4Some of the architectural and engineering firms submitting syn-
fuels plant designs have incorporated certain control system flexibil-
ities as well as extra physical space in their control systems designs.These features presumably would reduce schedule problems.Frederick Witmer, Department of Energy, Washington, D. C., per-sonal communication.
cause of the large capital costs of the plants, therewill likely be severe pressure on regulators tominimize delays and allow full-scale productionto proceed. The outcome of any future conflictsbetween regulatory requirements and plantschedules will depend strongly on the publicpressures exerted on the industry and Federal andState Governments.
There are reasons to believe that a great dealof public interest will be focused on the synfuelsindustry and its potential effects. For one, whenplant upsets do occur, the results can be visual-ly spectacular–for example, purging an SRC-llreactor vessel and flaring its contents can producea flame up to 100 ft wide and 600 ft Iong.75 It alsoseems likely that odor problems will accompanythese first plants, and in fact the sensitivity ofhuman smell may render it impossible to evercompletely eliminate this problem. Malodorous
compounds such as hydrogen sulfide, phenols,organic nitrogen compounds, mercaptans, andother substances that are present in the processand waste streams can be perceived at very lowconcentrations, sometimes below 1 part perbillion.76
In addition, the presence of highly carcinogenicmaterials in the process and waste streams ap-pears likely to sensitize the public to any prob-lems with these plants. This combination of po-tential hazards and perceptual problems, coupledwith the industry strategy of locating at least some
of these plants quite close to populated areas(e.g., SRC-ll near Morgantown, W. Va., now can-celed, and the Tri-State Synthetic Fuels Projectnear Henderson, Ky.), appears likely to guaranteelively public interest.
The nature of the industry’s response to unex-pected environmental problems as well as its gen-eral environmental performance also will dependon the degree of regulatory surveillance and con-trol exerted by Federal and State environmentalagencies. Although the degree of surveillance andcontrol will in turn depend largely on the envi-
ronmental philosophy of the Federal and StateGovernments at various stages in the lifetime ofthe industry-a factor that is unpredictable-it willalso depend on the legal framework of environ-
75Supra 59.
7%upra 58.

8/14/2019 Increased Automobile Fuel Efficiency and Synthetic Fuels: Alternatives for Reducing Oil Imports
http://slidepdf.com/reader/full/increased-automobile-fuel-efficiency-and-synthetic-fuels-alternatives-for 264/292
Ch. 10—Environment, Health, and Safety Effects and Impacts q 263
mental regulations, the scientific groundwork thatis now being laid by the environmental agencies,and the nature of the scientific problems facingthe regulatory system.
Existing Federal environmental legislation givesthe Occupational Safety and Health Administra-
tion (OSHA) and EPA a powerful set of tools fordealing with the potential impacts of synfuels de-velopment. OSHA has the power to set occupa-tional exposure standards and define safety pro-cedures for all identified hazardous chemicals inthe workplace environment. EPA has a wide vari-ety of legal powers to deal with synfuels impacts,including:
q
q
q
q
q
q
q
setting National Emission Standards for Haz-ardous Air Pollutants (N ES HAPS) under theClean Air Act;setting New Source Performance Standards,
also under the Clean Air Act;setting effluent standards for toxic pollutants(which, when ingested, cause “death, dis-ease, cancer, genetic mutations, physiologi-cal malfunctions or physical deformations”)under the Clean Water Act;setting water quality standards, also underthe Clean Water Act;defining acceptable disposal methods forhazardous wastes under the Resource Con-servation and Recovery Act;defining underground injection guidelinesunder the Safe Drinking Water Act; and
a variety of other powers under the men-tioned acts and several others.77
The regulatory machinery gives the Federal en-vironmental agencies a strong potential meansof controlling synfuels plants’ hazardous emis-sions and effluents. In general, however, the ma-chinery is immature. Because there are no operat-ing commercial-scale synthetic fuels plants in theUnited States, EPA has not had the opportunityto collect the data necessary to set any technol-ogy-specific emission and effluent limitations forsynfuels plants. Aside from this inevitable prob-
TTSee table 4.1, synthetic Fue/s and the Environment: An Environ-
ment/ and Regulatory /mpacts Ana/ysis, Office of Technology im-
pacts, U.S. Department of Energy, DOE/EV-0087, june 1980. Also,see ch. 5, The /rnpacts of Synthetic Fue/s Development, D. C.Masselli, and N. L. Dean, jr., National Wildlife Federation, Septem-ber 1981.
Iem, the environmental agencies have not fullyutilized some of their existing opportunities forenvironmental protection. For example, EPA hasallowed its authority to define standards for haz-ardous air pollutants to go virtually unused. Inaddition, in some areas, such as setting effluentguidelines and New Source Performance Stand-
ards for air emissions, EPA has a substantial back-log of existing industries yet to be dealt with.
The environmental research programs con-ducted by various Federal agencies will lay thegroundwork for EPA’s and OSHA’s regulation ofthe synfuels industry. The key programs are thoseof EPA and OSHA themselves and those of DOE.DOE’s programs appear likely to be essentiallyeliminated if current plans to dismantle DOE aresuccessful. EPA and OSHA research budgets haveboth been reduced. In particular, EPA has essen-tially eliminated research activities aimed at de-
veloping control systems for synfuels wastestreams, on the basis that such development isthe appropriate responsibility of industry. As men-tioned before, Federal researchers familiar withthe industry’s current environmental researchprograms perceive that the industry has little in-terest in developing control measures for poten-tial impacts that are not currently regulated, andthey believe that industry is unlikely to expandits programs to compensate for EPA’s reduc-tions.78
With or without budget cuts, EPA and OSHA
face substantial scientific problems in setting ap-propriate standards for hazardous materials fromsynfuels technologies. Probably the worst of theseproblems is that current air pollution and occupa-tional exposure regulations focus on a relativelysmall number of compounds and treat each oneindividually or in well-defined groups, whereassynfuels plants may emit dozens or even hun-dreds of dangerous compounds with an extreme-ly wide range of toxicity (i.e., the threshhold ofharm may range from a few parts per billion toseveral parts per thousand or higher) and a varietyof effects.
The problem is further complicated by the ex-pected wide variations in the amounts and types
78 Supra 72,

8/14/2019 Increased Automobile Fuel Efficiency and Synthetic Fuels: Alternatives for Reducing Oil Imports
http://slidepdf.com/reader/full/increased-automobile-fuel-efficiency-and-synthetic-fuels-alternatives-for 265/292
2641 . Increased Automobile Fuel Efficiency and Synthetic Fuels: Alternatives for Reducing Oil /reports
of pollutants produced. The synfuels wastestreams are dependent on the type of technology,the control systems used, the product mix chosenby the operator (which determines the operatingconditions), and the coal characteristics. The im-plication is that uniform emission and worker ex-posure standards, such as a “pounds per hour”
emission limit on total fugitive HC emissions ora “milligrams per cubic meter” limit on HC ex-posures, are unlikely to be practical because theywould have to be extraordinarily stringent to pro-vide adequate protection against all componentsof the emission streams. Consequently, EPA andOSHA may not be able to avoid the extremelydifficult task of setting multiple separate standardsfor toxic substances.
The regulatory problem represented by the tox-ic discharges is compounded by difficulties in de-tecting damages and tracing their cause. Because
low-level fugitive emissions from process streamsand discharges or leaks from waste disposal oper-ations probably are inevitable, regulatory require-ments on the stringency of mitigation measureswill depend on our knowledge of the effects oflow-level chronic exposures to the chemical com-ponents of these effluents. Aside from the prob-lems of monitoring for the actual presence of pol-lution, problems may arise both from the longlag times associated with some critical potentialdamages (e.g., 5 to 10 years for some skin can-cers, longer for many soft-tissue cancers) andfrom the complex mixture of pollutants that
would be present in any emission.
Transport and Use
As synthetic liquids are distributed and usedthroughout the economy, careful control of expo-sure to hazardous constituents becomes less andless feasible. This is especially true for liquid fuelsbecause of the multitude of small users and thegeneral lack of careful handling that is endemicto the petroleum distribution system. Conse-quently, the toxicity of synfuels final productsmay be critical to the environmental acceptability
of the entire synfuel “fuel cycle.”The pathways of exposure to hazardous sub-
stances associated with synfuels distribution anduse include accidental spills and fugitive emis-
sions from pipelines, trucks, and other transportmodes and storage tanks; skin contact and fumeinhalation by motorists and distributors; and pub-lic worker exposure to waste products associatedwith combustion (including direct emissions andcollected wastes from control systems).
Evaluation of the relative danger of these expo-
sure pathways and comparisons of synfuels totheir petroleum analogs are extremely difficult atthis time. Most environmental and health effectsdata on synfuels apply to process intermediates– “syncrudes”- rather than finished fuels. Combus-tion tests have generally been limited to fuel oilsin boilers rather than gasolines in automobiles. ’gThe tests that have been conducted focus moreon general combustion characteristics than onemissions, and those emission characterizationsthat have been done measure mainly particulateand SOX and NOX rather than the more danger-
ous organics.
80
Adding to the difficulty of deter-mining the relative dangers of synfuels use is aseries of surprising gaps in health effects data onanalogous petroleum products. Apparently, manyof these widely distributed products are assumedto be benign, and monitoring of their effects hasbeen limited.81
Table 79 presents a summary of the known dif-ferences in chemical, combustion, and health ef-fects characteristics of various synfuels productsand their petroleum analogs. The major charac-teristics of coal-derived liquid fuels are:
q The major concern about synthetic fuelsproducts is their potential to cause cancer,mutations, or birth defects in exposed per-sons or wildlife. (Petroleum-based productsalso are hazardous, but usually to a lesserextent than their synfuels counterparts.)82 Ingeneral, the heavier (high boiling point) liq-uids—especially heavy fuel oils—are the mostdangerous, whereas most of the lighter prod-ucts are expected to be relatively free ofthese effects. This distribution of effects maybe considered fortunate because the lighter
T9M. Ghassemi and R. Iyer, Environmental Aspects of SYnfue/Utilization, U.S. Environmental Protection Agency report EPA-600/ 7-81-025, March 1981.~lbid.81 Ibid.
Szlbid.

8/14/2019 Increased Automobile Fuel Efficiency and Synthetic Fuels: Alternatives for Reducing Oil Imports
http://slidepdf.com/reader/full/increased-automobile-fuel-efficiency-and-synthetic-fuels-alternatives-for 266/292
Ch. IO—Environment, Health, and Safety Effects and Impacts • 265
Table 79.—Reported Known Differences in Chemical, Combustion, and Health EffectsCharacteristics of Synfuels Products and Their Petroleum Analogs
Product Chemical characteristics Combustion characteristics Health effects characteristics
Shale 011Crude . . . . . . . . . . . . . . . . . . . . Higher aromatics, FBN, As, Higher emissions of NO x
particulate and (possibly)certain trace elements
Slightly higher NO X andsmoke emissionsSlightly higher NO x and
smoke emissions
More mutagenic, tumorigenic,cytotoxicHg, Mn
Higher aromatics
Higher aromatics
Higher aromatics
Higher aromatics
Higher aromaticsnitrogen
Higher aromaticsnitrogen
and
and
Gasoline . . . . . . . . . . . . . . . . .
Jet fuels . . . . . . . . . . . . . . . . . Eye/skin irritation, skinsensitization same as forpetroleum fuel
Eye/skin irritation, skinsensitization same as forpetroleum fuel
—
Slightly higher NO x andsmoke emissions
DFM . . . . . . . . . . . . . . . . . . . . .
Residuals. . . . . . . . . . . . . . . . .
Direct IiquefactionSyncrude (H-Coal, SRC ll,
EDS) . . . . . . . . . . . . . . . . . . .
SRC II fuel oil . . . . . . . . . . . . . Higher NO X emissions Middle distillates:nonmutagenic; cytotoxicitysimilar to but toxicitygreater than No. 2 dieselfuel; burns skin.
Heavy distillate: considerableskin carcinogenicity,cytotoxicity, mutagenicity,and cell transformation
Severely hydrotreated:nonmutagenic,nontumorigenic; lowcytotoxicity
—
Nonmutagenic, extremely lowtumorigenicity cytotoxicityand fetotoxicity
Non mutagenic
H-Coal fuel oil . . . . . . . . . . . . Higher nitrogen content Higher NO X emissions
EDS fuel oil. . . . . . . . . . . . . . .SRC II naphtha. . . . . . . . . . . .
Higher NO X emissions —Higher nitrogen, aromatics
H-Coal naphtha. . . . . . . . . . . .EDS naphtha. . . . . . . . . . . . . .SRC II gasoline . . . . . . . . . . .H-Coal gasoline . . . . . . . . . . .EDS gasoline . . . . . . . . . . . . .
Indirect liquefact/onFT gasoline . . . . . . . . . . . . . . .FT byproduct chemical . . . . .Mobil-M gasoline. . . . . . . . . .
Higher nitrogen, aromaticsHigher nitrogen, aromaticsHigher aromaticsHigher aromaticsHigher aromatics
Lower aromatics; N and S nil —
(Gross characteristics similarto petroleum gasoline)
—
Noncarcinogenic —N/A
Methanol . . . . . . . . . . . . . . . . .
GasificationSNG . . . . . . . . . . . . . . . . . . . . .
Higher aldehyde emissions Affects optic nerve
Traces of metal carbonylsand higher CO
(Composition varies withcoal type and gasifier
design/operation)
Low/medium-Btu gas. . . . . . . (Emissions of a wide rangeof trace and minorelements and heterocyclicorganics)
—
Nonmutagenic, moderatelycytotoxic
Gasifier tars, oils, phenols . . (Composition varies withcoal and gasifier types;
highly aromatic materials).SOURCE: M. Ghasseml and R. Iyer, Environmental Aspects of Synfuel Utilization, EPA-600/7-81-025, March 1981.

8/14/2019 Increased Automobile Fuel Efficiency and Synthetic Fuels: Alternatives for Reducing Oil Imports
http://slidepdf.com/reader/full/increased-automobile-fuel-efficiency-and-synthetic-fuels-alternatives-for 267/292
266 . Increased Automobile Fuel Efficiency and Synthetic Fuels: Alternatives for Reducing Oil Imports
q
q
products–such as gasoline–are more like-ly to be widely distributed.Products from direct liquefaction processesappear more likely to be cancer hazards thando indirect process products, because of thehigher levels of dangerous organic com-pounds produced in the direct processes.Coal-derived methanol fuel appears to besimilar to the methanol currently being us-ed, although there are potentials for con-tamination that must be carefully examined.Methanol is rated as a “moderate hazard”(“may involve both irreversible and revers-ible changes not severe enough to causedeath or permanent injury’’ )83 under chronic –long-term, low-level–exposure, althoughthe effects of multi-year exposures to verylow levels (as might occur to the public withwidespread use as a fuel) are not known.Methanol has been assigned a hazard rating
for acute exposures similar to that forgasoline,84 but no comparison can be made
BJN. 1. sax, Dangerous properties of Industrial Materials, Fourth
Edition, Van Nostrand Reinhold Co., 1975.BJlbid,
q
for chronic exposures because data forgasoline exposure is inadequate.85 86 Inautomobiles, methanol use increases emis-sions of formaldehyde sufficiently to causeconcern, but lowers emissions of nitrogenoxides and polynuclear aromatics.87 De-pending on the potential health effects of low
levels of formaldehyde, which are not nowsufficiently understood, and the emissioncontrols on automobiles, methanol use inautomobiles conceivably may provide a sig-nificant net pollution benefit to areas suffer-ing from auto-related air pollution problems.Many of the dangerous organics that are thesource of carcinogenic/mutagenic/teratogen-ic properties in synfuels should be control-lable by appropriate hydrotreating. Tradeoffsbetween environmental/health concerns andhydrotreating cost, energy consumption, andeffects on other product characteristics cur-
rently are not known.
OIL SHALE
OaAn Assessment of Oil Shale Technologies, Op. Cit.
851 bid,
BsGhassemi and Iyer, Op. Cit.87Energy From Biological processes, OP. cit.
Production and use of synthetic oil from shaleraises many of the same concerns about limitedwater resources, toxic waste streams and massive
population impacts as coal-derived liquid fuels,but there are sufficient differences to demandseparate analysis and discussion, OTA has recent-ly published an extensive evaluation of oil shale;
88
the discussion here primarily summarizes the keyenvironmental findings of that study.
U.S. deposits of high-quality oil shale (greaterthan 25 gal of oil yield per ton) generally are con-centrated in the Green River formation in north-western Colorado (Piceance Basin) and northeast-ern Utah (Uinta Basin), The geographic concen-tration of these economically viable reserves to
an arid, sparsely populated area with complexterrain and relatively pristine air quality, and theimpossibility of transporting the shale (because
of its extremely low energy density) lead to apotential concentration of impacts that is (at leastin theory) easier to avoid with coal-derived syn-fuels. Thus, compliance with prevention of signifi-cant deterioration regulations for SO2 and particu-Iates may constrain total oil shale developmentto a million barrels per day or less unless currentstandards are changed or better control technol-ogies are developed.
Also, the lack of existing socioeconomic infra-structure implies that environmental impacts as-sociated with general development pressurescould be significant without massive mitigationprograms. Although coal development sharesthese concerns (especially in the West) and has
water and labor requirements as well as air emis-sions that are not dissimilar on a per-plant basis,it is unlikely to be necessary to concentrate coaldevelopment to the same extent as with oil shale.Thus, coal development should have fewer se-

8/14/2019 Increased Automobile Fuel Efficiency and Synthetic Fuels: Alternatives for Reducing Oil Imports
http://slidepdf.com/reader/full/increased-automobile-fuel-efficiency-and-synthetic-fuels-alternatives-for 268/292
Ch. 10—Environment, Health, and Safety Effects and Impacts q 267
vere physical limitations on its total level of devel-opment.
The geographic concentration of oil shale de-velopment should not automatically be inter-preted as environmentally inferior to a more dis-persed pattern of development, however. Al-
though impacts will certainly be more severe inthe developed areas as a resuIt of this concentra-tion, these impacts must be balanced against thesmaller area affected, the resulting pressure onthe developers to improve environmental con-trols to allow higher levels of development, andthe possibility of being able to focus a major mon-itoring and enforcement effort on this develop-ment. Also, the major oil shale areas generallyare not near large population centers, whereasseveral proposed coal conversion plants are with-in a few miles of such centers and may conse-quently pose higher risks to the public.
The volume of the material processed and dis-carded by an oiI shale plant is a significant fac-tor in comparing oil shale with coal-derived fuels.A 50,000 bbl/d oil shale plant using abovegroundretorting (AGR) requires about 30 million tons peryear of raw shale* versus about 6 million to 18million tons of coal (the higher values apply onlyto low-quality Iignites converted in a relativelyinefficient process) for a similarly sized coal lique-faction plant. A modified in-situ (MIS) plant re-quires about the same tonnage of feedstock asdoes the coal plant, Consequently, although the
underground mining of shale thus far has had amuch better worker safety record than coal min-ing, underground mining of coal may be saferthan shale mining for an AGR plant on a “fueloutput” basis, especially when full-scale shalemining begins. Mining for an MIS plant, on theother hand, will be safer than that for the coalplant unless previous shale experience proves tobe misleading.
The very large amount of spent shale representsa difficult disposal problem. An AGR plant mustdispose of about 27 million tons/yr of spent shale,
at least five times as much solid waste as that pro-duced by a similarly sized coal synfuels plant (MISplants may dispose of about 6 million tons/yr ofspent shale, one to three times the disposal re-
assuming 25 gal of oil per ton of shale.
quirements of a coal plant). At this rate, a 1MMB/D industry using AGRs will have to disposeof approximately 10 billion cubic feet of com-pacted shale each year.
This material cannot be fully returned to themines because it has expanded during process-
ing, and it is a difficuIt material to stabilize andsecure from leaching dangerous compounds—cadmium, arsenic, and lead, as well as organicsfrom some retorts (for example TOSCO II andParajo Indirect)—into surface and ground waters.It also may cause a serious fugitive dust problem,especially with processes like TOSCO II that pro-duce a very fine waste. Even with secure disposal,it will fill scenic canyons and represents an esthet-ic and ecosystem loss. Current research on smallplots indicates that short-term (a few decades)stability of spent shale piles appears likely if suf-ficient topsoil is applied, but the long-term stabil-
ity and the self-sustaining character of the vegeta-tion is unknown. For these reasons, solid wastedisposal may be oil shale’s major environmentalconcern.
As with coal liquefaction processes, the “reduc-ing environment” in the retorts produces bothreduced sulfur compounds and dangerous organ-ics that represent a potential occupational hazardfor workers from fugitive emissions and fuel han-dling. Crude shale oil appears to be more muta-genic, carcinogenic, and teratogenic than naturalcrude.
On the other hand, the refined products areless likely to be significantly different in effectfrom their counterparts produced from naturalcrude, and shale syncrude is less carcinogenicor mutagenic than syncrudes from direct coalliquefaction. Although comparisons of relativerisk must necessarily be tentative at this earlystage of development, it appears that the risksfrom these toxic substances–excluding problemswith spent shale—probably are somewhat com-parable to those of the cleanest coal-based lique-faction processes (indirect liquefaction with high-temperature gasifies).
Other oil shale environmental effects of partic-ular concern include:
q The mining of oil shale generates largeamounts of silica dust that is implicated invarious disabling lung diseases in miners.

8/14/2019 Increased Automobile Fuel Efficiency and Synthetic Fuels: Alternatives for Reducing Oil Imports
http://slidepdf.com/reader/full/increased-automobile-fuel-efficiency-and-synthetic-fuels-alternatives-for 269/292
268 . Increased Automobile Fuel Efficiency and Synthetic Fuels: Alternatives for Reducing Oil I m p o r t s
q Aside from the reduced sulfur compoundsand organics, the crude shale oil contains rel-
atively high levels of arsenic, and somewhathigher levels of fuel bound nitrogen thanmost natural crude does. These pollutantsas well as the organics can be reduced in therefining operation.
q In-situ production leaves large quantities ofspent shale underground and thus createsa substantial potential for leaching out tox-ic materials into valuable aquifers. Controlof such leaching has not been demonstrated.
q Although oil shale developers are proposingto use zero discharge of point-source watereffluents, it may be desirable in the futureto treat water and discharge it. The state ofwater pollution control in oil shale develop-ment is essentially the same as in coal-de-rived synfuels, however. Many of the con-trols proposed have not been tested with ac-tual oil shale wastewaters, and none havebeen tested in complete wastewater controlsystems.
BIOMASS
Production of liquid fuels from biomass willhave substantially different impacts from thoseof coal liquefaction and oil shale production.These are described in detail in OTA’s EnergyFrom Biological Processes 89 and summarized
briefly here.The liquid fuel that appears to have the most
potential for large-scale production is methanolproduced from wood, perennial grasses and leg-umes, and crop residues. Ethanol from grains hasbeen vigorously promoted in the United States,but appears likely to be limited by problems offood/fuel competition to moderate productionlevels (a few billion gallons per year).
Obtaining the Resource
Environmental concerns associated with alco-hol fuel production focus on feedstock acquisi-tion to a greater extent than with coal liquefac-
agEnergy From Biological processes, OP. cit.
MIS production —whereby a moderateamount of mining is done to provide spacewith which to blast the shale into rubble andthen retort it underground—may present aspecial occupational hazard to workers fromexplosions, fire, and toxic gases as well asa potential danger to the public if toxic fumes
escape from the mine to the surface.To summarize, the environmental concerns of
oil shale production appear to be quite similarto those of coal-based synfuels production, butwith two important differences. First, the geo-graphic concentration of oil shale production willtend to concentrate and intensify its environmen-tal and socioeconomic impacts to a greater ex-tent than is likely to be experienced by coal de-velopment. Second, the problems of disposingof the huge quantities of spent shale associatedwith the AGR system appear to be substantially
greater than those of coal wastes.
FUELS
tion. All of the credible alcohol fuel cycles requirevarious degrees of ecological alteration, replace-ment, or disruption on vast land areas. Takinginto account the expenditure of premium fuelsneeded to obtain and convert the biomass intousable fuels, replacing about 10 billion gal/yr ofgasoline with biomass substitutes would requireadding intensive cropping to a minimum of about25 million acres with a combination of sugar/ starch crops (for ethanol) and grasses (for metha-nol).
If this savings were attempted strictly by the useof ethanol made from corn, the land requirementprobably would be at least 40 million acres. Ifmethanol from wood were the major source,much of the gasoline displacement theoreticallycould be obtained by collecting the logging resi-
dues that are now left in the forest or burned.To replace 10 billion gal over and above theamount available from residues would involve in-creasing the scale and intensity of management(more acreage under intensive management,

8/14/2019 Increased Automobile Fuel Efficiency and Synthetic Fuels: Alternatives for Reducing Oil Imports
http://slidepdf.com/reader/full/increased-automobile-fuel-efficiency-and-synthetic-fuels-alternatives-for 270/292
Ch. 10—Environment, Health, and Safety Effects and Impacts . 269
shorter times between thinnings, more completeremoval of biomass, more conversion of low-quality stands) on upwards of so million acres ofcommercial forest. It might involve an increasedharvest of forestland with lower productive po-tential—so-called “marginal Iands’’—and it will
almost certainly mean that lands not now sub- ject to logging will be logged. Despite these diffi-culties, however, wood is the most likely sourceof large-scale biomass production.
If handled with care, a “wood-for-methanol”strategy could have a number of benefits. Theseinclude upgrading of poorly managed forests, bet-ter forest fire and pest control through slashremoval, and reduced pressure on the few re-maining unprotected stands of scenic, old-growthtimber because of the added yields of high-qualitytimber that are expected in the long run from in-creased management.
Nevertheless, there is substantial potential fordamage to the forests if they are mismanaged.High rates of biomass removal coupled with shortrotations could cause a depletion of nutrients andorganic matter from the more vulnerable forestsoils. The impacts of poor logging practices—ero-sion, degraded water quality, esthetic damage,and damage to valuable ecosystems—may be ag-gravated by the lessening of recovery time (be-cause of the shorter rotations) and any lingeringeffects of soil depletion on the forests’ ability torebound. The intensified management may fur-ther degrade ecological values if it incorporateswidespread use of mechanical and chemicalbrush controls, very large area clearcuts and elim-ination of “undesirable” tree species, and if itneglects to spare large pockets of forest to main-tain diversity.
Finally, the incentive to “mine” wood frommarginal lands with nutrient deficiencies, thinsoils, and poor climatic conditions risks the de-struction of forests that, although “poor” fromthe standpoint of commercial productivity, arerich in esthetic, recreational, and ecological val-
ues. Because the economic and regulatory incen-tives for good management are powerful in some
circumstances but weak in others, a strong in-crease in wood energy use is likely to yield a verymixed pattern of benefits and damages unless theexisting incentives are strengthened.
The potential effects of obtaining other feed-stocks for methanol or ethanol production mayalso be significant. Obtaining crop residues, forexample, must be handled with extreme care toavoid removing those residues that are critical tosoil erosion protection. Large-scale production
of corn or other grains for ethanol is likely to oc-cur on land that is, on the average, 20 percentmore erosive than present cropland. Aside fromcreating substantial increases in erosion, cornproduction will require large amounts of agricul-tural chemicals, which along with sediment fromerosion can pollute the water, and will displacepresent ecosystems.
Equivalent production levels of perennialgrasses and legumes, on the other hand, couldbe relatively benign because of these crops’ resist-ance to erosion as well as their potential to beobtained by improving the productivity of pres-ent grasslands rather than displacing other ecosys-tems. Although large quantities of agriculturalchemicals would be used, the potential for dam-age will be reduced by the low levels of runofffrom grasslands.
Conversion
Production of alcohol fuels will pose a varietyof air and water pollution problems. Methanolsynthesis plants, for example, are small indirectliquefaction plants that may have problems simi-
lar to those of coal plants discussed previously.The gasification process will generate a varietyof toxic compounds including hydrogen sulfideand cyanide, carbonyl sulfide, a multitude of oxy-genated organic compounds (organic acids, alde-hydes, ketones, etc.), phenols, and particulatematter. As with coal plants, raw gas leakage orimproper handling of tars and oils would posea significant hazard to plant personnel, and goodplant housekeeping will be essential. Because oflow levels of sulfur and other pollutants in bio-mass, however, these problems may be some-
what less severe than in an equivalent-size coalplant.
Ethanol distilleries use substantial amounts offuel–and therefore can create air pollution prob-lems. An efficient 50-million-gal/yr distillery willconsume slightly more fuel than a 30-Mw power-

8/14/2019 Increased Automobile Fuel Efficiency and Synthetic Fuels: Alternatives for Reducing Oil Imports
http://slidepdf.com/reader/full/increased-automobile-fuel-efficiency-and-synthetic-fuels-alternatives-for 271/292
270 . Increased Automobile Fuel Efficiency and Synthetic Fuels: Alternatives for Reducing Oil Imports
plant. There are no Federal emissions standardsfor these plants, and the prevailing local standardsmay be weak in some cases, especially for smallonfarm operations.
The plants also produce large amounts ofsludge wastes, called stillage, that are high in bio-
logical and chemical oxygen demand and mustbe kept out of surface waters. Although the still-
age from grains is a valuable animal feed productand will presumably be recovered without theneed for any further incentives, the stillage fromsugar crops is less valuable and will require strictregulation to avoid damage to aquatic ecosys-tems, EPA has had a history of pollution controlproblems with rum and other distilleries, and eth-
anol plants will be similar to these.

8/14/2019 Increased Automobile Fuel Efficiency and Synthetic Fuels: Alternatives for Reducing Oil Imports
http://slidepdf.com/reader/full/increased-automobile-fuel-efficiency-and-synthetic-fuels-alternatives-for 272/292
Ch. 10—Environment, Health, and Safety Effects and Impacts . 271
APPENDIX 10A.– DETAILED DESCRIPTIONS OF WASTE STREAMS,RESIDUALS OF CONCERN, AND PROPOSED CONTROL SYSTEMS
FOR GENERIC INDIRECT AND DIRECT COAL LIQUEFACTION SYSTEMS
Table 10A-1 .-Gaseous Emissions and Controls (indirect liquefaction)
Stream componentsGaseous stream Source of concern Controls Comments
Fugitive emissionsVent gases
Coal-lockhoppervent gas
Ash-lockhoppervent gas
Concentratedacid gas
Off-gases fromcatalystregeneration
Evaporativeemissionsfrom storedproducts
Auxillary plantFlue gases
Coal gasification Carbon monoxide,hydrogen sulfide, tars,oils, naphtha, cyanide,carbon disulfide
Coal gasification Particulate, trace elements
Gas purification Hydrogen sulfide, carbonylsulfide, carbon disulfide,hydrogen cyanide, carbonmonoxide, carbon dioxide,light hydrocarbons,
mercaptans
Catalytic synthesis Nickel and other metalcarbonyls, carbonmonoxide, sulfurcompounds, organics
Product storage Aromatic hydrocarbons,C 5- C12 aliphatichydrocarbons, ammonia
emissions
Cooling-tower drift
and evaporation
Treated wastegases
Power/steam Sulfur and nitrogen oxides,generation particulate trace
elements, coal fines
Power/steam Ammonia, sodium, calcium,
generation, sulfides/sulfates,process cooling chlorine, phenols,
fluorine, trace elements,water treatmentchemicals
Gaseous emission Hydrogen sulfide, carbonylcontrols (e.g., sulfide, carbon disulfide,sulfur recovery hydrogen cyanide, carbon
monoxide, carbon dioxide,light hydrocarbons
Compression and recycleof pressurization gas,incineration of waste gas
Scrubber
Stretford or ADIP/Clausprocesses followed by asulfur recovery tail gasprocess, e.g., Beavon,and incineration of the
Beavon off-gas in a boiler
Incineration in a flare,incinerator, or controlledcombustion
Vapor recovery systems,use of floating roofstorage tanks,conservation vents.Incinerate
Electrostatic precipitators,fabric filters, flue-gasdesulfurization systems,combustion modification
Proper design and siting
can mitigate impacts
Essentially the same as forthe concentrated acid gas
The need for and the effectiveness ofincineration/particulate control havenot been defined
The acid gases will be concentrated bythe gas purification process. Thecontrol choice is dependent on thesulfur content of the gases; acombination of Stretford and ADIP/
Claus may have the lowest overallcosts.Other control technology requirements
not established
Control technologies used in petroleumrefinery and other industries should beapplicable to Lurgi plants; standardspromulgated for the petroleum refiningindustry would probably be extendedto cover the synthetic fuel industry.
Controls applicable to utility andindustrial boilers would generally beapplicable. Established emissionsregulations would cover boilers atLurgi plants
Recycled process water is used for
cooling-tower makeup. If cooling-towerdrift becomes a problem then therecycled water will receive additionaltreatment or makeup water will comefrom another source.
—
SOURCE’ U.S. Department of Energy, Energy Technologies and the Environment, Environmenfa/ Information Handbook, DOEIEVI74O1O-1, December 1980

8/14/2019 Increased Automobile Fuel Efficiency and Synthetic Fuels: Alternatives for Reducing Oil Imports
http://slidepdf.com/reader/full/increased-automobile-fuel-efficiency-and-synthetic-fuels-alternatives-for 273/292
272 q Increased Automobile Fuel Efficiency and Synthetic Fuels: Alternatives for Reducing Oil /reports
Table 10A-2.—Liquid Waste Stream Sources, Components, and Controls (indirect liquefaction)
Liquid waste Stream componentsstream Source of concern Controls Comments
Ash quench water Gasification Dissolved and suspended Gravity settling of solids: the See table 10A-3
Gas Iiquor
Boiler blowdown
Spent reagentsand sorbents
Acid wastewater
Leachates
Treated aqueouswastes
solids, trace elements, overflow from the settlingsulfides, thiocyanate, basin is recycled back toammonia, dissolved organics, the ash quenching operationphenols, cyanides
Gas purification Sulfides, thiocyanate, ammonia, Lurgi tar/oil separatorcyanides, mono- andpolycyclic organics, tracemetals, mercaptans
Phenosolvan process
Phosam W or Chemi-Linz
Power/steam Dissolved and suspendedgeneration solids
Gaseous emission Sulfides, sulfates, tracecontrols, wastewater elements, dissolved andtreatment suspended solids, ammonia,
phenols, tar oils, hydrogensulfide, carbon dioxide
Product separation Dissolved organics,and purification thiocyanate, trace elements
Gasifier ash, boiler Trace elements, organicsash, FGD sludge,biosludge, spentcatalysts
Wastewater treatment Dissolved and suspendedsolids, trace elements
Bio-oxidation and reverseosmosis
Use as cooling-tower makeupor as ash quench watermakeup
Recovery of reagents from airpollution control processes,addition to ash quenchslurry
Oxidation, use as cooling-toweror quench water makeupLandfill should have
impervious clay liner and aIeachate collection system.If buried in the mine, themine should be dry and ofimpervious rock or clay.
Streams, for final dispositionof ash solids. Capabilities oftechnology in terms ofclarified ash slurry water notknown
Capabilities of tar/oilseparation, Phenosolvan,and ammonia recovery wellestablished in terms ofremoval of major constituents.Capabilities for removal ofminor constituents notestablished. Limited costdata available on processes.
Removes dissolved phenolsfrom water
Removes dissolved ammonia,produces saleable anhydrousammonia.
Removes dissolved organicsand inorganic.
Impacts on the quench systemand subsequent treatmentof clarified water not
established.Applicable controls (e.g.,
resource recovery disposalin lined pond, dissolvedsolids removal, etc. arewaste- and site-specific; costand performance data shouldbe developed on a case-by-case basis.
—
—
Forced or natural evaporation The effectiveness and costs ofvarious applicable controls
(e.g., solar or forcedevaporation, physical-chemical treatment for waterreuse, etc.) not determined.
SOURCE: U.S. Department of Energy, Energy Technologies and the Environment, Emdronrnental Information Handbook, DCN2EVI7401O-1, December 1980.

8/14/2019 Increased Automobile Fuel Efficiency and Synthetic Fuels: Alternatives for Reducing Oil Imports
http://slidepdf.com/reader/full/increased-automobile-fuel-efficiency-and-synthetic-fuels-alternatives-for 274/292
Ch. IO—Environment, Health, and Safety Effects and Impacts . 273
Table 10A-3.—Solid Waste Stream Sources, Components, and Controls (Indirect liquefaction)
Stream componentsSolid waste stream Source of major concern Controls Comments
Ash or slag Gasification
Scrubber sludge Power/steamgeneration
Boiler ash Power/steamgeneration
Sludge Waste treatment
Spent catalysts Gas shiftconversion,catalytic
Trace elements, sulfides,thiocyanate, ammonia,organics, phenols,cyanides, minerals
Calcium sulfate, calciumsulfite, trace metals,limestone, alkali metalcarbonates/sulfates
Trace elements, minerals
Trace elements,polycyclic aromatichydrocarbons
Metalic compounds,organics, sulfurcompounds
synthesis, sulfurrecovery(gaseousemission centrol)
Tarry and oily sludges Product/byproduct Mono- and polycyclic
Combined with boilerash and flue gasdesulfurization sludgeand disposed of in a
lined landfill or pond,or buried in the mine
Disposed of with thegasifier ash
Disposed of with thegasifier ash
Combined with gasifierash, boiler ash andflue gas desulfurizationsludge and disposedof in a lined landfiii orburied in the mine.
May also be incineratedProcess for materialrecovery, or fixation/ encapsulation anddisposal in landiil ormine
injection into the gasifier,separation aromatic hydrocarbons, disposal in a secure
trace elements landfiil, return to themine for burial,incineration
Ash is more than 90percent of the solidwastes generated at aLurgi plant. The choice
and design of disposalsystem depend on theash content of coaland plant/mine sitecharacteristics.
—
Because of lack of dataon waste quantitiesand characteristics,optimum control(s)cannot be established.
The technical andeconomic feasibility ofresource recovery havenot been established
Because of lack of dataon waste quantitiesand characteristics,optimum control(s)cannot be established
SOURCE: U.S. Department of Energy, Energy Technologies and the Env)ronrnent, Environmental Information Handbook, DOI3EVI74O1O1, December 19S0.

8/14/2019 Increased Automobile Fuel Efficiency and Synthetic Fuels: Alternatives for Reducing Oil Imports
http://slidepdf.com/reader/full/increased-automobile-fuel-efficiency-and-synthetic-fuels-alternatives-for 275/292
274 q Increased Automobile Fuel Efficiency and Synthetic Fuels: Alternatives for Reducing Oil Imports
Table 10A-4.—Gaseous Streams, Components, and Controls (direct liquefaction)
Operation/auxiliary process Air emissions discharged Components of concern Control methods
Coal storage and pretreatment
Liquefaction
Separation:Gas separation
Solids/liquids separation
Purification and upgrading:Frac t ionat ion
Hydrotreating
Water cooling
Steam and power generation
Hydrogen generation
Acid gas removal
Sulfur recovery
Hydrogen/hydrocarbon recoveryProduct/byproduct storage
Coal dust
Particulate-laden fluefrom coal dryers
Preheater flue gas
gas
Pressure letdown releases
Pressure letdown releases
Preheater flue gas
Particulate-laden vaporsfrom residue cooling(SRC-ll)
Pressure letdown releases
Preheater flue gas
Particulate-laden vaporsfrom product cooling(SRC-l)
Pressure letdown releases
Preheater flue gas
Pressure letdown releases
Drift and evaporation
Boiler flue gas
Preheater flue gas
Pressure letdown releases
Flue gas
Low-sulfur effluent gas b
Pressure letdown releasesSRC dust (SRC-l)Sulfur dustHydrocarbon vapors
Respirable dust, particulate, trace Spray storage piles with water orelements
Respirable dust, particulate, tracemetals, sulfur and nitrogen oxides
Particulate, sulfur and nitrogenoxides
Hydrocarbons, hydrogen sulfide,hydrogen cyanide, ammonia, PAH,hydrogen, phenols, cresylics
Same as for liquefaction letdownreleases
Same as the liquefaction preheater
Particulate, hydrocarbons, traceelements
Same as for liquefaction letdownreleases
Same as for liquefaction preheater
Same as for SRCll residue cooling
Same as for liquefaction letdownreleases
Same as for liquefaction preheater
Same as for liquefaction letdownreleases
Ammonia, sodium, calciumsulfides/sulfates, chlorine, phenols,fluorine, trace elements, watertreatment chemicals
Sulfur and nitrogen oxides,particulate
Same as for liquefaction preheater
Hydrogen sulfide, hydrogen cyanide,carbon oxides, light hydrocarbons
Same as for liquefaction preheater
Hydrogen sulfide, hydrogen cyanide,sulfur dioxide
Hydrogen, hydrocarbonsRespirable dust, particulateElemental sulfurPhenols, cresylics, hydrocarbons,
PAH
polymer. cyclones and baghousefilters for control of dust due tocoal sizing.
Cyclones and baghouse filters. Wetscrubbers such as venturi.
If other than clean gas, scrub forsulfur, nitrogen, and particulatecomponents.
Flaring a
Flaring a
If other than clean gas, scrub forsulfur, nitrogen, and particulatecomponents.
Cyclone and baghouse filter. Wetscrubbers.
Flaringa
If other than clean gas, scrub for
sulfur, nitrogen, and particulatecomponents.Cyclone and baghouse filter. Wet
scrubbers
Flaringa
If other than clean gas, scrub forsulfur, nitrogen and particulatecomponents.
Flaringa
No controls available—good designof water management system canminimize losses.
Sulfur dioxide scrubbing, combustionmodifications.
If other than clean gas, scrub for
sulfur, nitrogen, and particulatecomponents.Flaringa
If other than clean gas, scrub forsulfur, nitrogen, and particulatecomponents.
Carbon absorption. Direct-flameincineration. Secondary sulfurrecovery (Beavon).
Direct-fired afterburnerSpray storage piles with water.Store in enclosed area.Spills/leaks prevention.
%ollection, recovery of useful products and incineration may be more appropriate.bA seconda~ sulfur recovev process may be necessary to meet specified air emission standards.
SOURCE: U.S. Department of Energy, Energy Technologies and the Environment, Environmental Information Handbook, DOE/EV174010-1, December 1980.

8/14/2019 Increased Automobile Fuel Efficiency and Synthetic Fuels: Alternatives for Reducing Oil Imports
http://slidepdf.com/reader/full/increased-automobile-fuel-efficiency-and-synthetic-fuels-alternatives-for 276/292
Ch. IO—Environment, Health, and Safety Effects and Impacts q 275
Table 10A-5.—Liquid Stream Sources, Components, and Controls (d i rect l ique fact ion )
Operation/auxiliary process Wake effluents discharged Components of concern Control methods
Coal pretreatment Coal pile runoff Particulate, trace metals Route to sedimentation pond.Thickener underflow Same as above Route to sedimentation pond.
Water cooling Cooling tower blowdown Dissolved and suspended solids Sidestream treatment(electrodialysis, ion exchangeor reverse osmosis) permitsdischarge to receiving waters.
Hydrogen generation Process wastewater Sour and foul wastewater; Route to wastewater treatmentspent amine scrubbing facility.solution
Acid gas removal Process wastewater Dissolved hydrogen sulfides, Route to wastewater treatmenthydrogen cyanide, phenols, facility.cresylics
Ammonia recovery Process wastewater Dissolved ammonia Route to wastewater treatmentfacility.
Phenol recovery Process wastewater Dissolved phenols, cresylics Route to wastewater treatmentfacility.
SOURCE: U.S. Department of Energy, Energy Technologies and the Environment, Environmental Information Handbook, DOEiEV174010-1, December 1980.
Table 10A.6.—Soiid Waste Sources, Components, and Controls (direct liquefaction)
Operation/auxiliary process Solid waste discharged Components of concern Control methodsCoal pretreatment RefuseSolids/liquids separation Excess residue
or filter cake
Hydrotreating Spent catalyst
Steam and power generation AshHydrogen generation Ash or slag
Mineral matter, trace elements(SRC-ll) Mineral matter, trace elements,(SRC-l) absorbed heavy hydrocarbons
Metallic compounds, absorbedheavy organics, sulfurcompounds
Trace elements, mineral matterTrace elements, sulfides,
ammonia, organics, phenols,mineral matter
Landfill, minefillGasification to recover energy
content followed by disposal(landfill or minefill
Return to manufacturer forregeneration
Landfill, minefillLandfill, minefill
SOURCE: U.S. Department of Energy, Energy Technologies and the Errvironment, Environmental Information Handbook, DOEIEVI74O1O-1, December 1980

8/14/2019 Increased Automobile Fuel Efficiency and Synthetic Fuels: Alternatives for Reducing Oil Imports
http://slidepdf.com/reader/full/increased-automobile-fuel-efficiency-and-synthetic-fuels-alternatives-for 277/292
Chapter 11
Water Availability for SyntheticFuels Development

8/14/2019 Increased Automobile Fuel Efficiency and Synthetic Fuels: Alternatives for Reducing Oil Imports
http://slidepdf.com/reader/full/increased-automobile-fuel-efficiency-and-synthetic-fuels-alternatives-for 278/292
Contents
Page
Introduction. . . . . . . . . . . . . . . . . . . . . . . . . . . . . . . . . . . . . . . . . . . . . . . . . . . . . . . 279
Water Requirements for Synfuels Plants . . . . . . . . . . . . . . . . . . . . . . . . . . . . . . . . 280
lmpacts of Synfuels Development on Water Availability . . . . . . . . . . . . . . . . . . . 281
Water Availability at the Regional Level . . . . . . . . . . . . . . . . . . . . . . . . . . . . . . . . 283Eastern River Basins . . . . . . . . . . . . . . . . . . . . . . . . . . . . . . . . . . . . . . . . . . . . . . . 283The Western River Basins. . . . . . . . . . . . . . . . . . . . . . . . . . . . . . . . . . . . . . . . . . 285
TABLES
Table No. Page
80. Estimates of Net Consumptive Use Requirements of GenericSynfuels Plants . . . . . . . . . . . . . . . . . . . . . . . . . . . . . . . . . . . . . . . . . . . . . . . . . 280
81. Regional Streamflow Characteristics 1975 . . . . . . . . . . . . . . . . . . . . . . . . . . . 28182. Preliminary Quantification of Uncertainties With Respect to Water
Availability in the Upper Colorado River Basin . . . . . . . . . . . . . . . . . . . . . . . 288
FIGURES
Figure No. Page
24. Water Resources Regions . . . . . . . . . . . . . . . . . . . . . . . . . . . . . . . . . . . . . . . . . 27925.The Nation’s Surface Water Laws . . . . . . . . . . . . . . . . . . . . . . . . . . . . . . . . . . 28426.The Nation’s Ground Water Laws . . . . . . . . . . . . . . . . . . . . . . . . . . . . . . . . . 28427. Streamflows and Projected Increased Incremental Water Depletions,
Yellowstone River at Sidney, Mont. . . . . . . . . . . . . . . . . . . . . . . . . . . . . . . . . 286

8/14/2019 Increased Automobile Fuel Efficiency and Synthetic Fuels: Alternatives for Reducing Oil Imports
http://slidepdf.com/reader/full/increased-automobile-fuel-efficiency-and-synthetic-fuels-alternatives-for 279/292
Chapter 11
Water Availability for Synthetic Fuels Development
INTRODUCTION
Operation of a synthetic fuels plant requires a
steady supply of water throughout the year forboth plant and site activities. Availability of waterwill be determined not only by hydrology andphysical development potential, but also by insti-tutional, legal, political, and economic factorswhich govern and/or constrain water allocationsand use among all sectors. This chapter expandsthe environmental discussion of the role of water
Figure 24.—Water
in synfuels development and examines the ma-
jor issues that will determine both water availabil-ity for synfuels and the impacts of procuring watersupplies for synfuels on other water users. Thereare five river basin areas where oil shale and coalresources are principally located: in the easternbasins of the Ohio, Tennessee and the UpperMississippi, and inper Colorado and
Resources Regions
the western basins of the Up-the Missouri (see fig. 24).
yCalifornia
Region
/ 0,. ,---
Souris. Red-Rainy
Pacific Northwest
Great LakesR e g i o n
I Upper M IS S IS S I PPI A
Region Texas-Gulf Region
Hawai iRegion
i c
AlaskaRegion
Caribbean Region
SOURCE: U.S. Water Resources Council, The fVatIon’S Water Resources 197S2000, vol. 2, pt. 1, p. 3,
279
98-281 0 - 82 - 19 : QL 3

8/14/2019 Increased Automobile Fuel Efficiency and Synthetic Fuels: Alternatives for Reducing Oil Imports
http://slidepdf.com/reader/full/increased-automobile-fuel-efficiency-and-synthetic-fuels-alternatives-for 280/292

8/14/2019 Increased Automobile Fuel Efficiency and Synthetic Fuels: Alternatives for Reducing Oil Imports
http://slidepdf.com/reader/full/increased-automobile-fuel-efficiency-and-synthetic-fuels-alternatives-for 281/292
Ch. 1 l—Water Availability for Synthetic Fuels Development . 281
it is therefore difficult a priori to predict how andwhich water “packages” will be assembled. Evi-dence suggests that the industry is conservativein planning for a plant’s water resource needs inorder to ensure (both hydrologically and legal-ly) that the plant obtains its minimum operating
requirements. As examples, developers can se-cure several different sources of supplies; esti-
mates of resource needs will include a margin ofsafety; and sources can be “guaranteed” by ob-taining agreements not only with rights holdersbut also with upstream appropriators and/or po-tential downstream claimants. Synfuels technol-ogy modifications should also be forthcoming
from the industry, if needed to reduce waterneeds.
IMPACTS OF SYNFUELS DEVELOPMENT ON WATER AVAILABILITY
In the aggregate, water consumption require-ments for synfuels development are small.Achieving a synfuels production capability of 2MMB/DOE would require on the order of 0.3 mil-lion acre-feet/year (AFY), which will be distributedamong all of the Nation’s major oil shale and coalregions. This compares with an estimated (1975)total national freshwater consumptive use of119million AFY, of which about 83 percent is foragriculture. ’ Table 81 shows the general hydro-logic characteristics of the principal river basinsto be affected.
Although in the aggregate synfuels water re-quirements are small, each synfuels pIant, never-theless, is individually a relatively large water con-sumer. Depending on both the water supplysources chosen for a synfuels plant and the sizeand timing of water demands from other users,synfuels development could create conflictsamong users for an increasingly scarce water sup-
1 U.S. Water Resources Council, The Nation Water Resources—1975-2000, December 1978. The assessment projects a total na-tional freshwater consumption of 151 million AFY in 2000, of whichabout 70 percent would be for agriculture.
ply or exacerbate conflicts in areas where wateris already limited or fully allocated. Sectors thatwill be competing for water will vary among theregions and will include both offstream uses (e.g.,agriculture, industry, municipalities) and instreamuses (e.g., navigation, recreation, water qualitycontrol, fish and wildlife, hydropower). Becauseenergy developers can afford to pay a relativelyhigh price for water, nonenergy sectors are notlikely to be able to compete economically againstsynfuels for water. However, it is speculative toidentify which sectors may be the most vulner-able to synfuels development.
Public reactions to proposed water use changeand nonmarket mechanisms can be used to allo-cate and protect water for use by certain sectorsdepending on the region and State. Examples ofnonmarket mechanisms include the assertion ofFederal reserved water rights, water quality legis-
lation, and State water allocation laws. Whilesuch mechanisms may prevent developers fromalways obtaining all the water they need, the syn-fuels industry is expected to obtain the major por-tion of its water requirements.
Table 81 .—Regional Streamflow Characteristics 1975 a (millions acre-feet/year)
Consumption c
Mean annual streamflow b 1975 2000 Low flow ratio d Low flow monthOhio . . . . . . . . . . . . . . . . . . . . . . . . . . . . . . 199 2.0 4.9 0.15 SeptemberTennessee . . . . . . . . . . . . . . . . . . . . . . . . . 46 0.5 1.2 0.38 SeptemberUpper Mississippi. . . . . . . . . . . . . . . . . . . 136 1.3 3.0 0.23 JanuaryUpper Colorado. . . . . . . . . . . . . . . . . . . . . 11 2.7 3.6 0.12 JulyMissouri . . . . . . . . . . . . . . . . . . . . . . . . . . . 49 17.3 22.3 0.19 Januaryau,s, water ROSOUrCOS council (wRc), The P&Won Water ROSOUrCOS— 1975-.
%RC, table IV-1. Note that all these outflows are inflows to a downstream river basin.CWRCj table 111.3,
dRatio of the annual flow of a Vew dw year (that flow which will be exceeded with a 95-percent probability in any Year) to the mean annual flow. WRC, table ‘V-2
SOURCE: US. Water Resources Council as tabulated by OTA.
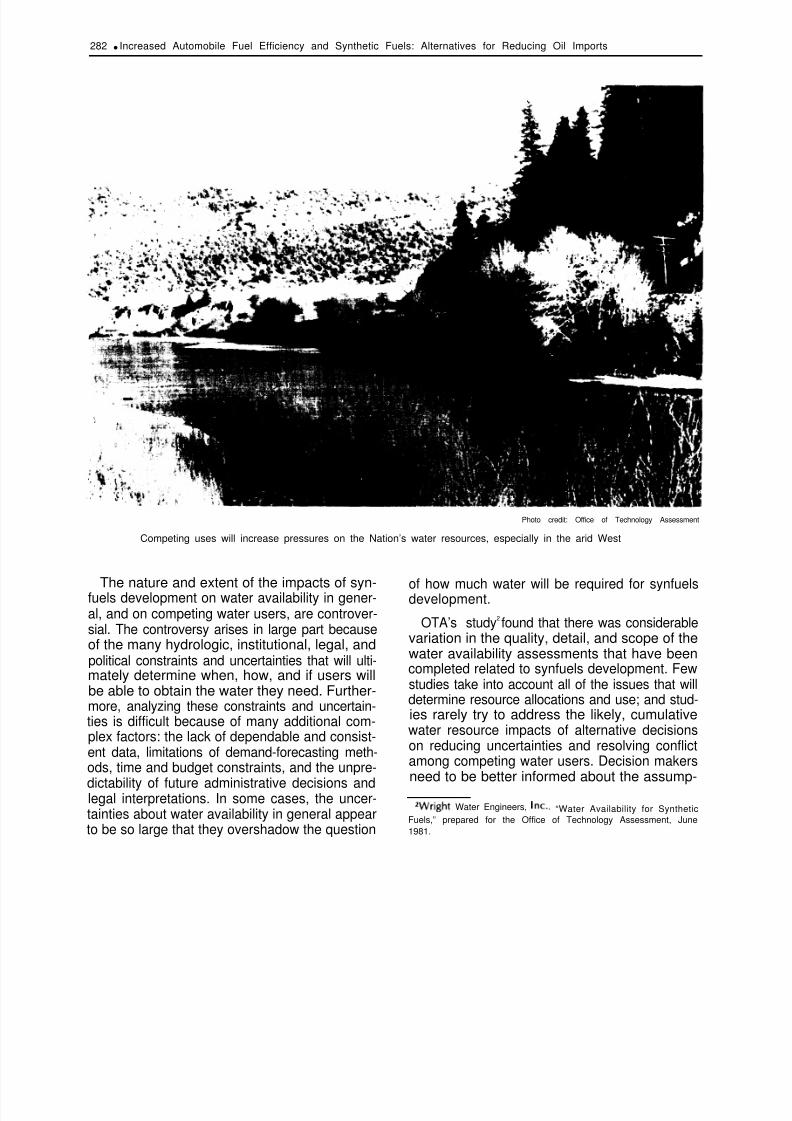
8/14/2019 Increased Automobile Fuel Efficiency and Synthetic Fuels: Alternatives for Reducing Oil Imports
http://slidepdf.com/reader/full/increased-automobile-fuel-efficiency-and-synthetic-fuels-alternatives-for 282/292
282 q Increased Automobile Fuel Efficiency and Synthetic Fuels: Alternatives for Reducing Oil Imports
Photo credit: Office of Technology Assessment
Competing uses will increase pressures on the Nation’s water resources, especially in the arid West
The nature and extent of the impacts of syn-fuels development on water availability in gener-al, and on competing water users, are controver-sial. The controversy arises in large part becauseof the many hydrologic, institutional, legal, andpolitical constraints and uncertainties that will ulti-mately determine when, how, and if users willbe able to obtain the water they need. Further-more, analyzing these constraints and uncertain-ties is difficult because of many additional com-plex factors: the lack of dependable and consist-ent data, limitations of demand-forecasting meth-ods, time and budget constraints, and the unpre-
dictability of future administrative decisions andlegal interpretations. In some cases, the uncer-tainties about water availability in general appearto be so large that they overshadow the question
of how much water will be required for synfuelsdevelopment.
OTA’s study2found that there was considerable
variation in the quality, detail, and scope of thewater availability assessments that have beencompleted related to synfuels development. Fewstudies take into account all of the issues that willdetermine resource allocations and use; and stud-ies rarely try to address the likely, cumulativewater resource impacts of alternative decisionson reducing uncertainties and resolving conflictamong competing water users. Decision makersneed to be better informed about the assump-
Zwright Water Engineers, Inc., “Water Availability for SyntheticFuels,” prepared for the Office of Technology Assessment, June1981.
8/14/2019 Increased Automobile Fuel Efficiency and Synthetic Fuels: Alternatives for Reducing Oil Imports
http://slidepdf.com/reader/full/increased-automobile-fuel-efficiency-and-synthetic-fuels-alternatives-for 283/292
Ch. n-Water Availability for Synthetic Fuels Development q 2 83
tions and uncertainties upon which reports arepredicated, so that estimates can be properly in-terpreted and tradeoffs can be evaluated.
Some of the major uncertainties about wateravailability for synfuels are discussed below. Moreinformed decisions on water availability ques-tions, however, can only partially be achievedby “improving” studies themselves; more in-formed decisions also depend on greatly im-proved water planning practices in general in theNation. The present fragmentation of responsibil-
ities for water policy, planning, and managementeffectively prevents an assessment of the cumula-tive impacts of water resource use on an ongoingand comprehensive basis. *
*The fragmentation of water-related responsibilities among agen-
cies, States, and levels of governments arises in large part becauseriver system boundaries rarely coincide with political boundaries.As a result, there can be major inconsistencies in water manage-ment practices across the country (e. g., inconsistent criteria forevaluation; the lack of integrated planning—including datamanagement—for ground and surface waters, water quality andquantity, and instream and offstream uses).
WATER AVAILABILITY AT THE REGIONAL LEVEL
Eastern River Basins
In the principal eastern basins where energy
resources are located (i.e. Ohio, Tennessee, andthe Upper Mississippi), water should be adequateon the mainstems and larger tributaries, withoutnew storage, to support planned synfuel develop-ment.3 However, localized water scarcity prob-lems could arise during abnormally dry periodsor due to conflicts in use on smaller tributaries.The severity and extent of local problems can-not be fully ascertained from existing data andhave not yet been examined comprehensively, *but, with appropriate water planning and man-agement, these problems should be reduced ifnot eliminated.
There are, nevertheless, various uncertaintiesin the eastern basins that will influence wateravailability for synfuels development, and difficultlocal situations could arise.4 For example, 7-day,10-year minimum low flows are used to esti-mate water availability. * * These estimates areessentially based on recorded streamflow data — . —
3
1 bid.“For example, available reports related to ynfuels for the Tennes-
see River Basin generally deal with specific project sites; the spar-sity of comprehensive information with respect to cumulative im-pacts and possible water use conflicts is presumably because ofthe large quantities of water available at the regional level. The OhioRiver Basin Commission study focuses on water availability for plants
located on the mainstem, even though there are facilities being pro-posed for tributaries.
* *The use of the 7-day, 10-year minimum flow in the East is alsothe basis for water quality regulations and for estimating critical con-ditions for navigation in rivers with limited storage.
which can be of varying quality. Furthermore, byusing historical streamflow records directly,reports on water availability in the eastern basins
characteristically underestimate the frequency offuture critical low flows; i.e., as flow depletionsincrease in the future, the critical flow associatedwith the 7-day, 10-year frequency will actuallyoccur more often in the future than the historicaldata would indicate.
The political, institutional, and legal factors thatwill determine water availability for synfuels inthe eastern basins differ in type and complexityfrom those in the western basins. For example,the East and West have different regional hydro-logic characteristics, with the East being relatively
humid. There are also varying legal and adminis-trative structures as shown in figures 25 and 26:riparian water law is generally applied in the Eastwhereby riparian landowners are entitled to anequal, “reasonable” use of adjacent streamflow;the prior appropriation doctrine is generally ap-plied in the West whereby water rights are basedon “beneficial” use with priorities assigned ac-cording to “first in time, first in right. ” Further-more, in the East there is a general lack of treatiesand compacts, and there are no major Federal(including Indian) reserved water rights questions.
Although water may thus appear to be morereadily available for synfuels development in theEast (e.g., through the transfer of ownership ofriparian land), eastern water law can result insignificant uncertainty concerning the depend-ability of the supply: because all users have equal

8/14/2019 Increased Automobile Fuel Efficiency and Synthetic Fuels: Alternatives for Reducing Oil Imports
http://slidepdf.com/reader/full/increased-automobile-fuel-efficiency-and-synthetic-fuels-alternatives-for 284/292
284 . Increased Automobile Fuel Efficiency and Synthetic fuels: Alternatives for Reducing Oil Imports
Figure 25.– The Nation’s Surface Water Laws
“Ripar ian only appl ies to lakes: Washington““Riparian with permit system: Delaware
I
Arkansas
Texas
—
Louisiana
~ / Florlda
Combinationappropriation/riparian
Riparian with permit system
Appropriation doctrine
Riparian doctrine
SOURCE: U.S. Water Resources Council, (The Ncrtiorr’s Water Resources 7975-2000, vol. 2, pt. iv, P. 118).
Figure 26.— The Nation’s Ground Water Laws
Nebraska
SOURCE: U.S. Water Resources Council, (The Afafiort’s Water Resources 197%?000, vol. 2, pt. iv, p. 118).

8/14/2019 Increased Automobile Fuel Efficiency and Synthetic Fuels: Alternatives for Reducing Oil Imports
http://slidepdf.com/reader/full/increased-automobile-fuel-efficiency-and-synthetic-fuels-alternatives-for 285/292
Ch. n-Water Availability for Synthetic Fuels Development Ž 285
rights under riparian law, the law does not pro-tect given users against upstream diversions oragainst pumping by adjacent wells. * Uncertain-ty also arises because eastern water law has notbeen as well advanced through court tests as inthe West. There are also questions in the Eastconcerning the availability of water from Feder-al storage (i.e., in the Ohio River Basin) becauseof uncertainties regarding who has responsibilityfor marketing and reservoir operation.
The Western River Basins
Competition for water in the West already ex-ists and is expected to intensify with or withoutsynfuels development. There are potentialsources of supply in both the Upper Coloradoand the Missouri River basins that could supportsynfuels development. However, the issues deter-
mining whether and the extent to which thesesources will be available for use differ betweenthe two basins. These issues concern complexState water allocation laws, compacts and treat-ies, Federal including Indian reserved water rightsclaims, and the use of Federal storage. In addi-tion, the use of “mean annual virgin flows” inboth regions to characterize the hydrology resultsin the masking of important elements of hydro-logic uncertainty.** However, and in contrastwith the situation in the East, although the com-plex water setting in the West will probably make
*For example, Federal storage has not yet been utilized in Illinoisbecause delivery of the water from the reservoirs (e.g., to the syn-fuels plants) cannot be guaranteed along the river; riparian land-owners along the way could intercept the released water. Energycompanies are thus faced with having to build private pipelines.
**The accuracy of mean annual virgin flows is uncertain due topossible inaccuracies in the underlying data both on streamflowsand on depletions. (Depletions are usually not measured directlyfor practical reasons.) Furthermore, virgin flow estimates are treatedas both deterministic and stationary, rather than as time-varying,which prevents the variability of streamflows from being addressedaccurately in areas lacking sufficient storage. Estimates of the meanannual virgin flow for the Colorado River at Lees Ferry vary from12.5 million to 15.2 million acre-feet depending on the assump-tions (in this case, the period of the historical record) used.
In general, the use of aggregated data, in the form of regionaland basinwide averages, will mask the local and cumulative down-
stream effects of development on water availability. Such data donot provide information about either the seasonal variability ofstreamflows and demands or the relative positioning and henceinterrelationships among users. These factors are important for iden-tifying potential competition for water, especially in areas wherewater is scarce and subject to development pressures, as will oftencharacterize locations for synfuels development.
obtaining water difficult, the user will be moreassured of a certain supply once a right is ob-tained. s
Missouri River Basin
The magnitude of the institutional, legal, politi-
cal, and economic uncertainties in the MissouriRiver Basin, together with the need for major newwater storage projects to average-out seasonaland yearly streamflow variations, preclude an un-qualified conclusion as to the availability of sur-face water resources for synfuels development.bGround water resources are not well understoodin the basin, but are not likely to be a primarysource of water for synfuels.
Major coal deposits for synfuels developmentin the Missouri River Basin lie within and adja-cent to the Yellowstone River subbasin. The avail-
ability of water for synfuels from the Yellowstonesubbasin, however, could be constrained by theprovisions of interstate compacts, i.e., theYellowstone River Compact. For example, atpresent all signatory States must approve anywater exports from the basin (e.g., to the coal-rich Belle Fourche/Gillette area where water isscarce). Although export approval procedures arenow being challenged in court and States havebegun to modify approval procedures, such ap-provals are likely to take some time. Furthermore,additional storage would likely be required todevelop fully the compact allocations.
Federal reserved water rights are often seniorrights and have the potential of preempting cur-rent and future uses. These rights, however, haveyet to be quantified and are a major source ofuncertainty for water planning. The largest singlecomponent of Federal reserved rights are Indianwater rights. There is a general lack of quantitativedata concerning Indian water rights because ofpolitical controversy over which jurisdictionsshould be adjudicating the claims, varying inter-pretations of the purposes for which water rightsreservations can be applied, and ongoing litiga-
tion.7
‘Ibid.61~id.
The only “official” Government estimates of Indian reserved wa-ter rights project depletions (i.e. requirements) of 1.9 million acre-
(continued on next page)

8/14/2019 Increased Automobile Fuel Efficiency and Synthetic Fuels: Alternatives for Reducing Oil Imports
http://slidepdf.com/reader/full/increased-automobile-fuel-efficiency-and-synthetic-fuels-alternatives-for 286/292
286 . Increased Automobile Fuel Efficiency and Synthetic Fuels: Alternatives for Reducing Oil Imports
Other major uncertainties that could effect theavailability of water for synfuels concern State wa-ter allocation laws. For example, Montana hasestablished instream flow reservations in thelower-Yellowstone River of 5.5 million AFY toprotect future water quality and wildlife. Over500,000 AFY have also been reserved in the basinfor future municipal and irrigation use. Additionalstorage would be required to meet these reserva-tions during years of low flow, but Montana Stateofficials generally do not advocate the construc-tion of new mainstem storage, even if instreamflow shortages were to occur otherwise, as thiswould interfere with the free-flowing nature ofthe river.8 9 No determination has yet been madeas to how these instream flow reservations wouldbe accommodated under the Yellowstone Com-pact.
The transferring of water rights from existing(e.g., agricultural) to new (e.g., synfuels) uses inMontana is subject to administrative restrictionsunder primarily the 1973 Water Use Act, andState environmental and facility siting acts. 10 Be-cause of these restrictions, water rights are notfreely transferable from existing users, and, in ef-fect, there is presently no economic market forrights transfers.
State water laws and statutory provisions inother Upper Basin States similarly could constrainwater rights transfers to synfuels.11 As examples,water for irrigation takes precedence in these
States over water for energy development, andthe “public interest” is to be explicitly considered
feet for the year 2020 in the Yellowstone. (U.S. Department of in-
terior, Water for Energy Management Team, Report on Water forEnergy in the Northern Great Plains With Emphasis on theYe//owstone River Basin, January 1975.) A lower estimated valueof 0.5 million acre-feet appeared in a 1960 background paper (fora larger framework study of the Missouri River Basin) by the Bureauof Reclamation. For a detailed discussion of Indian reserved waterrights, the reader is referred to Constance M. Boris and John V.Krutilla, Water Rights and Energy Development in the Yellowstone
River Basin, Resources for the Future, 1980.BWright Water Engineers, Inc., op. cit.9Personal communications, Department of Natural Resources and
Conservation, State of Montana.IOFor a detailed discussion of State water allocation laws Se e Grant
Gould, State Water Law in the West: /mp/ications for Energy DeveL
opment, Los Alamos Scientific Laboratory, Los Alamos, N. Mex.,January 1979.
I I Ibid.
in approving water allocations. Alternatively,other laws could work to the disadvantage ofnonenergy sectors, such as navigation in the Mis-souri region under the Federal Flood Control Actof 1944 (33 USC 701 -(b)).
Many of the water availability issues in the Mis-
souri River Basin cannot be adequately evaluatedbecause of a lack of supporting data and case lawinterpretations. Figure 27 illustrates the possiblemagnitude of uncertainty by superimposing themajor projected consumptive uses (excludingsynfuels) onto the availability of water in theYellowstone River. As can be seen, assuming alow total estimated demand growth scenario, de-mands would not be met in a dry year withoutadditional storage. Assuming a high-growth sce-nario, not only would demands not be met in adry year without storage, but they would also ex-ceed the average annual flow with additionalstorage.
Upper Colorado River Basin
Although water may not be available in certaintributaries and at specific sites, sources of water
Figure 27.–Streamflows and Projected IncreasedIncremental Water Depletions, Yellowstone River
at Sidney, Mont.
1975 1985 2000
Year
SOURCE: “WaterAvailability for Synthetic Fuels,” Wright Water Engineers, Inc.,contractor report to OTA, June 5, 1981.

8/14/2019 Increased Automobile Fuel Efficiency and Synthetic Fuels: Alternatives for Reducing Oil Imports
http://slidepdf.com/reader/full/increased-automobile-fuel-efficiency-and-synthetic-fuels-alternatives-for 287/292
Ch. n-Water Availability for Synthetic Fuels Development . 287
generally exist in the Upper Colorado River Basinthat could be made available to support OTA’slow and high estimates of oil shale developmentthrough at least 1990. * However, the institution-al, political, and legal uncertainties in the basin
make i t d i f f icuI t to determine which sources
would be used, the actual amount of water that
wouId in fac t be m ade available from any sourceto support synfuels development, and thus thewater resource impacts of using any source forsynfuels on other water users. Until major com-ponents of these uncertainties are analyzed quan-titatively and start to become resolved, the ex-tent to which synfuels production can be ex-panded beyond a level of several hundred thou-sand barrels/day (i. e., about 125,000 AFY) can-not be estimated with confidence.12
One potential source of water supply for syn-fuels is storage from Federal reservoirs. For exam-
ple, approximately 100,000 AFY could be madeavailable for synfuels from two Federal reservoirson the western slope of Colorado (Ruedi andGreen Mountain). However, the amount of wateravailable is uncertain because of questions re-garding firm yields, contract terms for water sales,which purposes are to be served by the reser-voirs, competing demands, the marketing agent,and operating policy.
Under State water laws, water rights throughoutthe basin—in Colorado, Utah, and Wyoming—can generally be transferred (e. g., from agricul-
ture) via the marketplace (i. e., sold) to synfuelsdevelopers who can afford to pay a relatively highprice for water.13 The degree to which developersrely on such transfers will determine the subse-quent economic and social impacts on the usersbeing displaced and, in turn, on the region. * Thetransfer process, however, is time-consuming and
* T h e lo w estimate for shale oil production in 1990 (see ch. 6)
implies a range of annual water use of 20,000 to 48,000 acre-feet;
the high estimate implies a range of 40,000 to 96,000 acre-feet. By
2000, annual water requirements would be, respectively, 50,000
to 120,000 acre-feet, and 90,000 to 216,000 acre-feet.I Zwright Water Engineers , ! nc., OP . cit.
‘JGould, op. cit.“irrigation requirements are determined by many factors, includ-
ing climate, crop, irrigation methods, etc. Assuming that agriculture
consumes 1.5 to 2.5 acre-feet/acre in the Rocky Mountain area,
an average oil shale plant consuming 8,500 AFY would need toacquire water rights applicable to about 3,4oo to 5,7oo irrigatedareas.
legally cumbersome, is constrained under Statewater law by the nature of the original right, andis subject to political and legal challenge.
Some provisions of the laws and compacts gov-erning water availability to the States within thebasin will not be tested and interpreted until
water rights in the basin are fully developed. Forexample, procedures and priorities have not yetbeen developed for limiting diversions among theUpper Basin States when downstream com-mitments to the Lower Basin, under the ColoradoRiver Basin Compact, cannot otherwise be met.There is also controversy about whether the Up-per Basin States as a whole will be responsiblefor providing any of the 1.5 million AFY commit-ment to Mexico under the Mexican Water Trea-ty of 1944-45. Individual States within the basin,such as Colorado, have generally not yet devel-oped procedures and priorities for internally ad-
ministering their downstream delivery com-mitments for when the basin becomes fullydeveloped; thus, the impacts of a State’s alloca-tion of available water to individual subbasins andusers within that State, such as synfuels, cannotyet be determined. State water law also general-ly evolves through individual court cases, so thatthe cumulative effects of development are notknown.
There are generally no institutional or financialmechanisms for obtaining water for synfuels, ei-
ther through conservation or through increased
efficiency in water use in other sectors, as in otherparts of the country. In Colorado, for example,changes in agricultural practices to increase waterefficiency are likely to be challenged legally, sincedownstream water rights appropriators are en-titled to return flows resulting from existing albeitinefficient practices. It has been reported thatbasin exports for municipal uses could be re-duced by as much as 200,000 to 300,000 AFYwith improved water use efficiency .14
Other uncertainties that affect water availabilityfor synfuels in the area include: Federal reserved
water rights (e. g., for the Naval Oil Shale Reserve
IAoffice of the Executive Director, Colorado Department of Natu-ral Resources, The Availability of Water for Oil Shale and Coal Gasi-fication Development in the Upper Colorado River Basin, Upper
Colorado River Basin 13(a) Assessment, October 1979.

8/14/2019 Increased Automobile Fuel Efficiency and Synthetic Fuels: Alternatives for Reducing Oil Imports
http://slidepdf.com/reader/full/increased-automobile-fuel-efficiency-and-synthetic-fuels-alternatives-for 288/292
288 . Increased Automobile Fuel Efficiency and Synthetic Fuels: Alternatives for Reducing Oil Imports
at Anvil Points, Colo.) have not yet been quanti-fied; storage would have to be provided in theWhite River Basin (where the Uinta and PiceanceCreek oil shale reserves are located) but primereservoir sites are located in designated wilder-ness areas; there is as yet no compact betweenColorado and Utah apportioning the flows of theWhite River; and in Colorado, in order to developmuch of the deep ground water in the PiceanceBasin, oil shale developers must prove that theground water is nontributary, for which data areoften lacking and difficult to obtain. The resolu-tion of the uncertainties in the Upper Coloradocould limit large-scale synfuels growth as illus-trated in table 82, but “even at these highly ag-gregated levels for the entire Upper ColoradoRiver Basin, the confidence limits or ranges thatare placed on estimates of water availability areso broad that they tend to (overshadow) the
amount of water needed for synfuelsdevelopment.” 15
Wright Water Engineers, Inc., op . cit., p. IV-38.
Table 82.—Preliminary Quantification ofUncertainties With Respect to Water Availability
in the Upper Colorado River Basin
Annual amount available for consumption(millIons of acre-feet) a
12.5 -15.2
Subtract 7.5
5.0 -7.7Subtract 0.75
4,25-6.95Subtract .65
Estimates of mean annual flowof the Colorado River at
Lees FerryRequired delivery to the LowerBasin
Estimate of the Upper Basin’sMexican Treaty obligation
Estimated annual reservoirevaporation from FlamingGorge, Lake Powell, and theCurecanti Unit Reservoirs
Total 3.60-6.30
Annual projected consumptive demands(millions of acre-feet) In 2000 b
Total 4.10-4.78 (excluding synfuels)Total 4.15-4.90 (including OTA low estimates for oil
shale c)Total 4.19-5.00 (including OTA high estimates for oil
shale c)ams not nl~e ~lowmces for the quantlflcatlon of Federal reserved water rightscleims (the Naval Oil Shale Reserve at Anvil Points has claimed, for exempie,200,01Xl AFM. the effect of Dotentlai environmental constraints (e.ci.. saiinityconiroi, prot~tion of endangered species), or the availability of F~er~’storage.bEstlmates ~ for 2ocm and exclude synfuels development (@iorado @Partment
of Natural Resources, Section 13(a) Assessment of the Upper Coiorado RiverBasin; 1975 estimate = 3.12 maf). instream uses are not inciuded.
cThe low estimate for shale oil production in 1990 (see ch. 6) imPlies a ran9e
of annuai water use of 20,000 to 48,000 acre-feet; the high estimate implies arange of 40,000 to 98,tXXl acre-feet. By 2000, annual water requirements wouid
be, respectively, 50,000 to 120,000 acre-feet, and S,000 to 216,000 acre-feet.
SOURCE: OTA based on Wright Water Engineers, Inc.

8/14/2019 Increased Automobile Fuel Efficiency and Synthetic Fuels: Alternatives for Reducing Oil Imports
http://slidepdf.com/reader/full/increased-automobile-fuel-efficiency-and-synthetic-fuels-alternatives-for 289/292
Index

8/14/2019 Increased Automobile Fuel Efficiency and Synthetic Fuels: Alternatives for Reducing Oil Imports
http://slidepdf.com/reader/full/increased-automobile-fuel-efficiency-and-synthetic-fuels-alternatives-for 290/292
Index
Aamco Transmissions, 202alcohols, 99, 269-270American Motors (AMC), 107, 202
Arizona Public Service Co., 249Arthur Anderson & Co., 199
asphalt, 78automobile industry
auto repair facilities (table), 201capital intensiveness of, 42, 48, 60conduct of manufacturers, 197-198economic impacts of change in, 195-203employment in, 220-223financing of capital programs in, 130-131links to foreign companies, 196-197
location of parts-supplier plants (table), 224manufacturing structure of, 196-197
occupational and regional issues in, 223-225
problems of, 40-41prospects for, 202-203rate of change in, 133
sales and service segment of, 200-202structural readjustments in, 7, 40
suppliers for, 198-200vertical integration in, 133
Booz-Allen & Hamilton, 199Brayton engine, 144-145Bureau of Labor Statistics, 220
Bureau of the Census, 220
CAFE (see Corporate Average Fuel Efficiency)Carter administration, 50Chrysler Corp., 12, 53, 130, 196, 197, 198, 202, 221coal
acid drainage from mining, 251-252aquifer disruption from mining, 252direct liquefaction of, 163-165
indirect liquefaction of, 161-163mining for synfuels, 204-205
occupational hazards of mining, 252-253subsidence from mining, 252
Colony Oil Shale Project, 232
Colorado Department of Local Affairs, 232Colorado River Basin Compact, 287
Colorado West Area Council of Governments, 228Congress
acts of (see legislation)Congressional Budget Office (CBO), 140
Congressional Research Service (CRS), 63, 159policy options for (see policy options)proposals on environmental and safety regulation, 56Senate Committee on Commerce, Science, and Transpor-
tation, 31water resources and, 58conservation, 83, 184, 188-198Corporate Average Fuel Efficiency (CAFE), 3 ( 9, 13, 30, 31,
36, 41, 50, 55-56, 60, 61, 105 { 106, 120
Data Resources, Inc., 202Delphi survey, 199Department of Commerce, 223Department of Energy (DOE), 4, 9, 10, 43, 44, 54, 57, 58,
96, 183, 253, 255, 262, 263Department of Housing and Urban Development (HUD),
59, 62Department of Labor, 222Department of Transportation, 129, 135, 196, 199, 220, 221
222, 223, 243Department of the Treasury, 43
Eaton Corp., 199Economic Development Administration, 59electricity, 186electric vehicles, 3, 41, 71, 74, 219, 250
battery-electric and hybrid, 117-120cost compared to synfuels (table), 77cost to consumers, 5, 141-142effects on fuel consumption, 128-129, 150, 153and electric utilities, 149-153, 245-246environmental effects of, 7, 24, 84, 85, 245-248
impact on oil imports, 5occupational and public health risks of, 247-248prospects for, 24, 94-95resources requirements for, 246-247safety of, 24-25, 247
Energy information Administration (EIA), 22, 30, 37,69, 73,184, 185, 186, 189
Energy Mobilization Board, 57Engineering Societies’ Commission on Energy (ESCOE), 170Environmental Protection Agency (EPA), 10,41, 57, 58,93,
96, 121, 124, 239, 254, 262, 263, 264, 270environment, health, and safety, 58, 60, 84
air quality, 244-245, 254-256coal liquefaction and, 253-261effects of auto fuel conservation on, 237-245
effects of diesel fuel on, 84effects of energy alternatives on, 84-85effect of fuel efficiency on, 15effect of policy options on, 56-58electric vehicles and, 7, 24, 84, 85, 247-248emissions characteristics of alternative engines (table), 245future trends in auto safety, 240-242gaseous emissions and controls (table), 271gaseous streams, components, and controls (table), 274impacts of fuel efficiency and synfuels compared, 83-85liquid stream sources, components, and controls (table),
275
liquid waste stream sources, components, and controls(table), 272
small v. large cars, 7, 92-93, 237-242
solid waste sources, components, and controls (table), 275solid waste stream sources, components, and controls(table), synfuels and, 7, 248-270
environment (see environment, health, and safety)EPA (see Environmental Protection Agency)
291

8/14/2019 Increased Automobile Fuel Efficiency and Synthetic Fuels: Alternatives for Reducing Oil Imports
http://slidepdf.com/reader/full/increased-automobile-fuel-efficiency-and-synthetic-fuels-alternatives-for 291/292
292 . Increased Automobile Fuel Efficiency and Synthetic Fuels: Alternatives for Reducing Oil Imports
ESA (see legislation, Energy Security Act)ethanol, 179, 263-269EVs (see electric vehicles)Exxon, 30, 186, 208Exxon Donor-Solvent (EDS) process, 20, 164
Fatal Accident Reporting System (FARS), 238, 241, 242Fischer-Tropsch process, 163
Ford administration, 46Ford Motors, 12, 15, 130, 132, 196, 197, 202, 221fuel consumption
estimates for 1985-2000, 126-130of passenger cars, 126-128of vehicles other than passenger cars, 129-130
fuel efficiencyaccessories and, 149advantages of, 60aerodynamic drag and, 148-149automobile technologies and, 108-120by car class size, 93, 123-126costs to consumers, 79-80, 139-141costs of improving, 12-14, 75-77, 130-142demand for, 93-94economic impacts of, 14-15, 71, 87-89
effects on communities, 86effects on employment, 86, 87-88effects on environment, health, and safety, 15features of, 38-40Federal role in, 37-38growth of, 9, 10, 11-12, 36, 40-41, 105-107, 120-126,
142-149and health of the auto industry, 89-90investments in, 131-135policy background of, 41-42potential in 1995 (table), 56potential for a 75-mpg car, 90-91rolling resistance and, 149social impacts of, 15, 86, 219-225stimulation of, 3
tradeoffs with safety and emissions, 113-115vehicle weight and, 146-148
fuel gasesfrom biomass, 168
fuel switching, 83, 184, 185-188cost estimates of (table), 78
gasifiers, 163gasoline
from methanol, 163taxes on, 47
gas turbine, 144-145, 244General Agreement on Tariffs and Trade (GATT), 49, 51General Motors, 12, 15, 90, 130, 133, 139, 196, 197, 198,
199, 202, 221, 223, 242
hazards (see environment, health, and safety)health (see environment, health, and safety)Honda, 53
Insurance Institute for Highway Safety (IIHS), 238, 239,240
legislationClean Air Act, 58, 244, 263Clean Water Act, 263Economic Recovery Tax Act, 131Energy Policy and Conservation Act, 30, 35,41, 105, 106,
108
Energy Security Act, 31, 35, 42, 53EPCA (see Energy Policy and Conservation Act)Federal Coal Mine Health and Safety Act, 253Federal Flood Control Act, 286Federal Nonnuclear Research and Development Act, 43Fuel Efficiency Act, 41Fuel Use Act, 35, 62National Energy Act, 42Powerplant and Industrial Fuel Use Act, 30-31Resources Conservation and Recovery Act, 260, 263Safe Drinking Water Act, 263Surface Mine Control and Reclamation Act (SMCRA), 250,
251, 252Trade Act, 59, 221Trade Expansion Act, 221Water Use Act, 286
liquefied petroleum gas (LPG), 78
methanol, 163, 179, 209, 269Mexican Water Treaty, 287Michigan Manufacturers Association, 199Midas Muffler, 202Middle East War, 67Moody’s Investors Service, Inc., 224
National Accident Sampling System, 239National Crash Severity Study, 239National Electric Reliability Council, 187National Highway Traffic Safety Administration (NHTSA),
15, 41, 84, 92, 237, 238, 240, 243National Petroleum Council, 186national security, 37National Synfuels Production Program (NSPP), 42, 43, 56New England Electric Co., 62Nissan Motors, 223NSPP (see National Synfuels Production Program), 42
Occupational Safety and Health Administration (OSHA), 10,41, 97, 263, 264
Office of Surface Mining, 10Office of Technology Assessment (OTA), 3, 4, 5, 6, 8, 35,
36, 37, 42, 43, 45, 47, 53, 60, 69, 70, 71, 74, 75, 77,78, 88, 94,98, 113, 121, 122, 123, 124, 131, 136, 140,170, 179, 185, 189, 190, 233, 237, 238, 240, 241, 250,254, 262, 266, 268, 282, 287
oilcost of reducing consumption of, 23-24, 74-79
decline in U.S. production of, 30, 35depletion of reserves of, 67displacement of imported, 8-10, 35-37, 44-61and foreign policy, 69

8/14/2019 Increased Automobile Fuel Efficiency and Synthetic Fuels: Alternatives for Reducing Oil Imports
http://slidepdf.com/reader/full/increased-automobile-fuel-efficiency-and-synthetic-fuels-alternatives-for 292/292
Index . 293
imported, 3, 5, 67-69 capital intensiveness of, 42, 48, 57, 60