income inequality and poverty what do you see? a man or a woman? how old are they? where do they...
TRANSCRIPT

Income Inequality and Poverty

What do you see?
A man or a woman?
How old are they?
Where do they live?
What race are they?
female
a child
from a rural area
white
Poverty in the US

Resource Prices and Income Differences
• Individuals create income by supplying resources that are highly valued by others. • This provides the incentive to develop
skills, talents, and resources others value.
• The view that there is a fixed-size economic pie that can be sliced and divided among the citizenry is fallacious.

The U.S. 2011 poverty line:
- $17,916 annually for a family of three
- $16.37 per person per day
The poverty line
The World Bank poverty lines for low-income countries:
- $1.25/day per person
- $2/day per person

The U.S. Poverty Rate since 1960
-fell dramatically during the 1960s,
-rose in the early 1980s and early 1990s,
-declined in the 1990s through mid-2000s,
-rose to 15.9% in 2011, (close to the 1960 levels)
-In 2012, the poverty dropped slightly to 15.0%. (Source: U.S. Census Bureau)

Group Poverty RateFemales 16.3%
Males 13.6%
White 13.0%
Black 27.6%
Hispanic 25.3%
Under 18 21.9%
18-24 20.6%
25-34 15.9%
35-44 12.2%
45-54 10.9%
55-59 10.7%
60-64 10.8%
65 and older 8.7%
Poverty Rates by Group, 2011

Country Share of Population below $1.25 per day
Share of Population below $2.00 per day
Brazil (2009) 6.1% 10.8%
China (2009) 11.8% 27.2%
Egypt (2008) 1.7% 15.4%
India (2010) 32.7% 68.8%
Mexico (2010) 0.7% 4.5%
Nigeria (2010) 68.0% 84.5%
Poverty Lines for Low-Income Countries, mid-2000s
Source: http://data.worldbank.org/indicator/SI.POV.DDAY

The Poverty Trap
a. When people are provided with food, shelter, healthcare, income, and other necessities, assistance may reduce their incentive to work.
b. as the poor earn income to support themselves, the government reduces the level of assistance it provides.
c. every time a poor person earns $100, the person loses $100 in government support.
d. the person experiences no net gain for working.

The Poverty Trap in ActionThe original choice is 500 hours of leisure,
2,000 hours of work (at $8/hour) at point A, and income of $16,000.
With a guaranteed income of $18,000, this
family would receive $18,000 whether
it provides zero hours of work or
2,000 hours of work.
Only after 2,300 hours of work does its income rise above the guaranteed level of $18,000—and even then, the marginal gain to income from working many hours is small.

Two Combinations of Work and Support
Hours Worked Total Earnings Government Support Total Income
0 0 $18,000 $18,000
500 $4,000 $14,000 $18,000
1,000 $8,000 $10,000 $18,000
1,500 $12,000 $6,000 $18,000
2,000 $16,000 $2,000 $18,000
2,500 $20,000 0 $20,000
Hours Worked Total Earnings Government Support Total Income
0 0 $18,000 $18,000
500 $4,000 $16,000 $20,000
1,000 $8,000 $14,000 $22,000
1,500 $12,000 $12,000 $24,000
2,000 $16,000 $10,000 $26,000
2,500 $20,000 $8,000 $28,000

Loosening the Poverty Trap: Reducing Government Assistance by 50 Cents for Every $1 Earned
Point P - 2000 hours, no assistance and income of $16,000.
Point S – less work, more leisure, with government assistance and income of $25,000.
Point R – same work/leisure, with government assistance and income of $26,000.

Safety Nets1. Temporary Assistance for Needy Families (TANF)
a. Replaced Aid to Families with Dependent Children (AFDC),
1) aka welfare
2) provided cash payments to mothers with children who were below the poverty line.
b. Personal Responsibility and Work Opportunity Reconciliation Act
1) aka “welfare reform act”
2) new law replaced AFDC with Temporary Assistance for Needy Families (TANF).
c. the federal government gives a fixed amount of money to each state
1) the state can then use the money for almost any program with an antipoverty component2) they must impose work requirements so that most recipients are working or attending school.
3) no one can receive TANF benefits with federal money for more than a total of five years over his or her lifetime.

2. Earned income tax credit (EITC)
a. first passed in 1975
b. a method of assisting the working poor through the tax system.
c. one of the largest assistance program for low-income groups
d. the amount of the tax break increases with the amount of income earned, up to a point.
Real Federal Spending on CTC, EITC, and TANF,
1975-2013
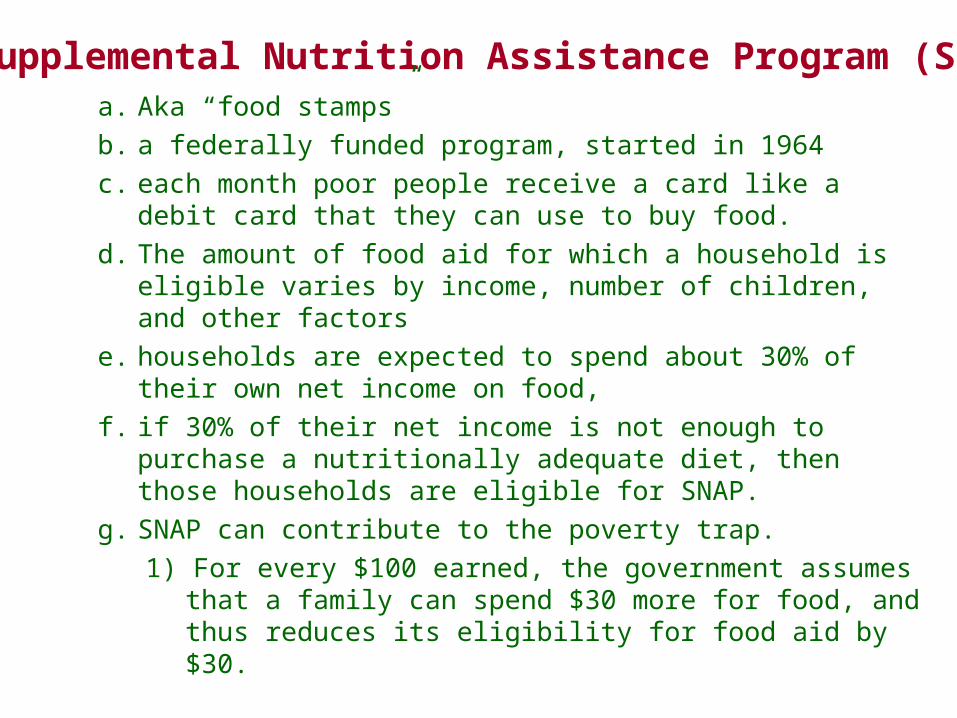
3. Supplemental Nutrition Assistance Program (SNAP)a. Aka “food stamps”
b. a federally funded program, started in 1964
c. each month poor people receive a card like a debit card that they can use to buy food.
d. The amount of food aid for which a household is eligible varies by income, number of children, and other factors
e. households are expected to spend about 30% of their own net income on food,
f. if 30% of their net income is not enough to purchase a nutritionally adequate diet, then those households are eligible for SNAP.
g. SNAP can contribute to the poverty trap.
1) For every $100 earned, the government assumes that a family can spend $30 more for food, and thus reduces its eligibility for food aid by $30.

Medicaid1. created by Congress in 1965
2. a joint health insurance program entered into by both the states and
the federal government.
3. The federal government helps fund Medicaid
4. But each state is responsible for administering the program,
5. It provides medical insurance for certain low-income people
6. it ensures that a basic level of benefits is provided to Medicaid participants
- each state sets eligibility requirements, so the program differs from state to state.
7. common problem
- many low-paying jobs pay enough to a breadwinner so that a family could lose its eligibility for Medicaid,
- yet the job does not offer health insurance benefits

Income Inequality in the United States
Share of Aggregate Income Received by Each Fifth and Top 5% of Households, 1967–2011
Year Lowest Second Third Fourth Highest Top 5%
1967 4.0 10.8 17.3 24.2 43.6 17.2
1970 4.1 10.8 17.4 24.5 43.3 16.6
1975 4.3 10.4 17.0 24.7 43.6 16.5
1980 4.2 10.2 16.8 24.7 44.1 16.5
1985 3.9 9.8 16.2 24.4 45.6 17.6
1990 3.8 9.6 15.9 24.0 46.6 18.5
1995 3.7 9.1 15.2 23.3 48.7 21.0
2000 3.6 8.9 14.8 23.0 49.8 22.1
2005 3.4 8.6 14.6 23.0 50.4 22.2
2010 3.3 8.5 14.6 23.4 50.3 21.3
2011 3.2 8.4 14.3 23.0 51.1 22.3

Lowest20% of
recipients
4.5 4.8 5.4 5.14.6
4.3
12.2 24.012.2 23.811.6 24.310.8 23.8 9.8 22.8
12.0 23.441.340.941.644.347.4
42.7 1950 1960 1970 1980 1990 2000
17.417.817.617.516.615.5
Secondquintile
Thirdquintile
Fourthquintile
Top20% of
recipientsFamily income before taxes
Impact of taxes & transfers on 2006 household income
7.1 7.1 6.8 7.1
12.9 23.912.8 24.112.4 23.3
13.2 24.138.138.240.1
37.4 1961 1972 1980 1990
18.218.018.117.1
Household expenditures
Income Inequality in the United States
7.4 12.9 23.4 38.8 1995 17.5
4.2 9.7 22.9 47.7 2001 15.4 4.0 9.6 23.0 2004 15.4 47.9 4.1 9.7 23.3 47.42007 15.6
3.5 4.3 9.7 22.7
8.5 22.548.350.5 Before
After15.015.0

% Population
% I
ncom
e
60
50
40
30
20
10
1 2 3 4 5 60 7 8 9 10
70
80
90
100Lorenz Curve

% I
ncom
e
% Population
60
50
40
30
20
10
1 2 3 4 5 60 7 8 9 10
70
80
90
100
Degre
e of
inco
me
ineq
uality
Lorenz Curve

Quintile 1975 by Quintile
1975 Cumulative
2010 by Quintile
2010 Cumulative
Lowest 4.3 4.3 3.3 3.3
Second 10.4 14.7 8.5 11.8
Third 17.0 31.0 14.6 26.4
Fourth 24.7 56.4 23.4 49.8
Highest 43.6 100.0 50.3 100.1

% Population
% I
ncom
e
60
50
40
30
20
10
1 2 3 4 5 60 7 8 9 10
70
80
90
100
1975
2010
Lorenz Curve1975 Cumulative 2010 Cumulative
4.3 3.3
14.7 11.8
31.0 26.4
56.4 49.8
100.0 100.1
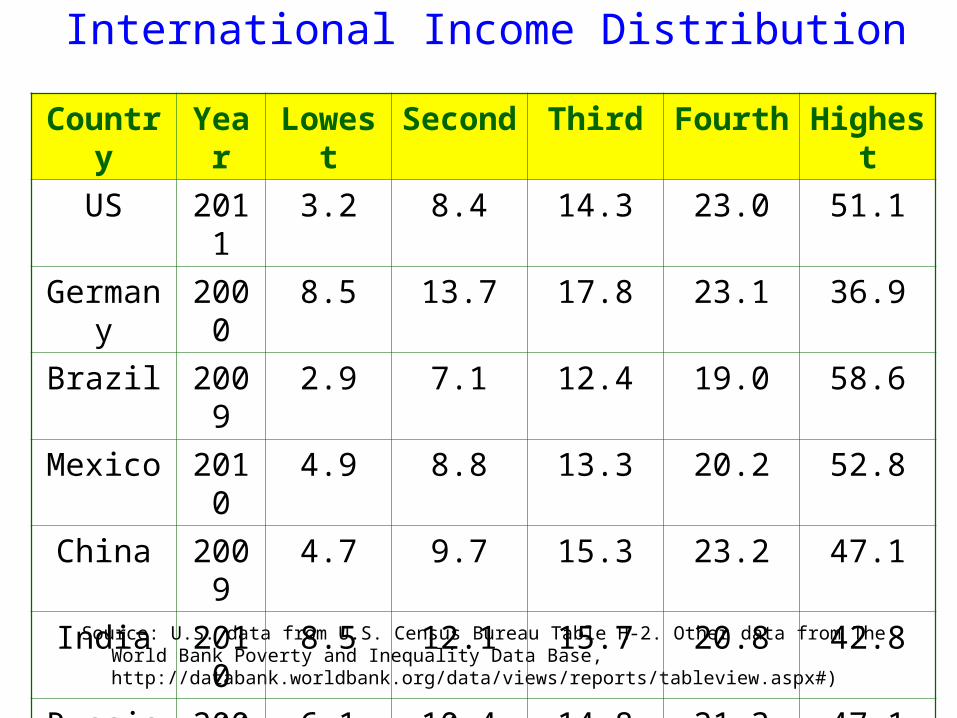
International Income Distribution
Source: U.S. data from U.S. Census Bureau Table H-2. Other data from The World Bank Poverty and Inequality Data Base, http://databank.worldbank.org/data/views/reports/tableview.aspx#)
Country Year Lowest Second Third Fourth Highest
US 2011 3.2 8.4 14.3 23.0 51.1
Germany 2000 8.5 13.7 17.8 23.1 36.9
Brazil 2009 2.9 7.1 12.4 19.0 58.6
Mexico 2010 4.9 8.8 13.3 20.2 52.8
China 2009 4.7 9.7 15.3 23.2 47.1
India 2010 8.5 12.1 15.7 20.8 42.8
Russia 2009 6.1 10.4 14.8 21.3 47.1
Nigeria 2010 4.4 8.3 13.0 20.3 54.0

International Income DistributionCountry Year Lowest Second Third Fourth Highest
US 2010 3.3 8.5 14.6 23.4 50.3
3.3 11.8 26.4 49.8 100.1
Germany 2000 8.5 13.7 17.8 23.1 36.9
8.5 22.2 40 63.1 100
Brazil 2009 2.9 7.1 12.4 19.0 58.6
2.9 10 22.4 41.4 100
Mexico 2010 4.9 8.8 13.3 20.2 52.8
4.9 13.7 27.0 47.2 100
China 2009 4.7 9.7 15.3 23.2 47.1
4.7 14.4 29.7 52.9 100
India 2010 8.5 12.1 15.7 20.8 42.8
8.5 20.6 36.3 57.1 99.9
Russia 2009 6.1 10.4 14.8 21.3 47.1
6.1 16.5 31.3 52.6 99.7
Nigeria 2010 4.4 8.3 13.0 20.3 54.0
4.4 12.7 25.7 46 100

% Population
% I
ncom
e
60
50
40
30
20
10
1 2 3 4 5 60 7 8 9 10
70
80
90
100Lorenz Curve

Factors Influencing Income Distribution
• Differences in:• age, • education, • family size, • marital status, • number of earners in the family,
and,• time worked.
• Young, inexperienced workers, students, single-parent families, and retirees are over-represented among those with low incomes.

Bottom 20% of income recipients
10.0
31.046.023.0
31.063.0
12.079.0 9.0
2.0 Percent with less than high school Percent with college degree or more
under 35 35 - 64 65 and over
Education of householder
52.048.0
7.093.0 Married-couple family (% of total)
Single-parent family (% of total)
2.9 3.4
Source: http://www.census.gov and author calculations from the March 2008 Current Population Survey.
Top 20% of income recipients
Age of householder (percent distribution)
Family status
Persons per family
0.8 2.2Earners per family
8.0 29.0% of total hours worked supplied by group
12.0 64.0% of married-couple families
in which wife works full-time
High and Low Income Families, 2007
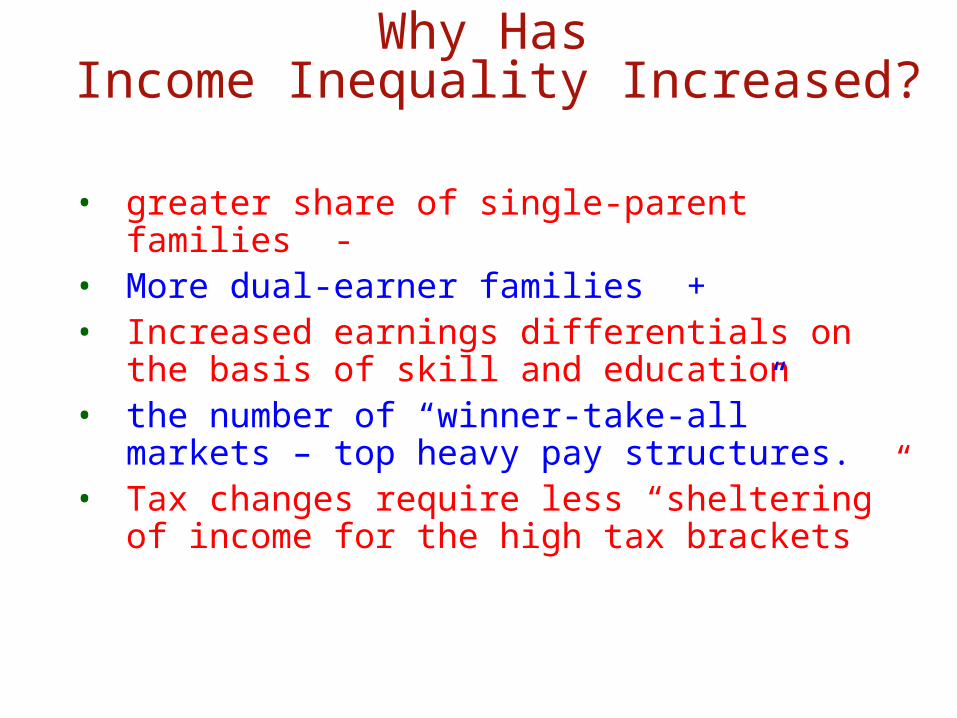
Why Has Income Inequality Increased?
• greater share of single-parent families -• More dual-earner families +• Increased earnings differentials on the basis
of skill and education• the number of “winner-take-all” markets –
top heavy pay structures.• Tax changes require less “sheltering” of
income for the high tax brackets

Top paidquintile
53.0
23.0
24.5
14.0 6.5
14.0 22.5 24.0 12.0
5.5 12.5 23.5
53.5
25.0 5.5 4.5 12.0
32.5 24.0
28.0
33.525.5
5.0 7.5 10.4
Next highestquintile
Middlequintile
Next lowest paid quintile
Lowest paidquintile
Highest quintile
Next highest quintile
Middle quintile
Next lowest-paid quintile
Lowest paid quintile
Percentage Distribution by Income Status of Family in 2004
Income Status of Family in 1994
Income Mobility
The table above allows us to see how families in each income bracket in the U.S. fared 10 years later. Does it appear to you that there is a significant amount
of income mobility in the U.S. economy?

53.2
25.8
23.6
12.9 6.5
12.6 27.5 20.7 10.9
4.3 11.0 25.7
53.3
23.2 5.7 3.0 14.9
31.1 23.7
28.3
36.322.6
4.3 6.4 12.4
Highest quintile
Next-highest-quintile
Middle-quintile
Next-lowest-paid quintile
Lowest-paid quintile
1988-1998
Top paidquintile
78.4
42.4
25.4
4.9 4.0
13.4 17.5 14.4 9.1
6.2 8.2 19.1
46.3
10.6 0.1 4.1 6.8
23.9 24.8
45.6
28.637.9
7.8 7.9 12.6
Next highestquintile
Middlequintile
Next lowest paid quintile
Lowest paidquintile
Top-paid quintile
Next-highest-quintile
Middle-quintile
Next-lowest-paid quintile
Lowest-paid quintile
1985 -1995
53.0
23.0
24.5
14.0 6.5
14.0 22.5 24.0 12.0
5.5 12.5 23.5
53.5
25.0 5.5 4.5 12.032.5 24.0
28.0
33.525.5
5.0 7.5 10.4
Highest quintile
Next highest quintile
Middle quintile
Next lowest-paid quintile
Lowest paid quintile
1994-2004

Household Expenditures and Inequality
• Differences in household expenditures may be a more accurate indicator of economic status than income.• current expenditures reflect long-term
economic status.
• In contrast with the annual income data, household expenditure data do not indicate that there has been a major change in U.S. economic inequality.

5.3 6.2
FemaleBlack
8.3
1959 1976 2000
Number of poor families (millions)
Sources: U.S. Dept. of Commerce, Characteristics of the Population Below the Poverty Line: 1982, Table 5; and Poverty in the United States: 2000, p. 60-214.
48 50 23Percent of poor families headed by a:
Person who worked at least some during the year
Elderly person (aged 65+)30 272614 102255 5370
All familiesMarried-couple families
10.1 8.6 18.5Poverty rate (%)
Whites
Female-headed families7.2 4.715.8
32.5 24.742.6
9.1 9.418.1
Children (under age 18)Blacks 31.1 22.055.1
16.0 16.127.3
Changing Composition of the Poor
7.6
2003
51271048
10.0 5.428.0
10.524.417.6
7.7
2005
5327961
9.9 5.128.7
10.624.917.6
All individuals 11.7
22.4 12.6
7.6
2007
5327948
9.8 4.928.3
10.524.518.0
12.5

Persons
n.a. 22.2 12.6 13.0
11.3
194719601970198019902000
Year Families
32.018.110.110.3
8.713.5 10.7
Poverty rate %
Sources: Bureau of the Census, Current Population Reports, Series P60-210, Poverty in the United States, 2000; and Economic Report of the President, 1964, Table 7.
Poverty Rate of Persons & Familiesin the United States 1947-2000
• During the 1950s and 1960s, the poverty rate declined substantially.
• After rising slightly during the 1970s and 1980s, the official poverty rate has fallen modestly during the economic expansion of the 1990s.
2005 9.9

Transfer Payments and the Poverty Rate
• Income transfers expanded rapidly over the past several decades.
• largely ineffective at reducing the poverty rate. • Though per capita income has increased
substantially over time (109% since 1965), the poverty rate of working-age Americans has stayed about the same.

Government Policies to Reduce Income Inequality
1. Redistribution- taking income from those with higher incomes and
providing income to those with lower incomes
- progressive tax system
designed so the rich pay a higher percent in income taxes
2. The Ladder of Opportunity
- even though all children will never come from identical families and attend identical schools,
- each child has a reasonable opportunity to attain an economic niche in society based on their interests, desires, talents, and efforts

3. Inheritance Taxesa. why should people who have worked hard
all their lives and saved up a substantial nest egg not be able to give their money and possessions to their children and grandchildren?
b. many Americans are far more comfortable with inequality resulting from high-income people who earned their money by starting innovative new companies than they are with inequality resulting from high-income people who have inherited money from rich parents.

Income Transfer Effects
• Income supplements large enough to significantly increase the economic status of poor people will:• encourage behavior that increases the risk of
poverty• Provides a safety net?• create high implicit marginal tax rates that
reduce the recipient’s incentive to earn.• As income goes up, benefits drop off.

1. In 2000, high-income families (the top 20 percent) in the United States earned approximately _________ percent of the total before-tax
income.a. 34 b. 47. c. 62 d. 79
2. Imagine two cities, Engelgrad and Legreeville, where the rich, middle, and poor income recipients in one city have annual incomes identical to their counterparts’ incomes in the other city. In Engelgrad, the poorest families one year almost always end up as the richest families the next year and become middle-income families the year after that. In Legreeville, however, the poor remain poor and the rich remain rich. Which of the following is true about the two cities?
a. Annual data on the distribution of income will indicate that the degree of income inequality in the two cities is identical.
b. The degree of lifetime income inequality in the two cities is identical
c. The income mobility of people in the two cities is identicald. The distribution of annual income is more unequal in Legreeville

3. Compared to low-income families, a larger proportion of high-income familiesa. is headed by a person with a college degreeb. has both a husband and a wife who work full timec. is headed by a person between the ages of 35 and 64d. is all of the above.
4. During 1970 – 2000, the official poverty rate of non-elderly familiesa. fell modestlyb. fell substantiallyc. steadily rose.d. rose until 1985 and fell modestly since then.

5. When a person who receives welfare benefits earns income, those benefits are reduced as earned income rises. This is referred to as
a.an implicit marginal tax.b.the opportunity cost of incomec. the work-leisure trade-offd.reverse discrimination
6. According to the official measure of poverty, in 2000 the poverty rate of families in the US wasa. 4.2%b. 8.6%.c. 18.5%d. 22%

7. The poverty threshold level defines poverty by finding the cost of feeding a family and multiplying by
a. twob. three.c. fourd. five
8. Which of the following would cause the poverty threshold income level for a given family to increase by 20 percent from one year to another?
a. a 20 percent increase in the family’s incomeb. a 20 percent decrease in the family’s incomec. a 20 percent increase in the general level of prices.d. a 20 percent increase in real national income

9. Which of the following best explains why so many persons with incomes below the poverty threshold income level work very little or not at all?
a.They confront high implicit marginal tax rates.b.They do not enjoy income as much as other people.c. There are no jobs for low-skill workers.d.They often face very low explicit marginal tax rates.
10. (I) Positive economics cannot determine how much income inequality should be present in a country.
(II) Critics of government action to reduce income inequality argue that modifying the market process of income determination may create perverse incentives and hurt wealth creation.a. Both I and II are true. b. Both I and II are false.c. I is true; II is false. d. I is false; II is true.

%
Pop
ula
tion
% Income
60
50
40
30
20
10
1 2 3 4 5 60 7 8 9 10
70
80
90
100