in vivo measurement of trabecular meshwork stiffness in a ... · cable to other forms of glaucoma...
TRANSCRIPT
In vivo measurement of trabecular meshwork stiffnessin a corticosteroid-induced ocular hypertensivemouse modelGuorong Lia, Chanyoung Leeb, Vibhuti Agraharic, Ke Wangb, Iris Navarroa, Joseph M. Sherwoodd, Karen Crewse,Sina Farsiua,f, Pedro Gonzaleza, Cheng-Wen Line, Ashim K. Mitrag, C. Ross Ethierb,1, and W. Daniel Stamera,f,1
aDepartment of Ophthalmology, Duke University, Durham, NC 27710; bCoulter Department of Biomedical Engineering, Georgia Institute ofTechnology/Emory University, Atlanta, GA 30332; cDepartment of Biopharmaceutical Sciences, Bernard J Dunn School of Pharmacy, ShenandoahUniversity, Winchester, VA 22601; dDepartment of Bioengineering, Imperial College London, London SW72AZ, United Kingdom; eResearch andDevelopment, Aerie Pharmaceuticals, Inc., Durham, NC 27703; fDepartment of Biomedical Engineering, Duke University, Durham, NC 27710;and gSchool of Pharmacy, University of Missouri-Kansas City, Kansas City, MO 64108
Edited by Joel S. Schuman, New York University, and accepted by Editorial Board Member Jeremy Nathans December 10, 2018 (received for review August29, 2018)
Ocular corticosteroids are commonly used clinically. Unfortunately,their administration frequently leads to ocular hypertension, i.e.,elevated intraocular pressure (IOP), which, in turn, can progress toa form of glaucoma known as steroid-induced glaucoma. Thepathophysiology of this condition is poorly understood yet sharessimilarities with the most common form of glaucoma. Usingnanotechnology, we created a mouse model of corticosteroid-induced ocular hypertension. This model functionally and morpho-logically resembles human ocular hypertension, having titratable,robust, and sustained IOPs caused by increased resistance to aque-ous humor outflow. Using this model, we then interrogated thebiomechanical properties of the trabecular meshwork (TM), includ-ing the inner wall of Schlemm’s canal (SC), tissues known tostrongly influence IOP and to be altered in other forms of glau-coma. Specifically, using spectral domain optical coherence tomog-raphy, we observed that SC in corticosteroid-treated mice wasmore resistant to collapse at elevated IOPs, reflecting increasedTM stiffness determined by inverse finite element modeling. Ournoninvasive approach to monitoring TM stiffness in vivo is appli-cable to other forms of glaucoma and has significant potential tomonitor TM function and thus positively affect the clinical care ofglaucoma, the leading cause of irreversible blindness worldwide.
nanoparticle | glaucoma | optical coherence tomography |finite element modeling | Schlemm’s canal
Due to their antiinflammatory, antiangiogenic, and anti-permeability properties (1), corticosteroids are widely used in
the eye clinic to treat a variety of disorders, such as macular edema,age-related macular degeneration, diabetic retinopathy, and uveitis(2–7), and, after cataract surgery, to reduce inflammation (8).Unfortunately, ocular hypertension [elevated intraocular pressure(IOP)] is the major adverse event following ocular corticosteroidtreatment, occurring in a dose-dependent manner regardless ofdelivery route. If left untreated, ocular hypertension typically leadsto irreversible glaucomatous vision loss (9).To understand the processes that underlie corticosteroid-
induced ocular hypertension, animal models have been de-veloped in several species (10–22). Here we focus on the mouse,which has several important advantages over other nonprimatespecies for studying ocular hypertension. Notably, the murineconventional outflow pathway, central to controlling IOP andcomprising the trabecular meshwork (TM) and Schlemm’s canal(SC), is remarkably similar to the human outflow pathway in itsanatomy and physiology. Further, recent data from our groupusing atomic force microscopy in excised eyes has shown that theTM is stiffer in corticosteroid-induced ocular hypertensive mice,similar to the increased stiffness observed in TM/inner wall ofSC of human eyes with primary open-angle glaucoma (23, 24). In
fact, we have shown that a significant positive correlation existsbetween outflow resistance and TM stiffness in both humans andmice, including in corticosteroid-treated mice (24, 25).Several corticosteroid-induced ocular hypertension mouse
models have been created using either systemic or topical routesof delivery (18, 20–22). However, each model has drawbacks,including technical demands, modest efficacy, adverse events, orlimited duration. To achieve slow, sustained, and controlled re-lease of a potent synthetic corticosteroid [dexamethasone (DEX)],we previously used the Federal Drug Administration-approvedbiodegradable polymers polycaprolactone (PCL), polylactic acid(PLA), polyglycolic acid (PGA), polyethylene glycol (PEG) andpolylactide-co-glycolide (PLGA) (26, 27) to construct a nanoparticle(NP) pentablock (PB) copolymer (PGA−PCL−PEG−PCL−PGA)and encapsulate DEX (28).In the current study, the effects of DEX delivered by our NP
formulation were examined in vivo. Specifically, we used multiple
Significance
Glaucoma is the leading cause of irreversible blindness world-wide. The primary and only modifiable risk factor for the de-velopment of glaucoma is elevated intraocular pressure (IOP),and lowering IOP effectively slows glaucomatous disease pro-gression. Unfortunately, the majority of available treatmentsdo not target, or intentionally bypass, the diseased and stiff-ened glaucomatous outflow tissues responsible for IOP eleva-tion. We recently established that conventional outflow tissuestiffness reflects tissue function. Therefore, detection of out-flow tissue stiffness using noncontact, noninvasive optical co-herence tomography, as we here demonstrate in an animalmodel of glaucoma, represents a valuable tool for assessingoutflow tissue functional status. Such technology has the po-tential to monitor recently approved treatments targeting theoutflow tissues, and to inform glaucoma surgery decisions.
Author contributions: G.L., J.M.S., S.F., P.G., C.-W.L., A.K.M., C.R.E., and W.D.S. designedresearch; G.L., C.L., V.A., K.W., I.N., K.C., and C.R.E. performed research; V.A., K.C., S.F.,C.-W.L., A.K.M., C.R.E., and W.D.S. contributed new reagents/analytic tools; G.L., C.L.,K.W., I.N., J.M.S., S.F., P.G., C.-W.L., A.K.M., C.R.E., and W.D.S. analyzed data; and G.L.,C.L., K.W., J.M.S., K.C., C.R.E., and W.D.S. wrote the paper.
The authors declare no conflict of interest.
This article is a PNAS Direct Submission. J.S.S. is a guest editor invited by the Editorial Board.
This open access article is distributed under Creative Commons Attribution-NonCommercial-NoDerivatives License 4.0 (CC BY-NC-ND).1To whom correspondence may be addressed. Email: [email protected] or [email protected].
This article contains supporting information online at www.pnas.org/lookup/suppl/doi:10.1073/pnas.1814889116/-/DCSupplemental.
Published online January 16, 2019.
1714–1722 | PNAS | January 29, 2019 | vol. 116 | no. 5 www.pnas.org/cgi/doi/10.1073/pnas.1814889116
approaches to study how DEX-loaded NPs (DEX-NPs) affectedIOP, and corresponding changes in TM/SC biomechanics, fluidconductivity and morphology. We found that our DEX-loadedNPs elevated daytime IOPs to levels not observed previously inmouse models of steroid glaucoma. Moreover, spectral domainoptical coherence tomography (SD-OCT) revealed that de-formation of TM/SC due to changes in IOP was significantlyattenuated in DEX-NP−treated mice. We then conducted in-verse finite element modeling (FEM) to quantify increases inTM stiffness due to DEX-NPs. These findings suggest that SD-OCT−based noninvasive measurements of TM/SC stiffness canserve as a viable surrogate to assess the (dys)function of con-ventional outflow tissues in the eye, and establish a useful mousemodel for better understanding the pathophysiology of steroid-induced and primary open-angle glaucoma.
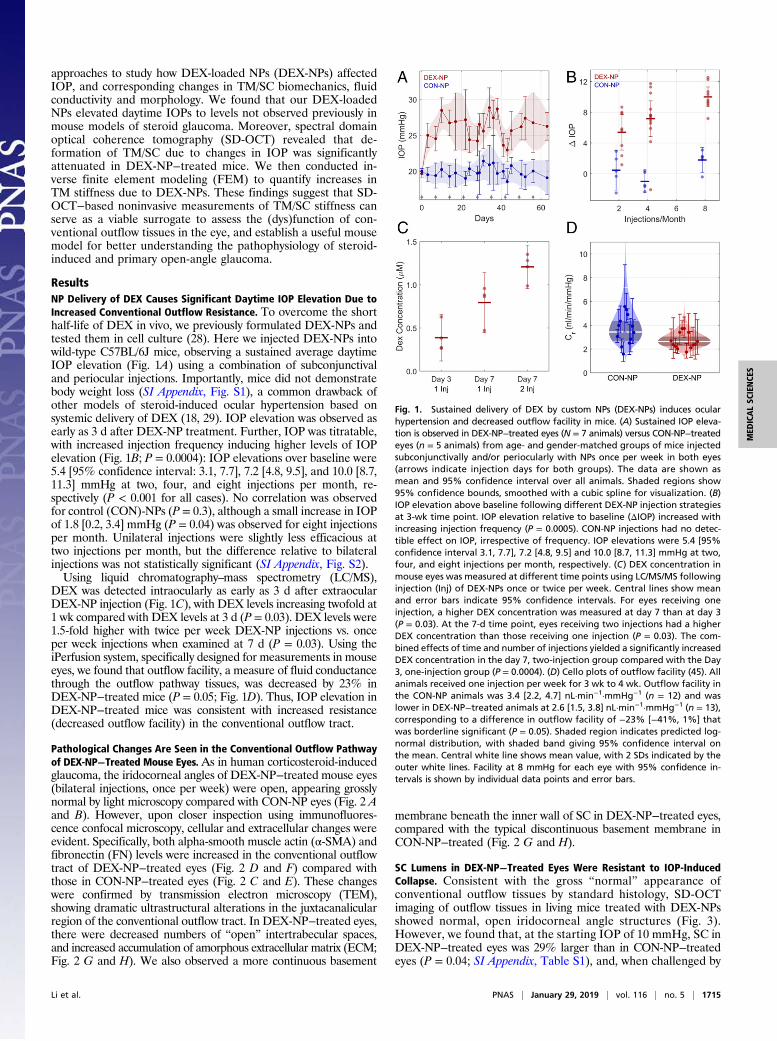
ResultsNP Delivery of DEX Causes Significant Daytime IOP Elevation Due toIncreased Conventional Outflow Resistance. To overcome the shorthalf-life of DEX in vivo, we previously formulated DEX-NPs andtested them in cell culture (28). Here we injected DEX-NPs intowild-type C57BL/6J mice, observing a sustained average daytimeIOP elevation (Fig. 1A) using a combination of subconjunctivaland periocular injections. Importantly, mice did not demonstratebody weight loss (SI Appendix, Fig. S1), a common drawback ofother models of steroid-induced ocular hypertension based onsystemic delivery of DEX (18, 29). IOP elevation was observed asearly as 3 d after DEX-NP treatment. Further, IOP was titratable,with increased injection frequency inducing higher levels of IOPelevation (Fig. 1B; P = 0.0004): IOP elevations over baseline were5.4 [95% confidence interval: 3.1, 7.7], 7.2 [4.8, 9.5], and 10.0 [8.7,11.3] mmHg at two, four, and eight injections per month, re-spectively (P < 0.001 for all cases). No correlation was observedfor control (CON)-NPs (P = 0.3), although a small increase in IOPof 1.8 [0.2, 3.4] mmHg (P = 0.04) was observed for eight injectionsper month. Unilateral injections were slightly less efficacious attwo injections per month, but the difference relative to bilateralinjections was not statistically significant (SI Appendix, Fig. S2).Using liquid chromatography–mass spectrometry (LC/MS),
DEX was detected intraocularly as early as 3 d after extraocularDEX-NP injection (Fig. 1C), with DEX levels increasing twofold at1 wk compared with DEX levels at 3 d (P = 0.03). DEX levels were1.5-fold higher with twice per week DEX-NP injections vs. onceper week injections when examined at 7 d (P = 0.03). Using theiPerfusion system, specifically designed for measurements in mouseeyes, we found that outflow facility, a measure of fluid conductancethrough the outflow pathway tissues, was decreased by 23% inDEX-NP−treated mice (P = 0.05; Fig. 1D). Thus, IOP elevation inDEX-NP−treated mice was consistent with increased resistance(decreased outflow facility) in the conventional outflow tract.
Pathological Changes Are Seen in the Conventional Outflow Pathwayof DEX-NP−Treated Mouse Eyes.As in human corticosteroid-inducedglaucoma, the iridocorneal angles of DEX-NP−treated mouse eyes(bilateral injections, once per week) were open, appearing grosslynormal by light microscopy compared with CON-NP eyes (Fig. 2 Aand B). However, upon closer inspection using immunofluores-cence confocal microscopy, cellular and extracellular changes wereevident. Specifically, both alpha-smooth muscle actin (α-SMA) andfibronectin (FN) levels were increased in the conventional outflowtract of DEX-NP−treated eyes (Fig. 2 D and F) compared withthose in CON-NP−treated eyes (Fig. 2 C and E). These changeswere confirmed by transmission electron microscopy (TEM),showing dramatic ultrastructural alterations in the juxtacanalicularregion of the conventional outflow tract. In DEX-NP−treated eyes,there were decreased numbers of “open” intertrabecular spaces,and increased accumulation of amorphous extracellular matrix (ECM;Fig. 2 G and H). We also observed a more continuous basement
membrane beneath the inner wall of SC in DEX-NP−treated eyes,compared with the typical discontinuous basement membrane inCON-NP−treated (Fig. 2 G and H).
SC Lumens in DEX-NP−Treated Eyes Were Resistant to IOP-InducedCollapse. Consistent with the gross “normal” appearance ofconventional outflow tissues by standard histology, SD-OCTimaging of outflow tissues in living mice treated with DEX-NPsshowed normal, open iridocorneal angle structures (Fig. 3).However, we found that, at the starting IOP of 10 mmHg, SC inDEX-NP−treated eyes was 29% larger than in CON-NP−treatedeyes (P = 0.04; SI Appendix, Table S1), and, when challenged by
Fig. 1. Sustained delivery of DEX by custom NPs (DEX-NPs) induces ocularhypertension and decreased outflow facility in mice. (A) Sustained IOP eleva-tion is observed in DEX-NP−treated eyes (N = 7 animals) versus CON-NP−treatedeyes (n = 5 animals) from age- and gender-matched groups of mice injectedsubconjunctivally and/or periocularly with NPs once per week in both eyes(arrows indicate injection days for both groups). The data are shown asmean and 95% confidence interval over all animals. Shaded regions show95% confidence bounds, smoothed with a cubic spline for visualization. (B)IOP elevation above baseline following different DEX-NP injection strategiesat 3-wk time point. IOP elevation relative to baseline (ΔIOP) increased withincreasing injection frequency (P = 0.0005). CON-NP injections had no detec-tible effect on IOP, irrespective of frequency. IOP elevations were 5.4 [95%confidence interval 3.1, 7.7], 7.2 [4.8, 9.5] and 10.0 [8.7, 11.3] mmHg at two,four, and eight injections per month, respectively. (C) DEX concentration inmouse eyes was measured at different time points using LC/MS/MS followinginjection (Inj) of DEX-NPs once or twice per week. Central lines show meanand error bars indicate 95% confidence intervals. For eyes receiving oneinjection, a higher DEX concentration was measured at day 7 than at day 3(P = 0.03). At the 7-d time point, eyes receiving two injections had a higherDEX concentration than those receiving one injection (P = 0.03). The com-bined effects of time and number of injections yielded a significantly increasedDEX concentration in the day 7, two-injection group compared with the Day3, one-injection group (P = 0.0004). (D) Cello plots of outflow facility (45). Allanimals received one injection per week for 3 wk to 4 wk. Outflow facility inthe CON-NP animals was 3.4 [2.2, 4.7] nL·min−1·mmHg−1 (n = 12) and waslower in DEX-NP−treated animals at 2.6 [1.5, 3.8] nL·min−1·mmHg−1 (n = 13),corresponding to a difference in outflow facility of −23% [−41%, 1%] thatwas borderline significant (P = 0.05). Shaded region indicates predicted log-normal distribution, with shaded band giving 95% confidence interval onthe mean. Central white line shows mean value, with 2 SDs indicated by theouter white lines. Facility at 8 mmHg for each eye with 95% confidence in-tervals is shown by individual data points and error bars.
Li et al. PNAS | January 29, 2019 | vol. 116 | no. 5 | 1715
MED
ICALSC
IENCE
S
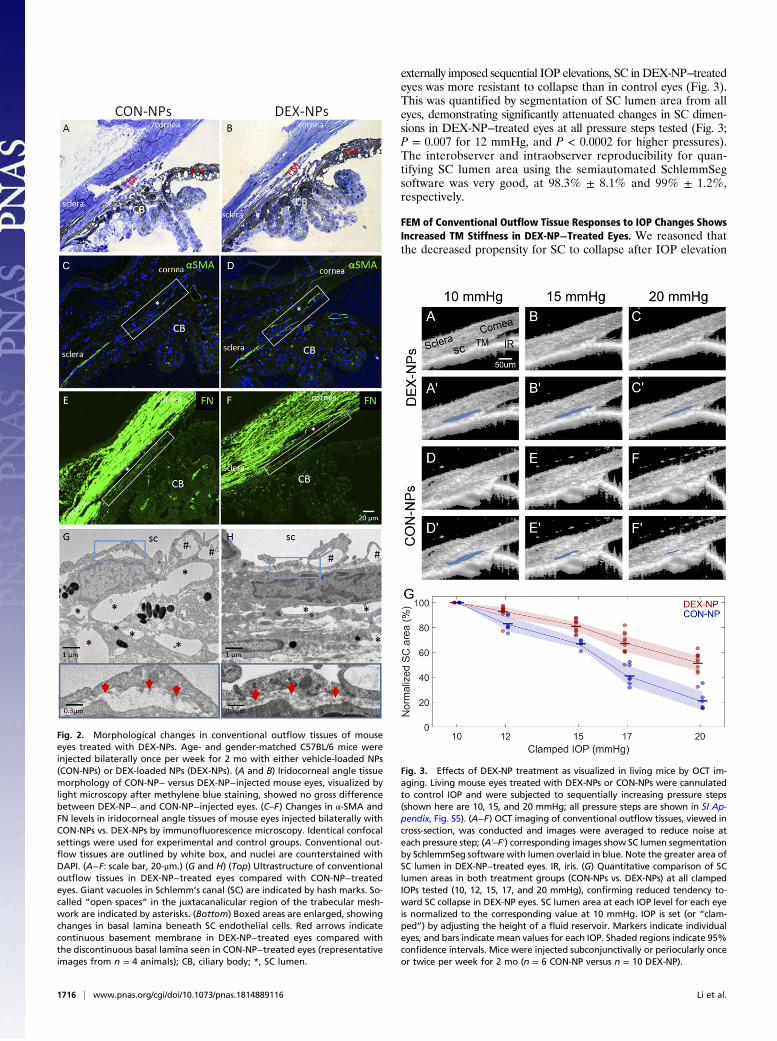
externally imposed sequential IOP elevations, SC in DEX-NP−treatedeyes was more resistant to collapse than in control eyes (Fig. 3).This was quantified by segmentation of SC lumen area from alleyes, demonstrating significantly attenuated changes in SC dimen-sions in DEX-NP−treated eyes at all pressure steps tested (Fig. 3;P = 0.007 for 12 mmHg, and P < 0.0002 for higher pressures).The interobserver and intraobserver reproducibility for quan-tifying SC lumen area using the semiautomated SchlemmSegsoftware was very good, at 98.3% ± 8.1% and 99% ± 1.2%,respectively.
FEM of Conventional Outflow Tissue Responses to IOP Changes ShowsIncreased TM Stiffness in DEX-NP−Treated Eyes. We reasoned thatthe decreased propensity for SC to collapse after IOP elevation
Fig. 2. Morphological changes in conventional outflow tissues of mouseeyes treated with DEX-NPs. Age- and gender-matched C57BL/6 mice wereinjected bilaterally once per week for 2 mo with either vehicle-loaded NPs(CON-NPs) or DEX-loaded NPs (DEX-NPs). (A and B) Iridocorneal angle tissuemorphology of CON-NP− versus DEX-NP−injected mouse eyes, visualized bylight microscopy after methylene blue staining, showed no gross differencebetween DEX-NP− and CON-NP−injected eyes. (C–F) Changes in α-SMA andFN levels in iridocorneal angle tissues of mouse eyes injected bilaterally withCON-NPs vs. DEX-NPs by immunofluorescence microscopy. Identical confocalsettings were used for experimental and control groups. Conventional out-flow tissues are outlined by white box, and nuclei are counterstained withDAPI. (A−F: scale bar, 20-μm.) (G and H) (Top) Ultrastructure of conventionaloutflow tissues in DEX-NP−treated eyes compared with CON-NP−treatedeyes. Giant vacuoles in Schlemm’s canal (SC) are indicated by hash marks. So-called “open spaces” in the juxtacanalicular region of the trabecular mesh-work are indicated by asterisks. (Bottom) Boxed areas are enlarged, showingchanges in basal lamina beneath SC endothelial cells. Red arrows indicatecontinuous basement membrane in DEX-NP−treated eyes compared withthe discontinuous basal lamina seen in CON-NP−treated eyes (representativeimages from n = 4 animals); CB, ciliary body; *, SC lumen.
Fig. 3. Effects of DEX-NP treatment as visualized in living mice by OCT im-aging. Living mouse eyes treated with DEX-NPs or CON-NPs were cannulatedto control IOP and were subjected to sequentially increasing pressure steps(shown here are 10, 15, and 20 mmHg; all pressure steps are shown in SI Ap-pendix, Fig. S5). (A−F) OCT imaging of conventional outflow tissues, viewed incross-section, was conducted and images were averaged to reduce noise ateach pressure step; (A′–F′) corresponding images show SC lumen segmentationby SchlemmSeg software with lumen overlaid in blue. Note the greater area ofSC lumen in DEX-NP−treated eyes. IR, iris. (G) Quantitative comparison of SClumen areas in both treatment groups (CON-NPs vs. DEX-NPs) at all clampedIOPs tested (10, 12, 15, 17, and 20 mmHg), confirming reduced tendency to-ward SC collapse in DEX-NP eyes. SC lumen area at each IOP level for each eyeis normalized to the corresponding value at 10 mmHg. IOP is set (or “clam-ped”) by adjusting the height of a fluid reservoir. Markers indicate individualeyes, and bars indicate mean values for each IOP. Shaded regions indicate 95%confidence intervals. Mice were injected subconjunctivally or periocularly onceor twice per week for 2 mo (n = 6 CON-NP versus n = 10 DEX-NP).
1716 | www.pnas.org/cgi/doi/10.1073/pnas.1814889116 Li et al.
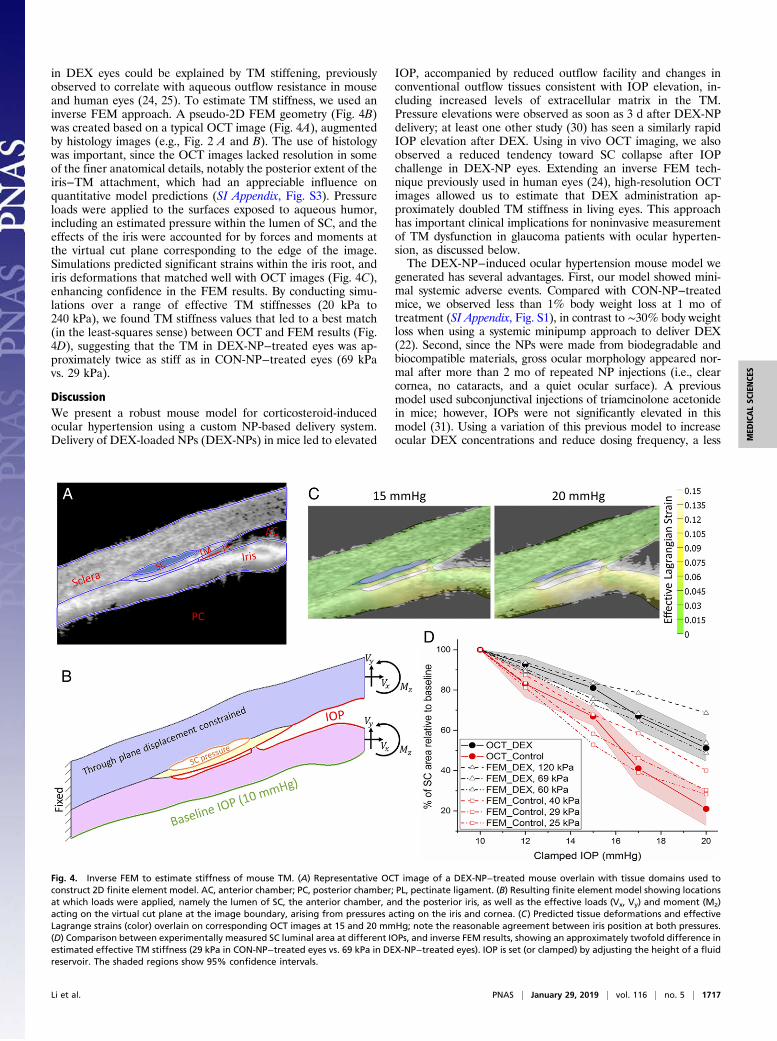
in DEX eyes could be explained by TM stiffening, previouslyobserved to correlate with aqueous outflow resistance in mouseand human eyes (24, 25). To estimate TM stiffness, we used aninverse FEM approach. A pseudo-2D FEM geometry (Fig. 4B)was created based on a typical OCT image (Fig. 4A), augmentedby histology images (e.g., Fig. 2 A and B). The use of histologywas important, since the OCT images lacked resolution in someof the finer anatomical details, notably the posterior extent of theiris−TM attachment, which had an appreciable influence onquantitative model predictions (SI Appendix, Fig. S3). Pressureloads were applied to the surfaces exposed to aqueous humor,including an estimated pressure within the lumen of SC, and theeffects of the iris were accounted for by forces and moments atthe virtual cut plane corresponding to the edge of the image.Simulations predicted significant strains within the iris root, andiris deformations that matched well with OCT images (Fig. 4C),enhancing confidence in the FEM results. By conducting simu-lations over a range of effective TM stiffnesses (20 kPa to240 kPa), we found TM stiffness values that led to a best match(in the least-squares sense) between OCT and FEM results (Fig.4D), suggesting that the TM in DEX-NP−treated eyes was ap-proximately twice as stiff as in CON-NP−treated eyes (69 kPavs. 29 kPa).
DiscussionWe present a robust mouse model for corticosteroid-inducedocular hypertension using a custom NP-based delivery system.Delivery of DEX-loaded NPs (DEX-NPs) in mice led to elevated
IOP, accompanied by reduced outflow facility and changes inconventional outflow tissues consistent with IOP elevation, in-cluding increased levels of extracellular matrix in the TM.Pressure elevations were observed as soon as 3 d after DEX-NPdelivery; at least one other study (30) has seen a similarly rapidIOP elevation after DEX. Using in vivo OCT imaging, we alsoobserved a reduced tendency toward SC collapse after IOPchallenge in DEX-NP eyes. Extending an inverse FEM tech-nique previously used in human eyes (24), high-resolution OCTimages allowed us to estimate that DEX administration ap-proximately doubled TM stiffness in living eyes. This approachhas important clinical implications for noninvasive measurementof TM dysfunction in glaucoma patients with ocular hyperten-sion, as discussed below.The DEX-NP−induced ocular hypertension mouse model we
generated has several advantages. First, our model showed mini-mal systemic adverse events. Compared with CON-NP−treatedmice, we observed less than 1% body weight loss at 1 mo oftreatment (SI Appendix, Fig. S1), in contrast to ∼30% body weightloss when using a systemic minipump approach to deliver DEX(22). Second, since the NPs were made from biodegradable andbiocompatible materials, gross ocular morphology appeared nor-mal after more than 2 mo of repeated NP injections (i.e., clearcornea, no cataracts, and a quiet ocular surface). A previousmodel used subconjunctival injections of triamcinolone acetonidein mice; however, IOPs were not significantly elevated in thismodel (31). Using a variation of this previous model to increaseocular DEX concentrations and reduce dosing frequency, a less
Fig. 4. Inverse FEM to estimate stiffness of mouse TM. (A) Representative OCT image of a DEX-NP−treated mouse overlain with tissue domains used toconstruct 2D finite element model. AC, anterior chamber; PC, posterior chamber; PL, pectinate ligament. (B) Resulting finite element model showing locationsat which loads were applied, namely the lumen of SC, the anterior chamber, and the posterior iris, as well as the effective loads (Vx, Vy) and moment (Mz)acting on the virtual cut plane at the image boundary, arising from pressures acting on the iris and cornea. (C) Predicted tissue deformations and effectiveLagrange strains (color) overlain on corresponding OCT images at 15 and 20 mmHg; note the reasonable agreement between iris position at both pressures.(D) Comparison between experimentally measured SC luminal area at different IOPs, and inverse FEM results, showing an approximately twofold difference inestimated effective TM stiffness (29 kPa in CON-NP−treated eyes vs. 69 kPa in DEX-NP−treated eyes). IOP is set (or clamped) by adjusting the height of a fluidreservoir. The shaded regions show 95% confidence intervals.
Li et al. PNAS | January 29, 2019 | vol. 116 | no. 5 | 1717
MED
ICALSC
IENCE
S
soluble DEX-21-acetate preparation was applied to mouse eyes bysubconjuntival/periocular injection once per week for 4 wk. IOPwas elevated as early as 1 wk without body weight loss (20). Thelocal tolerability and/or biocompatibility of these crystals was notreported. Third, IOP levels in our model can be titrated by usingvarious DEX-NP injection frequencies. For example, when usingtwice per month injections, we obtained daytime IOP elevations of∼5 mmHg, while eight times per month injections elevated IOP byup to ∼10 mmHg. Importantly, DEX-treated eyes also displayedthe major hallmarks of corticosteroid-induced ocular hyperten-sion in humans, including decreased outflow facility, increasedα-SMA−positive cells and FN in the outflow tract, and increaseddeposition of ECM in the juxtacanalicular region of the TM(ref. 22 and Figs. 1D and 2).Surprisingly, we observed contralateral effects, i.e., ocular hy-
pertension in the noninjected contralateral eye, when animals wereinjected unilaterally with DEX-NPs in early experiments (SI Ap-pendix, Fig. S4). We cannot fully explain this finding, but we hy-pothesize that there may be venous or lymphatic communicationbetween eyes. Interestingly, all three previous reports of ocularhypertension with local administration of DEX treated both eyesbut did not comment on contralateral effects (20, 21, 32). Thus, wecarried out injections bilaterally for all subsequent experiments.Using our inverse FEM approach, we estimated the average
TM stiffness in a living DEX-treated mouse eye to be 69 kPa,which is comparable to the stiffness of human glaucomatous TMwe previously reported (79 kPa to 123 kPa) (24). It is importantto note that the TM stiffness in DEX-treated mice that we reporthere is much higher than direct atomic force microscopy mea-surements of TM stiffness performed in this same model (DEX-treated: 2.38 ± 1.31 kPa; control: 1.99 ± 0.91 kPa). This is con-sistent with a previous report on human eyes in which TMstiffness measured by atomic force microscopy (AFM) was muchless than, but closely correlated with, TM stiffness determined byan inverse FEM approach (24). Methodological differenceslikely explain these estimates. Specifically, in the inverse FEMapproach, the TM was intact and was primarily stretched in thecircumferential direction as IOP increased. In AFM studies, theTM was dissected from the eye and measured in a 10-μm-thickcryosection, primarily in compression. It is well known that theTM is under tension due to ciliary muscle tone (22) and that softconnective tissues are less stiff in compression than in tension(33). It is also important to note that the specific values of TMstiffness estimated by this approach were sensitive to fineanatomic details, particularly the location where the TM andiris merge posteriorly. Thus, although we report values foreffective TM stiffnesses based on our best determination of theappropriate anatomy, a more robust outcome is the ratio ofstiffnesses in DEX-NP− vs. CON-NP−treated eyes, whichshowed a consistent increase over a range of anatomic details.The ability to estimate changes in TM stiffness using a com-
pletely noninvasive approach based on OCT imaging and FEM isan intriguing aspect of this work. Our approach can be catego-rized as a modified form of optical coherence elastographytechnology (34–38), which has been previously shown to beimpactful for assessment of tissue elasticity in the anterior seg-ment of the eye. In our approach, instead of utilizing externalstatic or dynamic sources of displacements to mechanically loadocular tissue (e.g., air puff), we apply stress to the tissues by el-evating IOP. We also exploit the unique anatomy of the outflowtract and monitor the collapse of SC, rather than trackingspeckle patterns or employing other approaches to deduce localtissue strains. Thus, the mechanical properties that we infershould be interpreted as a spatially averaged value, ignoringlocal heterogeneities.Several groups, including ours, have reported that TM stiff-
ness positively correlates with increased outflow resistance incorticosteroid-induced ocular hypertensive mice (25), as well as
in glaucomatous human donor eyes (24). The implication is that,since TM stiffness seems to be directly linked to conventionaloutflow function (25), detection of TM stiffness in living eyesmay be clinically important, an observation that motivates fur-ther development of this technique. In another study, Pant et al.(39) estimated the stiffness of human TM in vivo using a FEMstrategy similar to ours, finding a TM shear modulus of 1.93 kPa(approximately equivalent to an elastic modulus of 5.75 kPa) forthe one sample they examined. Another study using a simplifiedbeam-bending model based on in vivo changes in TM and SCdeformation predicted a human TM stiffness (128 kPa) some-what close to our estimates (40). However, in both of the abovestudies, pressure inside SC was not considered.Recent advances in OCT imaging and image processing are
important here: The high-resolution SD-OCT images of themouse outflow tissues allowed us to determine reasonably clearboundaries of SC lumen, as reflected in the high interoperatorand intraoperator repeatability of the SC segmentations. In viewof the discussion above, further advances, specifically permittingmore precise determination of the location where the iris andTM merge, would be beneficial and represent a future researchtarget. Importantly, the larger human eye with its more openangle should be less prone to existing imaging limitations, sug-gesting that the combination of OCT imaging with inverse FEMis currently viable as a research tool to assess TM function inhuman eyes and could ultimately be developed into a clinicallyuseful technique. Specifically, if TM tissue stiffness could bemonitored in vivo using noncontact and noninvasive methods,the eye’s outflow function could be accurately estimated, inform-ing personalized treatment decisions. We envision this technologybeing applied to human eyes, where IOP is temporarily mani-pulated, e.g., after water drinking test or by external compressionof the eye, while outflow tissues are imaged by OCT. Such atechnique could serve as a more patient-friendly alternative totonography (41) to assess TM function and status in glaucomapatients. It could also allow longitudinal tracking of TM stiffnessin glaucoma patients to help monitor response to treatment and/or understand whether stiffening precedes ocular hypertension,or vice versa.In future experiments involving mice, we are interested in
examining the effects of aging and drug treatments on TM stiff-ness in vivo. It would be beneficial to know the range of stiffnessesthat can be resolved in vivo using our OCT/FEM technology andcompare stiffness determined in this way to outflow facility and tostiffnesses directly measured by AFM, as previously (25). For ex-ample, we would like to determine TM stiffnesses in rho kinaseinhibitor-treated, untreated, and DEX-treated eyes, both in youngand aged mice.The present study had two primary limitations. Due to tech-
nical issues ultimately arising from the extreme precision re-quired for accurate outflow facility measurements in the mouse,it was not feasible to measure outflow facility and to also esti-mate TM stiffness on a per-animal basis. However, in a previousstudy (25) conducted with the same mouse strain and using thesame protocol executed by the same person (G.L.), we showed astrong correlation between outflow facility and TM stiffness asmeasured directly by AFM, which powerfully supports the linkbetween these two parameters in the present study. Moreover,we compared IOP in DEX-NP mice from our previous study (25)vs. DEX-NP mice in the present study, and also compared IOPin CON-NP mice from the previous study vs. CON-NP mice inthe present study, and found no statistical difference between thegroups (P > 0.05 for both comparisons; unpaired t tests). Thisfurther supports the inference that TM stiffness, measured as wedescribe in the present manuscript, is related to outflow facility.A second limitation is that we only assessed one circumferentialposition in the inferior nasal region of each mouse eye. We chosethis position due to reliable access in visualizing SC and because
1718 | www.pnas.org/cgi/doi/10.1073/pnas.1814889116 Li et al.
we regularly found the SC lumen open, meaning that it likelycoincided with an active flow region of the TM.In conclusion, we have developed a biodegradable, bio-
compatible NP-based delivery system to generate a reliable andconvenient DEX-induced mouse model of ocular hypertension.In this model, IOP levels can be controlled and maintained.Significantly, we detected and accurately estimated changes inconventional outflow tissue stiffness using OCT imaging coupledwith FEM. Such advancements have potential clinical implica-tions for early diagnosis, treatment, and prevention of vision lossin those with glaucoma.
Materials and MethodsAnimals.Mice were handled in accordance with an approved protocol (A020-16-02) by Institutional Animal Care and Use Committee of Duke Universityand in compliance with the Association for Research in Vision andOphthalmology (ARVO) Statement for the Use of Animals in Ophthalmicand Vision Research. C57BL/6 (C57) mice were purchased from theJackson Laboratory, bred/housed in clear cages, and kept in housingrooms at 21 °C with a 12 h:12 h light:dark cycle. Mice were between 3 moand 4 mo of age when experiments were initiated. Animal usage numbersand distribution are summarized in SI Appendix, Table S2.
DEX-NP or CON-NP Injections. DEX-NPs or CON-NPs were prepared as described(28). Briefly, PB copolymer of PGA−PCL−PEG−PCL−PGA) was synthesized bysequential ring-opening polymerization reaction. DEX-loaded PB copolymerNPs were prepared in the size range of ∼110 nm by oil-in-water single-emulsionsolvent evaporation method. DEX-NPs or CON-NPs were diluted in PBS to a finalNP concentration of 50 μg/μL, vortexed for 10 min, and then sonicated for10 min. Mice were anesthetized with 100 mg/10 mg/kg of ketamine/xylazine.Then 20 μL of the NP suspension, containing 1mg of NPswith ∼23 μg of DEX (orno DEX in control eyes), were slowly injected into either the superior or inferiorsubconjunctival or periocular spaces of a single eye or both eyes of mice usinga 30-gauge needle with a Hamilton glass microsyringe (50-μL volume; HamiltonCompany). Specifically, the initial two injections were subconjunctival, whilesubsequent injections were periocular to avoid complication of leaks followingrepeated subconjunctival injections. In experiments involving unilateral in-jections of DEX-NPs, a separate cohort of mice were used as controls,receiving unilateral injection of CON-NPs (SI Appendix, Fig. S2). Afterwithdrawing the needle, Neomycin plus Polymyxin B Sulfate antibioticointment was applied to the eyes, and mice recovered on a warm pad.
Intraocular Pressure Measurements. The mice were anesthetized with ket-amine (60 mg/kg) and xylazine (6 mg/kg). IOP was measured immediatelyupon cessation of movement (i.e., in light sleep) using rebound tonometry(TonoLab; Icare) between 1000 hours and 1300 hours (22, 42–44). Eachrecorded IOP was the average of six measurements, giving a total of 36 re-bounds from the same eye per recorded IOP value. IOP measurements wereconducted twice per week.
Outflow Facility Measurements. At designated time points, mice were killedusing isoflurane, and eyes were carefully enucleated and mounted on astabilization platform located in the center of a perfusion chamber using asmall amount of cyanoacrylate glue (Loctite). The perfusion chamber wasfilled with prewarmed Dulbecco’s PBS with added 5.5 mM D-glucose (DBG),submerging the eyes and regulating temperature at 35 °C. Two glassmicroneedles, back-filled with filtered DBG, were connected to the system.Using micromanipulators, one microneedle was inserted into each anteriorchamber of paired eyes without contacting the irides. Both eyes were per-fused at 9 mmHg for 30 min to allow acclimatization and stabilization,followed by perfusion at nine sequential pressure steps of 4.5, 6, 7.5, 9, 10.5,12, 15, 18, and 21 mmHg. Poor-quality steps and subsequent pressure stepswere eliminated. Stable flow rate (Q) and pressure (P) averaged over 4 minat each pressure step were used for data analysis (43–45). A nonlinear flow-pressure model [Q = Cr(P/Pr)
βP] that accounts for the pressure dependence ofoutflow facility in mice (β) was fit to the flow-pressure data using nonlinearregression, yielding the facility Cr evaluated at Pr = 8 mmHg, a pressure thatapproximates the physiological pressure drop across the conventional out-flow pathway in living mice.
Measurements of DEX Concentration in Mouse Eyes. DEX-NPs (1.5 mg NPs/30 μLof PBS) containing ∼35 μg of DEX were injected bilaterally into the sub-conjunctival/periocular space in mice once or twice per week. Note that, for
these experiments, we used a slightly greater volume of DEX-NPs than inother experiments, since DEX concentrations after our standard injectionswere below the detection limit of LC/MS/MS analysis. Three or seven daysafter DEX-NP injection, mice were killed using isoflurane, the eyes wereenucleated, and the conjunctiva, Tenon’s capsule, extraocular muscles, fattytissues, and optic nerves were dissected free to isolate the globes, whichwere then rinsed in PBS. Eight naive C57BL/6 eyes were prepared using thesame methods as controls. The whole eyes were frozen on dry ice and keptat −80 °C until DEX concentration measurements were performed. The eyeswere weighed and transferred to bead mill tubes. A diluent consisting of50:50 acetonitrile:water was added to tubes, and a bead mill was used tobreak up the tissue and extract DEX. Samples were then centrifuged beforeanalysis. DEX levels in the supernatant were measured using LC/MS/MS, us-ing a Bruker Elute UHPLC system coupled with a Bruker EVOQ Elite triplequadrupole mass spectrometer in multiple reaction monitoring mode.Method conditions for compound elution utilized a Waters XBridge BEHC18 column and water/acetonitrile mobile phase modified with formic acid.A calibration curve was prepared over the range of 1 ng/mL to 100 ng/mL byadding DEX to the samples prepared from C57 naïve eyes.
Histology, Immunohistochemistry, and TEM. Eight weeks after DEX-NP or CON-NP treatment (1 mg NP/20 μL of PBS, once per week injection bilaterally),animals were killed using isoflurane, and eyes were collected and immersion-fixed in 4% paraformaldehyde at 4 °C overnight. The eyes were then bisected,and the posterior segments and lenses were removed. The anterior segmentswere cut into four quadrants. For gross morphology studies of outflow tissues,each quadrant was embedded in Epon, and 0.5-μm semithin sections werecut, stained with 1% methylene blue, and examined by light microscopy(Axioplan2; Carl Zeiss MicroImaging). For immnunostaining, each quad-rant was embedded into LR-White, and 1-μm sections were cut and im-munostained with antibodies that specifically recognized either α-SMA(1:100 dilution, rabbit polyclonal, ab5694; Abcam) or FN (1:50 dilution, mousemonoclonal; Santa Cruz). The secondary antibodies were peroxidase-conjugatedAnffiniPure Goat Anti-Rabbit or mouse IgG H&L (Alexa Fluor 488; JacksonImmunoResearch Laboratories) at 1:500 dilution. Images were captured us-ing a Nikon Eclipse 90i confocal laser-scanning microscope (Melville). Imagesfrom experimental and control samples were collected at identical intensityand gain settings (z stacks of seven 0.5-μm optical sections for each image)(44). For electron microscopy studies, mouse anterior segments were embed-ded in Epon resin, and 65-nm sagittal sections were cut through iridocornealtissues using an ultramicrotome (LEICA EM UC6, A-1170; Leica MikrosystemeGmbH). Sections were stained with uranyl acetate/lead citrate and examinedwith a JEM-1400 electron microscope (JEOL USA).
Optical Coherence Tomographic Imaging. In vivo imaging utilized an EnvisuR2200 high-resolution SD-OCT system (Bioptigen Inc.). We followed ourpreviously established techniques to image iridocorneal angle structures inmice (22, 42, 43, 46). Briefly, after 2 mo of treatment with either CON-NPs orDEX-NPs, mice were anesthetized with ketamine (100 mg/kg)/xylazine(10 mg/kg) and maintained with ketamine (60 mg/kg) every 20 min by IPadministration. While mice were secured in a custom-made platform, asingle pulled glass microneedle filled with PBS was inserted into the anteriorchamber of one eye. The microneedle was connected to both a manometriccolumn to adjust IOP and a pressure transducer to continuously monitor IOPlevels using PowerLab software. Our custom platform also provided a con-sistent angle between the imaging probe and the head of different mice.The OCT imaging probe was aimed at the nasal or temporal limbus, and theimage was centered and focused on the SC lumen. While collecting images,mouse eyes were subjected to a series of IOP steps (10, 12, 15, 17, and20 mmHg) by adjusting the height of the fluid reservoir. At each IOP step, asequence of repeated OCT B scans (each with 1,000 A scans spanning 0.5 mmin lateral length) from spatially close positions was captured, registered, andaveraged to create a high signal-to-noise-ratio image from the iridocornealangle region of each animal. The duration of each pressure step was ∼1 minto 2 min. All imaging sessions were conducted by the same person (G.L.).
Segmentation of OCT Images. OCT B scans of iridocorneal angle tissues wereregistered and segmented following established methods (43) usingSchlemmSeg software, which includes two modules: Schlemm I and SchlemmII. Briefly, OCT B scans were automatically registered using our customSchlemm I software for SC segmentation. The Schlemm II software packagewas then used to differentiate SC from scleral vessels, which were auto-matically marked. If SC was seen connected to collector channels (CC),manual separation of SC from CC was required, and was based on theshape of SC and speckling in the images generated by blood cells or other
Li et al. PNAS | January 29, 2019 | vol. 116 | no. 5 | 1719
MED
ICALSC
IENCE
S
reflectors contained in blood vessels (22, 43, 47–50). The speckle varianceOCT−angiography images were generated based on the speckling in SC andvessels as described in detail in a previous publication (43). SC was easilydifferentiated from other vessels, due to its size and location (SI Appendix,Fig. S5).
While the axial pixel pitch can be reliably calculated from theory, the pixelpitch converting the lateral pixel size to absolute distance in microns is aninaccurate estimate that depends onmultiple factors, e.g., the distance of theprobe from the image tissue and the refractive index of the tissues in the lightpath. For this reason, we report area ratios, i.e., SC lumen area relative to theSC lumen area at baseline IOP, instead of using and reporting absolutedistance measurements given by our OCT system. Such ratios will not beaffected by pixel pitch in an individual imaging session. For interestedreaders, the raw segmented data (in pixels) at each clamped IOP is provided inSI Appendix, Table S1.
Segmentation Reproducibility. To test the reproducibility of the SC segmen-tation process, we evaluated both interobserver and intraobserver re-producibility. The segmentation of SC was independently performed by twoindividuals. The first observer (G.L.) conducted the experiments and madeinitial measurements, then repeated the measurements 1 mo to 2 mo afterthe first examination to determine intraobserver reproducibility. When firstanalyzing the images, the first observer only knew the date of the experi-ment, not the treatment group. The treatment group was revealed after thelumen areas were calculated. The second observer (Caroline Wilson) was firstgiven a training set of images to evaluate, then reviewed the images for thepresent study. This second observer was completely masked to assess theinterobserver reproducibility.
FEM. Based on an OCT image of a typical DEX-treated eye at an IOP of10 mmHg (baseline IOP; Fig. 4A), supplemented with histologic images ofDEX-treated eyes (Fig. 2 A and B, and in multiple existing publications), wecreated a pseudo-2D FEM geometry in ICEM CFD (version 14.0; ANSYS, Inc.).The approach was similar to previous work in human tissue (24), where themodel was formed by “extruding” the 2D cross-section for a distance of10 μm from the averaged OCT scan. We refer to this model as the “SC lumen-focused model.” In more detail, tissue components including the TM, sclera/cornea, and the uvea were carefully delineated from the chosen OCT scan(Fig. 4B). Four-noded tetrahedral elements with edge lengths from 5 μm to13 μm were used for the mesh. After the meshed model was imported fromICEM CFD into PreView [part of the FEBio open-source suite (51)], tissueswere treated as incompressible, isotropic, and nonlinearly hyperelastic (in-compressible Mooney−Rivlin material model). Due to the absence of mouse-specific measurements of relevant stiffnesses, sclera/cornea stiffness wastaken from human eyes as 2,700 kPa. Iridial stiffness was taken as 300 kPa, asestimated from a large-scale FEM informed by OCT images including theentire anterior segment (see below), and the TM was assigned a range ofstiffnesses from 20 kPa to 240 kPa. For each TM stiffness value, we simulatedthe deformation of SC and the TM at each imposed IOP step, and de-termined the cross-sectional area of SC. The computed SC area was nor-malized by the SC area at an IOP of 10 mmHg, and this normalized value wascompared with experimental measurements of SC area (Fig. 3), normalizedin the same manner, i.e., against the SC cross-sectional area at 10 mmHg. Theestimated TM stiffness was taken as the value that minimized the least-squares difference between the experimental and predicted normalized SCareas over the IOP range 10 mmHg to 20 mmHg.
The loading conditions were specified as follows. The imposed IOP wasapplied to all surfaces bounding the anterior chamber as well as the openspace between the iris and TM (red curves in Fig. 4B). Here we reasoned thatthe pectinate ligament attachment between the TM and iris was focal, sothat fluid pressure from the anterior chamber was transmitted into the openspace between the iris and TM. The pressure applied to the posterior iris wastaken as 10 mmHg; here we reasoned that the stepwise increasing IOP im-posed during the testing protocol would lead to posterior iridial displace-ment and creation of a lens−iris diaphragm for IOPs above 10 mmHg, asupposition supported by OCT images of the entire anterior segment (SIAppendix, Fig. S3). Finally, the walls of SC had an estimated luminal pressureapplied, as described below.
In addition to these pressure loads, we accounted for the effects of IOP onthe portion of the iris and cornea falling outside the OCT image view byspecifying effective forces and moments on a virtual cut plane at the edge ofthe SC lumen-focused model. To do so, we created a simplified, larger-scalefinite element model of an entire anterior segment of a mouse eye using anOCT image at an IOP of 10mmHg. The model included sclera, cornea, iris, andlens, as delineated from the OCT image using simple ellipsoids on a 2D plane.
A 3D axisymmetric “wedge” model subtending 90° was than created byrotating the 2D outline by 90°, and an eight-noded hexahedral mesh withelements lengths of 10 μm to 60 μm was generated in ICEM CFD. We thensimulated the effects of IOP elevations above 10 mmHg by applying apressure load of IOP minus 10 mmHg to the surfaces bounding the anteriorchamber. The sclera and cornea were modeled as a Mooney−Rivlinhyperelastic material with stiffness of 2,700 kPa, as in the SC-focused model.The lens was modeled as a rigid body, since it is much stiffer than othertissues. We treated the iris as a Mooney−Rivlin hyperelastic material andtested several iris stiffnesses to match the predicted and observed iris de-formations as IOP was increased above 10 mmHg (SI Appendix, Fig. S3). Aniris stiffness of 300 kPa showed reasonable agreement (yellow lines in SIAppendix, Fig. S3). We then extracted stresses at nodes on a line coincidingapproximately with the edge of the SC lumen-focused model (green dashedline in SI Appendix, Fig. S3). Shear and normal tractions at the cut edge ofthe iris and sclera were calculated by suitably transforming the stress tensorsand integrating the relevant components along the cut line. The effectivemoment was calculated in an analogous fashion. The resulting tractions andmoments were applied to the virtual cut planes of the iris and cornea asshown in Fig. 4B. We acknowledge that this is a simplification, and a fullertreatment would necessitate a more complex model that acknowledgedfluid−iris interactions in the posterior and anterior chambers. However, inview of the good agreement between predicted and measured iris defor-mations in the SC-lumen focused model (Fig. 4C), we feel that the aboveapproach was reasonable.
Since no direct measurements of SC luminal pressure have been conductedin mouse eyes due to the inherent technical challenges of such a measure-ment, we were forced to estimate the pressure within the lumen of SC, asfollows. The conventional outflow pathway was modeled as two series re-sistors (SI Appendix, Fig. S3), representing the TM/inner wall of SC (RTM=SC)and the distal vessels (Rdist). The pressure in SC lumen, PSC, can then bewritten as
PSC =RdistðIOPÞ+RTM=SCðEVPÞ
RTM=SC +Rdist, [1]
where EVP is episcleral venous pressure. Dividing through by Rdist and in-troducing R* =RTM=SC=ðRTM=SC +RdistÞ yields
PSC =�1−R*
�IOP+R*ðEVPÞ. [2]
For control eyes, we took R*CON =0.6, as it has been reported in humans that49 to 71% of the resistance to aqueous humor outflow is localized to theTM, depending on the level of IOP (52, 53). For DEX-treated eyes, assumingthat Rdist is unaffected by DEX, we can write
R*DEX = 1−CDEX
CCON
�1−R*CON
�. [3]
The measured values of CDEX and CCON can then be used to calculate R*DEX.Alternatively, if it is assumed that the difference between aqueous humorinflow and pressure-independent outflow is not affected by DEX treatment,i.e., that the major effect of DEX is simply to alter conventional outflowfacility (54–57), then the C terms can be replaced by
CDEX
CCON=IOPCON − EVPIOPDEX − EVP
. [4]
Measured values of IOP and C were then used for each case to define PSC withEqs. 2 and 3 (SI Appendix, Table S3), assuming that EVP was 5.4 mmHg (58) andwas unaffected by DEX. Interestingly, the ratio of directly measured facilitieswas very close to that predicted by Eq. 4, suggesting that DEX did indeedprimarily affect conventional outflow facility in mice.
Statistical Analysis. For all analyses, where data existed for both eyes from asingle mouse, the average from the contralateral eyes was used. With theexception of outflow facility measurements, the Anderson−Darling test wasused for all analyses to evaluate normality before selecting statistical tests. Inthese cases, the assumption of normality was not rejected. For outflow fa-cility measurements, we used well-established statistics (45) based upon alarge sample size, establishing that the underlying distribution of outflowfacility in mice is log-normally distributed.
For the longitudinal IOP analysis (Fig. 1A), the Anderson−Darling test didnot reject normality for all except 2/21 DEX-NP and 1/21 CON-NP timepoints.A two-way t test was thus used to compare the DEX-NP data to the CON-NPdata for each time point.
1720 | www.pnas.org/cgi/doi/10.1073/pnas.1814889116 Li et al.
To evaluate whether there was a correlation between IOP elevation andinjection frequency (Fig. 1B), Spearman’s rank correlation coefficient wasapplied, as the correlation is not necessarily expected to be linear. For eachtime point, the Anderson−Darling test did not reject normality, and hence aone-way t test was used to evaluate whether the IOP elevation was signif-icantly different from zero.
For DEX concentration analysis (Fig. 1C), the Anderson−Darling test didnot reject normality for any of the three groups, nor did Levene’s quadratictest reject equal variances between cases. Hence, a one-way ANOVA wasused to compare the effects of time and number of injections. A Tukey−Kramerpost hoc test was used to evaluate significance for pairwise comparisonsbetween groups.
For analysis of outflow facility (Fig. 1D), all data were analyzed as log-normally distributed parameters (45). A weighted unpaired (two-way) t test(45) was applied to the log-transformed facilities. Final average values offacility thus represent the geometric mean and are provided with 95%
confidence intervals. Where both eyes were used, the uncertainties (in thelog domain) were added in quadrature.
Data in box and whisker plots show median, 25th percentile, and 75thpercentile (boxes), as well as minimum and maximum values (whiskers).Data in other plot formats are presented in the form of mean (95% con-fidence interval) throughout. A value of P ≤ 0.05 was consideredstatistically significant.
ACKNOWLEDGMENTS. We thank Ying Hao (Duke Eye Center Core Facility),who prepared histology sections and helped with TEM. Dr. Vivek Agraharihelped with the preparation and characterization of the NPs. We alsoacknowledge Lori Moore (Aerie Pharmaceuticals, Inc.), who helped withdelivery of mouse eye samples, and Caroline Wilson, who helped withOCT imaging analysis. We acknowledge funding support from theBrightFocus Foundation, Research to Prevent Blindness Foundation, theNational Eye Institute (Grants EY005722 and EY019696), and the GeorgiaResearch Alliance.
1. Ciulla TA, Walker JD, Fong DS, Criswell MH (2004) Corticosteroids in posterior seg-ment disease: An update on new delivery systems and new indications. Curr OpinOphthalmol 15:211–220.
2. Lautredou CC, et al. (2018) Repeat intravitreal dexamethasone implant for refractorycystoid macular edema in syphilitic uveitis. Case Rep Ophthalmol Med 2018:7419823.
3. Al-Khersan H, Hariprasad SM, Chhablani J; Dex Implant Study Group (2017) Earlyresponse to intravitreal dexamethasone implant therapy in diabetic macular edemamay predict visual outcome. Am J Ophthalmol 184:121–128.
4. Miller K, Fortun JA (2018) Diabetic macular edema: Current understanding, phar-macologic treatment options, and developing therapies. Asia Pac J Ophthalmol (Phila)7:28–35.
5. Narayanan R, Kuppermann BD (2017) Corticosteroids and anti-complement therapy inretinal diseases. Handb Exp Pharmacol 242:309–320.
6. Schwartz SG, Scott IU, Stewart MW, Flynn HW, Jr (2016) Update on corticosteroids fordiabetic macular edema. Clin Ophthalmol 10:1723–1730.
7. Haller JA, et al.; Ozurdex GENEVA Study Group (2011) Dexamethasone intravitrealimplant in patients with macular edema related to branch or central retinal veinocclusion twelve-month study results. Ophthalmology 118:2453–2460.
8. Coassin M, et al. (2016) Bromfenac ophthalmic solution 0.09% as an adjunctivetherapy to topical steroids after cataract surgery in pseudoexfoliation syndrome.J Cataract Refract Surg 42:1119–1125.
9. Dibas A, Yorio T (2016) Glucocorticoid therapy and ocular hypertension. Eur JPharmacol 787:57–71.
10. Bhattacherjee P, Paterson CA, Spellman JM, Graff G, Yanni JM (1999) Pharmacologicalvalidation of a feline model of steroid-induced ocular hypertension. Arch Ophthalmol117:361–364.
11. Fingert JH, et al. (2001) Evaluation of the myocilin (MYOC) glaucoma gene in monkeyand human steroid-induced ocular hypertension. Invest Ophthalmol Vis Sci 42:145–152.
12. Gerometta R, et al. (2004) Steroid-induced ocular hypertension in normal cattle. ArchOphthalmol 122:1492–1497.
13. Gerometta R, Podos SM, Danias J, Candia OA (2009) Steroid-induced ocular hyper-tension in normal sheep. Invest Ophthalmol Vis Sci 50:669–673.
14. Knepper PA, Breen M, Weinstein HG, Blacik JL (1978) Intraocular pressure and gly-cosaminoglycan distribution in the rabbit eye: Effect of age and dexamethasone. ExpEye Res 27:567–575.
15. Lorenzetti OJ (1970) Effects of corticosteroids on ocular dynamics in rabbits.J Pharmacol Exp Ther 175:763–772.
16. Sawaguchi K, Nakamura Y, Nakamura Y, Sakai H, Sawaguchi S (2005) Myocilin geneexpression in the trabecular meshwork of rats in a steroid-induced ocular hyperten-sion model. Ophthalmic Res 37:235–242.
17. Zhan GL, Miranda OC, Bito LZ (1992) Steroid glaucoma: Corticosteroid-induced ocularhypertension in cats. Exp Eye Res 54:211–218.
18. Whitlock NA, McKnight B, Corcoran KN, Rodriguez LA, Rice DS (2010) Increased in-traocular pressure in mice treated with dexamethasone. Invest Ophthalmol Vis Sci 51:6496–6503.
19. SooHoo JR, Seibold LK, Laing AE, Kahook MY (2012) Bleb morphology and histologyin a rabbit model of glaucoma filtration surgery using Ozurdex� or mitomycin-C.MolVis 18:714–719.
20. Patel GC, et al. (2017) Dexamethasone-induced ocular hypertension in mice: Effects ofmyocilin and route of administration. Am J Pathol 187:713–723.
21. Zode GS, et al. (2014) Ocular-specific ER stress reduction rescues glaucoma in murineglucocorticoid-induced glaucoma. J Clin Invest 124:1956–1965.
22. Li G, et al. (2014) Pilocarpine-induced dilation of Schlemm’s canal and prevention oflumen collapse at elevated intraocular pressures in living mice visualized by OCT.Invest Ophthalmol Vis Sci 55:3737–3746.
23. Last JA, et al. (2011) Elastic modulus determination of normal and glaucomatoushuman trabecular meshwork. Invest Ophthalmol Vis Sci 52:2147–2152.
24. Wang K, et al. (2017) Estimating human trabecular meshwork stiffness by numericalmodeling and advanced OCT imaging. Invest Ophthalmol Vis Sci 58:4809–4817.
25. Wang K, et al. (2018) The relationship between outflow resistance and trabecularmeshwork stiffness in mice. Sci Rep 8:5848.
26. Yang X, et al. (2016) Nanoparticle-based topical ophthalmic gel formulation forsustained release of hydrocortisone butyrate. AAPS PharmSciTech 17:294–306.
27. Boddu SH, et al. (2010) Novel nanoparticulate gel formulations of steroids for thetreatment of macular edema. J Ocul Pharmacol Ther 26:37–48.
28. Agrahari V, et al. (2017) Pentablock copolymer dexamethasone nanoformulationselevate MYOC: In vitro liberation, activity and safety in human trabecular meshworkcells. Nanomedicine (Lond) 12:1911–1926.
29. Overby DR, et al. (2014) Ultrastructural changes associated with dexamethasone-induced ocular hypertension in mice. Invest Ophthalmol Vis Sci 55:4922–4933.
30. Borrás T, Buie LK, Spiga MG (2016) Inducible scAAV2.GRE.MMP1 lowers IOP long-termin a large animal model for steroid-induced glaucoma gene therapy. Gene Ther 23:438–449.
31. Kumar S, Shah S, Deutsch ER, Tang HM, Danias J (2013) Triamcinolone acetonidedecreases outflow facility in C57BL/6 mouse eyes. Invest Ophthalmol Vis Sci 54:1280–1287.
32. Patel GC, Liu Y, Millar JC, Clark AF (2018) Glucocorticoid receptor GRβ regulatesglucocorticoid-induced ocular hypertension in mice. Sci Rep 8:862.
33. Ethier CR, Simmons CA (2007) Introductory Biomechanics From Cells to Organisms(Cambridge Univ Press, Cambridge, UK).
34. Kennedy BF, Wijesinghe P, Sampson DD (2017) The emergence of optical elastog-raphy in biomedicine. Nat Photonics 11:215–221.
35. Schmitt J (1998) OCT elastography: Imaging microscopic deformation and strain oftissue. Opt Express 3:199–211.
36. Kirby MA, et al. (2017) Optical coherence elastography in ophthalmology. J BiomedOpt 22:1–28.
37. Larin KV, Sampson DD (2017) Optical coherence elastography–OCT at work in tissuebiomechanics [invited]. Biomed Opt Express 8:1172–1202.
38. Singh M, et al. (2017) Applanation optical coherence elastography: Noncontactmeasurement of intraocular pressure, corneal biomechanical properties, and cornealgeometry with a single instrument. J Biomed Opt 22:20502.
39. Pant AD, Kagemann L, Schuman JS, Sigal IA, Amini R (2017) An imaged-based inversefinite element method to determine in-vivo mechanical properties of the humantrabecular meshwork. J Model Ophthalmol 1:100–111.
40. Johnson M, Schuman JS, Kagemann L (2015) Trabecular meshwork stiffness in theliving human eye. Invest Ophthalmol Visual Sci 56:3541.
41. Kazemi A, et al. (2017) Comparison of aqueous outflow facility measurement bypneumatonography and digital Schiøtz tonography. Invest Ophthalmol Vis Sci 58:204–210.
42. Li G, et al. (2014) Disease progression in iridocorneal angle tissues of BMP2-inducedocular hypertensive mice with optical coherence tomography. Mol Vis 20:1695–1709.
43. Li G, et al. (2016) Visualization of conventional outflow tissue responses to netarsudilin living mouse eyes. Eur J Pharmacol 787:20–31.
44. Li G, et al. (2018) Trabodenoson, an adenosine mimetic with A1 receptor selectivitylowers intraocular pressure by increasing conventional outflow facility in mice. InvestOphthalmol Vis Sci 59:383–392.
45. Sherwood JM, Reina-Torres E, Bertrand JA, Rowe B, Overby DR (2016) Measurementof outflow facility using iPerfusion. PLoS One 11:e0150694.
46. Boussommier-Calleja A, et al. (2015) Physical factors affecting outflow facility mea-surements in mice. Invest Ophthalmol Vis Sci 56:8331–8339.
47. Hendargo HC, et al. (2013) Automated non-rigid registration and mosaicing for ro-bust imaging of distinct retinal capillary beds using speckle variance optical coherencetomography. Biomed Opt Express 4:803–821.
48. Huang Q, Zheng Y, Lu M, Wang T, Chen S (2009) A new adaptive interpolation al-gorithm for 3D ultrasound imaging with speckle reduction and edge preservation.Comput Med Imaging Graph 33:100–110.
49. Mariampillai A, et al. (2008) Speckle variance detection of microvasculature usingswept-source optical coherence tomography. Opt Lett 33:1530–1532.
50. Poole KM, McCormack DR, Patil CA, Duvall CL, Skala MC (2014) Quantifying thevascular response to ischemia with speckle variance optical coherence tomography.Biomed Opt Express 5:4118–4130.
51. Maas SA, Ellis BJ, Ateshian GA, Weiss JA (2012) FEBio: Finite elements for bio-mechanics. J Biomech Eng 134:011005.
52. Rosenquist R, Epstein D, Melamed S, Johnson M, Grant WM (1989) Outflow resistanceof enucleated human eyes at two different perfusion pressures and different extentsof trabeculotomy. Curr Eye Res 8:1233–1240.
Li et al. PNAS | January 29, 2019 | vol. 116 | no. 5 | 1721
MED
ICALSC
IENCE
S

53. Overby DR, Stamer WD, Johnson M (2009) The changing paradigm of outflow re-sistance generation: Towards synergistic models of the JCT and inner wall endothe-lium. Exp Eye Res 88:656–670.
54. Armaly MF (1963) Effect of corticosteroids on intraocular pressure and fluid dynamics.I. The effect of dexamethasone in the normal eye. Arch Ophthalmol 70:482–491.
55. Kupfer C, Ross K (1971) Studies of aqueous humor dynamics in man. I. Measurementsin young normal subjects. Invest Ophthalmol 10:518–522.
56. Nicholas JP (1964) Topical corticosteroids and aqueous humor dynamics. ArchOphthalmol 72:189–197.
57. Anselmi P, Bron AJ, Maurice DM (1968) Action of drugs on the aqueous flow in manmeasured by fluorophotometry. Exp Eye Res 7:487–496.
58. Millar JC, Clark AF, Pang IH (2011) Assessment of aqueous humor dynamics in themouse by a novel method of constant-flow infusion. Invest Ophthalmol Vis Sci 52:685–694.
1722 | www.pnas.org/cgi/doi/10.1073/pnas.1814889116 Li et al.