in accordance with section 68 and clauses 34 and 35 of
TRANSCRIPT

Fremantle Ports | Annual Repor t 2011 | Page 1
Back Forward
To the Hon Troy Buswell MLAMinister for Transport
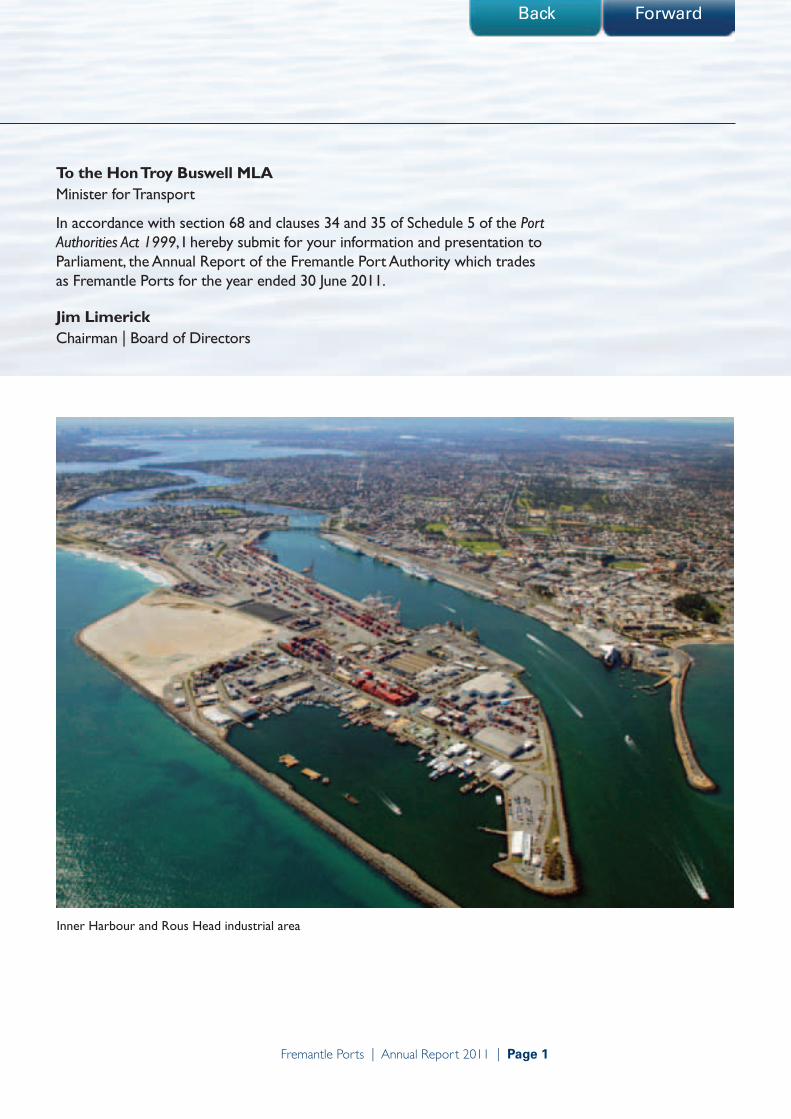
In accordance with section 68 and clauses 34 and 35 of Schedule 5 of the Port Authorities Act 1999, I hereby submit for your information and presentation to Parliament, the Annual Report of the Fremantle Port Authority which trades as Fremantle Ports for the year ended 30 June 2011.
Jim LimerickChairman | Board of Directors
Inner Harbour and Rous Head industrial area

Fremantle Ports | Annual Repor t 2011 | Page 2
Back ForwardBack Forward
OVERVIEW 4
Executive Summary 4
Notable Achievements 4
Chairman’s Report 6
Chief Executive Officer’s Report 8
Key Business Results 10
Operational Structure 11
Performance Management Framework 17
PERFORMANCE 18
Corporate Scorecard 18
Service Delivery 20
Capability for the Future 25
Trade and Business Growth 27
Support Services 46
Business Sustainability 50
SIGNIFICANT ISSUES 56
DISCLOSURES AND LEGAL COMPLIANCE 62
Table of Contents

Fremantle Ports | Annual Repor t 2011 | Page 3
Back ForwardBack Forward
Directors’ Report 62
Financial Statements 69
Directors’ Declaration 107
Financial Audit Opinion 108
Financial Performance Indicators 109
Key Performance Indicators 112
Other Legal Requirements 125
Ministerial Directives 125
Advertising 125
Disability Access and Inclusion Plan Outcomes 126
Compliance with Public Sector Standards and Ethical Codes 126
Recordkeeping Plans 127
Government Policy Requirements 129
Substantive Equality 129
Occupational Safety, Health and Injury Management 130
STATISTICAL INFORMATION 132

Fremantle Ports | Annual Repor t 2011 | Page 4
Back ForwardBack Forward
Overview Executive Summary
Notable Achievements• Buoyant trade saw significant growth in some areas, with container
trade reaching a record of 598,543 TEU (twenty foot equivalent units).
• The Inner Harbour and channel deepening and associated berth works were completed in April 2011. This $250 million project responded to the need to provide for larger container ships and retain shipping services.
• Expressions of interest were called for 27 hectares of land reclaimed at Rous Head during the dredging and planning for this area to increase port efficiency is well advanced.
• A $44 million planned upgrading of infrastructure to facilitate exports of iron ore, coal and other commodities at the Kwinana Bulk Terminal advanced towards works approval. This followed completion of agreements with Australian-based company Mineral Resources Limited and existing customer Griffin Coal, now owned by Lanco Infratech.
• The development of a recreational marina at Rous Head was advertised for expressions of interest. Following a strong response, short-listed proponents were invited to submit more detailed concepts for assessment.
• Development within the eastern end of historic B Shed on Victoria Quay to provide a ferry terminal and café was completed and the project received a State Heritage award for adaptive re-use of a heritage building.

Fremantle Ports | Annual Repor t 2011 | Page 5
Back ForwardBack Forward
• Significant progress was made on upgrading the Fremantle Passenger Terminal to provide improved comfort for cruise ship passengers and to increase efficiency in managing cruise ship visits to the port. The refurbishment was recognised with a conservation category award in the Fremantle Heritage Awards.
• Annual survey results showed that 95 per cent of shipping line customers were satisfied or very satisfied with Fremantle Ports’ services. In community survey outcomes, overall satisfaction levels with Fremantle Ports’ performance were within target and community support for the continuing role of the Inner Harbour as a working port remained strong.
A cutter suction dredge and a trailing suction hopper dredge were required for Stage 2 of the dredging.

Fremantle Ports | Annual Repor t 2011 | Page 6
Back Forward
Overview Executive Summary
Chairman’s ReportFremantle Ports recorded a profit for the year of $17.127 million, which was above budget forecast. This result was due in part to a faster than anticipated recovery in trade after the global financial crisis and in part due to expenditure control. However the economic outlook for the 2011/12 year is still clouded and many variables on both the global and domestic fronts will impact on the trade outlook for the coming year.
This past year has seen the completion of a major deepening of the Inner Harbour, completed on time and within budget, which will ensure the on-going capacity of Fremantle to service the container trade with increasing visits by the larger post-Panamax container vessels. At the same time, a major strengthening and extension of Berth 10 was undertaken, increasing the port’s container-handling capacity. With this work completed, the Inner Harbour has the capacity on the marine side to handle well in excess of 1 million containers (twenty foot equivalent units or TEU) per year, compared with nearly 600,000 TEU handled in the last year.
The challenge for the future is to capture the value of this increased capacity by ensuring a corresponding capability to handle and transport a higher number of containers into and out of the port on the land side. Fremantle Ports is working closely with the Department of Transport to complete an Inner Harbour Land Transport Linkages Strategy which will look at both road and rail linkages and the engineering, planning and policy issues needing to be addressed.
Particularly pleasing aspects of the deepening and strengthening projects were the good safety performance and minimisation of impacts on customers and on the environment. The reconstruction of the 52 year old Berth 10 won the award for Management of Engineering at the 2010 WA Engineering Excellence Awards held by Engineers Australia.
Despite an unavoidable amount of turbidity created in the river and extending out of the harbour mouth, the Inner Harbour dredging was completed within the environmental conditions set by the Minister for Environment.
As a result of collecting the dredge spoil within a bunded area at Rous Head, Fremantle Ports has created an additional 27 hectares of land which will be used for port purposes. An expression of interest process was completed during the year and the allocation of land will be finalised early in the new financial year. This is expected to significantly facilitate increased container movement through the port.
Jim Limerick

Fremantle Ports | Annual Repor t 2011 | Page 7
Back Forward
On the bulk trade side of the business, Fremantle Ports entered into an agreement with Mineral Resources Limited (MRL) for the latter to build (and transfer ownership to Fremantle Ports) train unloading and ship loading equipment at the Kwinana Bulk Terminal (KBT) sufficient to export 4.4 million tonnes of iron ore per year. A second agreement with Lanco Infratech, the new owners of Griffin Coal, will see 750,000 tonnes per year of coal exported through KBT for the next four years.
A challenge for Western Australia is to find ways of facilitating iron ore exports from proposed new mining projects in the Yilgarn Region. Esperance and Fremantle are both linked to this region by rail but a significant capital works program will be required to increase the capacity of one or both ports to accommodate this growth. A Regional Transport Plan being co-ordinated by the Department of Transport, will contribute significantly to informing the State Government as to the most effective and efficient options for facilitating this export trade. Fremantle Ports is actively participating in the study, which is expected to be completed in March 2012.
The Board is looking closely at Fremantle Ports’ safety performance, noting that whilst the Lost Time Injury Frequency Rate was declining, it remains unacceptably high and the rate of improvement has flattened out. The Board has given the Audit Committee a broader mandate to be the Audit and Risk Committee, with specific terms of reference to examine the safety and environmental performance of the port.
The Honourable Troy Buswell MLA succeeded the Hon Simon O’Brien MLC as Minister for Transport during the year and it has been a pleasure as Chairman to work with both Ministers.
The Board wishes to recognise the service and advice provided to Fremantle Ports by the former Chairman, Mr Alan Birchmore, and by Ms Eve Howell whose terms as Board members expired during the year.
The integrity and professionalism displayed during the year by the Fremantle Ports Executive, under the leadership of its CEO Chris Leatt-Hayter, gives the Board confidence that the exciting challenges we face going into 2012 will be successfully met and well managed. The Board also extends its thanks to all Fremantle Ports employees, who have contributed to our success in the past year.
Jim LimerickChairman
The challenge for the future is to capture the value of this increased capacity by ensuring a corresponding capability to handle and transport a higher number of containers into and out of the port on the land side.
Dredging in the Inner Harbour.

Fremantle Ports | Annual Repor t 2011 | Page 8
Back Forward
Overview Executive Summary
Chief Executive Officer’s ReportThe overall trade outcome for the year was maintained at a level similar to last year with some areas significantly outperforming expectations. The port’s container trade was at a record level.
Fremantle Ports’ bulk business operations at the Kwinana Bulk Terminal and Kwinana Bulk Jetty have also performed well ahead of forecasts, with an increase of more than 35 per cent on last year’s result.
The strength of the State’s economy is expected to result in further growth in Fremantle‘s trade in the next few years. As well as maintaining existing trade and business, ensuring that the necessary infrastructure is in place or planned to cater for growth continues to be a top priority. This applies both to our container and general cargo operations in the Inner Harbour and to the bulk handling facilities Fremantle Ports operates at Kwinana.
The major new commercial agreements negotiated during the year and outlined in the Chairman’s Report represent a major opportunity for the installation of new and upgraded export infrastructure at the Kwinana Bulk Terminal, with a total investment of some $44 million in private and public sector funding.
Competition for allocation of capacity at the terminal has been keen. Several proposals were assessed before contracts were signed with Mineral Resources Ltd for the export of iron ore and with Griffin Coal to enable that company to continue to export via the Kwinana Bulk Terminal while new facilities for the export of coal are built at Bunbury or elsewhere.
The Kwinana Bulk Terminal upgrading is expected to be completed before the end of 2011.
With the Inner Harbour deepening and associated berth works now successfully completed, the next big opportunity is to ensure that the new land reclaimed through dredging, along with other adjacent land at Rous Head/North Quay is used in a way that contributes to port capacity and efficiency. This is essential to enable the Inner Harbour to achieve its potential in a sustainable way and significant planning work was undertaken during the year.
Fremantle Ports has undertaken extensive planning and consulted with key parties in the supply chain to ensure that the future layout of the port precinct meets a range of requirements for the future. Aims in the planning for the new land include providing adequate capacity for key functions, improving efficiency of operations and providing flexibility to accommodate possible future changes.
Chris Leatt-Hayter signing the Griffin Coal agreement with Manoj Agarwal, Director of Finance, Lanco Infratech.
Chris Leatt-Hayter

Fremantle Ports | Annual Repor t 2011 | Page 9
Back Forward
The land use planning takes into account the need to increase the efficiency of landside logistics. Effective and efficient transport linkages both now and in the future are vital and we are working with other Western Australian Government agencies, port service providers and the transport industry in this regard. A Land Transport Linkages Strategy has been developed to establish the key actions which need to be addressed and to clearly set out responsibilities.
The break-bulk sector is an important part of the mix of trades handled at Fremantle. In addressing current and predicted growth in a number of our common-user trades, our aim is to maximise berth availability, reduce congestion and any potential for delays and promote efficient receiving and delivery of cargo. Opening up space on Berth 12 for more efficient discharge and storage of cargoes from roll on-roll off vessels is a step undertaken this year in that direction.
While working to ensure that we deliver value in terms of economic performance for the State and local economies, Fremantle Ports continues to be very active in the area of community contribution. Partnering with schools and local organisations, we have supported a wide range of initiatives this year. As well as seeking to make a positive difference at the community level, we see the linkages as an important opportunity to promote the role of the port and its importance to day to day life.
Two projects which have added value in terms of community amenity this year have been the very successful development of the new ferry terminal and café in historic B Shed on Victoria Quay and the extensive refurbishment of the heritage-listed Fremantle Passenger Terminal. These works have been a labour of love for those involved and the heritage acknowledgements received at State and local level have been much appreciated.
In conclusion, I would like to thank the Chairman and Directors of the Fremantle Ports Board for their support over the past 12 months. The strategic input to many important issues and decisions has been of great value. I also take this opportunity to acknowledge my fellow members of the Executive and Fremantle Ports’ employees for their commitment, effort and teamwork towards achievement of goals.
Chris Leatt-HayterChief Executive Officer
Fremantle Ports has undertaken extensive planning and consulted with key parties in the supply chain to ensure that the future layout of the port precinct meets a range of requirements for the future.
The refurbishment of the Passenger Terminal has improved passenger and visitor comfort.

Fremantle Ports | Annual Repor t 2011 | Page 10
Back Forward
Overview Executive Summary
Key Business Results
1000
1100
1200
1300
1400
1500
1600
1700
1800
1900
2000
Vis
its
Visits 1687 1725 1830 1816 1952
Total Ship Visits Comparison 2006/2007 to 2010/2011
0
50
100
150
200
250
300
350
400
450
500
550
600
TE
U’s
(T
hous
ands
)
TEU’s 505.82 580.34 565.49 557.40 598.53
Total Container Trade - TEUs Comparison 2006/2007 to 2010/2011
0
5
10
15
20
25
30
Mas
s To
nnes
(M
illio
ns)
06/07 07/08 08/09 09/10 10/11 06/07 07/08 08/09 09/10 10/11 06/07 07/08 08/09 09/10 10/11
06/07 07/08 08/09 09/10 10/1106/07 07/08 08/09 09/10 10/1106/07 07/08 08/09 09/10 10/11
06/07 07/08 08/09 09/10 10/11 06/07 07/08 08/09 09/10 10/11 06/07 07/08 08/09 09/10 10/11
Tonnes 25.05 26.08 26.60 26.16 26.10
Total Port Trade (Mass Tonnes) Comparison 2006/2007 to 2010/2011
0.0
1.0
2.0
3.0
4.0
5.0
6.0
7.0
8.0
9.0
Per
Cen
t
$ (M
illio
ns)
AIFRS 6.0 8.2 5.3 4.8 4.8
Economic Rate of Return on Assets Comparison 2006/2007 to 2010/2011
0
5
10
15
20
25
30
$ (M
illio
ns)
$ Millions 17.36 25.38 19.31 19.65 17.13
Operating Profit (Loss) Before Income Tax Equivalent
Comparison 2006/2007 to 2010/2011
For comparative purposes the above figures exclude individuallysignificant items. (pre 2000/2001 known as abnormal items)
0
5
10
15
20
25
Actual 14.5 18.4 20.1 18.3 21.5
Target 11.6 13.4 16.0 17.9 20.6
% of Vessels 90.0 84.8 84.2 78.6 63.5
Fremantle Ports - Contributions to State Government 2006/2007
to 2010/2011
Per
Cen
t
0
10
20
30
40
50
60
70
80
90
100
Shipping Line/Agent - Survey Services - 2006/2007 to 2010/2011Level of Overall Satisfaction with
Fremantle Ports’ Services
In 2010/11, 95% of respondents were satisfied or very satisfied. Target range 80-90%
Per
cent
age
of V
esse
ls
Per
cent
age
of V
esse
ls
0
10
20
30
40
50
60
70
80
90
100
Time Awaiting Berth - Container Comparison 2006/2007 to 2010/2011
% of Container Vessels with Zero Waiting Time
% of Vessels 90.7 91.1 88.3 89.8 86.5
0
10
20
30
40
50
60
70
80
90
100
Time Awaiting Berth - Non Container Inner Harbour - Comparison 2006/07
to 2010/11 % of Vessels with Zero Waiting Time

Fremantle Ports | Annual Repor t 2011 | Page 11
Back Forward
Overview Operational Structure
Fremantle Ports operates on commercial principles as a Western Australian Government Trading Enterprise with responsibility for facilitating trade through the State’s biggest general cargo port.
The Inner Harbour at Fremantle handles almost all of the container trade for Western Australia. It also provides facilities for motor vehicle imports, livestock exports, other general cargo trades, cruise ships and visiting naval vessels.
The Outer Harbour, about twenty kilometres to the south at Kwinana, is one of Australia’s major bulk cargo ports handling grain, petroleum, liquid petroleum gas, alumina, mineral sands, fertilisers, coal, sulphur and other bulk commodities.
The State Government-owned port is a mix of facilities and services managed by Fremantle Ports and private operators. Fremantle Ports provides and maintains shipping channels, navigation aids, cargo wharves at common user areas and leased terminals, the Fremantle Passenger Terminal, road and rail transport infrastructure within the port area, moles and seawalls and other port infrastructure such as storage sheds, water, power and public amenities.
Three of the jetties in the Outer Harbour are operated by private companies, generally under Special Agreement Acts with the State. They are the Alcoa, BP Refinery and CBH jetties. The Kwinana Bulk Jetty and the Kwinana Bulk Terminal are operated by Fremantle Ports.
Services such as towage, pilotage (under contract to Fremantle Ports), line boats and bunkering are provided by the private sector.
Fremantle Ports also cooperates with Commonwealth Government agencies responsible for customs, quarantine and maritime safety.
The State Government-owned port is a mix of facilities and services managed by Fremantle Ports and private operators.
Fremantle Ports | Annual Repor t 2011 | Page 12
Back Forward
Overview Operational Structure
Legislative Framework
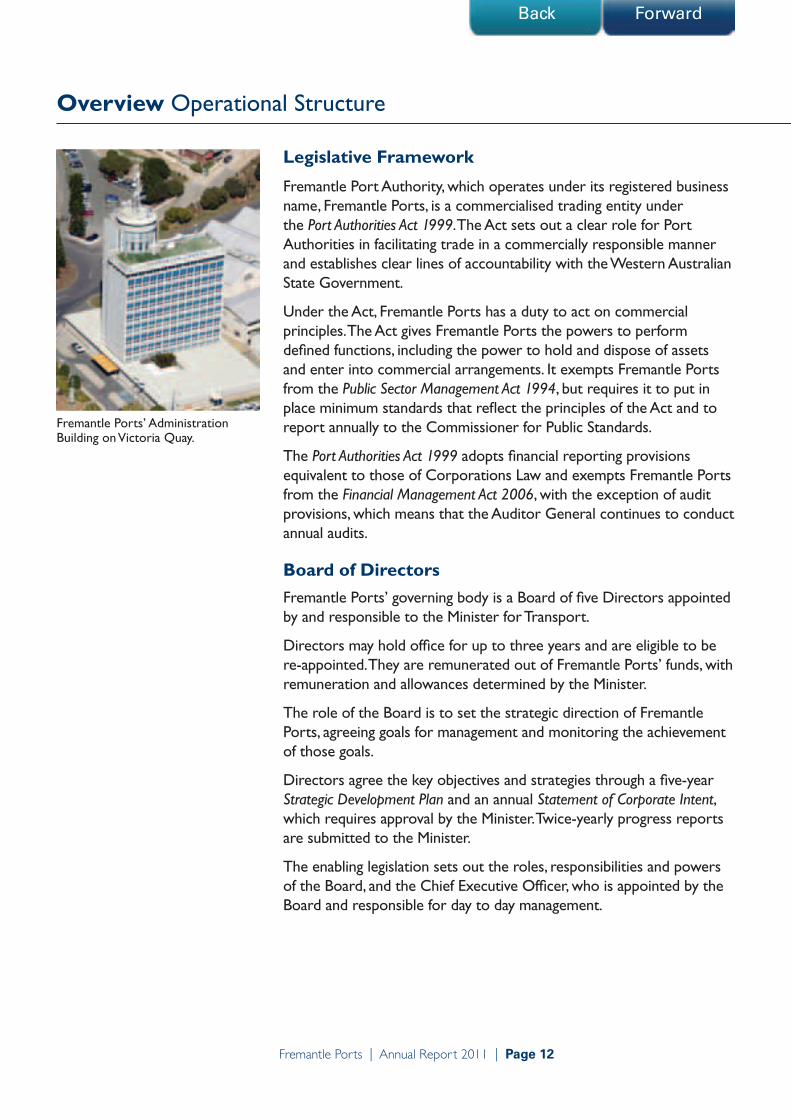
Fremantle Port Authority, which operates under its registered business name, Fremantle Ports, is a commercialised trading entity under the Port Authorities Act 1999. The Act sets out a clear role for Port Authorities in facilitating trade in a commercially responsible manner and establishes clear lines of accountability with the Western Australian State Government.
Under the Act, Fremantle Ports has a duty to act on commercial principles. The Act gives Fremantle Ports the powers to perform defined functions, including the power to hold and dispose of assets and enter into commercial arrangements. It exempts Fremantle Ports from the Public Sector Management Act 1994, but requires it to put in place minimum standards that reflect the principles of the Act and to report annually to the Commissioner for Public Standards.
The Port Authorities Act 1999 adopts financial reporting provisions equivalent to those of Corporations Law and exempts Fremantle Ports from the Financial Management Act 2006, with the exception of audit provisions, which means that the Auditor General continues to conduct annual audits.
Board of DirectorsFremantle Ports’ governing body is a Board of five Directors appointed by and responsible to the Minister for Transport.
Directors may hold office for up to three years and are eligible to be re-appointed. They are remunerated out of Fremantle Ports’ funds, with remuneration and allowances determined by the Minister.
The role of the Board is to set the strategic direction of Fremantle Ports, agreeing goals for management and monitoring the achievement of those goals.
Directors agree the key objectives and strategies through a five-year Strategic Development Plan and an annual Statement of Corporate Intent, which requires approval by the Minister. Twice-yearly progress reports are submitted to the Minister.
The enabling legislation sets out the roles, responsibilities and powers of the Board, and the Chief Executive Officer, who is appointed by the Board and responsible for day to day management.
Fremantle Ports’ Administration Building on Victoria Quay.

Fremantle Ports | Annual Repor t 2011 | Page 13
Back Forward
Vision, Mission and ValuesThe Vision and Mission, developed with staff input, describe Fremantle Ports’ business intent. With the Corporate Values they provide the foundation for strategic planning and decision-making, helping to prioritise and work towards common goals.
VisionTo be valued by our customers and the community for our leadership and excellence
MissionTo facilitate trade in a sustainable way
Values• Respect and Integrity • Safety and Wellbeing• Responsiveness and Delivery • Continuous Improvement and Innovation• Sustainability
Business PrinciplesFremantle Ports’ Business Principles to guide planning and decision-making were formally adopted during the year. They are aligned with the Corporate Values and take into account and build on the organisation’s previous sustainability framework.
The Business Principles, which have a strong focus on understanding the needs and expectations of key stakeholders, address the following themes:
• Minimising or reducing adverse land transport impacts;
• Building synergies with others’ plans;
• Protecting the environment;
• Ensuring commercially sound and justifiable outcomes;
• Supporting local communities;
• Continuing to improve port safety and security;
• Complying with legal requirements;
• Ensuring efficiency and continuity of all port services;
• Contributing to the aspirations and growth of our people and the port community; and
• Capitalising on opportunities and managing risks.
Fremantle Ports’ Business Principles to guide planning and decision-making were formally adopted during the year.
Fremantle Ports | Annual Repor t 2011 | Page 14
Back Forward
Overview Operational Structure
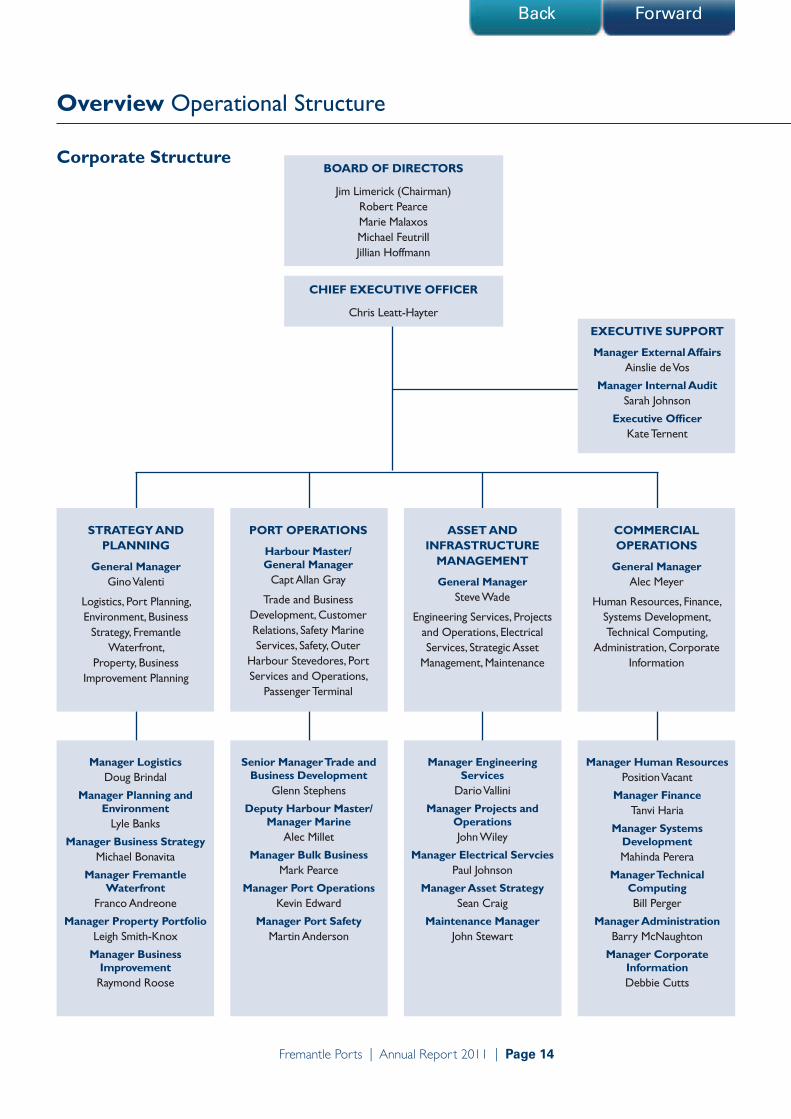
Corporate Structure
Manager LogisticsDoug Brindal
Manager Planning and Environment
Lyle Banks
Manager Business StrategyMichael Bonavita
Manager Fremantle Waterfront
Franco Andreone
Manager Property PortfolioLeigh Smith-Knox
Manager Business ImprovementRaymond Roose
Senior Manager Trade and Business Development
Glenn Stephens
Deputy Harbour Master/Manager Marine
Alec Millet
Manager Bulk BusinessMark Pearce
Manager Port OperationsKevin Edward
Manager Port SafetyMartin Anderson
Manager Engineering Services
Dario Vallini
Manager Projects and OperationsJohn Wiley
Manager Electrical ServciesPaul Johnson
Manager Asset StrategySean Craig
Maintenance ManagerJohn Stewart
Manager Human ResourcesPosition Vacant
Manager FinanceTanvi Haria
Manager Systems DevelopmentMahinda Perera
Manager Technical ComputingBill Perger
Manager AdministrationBarry McNaughton
Manager Corporate InformationDebbie Cutts
ExECUTIVE SUPPORT
Manager External AffairsAinslie de Vos
Manager Internal AuditSarah Johnson
Executive OfficerKate Ternent
CHIEF ExECUTIVE OFFICER
Chris Leatt-Hayter
BOARD OF DIRECTORS
Jim Limerick (Chairman)Robert PearceMarie MalaxosMichael FeutrillJillian Hoffmann
STRATEGy AND PLANNING
General ManagerGino Valenti
Logistics, Port Planning, Environment, Business
Strategy, Fremantle Waterfront,
Property, Business Improvement Planning
PORT OPERATIONS
Harbour Master/ General Manager
Capt Allan Gray
Trade and Business Development, Customer Relations, Safety Marine Services, Safety, Outer
Harbour Stevedores, Port Services and Operations,
Passenger Terminal
ASSET AND INFRASTRUCTURE
MANAGEMENT
General ManagerSteve Wade
Engineering Services, Projects and Operations, Electrical Services, Strategic Asset
Management, Maintenance
COMMERCIAL OPERATIONS
General ManagerAlec Meyer
Human Resources, Finance, Systems Development, Technical Computing,
Administration, Corporate Information

Fremantle Ports | Annual Repor t 2011 | Page 15
Back Forward
BoardDetails of Directors of the Fremantle Ports Board are provided in the Directors’ Report on page 62.
Executive Team
Chris Leatt-Hayter Chief Executive Officer
Chris Leatt-Hayter, who joined Fremantle Ports in 1992, has tertiary qualifications in economics. He previously worked at the State Treasury and Department of Transport and has wide-ranging experience in transport policy development, contract negotiations, economic and financial evaluation and business development planning. Chris was appointed to the position of CEO in December 2008 after serving 13 years as General Manager Strategic and Commercial Development. He has played a major role in planning for the future growth of the port so it can effectively fulfill its role of trade facilitation. He was also involved in the commercialisation of Fremantle Ports’ operations to achieve a more commercial orientation and customer-focused approach.
He is currently a Deputy Chairman of Ports Australia, a Board member of the West Australian Motor Industry Foundation and a member of the Freight and Logistics Council of Western Australia. Chris is also a member of the Chartered Institute of Transport, Australian Institute of Management and the Australian Institute of Company Directors.
Alec MeyerGeneral Manager Commercial Operations
Alec Meyer, who joined Fremantle Ports in 1988, brings extensive commercial business experience to his position at Fremantle Ports. He has tertiary qualifications in accounting and is a Fellow of CPA Australia and a Fellow of the Australian Institute of Company Directors.
Steve WadeGeneral Manager Marine and Technical Services
Steve Wade, who has tertiary qualifications in engineering, joined Fremantle Ports in 1995. Before this, he worked with BHP and has wide-ranging experience in construction and project management in Australia and overseas in the resources and manufacturing sectors.
Chris Leatt-Hayter
Alec Meyer
Steve Wade

Fremantle Ports | Annual Repor t 2011 | Page 16
Back Forward
Overview Operational Structure
Gino ValentiGeneral Manager Strategy and Planning
Gino Valenti has tertiary qualifications in chemistry and joined Fremantle Ports in 1998. Before this he worked with the Department of Minerals and Energy in senior roles regulating the safe storage, handling and transport of explosives and dangerous goods and the management of major hazard facilities throughout Western Australia.
Capt Allan Gray Harbour Master and General Manager Port Operations
Captain Allan Gray has held the position of Harbour Master since September 2008, having previously served for two years as Deputy Harbour Master. Captain Gray is a skilled mariner whose 20 years at sea included extensive experience in container and tanker shipping. His shore-based career included shipping management, marine incident management, and maritime systems development. He is Federal Master of the Company of Master Mariners of Australia.
Glenn StephensSenior Manager Trade and Business Development
Glenn Stephens joined Fremantle Ports in 1971 and has gained extensive experience in a range of areas within the organisation. He has tertiary qualifications in business and accounting and is a Certified Practising Accountant, Fellow of the Institute of Public Accountants and a member of the Australian Institute of Company Directors. Glenn has also represented Fremantle Ports on the Board of Cruise Down Under as Treasurer since its formation in 1997.
Gino Valenti
Capt Allan Gray
Glenn Stephens

Fremantle Ports | Annual Repor t 2011 | Page 17
Back Forward
Overview Performance Management Framework
The Western Australian Government’s broad, high level goals are supported at an agency level by specific outcomes. The following table shows the alignment between relevant Government goals 1,2,3 and 5 and Fremantle Ports’ strategic objectives, targeted outcomes and measures.
Government GoalsFremantle Ports Objectives
Key Outcomes Sought Measures
Goal 1.
Building strategic infrastructure that will create jobs and underpin Western Australia’s long-term economic development
Providing reliable and efficient facilities and services that meet customer expectations
Ensuring sound planning for all aspects of our business, including resources, services and infrastructure
Understanding changing customer needs and being responsive to them
Completing important planning and infrastructure projects critical to the port’s future and the prosperity of the State
Customer survey outcomes
Progress monitored against Fremantle Ports’ Strategic Plan and Statement of Corporate Intent
Goal 2.
Responsibly managing the State’s finances through the efficient and effective delivery of services, encouraging economic activity and reducing regulatory burdens on the private sector
Promoting and facilitating trade and business growth opportunities
Maintaining existing trade and business and capturing new trade and business opportunities
Favourable financial outcomes
Trade and financial results against targets
Goal 3.
Greater focus on service delivery areas for the benefit of all Western Australians
Ensuring appropriate and cost effective resources, processes and systems to support service delivery
Efficient and effective services provided to users
Support services focused on achieving priority projects
Customer satisfaction survey outcomes
Progress reporting against Strategic Plan
Goal 5.
Ensuring that economic activity is managed in a socially and environmentally responsible manner for the long-term benefit of the State
Ensuring business sustainability through excellent performance, innovation, business improvement and community and other stakeholder engagement
Maintaining certification to international environmental, safety and quality standards
Improved safety performance
Maintaining stakeholder support
External audits for ISO 14001, ISO 9001, AS/NZ 4801
Safety indicator outcomes
Annual customer and community survey outcomes
Shared Responsibilities Fremantle Ports has shared responsibilities with a number of State Government agencies in areas such as emergency response, security, planning and environmental management. These agencies include the Department of Transport, Department of Planning, Fire and Emergency Services, Western Australian Police Service and the Department of Environment and Conservation.
Fremantle Ports | Annual Repor t 2011 | Page 18
Back Forward
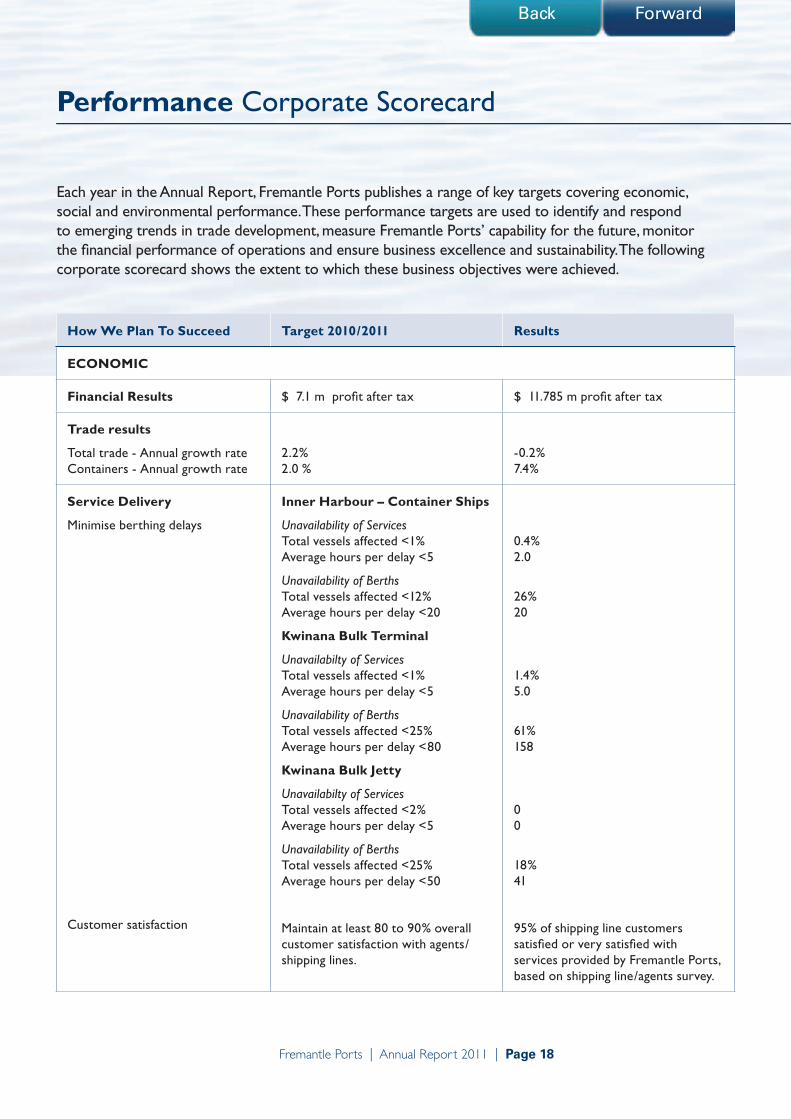
Each year in the Annual Report, Fremantle Ports publishes a range of key targets covering economic, social and environmental performance. These performance targets are used to identify and respond to emerging trends in trade development, measure Fremantle Ports’ capability for the future, monitor the financial performance of operations and ensure business excellence and sustainability. The following corporate scorecard shows the extent to which these business objectives were achieved.
Performance Corporate Scorecard
How We Plan To Succeed Target 2010/2011 Results
ECONOMIC
Financial Results $ 7.1 m profit after tax $ 11.785 m profit after tax
Trade results
Total trade - Annual growth rate Containers - Annual growth rate
2.2%2.0 %
-0.2%7.4%
Service Delivery
Minimise berthing delays
Customer satisfaction
Inner Harbour – Container Ships
Unavailability of ServicesTotal vessels affected <1%Average hours per delay <5
Unavailability of BerthsTotal vessels affected <12%Average hours per delay <20
Kwinana Bulk Terminal
Unavailabilty of ServicesTotal vessels affected <1%Average hours per delay <5
Unavailability of BerthsTotal vessels affected <25%Average hours per delay <80
Kwinana Bulk Jetty
Unavailabilty of ServicesTotal vessels affected <2%Average hours per delay <5
Unavailability of BerthsTotal vessels affected <25%Average hours per delay <50
Maintain at least 80 to 90% overall customer satisfaction with agents/shipping lines.
0.4%2.0
26%20
1.4%5.0
61%158
00
18%41
95% of shipping line customers satisfied or very satisfied with services provided by Fremantle Ports, based on shipping line/agents survey.

Fremantle Ports | Annual Repor t 2011 | Page 19
Back ForwardBack Forward
How We Plan To Succeed Target 2010/2011 Results
BEST PRACTICE ENVIRONMENTAL, SAFETy AND OTHER SySTEMS
Compliance with international environmental standardISO 14001
Continue to comply with ISO 14001, and further improve Environmental Management System
Certification to ISO 14001 maintained in external audit
Overall risk profile Continue to implement treatment actions to ensure risk profile is reduced
Risk treatment actions continue. Greater focus on risk led to a reduction in risks rated greater than moderate, from 34 to 22.
Time lost to injuries Zero lost time injuries
Overall target - 0.
Improvement target -13.5 (i.e. 10% reduction in lost time injury frequency rate on previous year’s target)
Reduce workplace injuries.
Maintain certification to AS/NZS 4801
Implement safety culture improvements
11
The lost time injury frequency rate was 19.4 compared with 16.9 in 2009/10.
The number of workplace injuries was 74 compared with 70 in 2009/10.
Certification to AS/NZS 4801(Occupational Health and Safety Management Systems) was maintained following external audit.
Safety for LIFE program was launched
SOCIAL
Community satisfaction 70 to 80% overall satisfaction Overall satisfaction, based on survey results:
Inner Harbour 72%
Outer Harbour 73%
Support for the Inner Harbour in its role as a busy working port has increased significantly:
Inner Harbour 91%
Outer Harbour 94%
Actions on complaints and suggestions
Follow up all complaints and continue to implement improvement opportunities
All complaints followed up. Industry working group continued to investigate and trial potential for reducing rail noise impacts.

Fremantle Ports | Annual Repor t 2011 | Page 20
Back Forward
Performance Service Delivery
Objective: Providing reliable and efficient services that meet customer expectations
Key Outcomes Sought:Understanding changing customer needs and being responsive to them Completion of major infrastructure projects
Inner Harbour Deepening and Berth Works CompletedFremantle Port’s Inner Harbour and channel deepening and associated berth works were completed in April 2011. The $250 million infrastructure project was achieved on budget and within two years of the works commencing. It was one of the biggest projects undertaken at the port since the opening of Fremantle Harbour in 1897 and was essential to enable the port to remain competitive.
The project involved constructing a 1 km sea wall extension at Rous Head to establish a reclamation area, dredging the Inner Harbour and Entrance Channel and realigning the Deepwater Channel, strengthening existing container Berths 4 to 9 on North Quay and reconstructing Berth 10 to enable it to handle container shipping. This berth now provides an additional 180 metres of operational wharf space for the port’s container trade and received its first container ship, Safmarine Meru on 1 July 2010.
The average size of container ships calling at Fremantle Port has increased by more than 85 percent since the mid 1990s. Deepening was essential to enable the port to accommodate bigger ships at full cargo-carrying capacity, thus retaining shipping services and maintaining compatibility with other national container ports. Previously, some of the larger container ships calling at the port were unable to load to full capacity.
Phase 2 of the deepening, between August and November 2010 involved use of the cutter suction dredge Phoenix to break up clean limestone mainly from the harbour basin and Entrance Channel. The limestone was deposited via the trailer suction hopper dredge Gateway into an approved site about 7 kilometres offshore.
The final phase, completed in April 2011, involved the use of a small back hoe dredge to tidy up along the container berth faces on North Quay.
Deepening was essential to enable the port to accommodate bigger ships at full cargo-carrying capacity, thus retaining shipping services and maintaining compatibility with other national container ports.
Maersk Gironde at re-built Berth 10 on North Quay.

Fremantle Ports | Annual Repor t 2011 | Page 21
Back Forward
The deepening to 14.7 metres has increased the maximum draft capability for container shipping from the previous 12.7 metres to 14 metres, using Dynamic Underkeel Clearance draft-enhancing technology.
The ability to service the larger, more efficient ships fully loaded means the same volumes of cargo can be carried on fewer ship visits, with benefits in terms of economies of scale, fuel savings and reduced greenhouse gas emissions.
Early Contractor InvolvementFremantle Ports used an early contractor involvement approach to plan the project with lead contractors Thiess Georgiou Joint Venture and international dredging specialist Boskalis Australia, before reverting to a series of lump sum contracts during the execution phases. The effective partnership ensured that the required engineering outcomes were achieved. Equipment and methodologies were carefully selected to meet the project objectives and to enable the project to be completed in a timely way without interruption to shipping.
Environmental MonitoringThe project was undertaken with strict environmental conditions in place and an extensive monitoring program was implemented throughout to demonstrate compliance. An independently-chaired and widely-representative Dredging Reference Group met regularly to oversee the implementation of the monitoring program and communication of results.
Virtual Navigational Aids The realignment and deepening of the Deepwater Channel as part of the Inner Harbour deepening project meant that a number of floating navigational buoys would either not be required or would need to be relocated. The channel, used by all deep-draft commercial shipping, lies approximately five nautical miles north-north-west of North Mole. Its realignment has simplified the seaward approach into the Gage Roads shipping lane.
Using international guidelines and in close cooperation with the marine pilots, Fremantle Ports reviewed the floating buoys and has introduced virtual and synthetic navigational aids to increase vessel safety. There is an international trend towards use of such aids, which are essentially a fixed radio broadcast transmitting a set of known coordinates to mark hazards and channel boundaries.
The project was undertaken with strict environmental conditions in place and an extensive monitoring program was implemented throughout to demonstrate compliance.
Margaret River Bridge arrives.

Fremantle Ports | Annual Repor t 2011 | Page 22
Back Forward
Performance Service Delivery
The virtual navigation aids do not require any physical presence on the water. Synthetic aids are radio transmissions additionally marking a fixed or floating aid. Marine pilots guiding deep-draft ships through the channel see the virtual and synthetic aids on their navigational instruments and charting devices.
From its vessel traffic service, Fremantle Ports has established four virtual and two synthetic navigational aids that now mark the southern approaches to the Deepwater Channel. These types of navigational aids appear within the Australian Maritime Safety Authority’s real-time national aids database. They have been used as an example of how navigational safety can be quickly and accurately enhanced in the operational environment at very little inconvenience or cost.
Maintenance and Facilities Upgrades
Reconstruction of Conveyor and TunnelThe repair of a concrete tunnel severely damaged by a coal fire at the Kwinana Bulk Terminal in 2007 has been completed. The fire on the bulk materials storage pad also destroyed a conveyor and necessitated replacement of this equipment.
It is expected that the system will be ready for commissioning in August 2011.
Kwinana Bulk Terminal ShutdownThe first major maintenance shutdown of equipment at the Kwinana Bulk Terminal was carried out between 14 and 18 March 2011. This was the first time that maintenance shutdown activities were allocated to a fixed period in the shipping program, with shipping operations stopped to allow the work to occur. The main driver for this was the heavy shipping schedule in the previous six months with no significant gaps to complete essential works. All customers were advised well in advance.
New FendersSome of the fendering on J Berth was replaced in March 2011. This berth was constructed in the early 1970s. It was originally used by Stateships but for many years it has been the berth for the Inner Harbour tugs.
The replacement fendering consists of three panels fixed to the piles, with cylindrical rubbers between the panels and the wharf deck to absorb the berthing forces. The fender rubbers were recycled from the recent North Quay berth works.
Tenders have been called for the installation of new fendering on Berth 2 on North Quay, with the intention of having this work completed in 2011/12.
The repair of a concrete tunnel severely damaged by a coal fire at the Kwinana Bulk Terminal in 2007 has been completed.
Tunnel repairs at the Kwinana Bulk Terminal.

Fremantle Ports | Annual Repor t 2011 | Page 23
Back Forward
Administration Building RefurbishmentFurther work was undertaken during the year on renovations to the heritage-listed Fremantle Ports Administration Building on Victoria Quay. This landmark building was completed in 1964 and the harsh marine environment had taken its toll on the exterior cladding. The ceramic tiling had lost its lustre and in some cases its adhesion.
The tiles have been cleaned and coated with an epoxy long-life surface, colour matched as closely as possible to the original. Repairs have been undertaken to the windows of the building and the steel mast on the Signal Station has been refurbished. The work on the mast required extensive planning because of the communication and radar attachments.
Changes in organisational structure in 2010 brought about the need for relocation of some branches. This required changes to office layouts and in 2011 some interior refurbishment was also undertaken.
Shed DemolitionTenders were called in November 2010 for the demolition of the overhead transit shed behind common user Berth 12 on North Quay. This very large, high shed was constructed for Fremantle Port’s first container terminal in 1969. For many years it has served as storage for cargoes such as imported steel, but use of the shed has remained relatively low, with high maintenance costs.
Removal of the shed will open up more wharf space for cargo handling and will improve the efficiency of general cargo discharge and loading.
Asset Maintenance & Service Costs 2010/2011
17.6% Buildings & Improvements
24.0% Interface Structures
34.2% Cargo Handling Equipment0.1% Land Unimproved
0.6% Railways
1.2% Land Improvements
1.5% Dredged Areas
1.6% Roads
3.1% Navigational Aids
6.5% Utilities
9.5% Plant & Equipment
Demolition of the large shed on Berth 12 began in April 2011.
The Signal Station is situated at the top of the Administration Building.

Fremantle Ports | Annual Repor t 2011 | Page 24
Back Forward
Performance Service Delivery
Increase in MSIC ApplicationsFederal Government changes this year to enhance the Maritime Security Identification Card (MSIC) scheme had flow on impacts for Fremantle Ports’ MSIC Service Centre.
Under Australia’s Maritime Transport and Offshore Facilities Act 2003, MSICs are required for people working within or needing to enter maritime security zones.
As well as a tightening of eligibility criteria from 1 July 2010, the validity period for an MSIC has been reduced from five years to four. Also, 2011 is the 5th anniversary of the MSIC scheme, making it the renewal year for people issued with the card in 2006.
In response to a related increase in new applications and the large number of applications for renewals, Fremantle Ports has introduced a mobile MSIC unit, taking the service to industry. As well as the convenience for applicants, this increases the rate of throughput.
An online tracking system has been introduced to enable clients to log in to see whether their MSIC is ready for collection.
Since 1 May 2006 Fremantle Ports’ MSIC Service Centre has processed more than 42,000 applications for Fremantle and regional ports in Western Australia.
Port Incidents
Unloader DamageOn 26 June 2011, Fremantle Ports’ auger-style unloader on the Kwinana Bulk Jetty was damaged when the vertical arm contacted the side of a ship’s hatch and continued to slew for several seconds. An investigation was undertaken and temporary repairs will enable the equipment to be put back in use until a new arm can be manufactured and installed.
Rail Bridge CollisionCommuter services on the Fremantle passenger rail line were interrupted significantly when a bunkering vessel, Parmelia 1, was caught in a strong tidal current and collided with the pylons of the Fremantle rail bridge. The collision resulted in damage to a mast for the overhead powerlines for the rail system.
The incident was the subject of a Department of Transport investigation.

Fremantle Ports | Annual Repor t 2011 | Page 25
Back Forward
Performance Capability for the Future
Objective: Ensuring sound planning for all aspects of our business, including resources, services and infrastructure
Key Outcomes Sought: Completing important planning projects critical to our future
Rous Head PlanningAs a by-product of the first of the two major dredging campaigns, 27 hectares of reclaimed land is now available at Rous Head.
This new land is equivalent to about 20 per cent of the area of the existing North Quay/Rous Head precinct. Reclaimed land at Rous Head presents a significant opportunity to increase capacity and to enhance port efficiency in areas such as road and rail operations.
Starting with a call for Expressions of Interest, which closed on 15 September 2010, Fremantle Ports is working towards the leasing and development of this new site, and planning is well advanced. Significant work has been carried out to define land uses and plan the infrastructure for this area.
A tender process for allocating the new land was commenced and development of key infrastructure, including roads and service corridors on the reclaimed land is expected to be completed in 2012.
As well as providing scope to improve the port layout and capacity, the reclaimed land presents an opportunity to incorporate performance requirements in new leases which will promote overall industry efficiency. Fremantle Ports will be working closely with industry to establish key performance indicators and benchmarks for assessing operational efficiency and transparency.
Kwinana Bulk Jetty Fremantle Ports has been granted an extension of its existing environmental approval relating to long-held plans for an additional berth at the Kwinana Bulk Jetty.
Work has recommenced to assess the export capability that an additional bulk berth would provide and the way in which this multi-user infrastructure might be provided is currently being explored.
Significant work has been carried out to define land uses and plan the infrastructure for this area.
The Kwinana Bulk Jetty is one of two bulk cargo facilities owned and operated by Fremantle Ports at Kwinana.
Reclaimed land at Rous Head.

Fremantle Ports | Annual Repor t 2011 | Page 26
Back Forward
Performance Capability for the Future
Strategic Asset ManagementAsset ownership is a significant cost to Fremantle Ports and developing a best-practice strategic asset management system continues to be a corporate priority. Over the past 12 months Fremantle Ports has developed and implemented a number of strategic asset management improvements including:
• a new expenditure prioritisation model for optimising allocation of funds, using cost-benefit analysis;
• a condition-rating manual (developed in partnership with the Port of Melbourne Corporation) to provide a standardised approach for assessing and rating the condition of port assets; and
• levels of service guidelines for identifying and documenting current and future needs of customers and how these needs can be met efficiently through asset investment and maintenance programs.
Fremantle Ports is finalising a strategic asset management improvement plan which will be implemented over the next two years. Management, financial, economic and engineering practices are being developed for each critical class of asset.
Fremantle Ports is finalising a strategic asset management improvement plan which will be implemented over the next two years.
Siwertell unloader, Kwinana Bulk Jetty.

Fremantle Ports | Annual Repor t 2011 | Page 27
Back Forward
Performance Trade and Business Growth
Objective:
Promoting and facilitating trade and business growth opportunities
Key Outcomes Sought: Maintaining existing trade and business and capturing new trade and business opportunities
Kwinana Bulk Terminal UpgradeDuring the year, Fremantle Ports thoroughly assessed the merits of various proposals for use of available capacity at the Kwinana Bulk Terminal (KBT). This took into account commercial, operational and other factors.
Mineral Resources Limited, a diversified Australia-based company with a history of success in the mining industry emerged as the preferred proponent. A commercial agreement for the export of up to 4.4 million tonnes of iron ore was completed in May 2011. As part of this agreement, Mineral Resources will fund the majority of a significant upgrading of export infrastructure at the terminal. The iron ore will be sourced initially from the company’s Carina mine near Koolyanobbing and will be railed to the port.
It was also seen as important that capacity be made available to existing customer, Griffin Coal (now owned by Indian business conglomerate Lanco Infratech) to continue its coal exports from KBT to cover the transition period until new facilities for handling coal are built at Bunbury or elsewhere. On this basis Fremantle Ports has concluded negotiations with Griffin Coal for a capacity allocation of 750,000 tonnes of coal annually for four years, with that company also contributing to the cost of the planned upgrading. The agreement with Griffin Coal will help to maintain continuity of employment for Collie coal miners.
An application for works approval lodged with the Department of Environment and Conservation was advertised for public comment in June and other consultation with customers, neighbouring industries, local government and community was undertaken.
Fremantle Ports acquired the Kwinana Bulk Terminal from BHP Billiton in 2002 and since then has spent over $39 million upgrading infrastructure and service capability. The current program at KBT, involving a $44 million investment of private and public sector funding, will further improve export capacity and efficiency, with the works expected to be completed before the end of 2011.
Kwinana Bulk Berth 2.
New export infrastructure at the Kwinana Bulk Terminal will include covered conveyors.
Fremantle Ports acquired the Kwinana Bulk Terminal from BHP Billiton in 2002 and since then has spent over $39 million upgrading infrastructure and service capability.

Fremantle Ports | Annual Repor t 2011 | Page 28
Back Forward
Performance Trade and Business Growth
Benefits of the new trade opportunities include:
• investment by Mineral Resources Ltd at the mine and port, with a contribution to this investment by Griffin;
• significant local spend on infrastructure, equipment and services;
• significantly improved bulk trade handling operations in the Outer Harbour through improved export infrastructure at Kwinana Bulk Terminal;
• improved berth and rail capacity utilisation at the terminal;
• payment of mining royalties to the State (estimated by Mineral Resources Ltd at $105 million in the first three years);
• revenue flowing to Western Australia from iron ore sales (Mineral Resources expects this to be approximately $1.7 billion in the first three years of operation); and
• jobs creation.
Cruise Ship VisitsCruising is now one of the most popular and fastest growing sectors of the tourism industry worldwide. Australia is regarded internationally as a growing destination and cruise lines are now assigning newer and larger vessels to the market where they are achieving good yields. Australian cruise industry passenger numbers quadrupled between 2002 and 2010.
Fremantle is an established destination and home port for international cruise ships. Since 2002/03, the number of cruise vessel visits has grown with seasonal basing, which involves a complete passenger transfer when ships call.
Cruise Vessels Visiting Fremantle Port
Ves
sels
97/98 98/99 99/00 00/01 01/02 02/03 03/04 04/05 05/06 06/07 07/08 08/09 09/10 10/11 11/12 est
3 9 7 7 5 5 5 7 11 7 8 14 14 11 16
0 0 0 0 0 13 8 18 5 9 17 14 25 18 23
30
25
20
15
10
5
0
INTERNATIONAL
HOME BASE
A commercial agreement for the export of up to 4.4 million tonnes of iron ore annually was completed in May 2011.

Fremantle Ports | Annual Repor t 2011 | Page 29
Back Forward
In 2009/10, there were 39 ship calls with three ships seasonally basing in Fremantle. As only two ships (Athena and Sun Princess) seasonally based in 2010/11, the number of ship calls decreased to 29 but with Pacific Sun returning to seasonally base next financial year, there are 39 ship calls scheduled.
Passenger numbers at Fremantle decreased from 92,534 in 2009/10 to 52,321 in 2010/11 but are predicted to reach their highest level in recent times at 96,000 next year, based on current ship bookings.
Fremantle Ports is continuing to work with Australia’s peak cruising body Cruise Down Under, the City of Fremantle, tourism bodies and other agencies to attract and maintain cruise line calls. This involves regular consultation with industry, investing in improvements to infrastructure, better informed management and targeted marketing and promotion.
Fremantle Ports has now participated in Cruise Down Under activities for more than 14 years and has helped to increase the number of cruise ship visits to Fremantle and also to ensure that the interests of WA regional ports are represented. A Fremantle Ports representative currently chairs Cruise WA.
Passengers through Fremantle Port
Pas
seng
ers
97/98 98/99 99/00 00/01 01/02 02/03 03/04 04/05 05/06 06/07 07/08 08/09 09/10 10/11 11/12 est
1,862 6,000 2,234 2,093 2,024 20,492 10,386 4,954 8,181 2,290 9,000 13,788 17,763 11,134 20,000
459 750 1,241 1,162 1,056 850 3,669 3,775 2,933 3,700 11,500 12,080 37,127 20,508 38,000
487 993 1,490 1,395 1,260 950 1,745 4,060 2,991 3,500 12,500 12,366 37,644 20,679 38,000
40,000
35,000
30,000
25,000
20,000
15,000
10,000
5,000
0
TRANSIT PAX
DISEMBARKING PAX
EMBARKING PAX
Queen Elizabeth arrives in March 2011 for her first visit to Fremantle Port.

Fremantle Ports | Annual Repor t 2011 | Page 30
Back Forward
Performance Trade and Business Growth
HighlightsHighlights of the cruise season were the second call of Queen Mary 2, the largest cruise ship to visit Australia, and the maiden visits of Queen Elizabeth and Seabourn Sojourn. Carnival Australia has announced that Queen Mary 2 will make Australia its “home away from home” in 2012 and the ship will visit Fremantle twice in February 2012.
The departure of Queen Elizabeth from Victoria Quay on 1 March 2011 attracted thousands of people to farewell the ship.
Fremantle Passenger TerminalThe Fremantle Passenger Terminal has undergone significant renovation over the past two years. The $2 million program to upgrade the Fremantle Passenger Terminal has improved facilities for passenger and cargo handling while respecting the building’s heritage significance. The program involved a series of upgrades to ensure the terminal continued to meet modern cruise shipping needs as well as relevant security, Customs, quarantine and occupational health and safety requirements.
Cruise lines have expressed high satisfaction with the terminal in meeting cruise ship and passenger needs and Fremantle Ports remains committed to undertaking ongoing improvements to facilities and processes at the terminal while respecting the heritage requirements in any works.
Refurbishment of the terminal won the Award for Conservation of a Heritage Place – Non Residential at the 2011 City of Fremantle and City of East Fremantle Heritage Awards. The terminal project was also a finalist in the Outstanding Non-residential Conservation category of the 2011 Western Australian Heritage Awards.
To mark the 50th anniversary of the opening of the first stage of the terminal in December 2010, a commemorative booklet was produced and was awarded a Commendation in the Fremantle - East Fremantle Local History Award – Publication category.
Fremantle Waterfront
Commercial PrecinctFremantle Ports is continuing to explore a way forward for the development of a commercial precinct on Victoria Quay, taking into account community feedback on previous plans.
The Fremantle Passenger Terminal has undergone significant renovation over the past two years.
The Fremantle Passenger Terminal, a landmark building on Victoria Quay, was opened in 1960.
Fremantle Ports | Annual Repor t 2011 | Page 31
Back Forward
Development approval for ING Real Estate’s proposed mix of commercial, retail and café space lapsed in March 2011 and an extension of the approval will not be sought. The delay in getting this project underway as originally planned was linked to the impacts of the global economic downturn on property markets and resultant uncertainty regarding a future construction date.
Fremantle Ports remains keen to see commercial development in this area which is between the Fremantle train station and the waterfront.
Given the potential of the commercial precinct site in terms of reactivating the Victoria Quay Waterfront and the importance of this site within the greater urban context of the City of Fremantle, Fremantle Ports is exploring these options with the help of a high level working group. As well as Fremantle Ports personnel, the group has external representatives with experience in planning, design, architecture and economics.
The main objectives of the working group are to determine the key learnings from the previous ING proposal and to explore development options consistent with the Fremantle Waterfront Masterplan and the City of Fremantle’s economic development and strategic planning directions. The outcomes of this work will be used as the basis for further consultation with key stakeholder groups.
Now that it will not be proceeding with the commercial development, ING has indicated its interest in selling its leasehold of the adjacent E Shed Markets and Fremantle Ports plans to take up this opportunity. Settlement is expected to be completed at the end of September 2011.
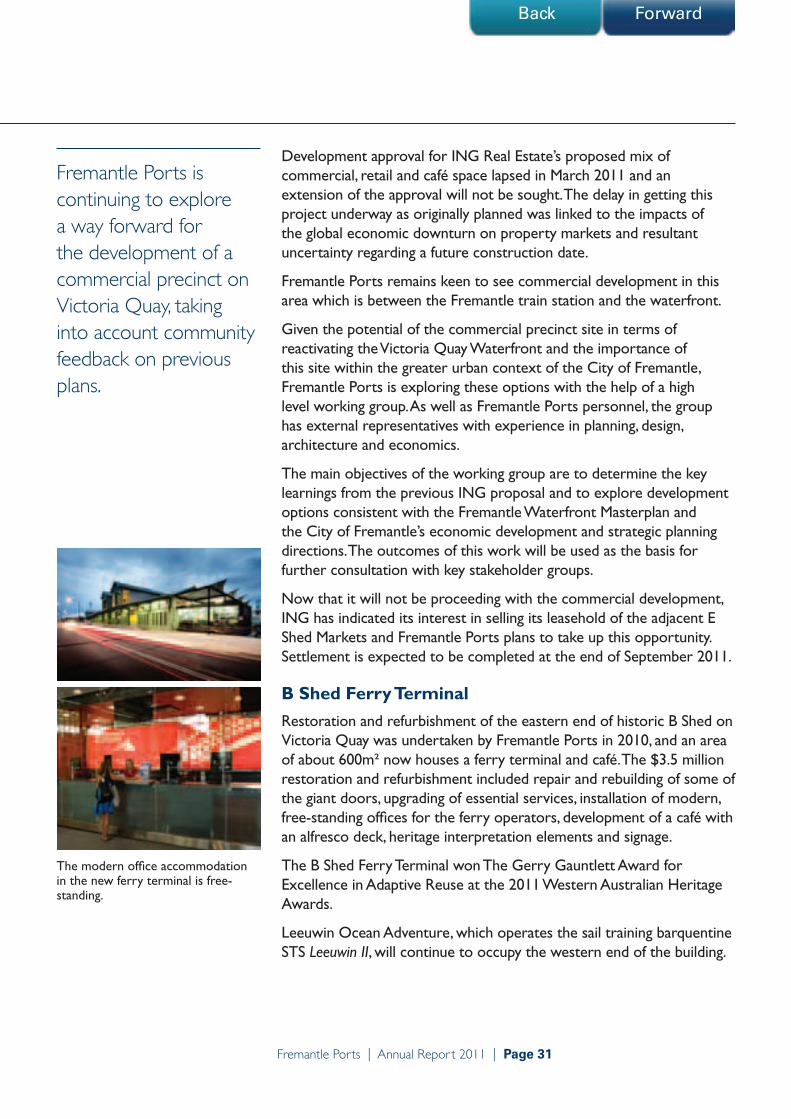
B Shed Ferry TerminalRestoration and refurbishment of the eastern end of historic B Shed on Victoria Quay was undertaken by Fremantle Ports in 2010, and an area of about 600m² now houses a ferry terminal and café. The $3.5 million restoration and refurbishment included repair and rebuilding of some of the giant doors, upgrading of essential services, installation of modern, free-standing offices for the ferry operators, development of a café with an alfresco deck, heritage interpretation elements and signage.
The B Shed Ferry Terminal won The Gerry Gauntlett Award for Excellence in Adaptive Reuse at the 2011 Western Australian Heritage Awards.
Leeuwin Ocean Adventure, which operates the sail training barquentine STS Leeuwin II, will continue to occupy the western end of the building.
Fremantle Ports is continuing to explore a way forward for the development of a commercial precinct on Victoria Quay, taking into account community feedback on previous plans.
The modern office accommodation in the new ferry terminal is free-standing.

Fremantle Ports | Annual Repor t 2011 | Page 32
Back Forward
Performance Trade and Business Growth
Port Discovery CentreFremantle Ports is investigating the possibility of developing a Port Discovery Centre in the middle section B Shed. Based on the overall theme, “if only the quay could talk” this centre would cater mainly for children and school groups and would be an interactive learning space.
The Victoria Quay Waterfront Interpretation Plan is being used to guide the selection of themes and stories to be included and a team of consultants has been appointed to assist with the planning, design and costing. Ensuring relevance to the national curriculum for primary schools has been an important consideration in planning the content. The journey through the centre is being designed to create a better understanding of Fremantle Port’s vital role in the lives of all Western Australians.
Discussions are also underway with potential community partners to help deliver the education programs and ensure a valuable experience for visitors.
As well as the interactive learning area, the centre will potentially include a multi-use function area and a viewing gantry for observation of the daily operations in the Inner Harbour.
Rous Head MarinaFremantle Ports has been progressing planning for a proposed marina at Rous Head.
A call for expressions of interest was widely advertised in November 2010, seeking proposals from private proponents interested in developing and operating an integrated marina at the site. It is envisaged that the development will have recreational marina facilities, incorporating wet and dry boat pens, and a complementary landside development, potentially including cafés and restaurants, some retail, office space, a ferry terminal and other marine-related uses.
The response to the call for expressions of interest was strong, with a substantial number of high quality proposals received. Shortlisted proponents were invited to submit more detailed proposals.
A preferred proponent will be selected to progress the finalisation of commercial agreements, completion of site investigations and stakeholder consultation, and the submission of all necessary approval applications.
Fremantle Ports anticipates that construction of the marina could begin in late 2012, with a likely construction program of 18 to 24 months.
Fremantle Ports has been progressing planning for a proposed marina at Rous Head.
W.A. Premier Colin Barnett announces the Rous Head Marina proposal with the Hon Simon O’Brien MLC.

Fremantle Ports | Annual Repor t 2011 | Page 33
Back Forward
Magellan Lead Exports HaltedIvernia Inc, parent company of Magellan Metals, announced on 5 April 2011 that the company had voluntarily halted its lead mining operations at Wiluna. This followed results of isotopic testing of a sample of dried mud on the bottom of a shipping container transported from the Magellan minesite to Fremantle Port.
In informing the Office of the Environmental Protection Authority, Magellan Metals said the result showed a high probability that some or all of the lead in the sample was from the Magellan mine. The result did not confirm whether the mud came from the mine site or from a rail yard at Leonora, where there may have been residual lead from previous operations of the Magellan mine between 2005 and 2007.
The decision to halt operations followed two earlier interruptions to the transportation of Magellan lead to the port. On 31 December 2010, the Minister for Environment issued a stop order to Magellan Metals to cease transporting its product from the Wiluna minesite after traces of airborne lead carbonate had been found within sealed sea containers used to transport lead.
Transportation of lead to the port resumed in late February, but on 15 March, Ivernia announced that Magellan Metals had voluntarily delayed the resumption of regular transport operations from the mine following revelations that a number of trains transporting lead had travelled on unauthorised routes.
The mine has since been placed under care and maintenance.
Trade Results Total port trade reached 26.1 million tonnes in 2010/11. This was 0.2 per cent down on the 26.2 million mass tonnes recorded in 2009/10. The main reason for the decrease in trade volumes in 2010/11 was the fall in Outer Harbour exports, particularly grain exports.
Total value of trade through Fremantle Ports in 2010/11 was $25.9 billion.
Total imports increased by 1.0 million tonnes or 8.2 per cent and total exports decreased by 7.4 per cent for this period.
Bulk cargo contributed 19.2 million mass tonnes or 73.7 per cent of total port trade in 2010/11, 0.6 per cent lower than last year. Bulk grains and oilseeds exports decreased by 1.5 million tonnes or 36.1 per cent following a Western Australian crop of around 7.0 million tonnes in 2010/11. The port’s principal bulk cargo, petroleum products, increased from 8.4 million mass tonnes in 2009/10 to 8.6 million mass tonnes in 2010/11. Crude petroleum imports were at a similar level to last year.
Common user Berth 2 at North Quay.

Fremantle Ports | Annual Repor t 2011 | Page 34
Back Forward
Refined petroleum imports increased by 30.3 per cent and refined petroleum exports (including bunkers) increased by 3.8 per cent.
Inner Harbour imports increased by 9.2 per cent and exports decreased by 3.0 per cent. Total containers handled increased by 7.4 per cent in 2010/11 to a record level of 598,534 TEU, an increase of 41,091 TEU on the previous year. Container trade is almost five times the level in 1990/91, representing an average annual growth of 8.3 per cent for this period.
Non container cargoes in the Inner Harbour remained at similar levels compared with the previous year. Imports of other transport equipment and exports of animal feeds were the only significant increases compared with the previous year. Imports of iron and steel products decreased by 5.4 per cent compared with the previous year.
Performance Trade and Business Growth
IMPORTS
EXPORTS
TOTAL
Mas
s Ton
nes
(Mill
ions
)
30
25
20
15
10
5
0
01/02 02/03 03/04 04/05 05/06 06/07 07/08 08/09 09/10 10/11
10.628 11.023 11.727 11.434 1.175 12.010 13.009 12.545 12.103 13.091
12.024 12.467 14.212 14.112 13.937 13.043 13.122 14.058 14.065 13.032
22.652 23.490 25.939 25.546 25.112 25.053 26.131 26.603 26.168 26.123
Total Port Trade 2001/2002 to 2010/2011
Unloading operations at North Quay.

Fremantle Ports | Annual Repor t 2011 | Page 35
Back Forward
In volume terms the port’s principal export commodities are alumina, grain, refined petroleum and coal which together account for 72.0 per cent of total exports.
Major Trading Regions Trade with East, South East and Southern Asia amounted to 57.0 per cent of total port trade in 2010/11, 1.6 percentage points lower than 2009/10. Over the period 2001/02 to 2010/11, trade with East, South East and Southern Asia has grown from 45 per cent to 57 per cent of Fremantle’s total trade. Decrease in trade with Japan has deflated trade with East Asia by 1.7 per cent in contrast to 2009/10. South East Asian trade fell by 8.1 per cent due to a decrease in trade with Vietnam and Indonesia. In interpreting this figure, a cautionary note is that some of the decrease could reflect cargo trans-shipped through Singapore to and from other destinations. Australian coastal cargo accounts for 15 per cent of total port trade, the Middle East accounts for 17 per cent, North America four per cent, Africa one per cent, New Zealand one per cent and UK and Europe four per cent. Again, these figures could be deflated because of trans-shipments through Singapore. (A graphical presentation showing the link with world trade is shown in the Statistical Information section of this report).
Principal Commodities Imports/Exports 2010/2011 Petroleum 33%
Other 23%
Alumina 11%Wheat 10%
Black Coal 4%Cement Clinker 4%
Caustic Soda 3%
Fertilisers 2%
Chemicals & Related Products 2%
Iron & Steel Products 2%
Sulphur 2%
Animal Feeds 1%
Metal Scrap 1%Sulphuric Acid 1%
Machinery Agric/Indust 1%
Container trade for the year reached a record level, totalling 598,534 TEU.

Fremantle Ports | Annual Repor t 2011 | Page 36
Back Forward
ImportsTotal imports increased by 8.2 per cent during 2010/11 to 13.1 million tonnes. Inner Harbour imports increased by 9.2 per cent mainly due to a rise in containerised iron and steel products and chemicals and related products. Outer Harbour imports increased by 7.8 per cent due to an increase in cement clinker, refined petroleum, sulphur and gypsum. Overall petroleum product imports (crude and refined) increased by 2.1 per cent compared with last year.
New motor vehicle imports through Fremantle Ports totalled 91,403 units in 2010/11, a decrease of 3.7 per cent compared with the previous year. New motor vehicle imports from Japan and Thailand decreased by 8.0 per cent and 5.7 per cent respectively in 2010/11 compared with last year. Imports from South Korea decreased by 13.8 per cent. Japan’s share of total motor vehicle imports was 37.5 per cent in 2010/11 compared with 39.3 per cent last year. Imports from Thailand and South Korea accounted for 22.7 per cent and 17.4 per cent of the total respectively. Japan’s recent natural disaster is expected to cause delays in production of motor vehicles in Japan and Thailand due to the unavailability of factory parts.
Performance Trade and Business Growth
New Motor Vehicles - Imports 2001/2002
to 2010/2011
Veh
icle
s
120000
111000
110000
100000
90000
80000
70000
60000
50000
40000
30000
20000
10000
0
01/02 02/03 03/04 04/05 05/06 06/07 07/08 08/09 09/10 10/11
VEHICLES 47,656 51,680 61,745 69,845 85,556 103,734 104,253 75,348 94,933 91,403
Most of the trade in new motor vehicles is handled at the eastern end of Victoria Quay.

Fremantle Ports | Annual Repor t 2011 | Page 37
Back Forward
Import Cargo Classified According to Cargo Class
- Thousands of Tonnes
Bulk 2010-11 2009-10
Petroleum Crude 5,517 5,578
Cement Clinker 959 656
Caustic Soda 784 735
Petroleum Refined 738 566
Phosphates - Fertilisers 447 383
Sulphur 418 279
Slag Residue ex Steel Furnace 194 163
Gypsum 173 87
Ammonia 117 124
Urea 116 207
Other 130 155
Totals 9,594 8,934
Non Container General Cargo 2010-11 2009-10
Iron and Steel Products 157 166
Motor Vehicles - New 143 151
Vehicles - Industrial and Agricultural 83 75
Machinery - Agricultural, Industrial 27 27
Other Transport Equipment and Parts 23 13
Rubber Manufactures 9 6
Manufacturers of Metal 6 13
Lime 6 0
Fabricated Construction Materials 5 0
Miscellaneous Manufactured Articles 2 2
Other 4 15
Totals 465 468
Container 2010-11 2009-10
Chemicals and Related Products 356 301
Iron and Steel Products 311 247
Paper, Paperboard and Articles of Paper Pulp 196 196
Machinery - Agricultural, Industrial 174 158
Manufactures of Metal 169 139
Unclassified Goods 145 108
Plastic Wares and Other Manufactures 136 111
Bricks, Tiles, Pavers, etc 126 117
Furniture and Parts 119 105
Ale, Beers and Stout; Cider (Alcoholic) 101 107
Other 1,180 1,112
Totals 3,012 2,701

Fremantle Ports | Annual Repor t 2011 | Page 38
Back Forward
ExportsTotal exports decreased by 7.4 per cent during 2010/11 to 13.0 million tonnes. Inner Harbour exports decreased by 3.0 per cent mainly due to substantial falls in containerised grain exports. Containerised grain exports decreased by 41.4 per cent or 9262 TEU in 2010/11 mainly due to the poor grain crop and competitive bulk shipping rates. Other Inner Harbour exports to decline were oats and animal feeds. Inner Harbour commodities to increase were mineral sands, crude minerals and nickel matt.
Outer Harbour exports decreased by 8.9 per cent mainly due to the decrease of coarse grains. Bulk wheat exports decreased by 25.9 per cent or 842,115 tonnes in 2010/11. Outer Harbour commodities to increase were coal and sulphuric acid.
In 2010/11 Fremantle Ports’ major overseas export markets by volume (percentage of total exports) were China, 19.0 per cent, Japan 11.0 per cent, South Korea 6.0 per cent, Singapore 5.7 per cent, Indonesia 5.2 per cent, India 4.2 per cent, Iraq 3.6 per cent, and Malaysia 3.3 per cent. Exports to China decreased by 8.0 per cent in 2010/11 and represent 2.5 million tonnes or 19.0 per cent of total exports, making that country Fremantle’s principal export trading partner. Alumina was the major export to China representing 0.95 million tonnes in 2010/11, a decrease of 11.3 per cent compared with 2009/10. Coal exports to China continue to grow with an increase of 41.2 per cent compared with 2009/10.
Exports to other Australian ports were 2.4 million tonnes in 2010/11, 4.7 per cent lower than last year, predominantly due to a decrease in alumina exports.
Performance Trade and Business Growth
Containerised grain exports decreased by 41.4 per cent or 9262 TEU in 2010/11 mainly due to the poor grain crop and competitive bulk shipping rates.
Loading grain at the Kwinana Grain Jetty. Photograph courtesy Co-operative Bulk Handling

Fremantle Ports | Annual Repor t 2011 | Page 39
Back Forward
Export Cargo Classified According to Cargo Class
- Thousands of Tonnes
Bulk 2010-11 2009-10
Alumina 2,800 2,845
Wheat 2,412 3,254
Refined Petroleum 2,154 2,047
Black Coal 1,133 545
Sulphuric Acid 260 192
Canola Seed 159 307
Ships Bunkers 150 173
Barley 113 556
Iron Ore 109 93
Animal Feeds 91 44
Other 256 459
Totals 9,636 10,517
Non Container General Cargo 2010-11 2009-10
Metal Scrap 288 278
Sheep 113 112
Cattle and Calves 63 51
Ammonium Nitrate 29 59
Vehicles - Industrial and Agricultural 6 11
Motor Vehicles - New 5 2
Hay, Chaff, Fodder (for consumption on voyage) 5 5
Machinery - Agricultural, Industrial 4 5
Unclassified Goods 2 1
Other Transport Equipment and Parts 2 2
Other 3 7
Totals 521 532
Container 2010-11 2009-10
Hay, Chaff, Fodder Peas (Stock Feed) - Cargo 266 397
Waste Paper 217 206
Mineral Sands 207 154
Titanium Dioxide 192 183
Malt 176 188
Other Crude Minerals 149 123
Wheat 136 228
Non Ferrous Metals 99 109
Nickel Matt and Concentrates 99 69
Metal Scrap 91 85
Other 2,864 3,015
Totals 4,496 4,758

Fremantle Ports | Annual Repor t 2011 | Page 40
Back Forward
Container Trade When compared with 2009/10:
• Container trade for the year reached a record level, totalling 598,534 TEU.
• Total container exports increased by 7.2 per cent and imports increased 7.5 per cent.
• Full container exports decreased by 5.6 per cent or 10,022 TEU and full imports increased by 11.1 per cent or 29,393 TEU.
• Empty container exports increased by 32.8 per cent and empty imports decreased by 31.6 per cent.
• Coastal container throughput totalled 68,731 TEU, a decrease of 6.5 per cent on 2009/10.
Performance Trade and Business Growth
Container TradeComparison 2005/2006
to 2010/2011TEUs - Twenty foot equivalent units Growth p.a 2005/06 to 2010/11 - 5.6%
IMPORTS
EXPORTS
TOTAL
2005/06 2006/07 2007/08 2008/09 2009/10 2010/11
232,825 258,738 299,075 287,962 288,463 310,070
223,229 247,081 281,270 277,529 268,980 288,464
456,054 505,819 580,345 565,491 557,443 598,534
650000
600000
550000
500000
450000
400000
350000
300000
250000
200000
150000
100000
50000
0
TE
Us
The container berths on North Quay have been strengthened to accommodate bigger ships.

Fremantle Ports | Annual Repor t 2011 | Page 41
Back Forward
Top Ten Container Commodities
Imported and Exported
Full Container Trade Comparison 2005/2006
to 2010/2011
Major Container Commodities Imported - TEUCommodities 2009/2010 2010/2011 Variance %
Machinery - Agricultural, Industrial 28,110 30,624 8.94%Furniture and Parts 24,757 27,811 12.34%Iron and Steel Products 15,951 20,332 27.47%Chemicals and Related Products 17,328 20,273 17.00%Paper, Paperboard and Articles or Paper Pulp 18,695 20,063 7.32%Plastic Wares and Others Manufactures 13,738 17,031 23.97%Manufactures of Metal 15,645 16,975 8.50%Unclassified Goods 9,662 13,730 42.10%Rubber Manufactures 11,354 12,985 14.36%Fabricated Construction Materials 11,941 9,333 -21.84%Total 167,181 189,157 13.15%Percentage of Total Full TEU Imports 63.4% 64.5%
Major Container Commodities Exported - TEUCommodities 2009/2010 2010/2011 Variance %
Hay, Chaff, Fodder Peas (Stock Feed) - Cargo 31,437 20,993 -33.22%Waste Paper 18,145 19,349 6.64%Malt 12,867 11,995 -6.78%Titanium Oxide 8,993 9,391 4.43%
Mineral Sands 6,494 8,664 33.42%Other Crude Minerals 5,225 6,238 18.71%
Fresh Fruit and Vegetables 6,080 6,108 0.46%Chemicals and Related Products 5,262 6,052 15.01%Fresh Meat - Chilled or Frozen 5,860 5,997 2.34%Wheat 9,209 5,681 -38.31%Total 109,602 100,468 -8.33%Percentage of Total Full TEU Exports 61.3% 59.5%
TEUs - Twenty foot equivalent units Growth p.a 2005/06 to 2010/11 - 5.1%
500000
450000
400000
350000
300000
250000
200000
150000
100000
50000
0
TE
Us
05/06 06/07 07/08 08/09 09/10 10/11
IMPORTS
EXPORTS
TOTAL
205,767 324,894 255,713 255,765 263,815 293,208
154,136 164,228 198,842 190,791 178,892 168,870
359,903 399,122 454,555 446,556 442,707 462,078

Fremantle Ports | Annual Repor t 2011 | Page 42
Back Forward
Performance Trade and Business Growth
Fremantle’s Trading PartnersFremantle Ports’ top 10 overseas trading partners collectively account for 64.6 per cent of total non trans-shipment full container trade (refer table below). Australian coastal container trade accounts for a further 13.6 per cent.
Top Ten Container Trading Partners
Percentage of Total Full Container Trade
Country 2009/2010 2010/2011
China 103,413 119,323Japan 38,455 34,711Indonesia 22,054 22,695Malaysia 22,230 22,483Singapore (1) 18,641 22,382Thailand 18,480 20,733South Korea 17,820 19,617United States of America 17,383 17,497Vietnam 10,778 9,920Taiwan 9,076 9,279
Top 10 Countries Percentage of Total Country Trade 62.9% 64.6%
Excludes all trans-shipment and empty containers Note: (1) Hub port: May include cargo trans-shipped through Singapore to and from other destinations and origins.
Livestock
Livestock Exports 2010/2011
Destination Sheep CattleOther
Livestock Total% of
Total
Asia - East 2,047 2,047 0.08%
Asia - South East 7,295 32,588 39,883 1.61%
Asia - Southern 1,189 1,189 0.05%
Indian Ocean - Mauritius 200 1,200 1,400 0.06%
Russia 1,569 1,569 0.06%
Middle East 1,910,725 71,383 1,982,108 79.91%
Mediterranean-Turkey 351,521 100,541 452,062 18.23%
Totals 2,269,741 210,517 0 2,480,258 100.0%
Live Sheep 2,269,741 head of live sheep were exported through the Port of Fremantle in 2010/11, a slight increase of 39,080 head or 1.8 per cent compared with 2009/10.
Fremantle Ports’ share of total Australian live sheep exports was 75 per cent in 2010/11, compared with 73 per cent in 2009/10 and 76 per cent

Fremantle Ports | Annual Repor t 2011 | Page 43
Back Forward
in 2008/09. The value of live sheep exports through Fremantle Ports in 2010/11 was $A261 million.
Exports from Australia during 2010/11 were 2.9 million head, 6.5 per cent lower than the previous year. The Middle East was the destination of almost all of Australian live sheep exports in 2010/11.
Kuwait was the largest export market for Australian live sheep in 2010/11 with 1.2 million head exported, followed by Bahrain, Turkey, Qatar, Jordan, Saudi Arabia, United Arab Emirates and Israel.
Live CattleLive cattle exports from Fremantle reached 211,000 head in 2010/11, an increase of 52,000 head or 32.5 per cent on 2009/10.
Fremantle Ports’ share of total Australian live cattle exports was 27.9 per cent in 2010/11. The value of live cattle exports through Fremantle Ports in 2010/11 was $A156 million.
In 2010/11, the largest export markets served from Fremantle were Turkey and Israel which account for 66 per cent of total live cattle exports.
Source of total Australian live cattle export statistics and value of trade: Australian Bureau of Statistics.
Live Sheep Exports 2006/2007 to 2010/2011
3.18 2.98 3.10 2.23 2.27HEAD
06/07 07/08 08/09 09/10 10/11
3.50
3.00
2.50
2.00
1.50
1.00
0.50
0.00
Hea
d of
Liv
e Sh
eep
(Mill
ions
)
The value of live sheep exports through Fremantle Ports in 2010/11 was $A261 million.

Fremantle Ports | Annual Repor t 2011 | Page 44
Back Forward
OUTLOOK
Treasury ProjectionsOverall, the Western Australian economy has recovered well from the global economic downturn, with growth of 4.5 per cent forecast for 2011/12, following estimated growth of 4.0 per cent in 2010/11.
Western Australia’s economy is expanding at a stable pace. Conditions in the resources sector are particularly strong, with robust demand from emerging economies and high commodity prices creating a substantial pipeline of investment activity. However, conditions in other sectors of the State’s economy are more subdued.
Households continue to display a heightened level of fiscal restraint, resulting in modest growth in discretionary spending. Activity in the established housing market has softened markedly, partly in response to higher interest rates and the withdrawal of Commonwealth stimulus measures. At the same time, the agricultural sector has been affected by extreme weather conditions, and a number of industries are being challenged by the high Australian dollar.
Nevertheless, the overall outlook for growth is positive. Western Australia is in the midst of a major investment cycle, led by construction of the $43 billion Gorgon Liquefied Natural Gas (LNG) project and several iron ore developments in the Pilbara and Mid West. Investment on these projects will underpin growth in the State’s economy in 2011/12 and 2012/13, with exports becoming the major driver of growth from 2013/14.
Data: Government of WA 2011-2012 Budget, Economic and Fiscal Outlook, Budget Paper No. 3.
Trade in 2011/12 International demand for resources, particularly from China and other emerging economies remains very strong.
Imports are expected to grow strongly in coming years, largely driven by the projected upswing in business investment (including major items of capital equipment required to support the construction of the State’s major resource projects). In addition, imports will be boosted by slightly stronger growth in household consumption.
However, there are a number of global risks which may impact on forecasts for growth in the Western Australian economy: concerns over Government debt levels in Europe, as well as the health of the US economy.
Fremantle Port’s full container trade grew by 19,400 TEU or 4.4 per cent in 2010/11 compared with 2009/10. The port’s container trade is
Performance Trade and Business Growth

Fremantle Ports | Annual Repor t 2011 | Page 45
Back Forward
expected to grow in 2011/12 based on Treasury forecasts for growth in the Western Australian economy. Improvements in containerised grain exports are forecast in 2011/12 following a good start to the season.
Following a substantial 26.0 per cent rise in 2009/10, Fremantle Port’s new motor vehicle imports declined by 3.7 per cent in 2010/11 compared with 2009/10. New motor vehicle sales remained strong in the first half of the year in 2010/11 while in the latter, sales decreased due to cautious consumer spending. Impacts from the earthquake and tsunami in Japan could continue to disrupt supply of new motor vehicles to Fremantle.
Fremantle’s live sheep exports increased by 1.8 per cent to 2.3 million head in 2010/11. Fremantle’s exports are forecast to increase to around 2.6 million head in 2011/12. ABARE (Australian Bureau of Agriculture and Resource Economics) forecasts live sheep exports will increase by around 7 per cent in 2011/12. Live sheep export prices are forecast to increase by 5 per cent in 2011/12 to $120 per head. The forecast price increase reflects strong demand for Australian live sheep, especially from the Middle East.
Fremantle Ports’ Kwinana Bulk Jetty and Kwinana Bulk Terminal bulk cargo tonnages represent around 22.0 per cent of total port bulk cargo volumes. Kwinana Bulk Jetty trade increased by 0.29 million tonnes or 20.1 per cent to 1.7 million tonnes in 2010/11. The increase was mainly due to rises in export of sulphuric acid and imports of phosphates, sulphur, gypsum and petroleum products. Trade throughput at Kwinana Bulk Jetty is forecast to be around 1.8 million tonnes in 2011/12.
Kwinana Bulk Terminal trade increased by 0.8 million tonnes or 49.5 per cent to 2.6 million tonnes in 2010/11, due to increases in coal exports, cement clinker and gypsum imports. Trade throughput at this facility in 2011/12 is forecast to be around 3.6 million tonnes. This increase in trade is due to a commercial agreement between Fremantle Ports and Mineral Resources Ltd (MRL) which will facilitate the export of iron ore through the Kwinana Bulk Terminal.
Co-operative Bulk Handling’s Kwinana grain terminal exported 2.7 million tonnes in the 2010/11 financial year compared with 4.3 million tonnes in 2009/10. The decrease of 1.6 million tonnes is due to the poor harvest in 2010/11. Higher rainfall this year has boosted hopes of a Western Australian grain crop of around 11 million tonnes, after last year’s crop of about 7 million tonnes. CBH expects exports at the Kwinana Grain Terminal to reach around 3.5 million tonnes in 2011/2012.
Petroleum product, Fremantle Port’s major bulk commodity, is forecast to be around 8.3 million tonnes in 2011/12, and dry bulk alumina exports are expected to remain at levels similar to 2010/11 (2.8 to 3.0 million tonnes).
Imports are expected to grow strongly in coming years, largely driven by the projected upswing in business investment (including major items of capital equipment required to support the construction of the State’s major resource projects).
Gypsum stockpile at Kwinana Bulk Terminal.

Fremantle Ports | Annual Repor t 2011 | Page 46
Back Forward
Performance Support Services
Objective: Ensuring appropriate and cost effective resources, processes and systems to support service delivery
Key Outcomes Sought: Support services are focused on achieving priority projects
Staffing Fremantle Ports’ full time equivalent employees total at 30 June 2011 was 318.98, compared with 306.43 last year. The attrition rate is 9.14 per cent.
Organisational Culture and CapabilityWithin the framework of its People Plan, Fremantle Ports continues to focus on building a constructive and supportive culture. The aim is to maximise employee and organisational performance by building personal and professional capability and job satisfaction.
Since Fremantle Ports’ last cultural survey in 2009, particular emphasis has been placed on improving internal customer relationships and service levels; understanding motivational drivers for employees; and getting better at performance management.
One of the key tools being used for managers and other key influencers is a 360 degree feedback system to enable people to better understand their thinking and behaviour and how this is impacts on their work group and ultimately the culture of the organisation. About 80 per cent of managers have completed their profiles and there has been good take-up of follow-up coaching to assist with understanding of results, construction of development plans and exploration of constructive leadership styles.
The 360 degree feedback opportunity will be extended to team leaders and supervisors in the coming year and the Executive Team will be “re- testing” to note any changes in their effectiveness and to identify further behavioural leadership goals.
Other activities undertaken over the past 12 months to further build organisational capability have included:
• identifying critical, important and difficult to fill positions;
• exploring phased retirement;
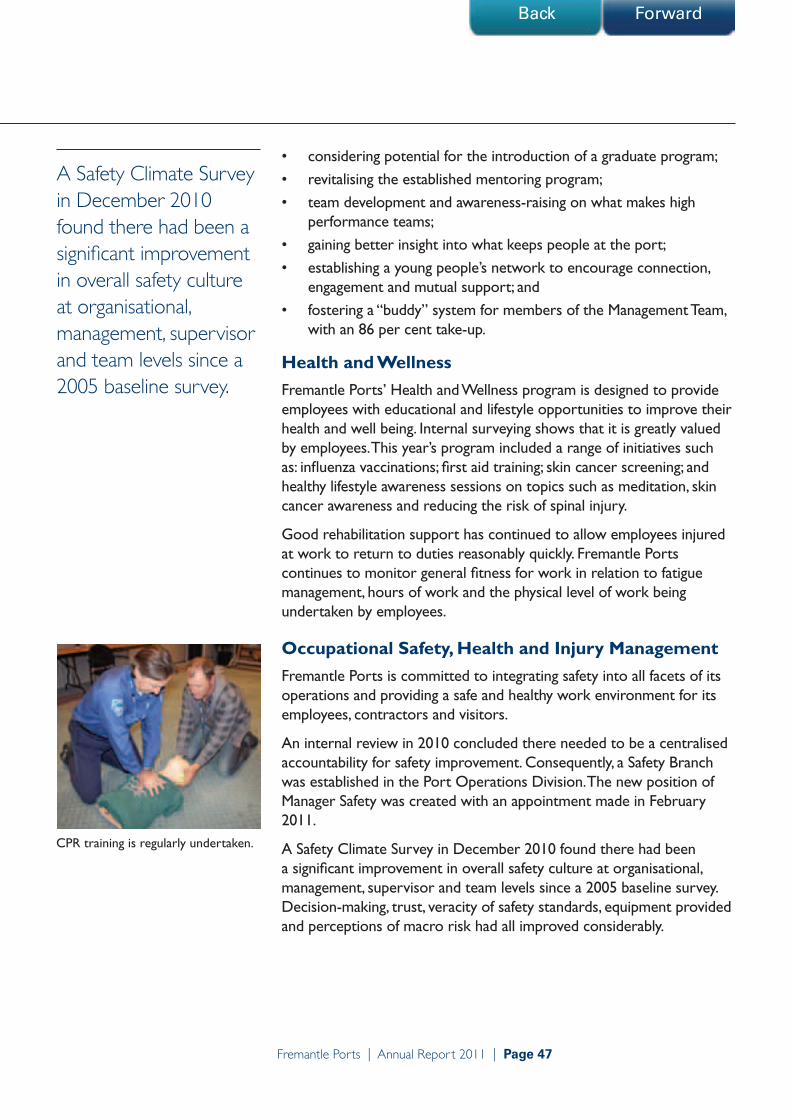
Fremantle Ports | Annual Repor t 2011 | Page 47
Back Forward
• considering potential for the introduction of a graduate program;
• revitalising the established mentoring program;
• team development and awareness-raising on what makes high performance teams;
• gaining better insight into what keeps people at the port;
• establishing a young people’s network to encourage connection, engagement and mutual support; and
• fostering a “buddy” system for members of the Management Team, with an 86 per cent take-up.
Health and WellnessFremantle Ports’ Health and Wellness program is designed to provide employees with educational and lifestyle opportunities to improve their health and well being. Internal surveying shows that it is greatly valued by employees. This year’s program included a range of initiatives such as: influenza vaccinations; first aid training; skin cancer screening; and healthy lifestyle awareness sessions on topics such as meditation, skin cancer awareness and reducing the risk of spinal injury.
Good rehabilitation support has continued to allow employees injured at work to return to duties reasonably quickly. Fremantle Ports continues to monitor general fitness for work in relation to fatigue management, hours of work and the physical level of work being undertaken by employees.
Occupational Safety, Health and Injury Management Fremantle Ports is committed to integrating safety into all facets of its operations and providing a safe and healthy work environment for its employees, contractors and visitors.
An internal review in 2010 concluded there needed to be a centralised accountability for safety improvement. Consequently, a Safety Branch was established in the Port Operations Division. The new position of Manager Safety was created with an appointment made in February 2011.
A Safety Climate Survey in December 2010 found there had been a significant improvement in overall safety culture at organisational, management, supervisor and team levels since a 2005 baseline survey. Decision-making, trust, veracity of safety standards, equipment provided and perceptions of macro risk had all improved considerably.
A Safety Climate Survey in December 2010 found there had been a significant improvement in overall safety culture at organisational, management, supervisor and team levels since a 2005 baseline survey.
CPR training is regularly undertaken.
Fremantle Ports | Annual Repor t 2011 | Page 48
Back Forward
Performance Support Services
The external report noted a significant positive shift in perceptions that management and supervisors put safety first, and the perception that employees did not have to take safety risks or break rules to get the job done. Two key opportunities for improvement emerged: more positive recognition for good safety behaviour and performance was required and, comparing the survey results with 2005 data, staff felt slightly less empowered now to make improvements to their work.
A new “Safety for LIFE” strategy was introduced in 2011. The strategy focuses on the positive performance indicators of active safety leadership at all levels in the organisation, recognising people for integrating safety into their daily tasks, action against the high potential hazards in the organisation, maintaining AS/NZ 4801 safety management standard certification and ensuring people have the right skills sets to work in a safe and efficient manner.
A safety “scratch card” reward system has been introduced. Cards are awarded by supervisors to employees who demonstrate desired safety behaviours. The cards are then entered in a monthly draw for prizes.
SAI Global conducts annual surveillance audits on Fremantle Ports’ safety and health management systems to ensure the organisation remains eligible for certification to the internationally recognised ANZS 4801 standard. In May 2011, Fremantle Ports was audited against safety management standard ANZS 4801 with zero non-conformances.
Details of performance against health and safety targets are on page 131 of the Disclosures section of this report.
Employee RelationsThe Fremantle Ports Administration and Management Enterprise Agreement 2011 was the first of four Agreements to be negotiated for this round of bargaining. Twelve nominated bargaining representatives took part in the negotiation of the Agreement over a period of six months. With an 84 per cent response rate to the ballot, the yes vote received a majority of approximately 98 per cent. The Agreement was registered with Fair Work Australia on 3 March 2011 and was ratified effective from 4 April 2011.
The Agreement will operate for three years and an Administrative Management Consultative Committee has been formed as part of the Agreement.
In May 2011, Fremantle Ports was audited against safety management standard ANZS4801 with zero non-conformances.
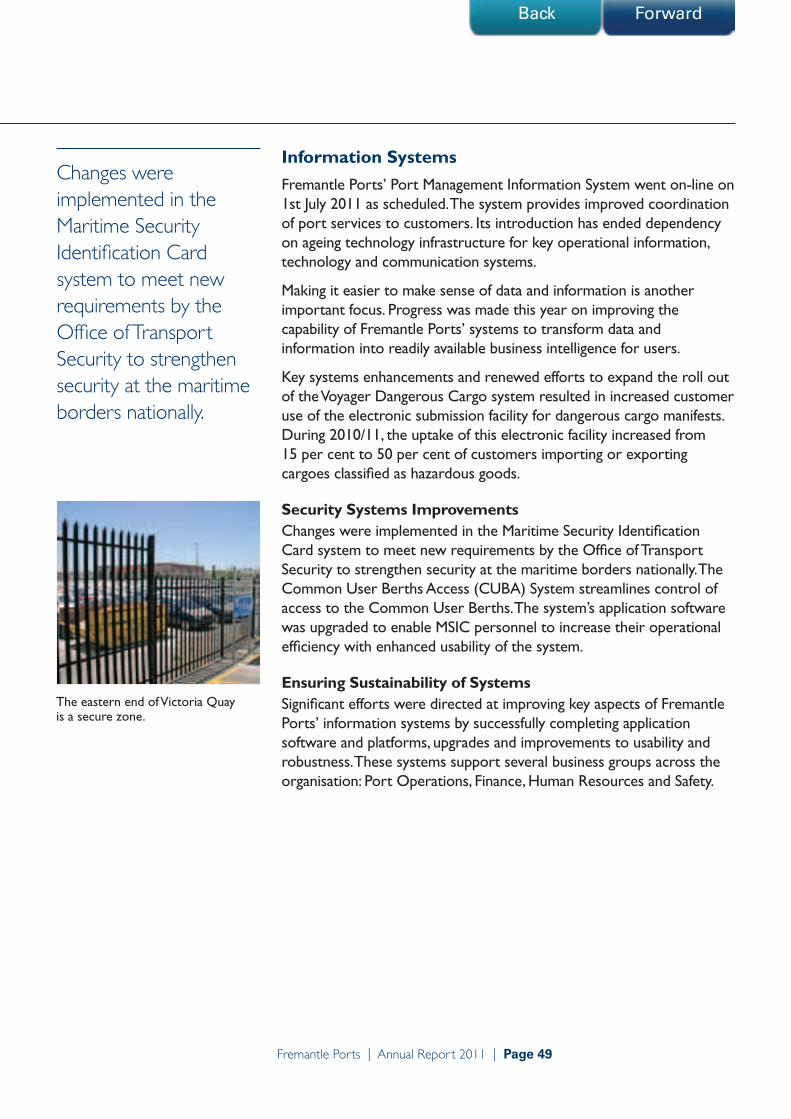
Fremantle Ports | Annual Repor t 2011 | Page 49
Back Forward
Information Systems Fremantle Ports’ Port Management Information System went on-line on 1st July 2011 as scheduled. The system provides improved coordination of port services to customers. Its introduction has ended dependency on ageing technology infrastructure for key operational information, technology and communication systems.
Making it easier to make sense of data and information is another important focus. Progress was made this year on improving the capability of Fremantle Ports’ systems to transform data and information into readily available business intelligence for users.
Key systems enhancements and renewed efforts to expand the roll out of the Voyager Dangerous Cargo system resulted in increased customer use of the electronic submission facility for dangerous cargo manifests. During 2010/11, the uptake of this electronic facility increased from 15 per cent to 50 per cent of customers importing or exporting cargoes classified as hazardous goods.
Security Systems ImprovementsChanges were implemented in the Maritime Security Identification Card system to meet new requirements by the Office of Transport Security to strengthen security at the maritime borders nationally. The Common User Berths Access (CUBA) System streamlines control of access to the Common User Berths. The system’s application software was upgraded to enable MSIC personnel to increase their operational efficiency with enhanced usability of the system.
Ensuring Sustainability of SystemsSignificant efforts were directed at improving key aspects of Fremantle Ports’ information systems by successfully completing application software and platforms, upgrades and improvements to usability and robustness. These systems support several business groups across the organisation: Port Operations, Finance, Human Resources and Safety.
Changes were implemented in the Maritime Security Identification Card system to meet new requirements by the Office of Transport Security to strengthen security at the maritime borders nationally.
The eastern end of Victoria Quay is a secure zone.

Fremantle Ports | Annual Repor t 2011 | Page 50
Back Forward
Performance Business Sustainability
Objective:
Ensuring business sustainability through excellent performance in all areas, innovation, business improvement and community and stakeholder engagement
Key Outcomes Sought:Favourable financial outcomes
Maintaining stakeholder support
Business ExcellenceFremantle Ports applies the Australian Business Excellence Framework as part of its normal business. Current priorities progressed during the year include: identification, updating and consolidation of procedures; business improvement through simplification and innovation; value chain analysis with customers; development and implementation of management plans for key stakeholders; whole-of process auditing; and deployment of Fremantle Ports’ Business Principles.
Annual independent external audits of environmental, safety and quality management systems continue to confirm Fremantle Ports’ triple certification to internationally recognised standards.
In the most recent survey, held in May 2011, the auditors from SAI Global noted that Fremantle Ports had continued to maintain and improve the three management systems at all levels of the organisation in accordance with the requirements of standards ISO 14001:2004 and ISO 9001:2008 and AS/NZS 4801:2001. The feedback report concluded that the three systems were being managed effectively to ensure that the quality of work complied with technical specifications and that occupational health and safety and environmental risks were minimised.
Reducing Dust and Spillage Improvements continue to be made to dust emission and spillage controls at the Kwinana Bulk Terminal.
Recent capital improvements include upgrading of the dust extraction system on a feeder belt to one of the two unloaders, provision of dust curtains on a transfer tower conveyor, upgrading of equipment to improve the transfer of waste material and purchase of a new water truck.
A water monitoring system has been fitted to the containment system beneath Kwinana Bulk Berth 3 at the Kwinana Bulk Jetty to improve the way in which wash-down water is collected and stormwater is
Annual independent external audits of environmental, safety and quality management systems continue to confirm Fremantle Ports’ triple certification to internationally recognised standards.

Fremantle Ports | Annual Repor t 2011 | Page 51
Back Forward
managed. The system monitors pH and turbidity and allows the quality of the water in the containment system to be tested before it is released into Cockburn Sound.
New stainless steel strainer buckets have been obtained for drains on this berth to prevent bulk products entering the containment system. A filtration system has also been installed to remove bulk product from water in the containment system that cannot be pumped into waste tanks.
Understanding Community PrioritiesFremantle Ports engages with the community through its two community liaison groups, project-specific consultation and via involvement with wide range of organisations. Information and views are shared to help with mutual understanding of priorities and this information is taken into account in strategic planning.
Consultation and communication on the Inner Harbour deepening project continued to be a major priority in the second half of 2010. A community information evening about the second phase of the dredging was held in July 2010. The Dredging Reference Group continued to meet regularly throughout the year and regular updates were provided to the community through Fremantle Ports’ Portfolio community newsletter, its electronic newsletter, the website and media.
Community ContributionFremantle Ports provides sponsorships and in-kind support for a wide range of community organisations in the Inner and Outer Harbour areas. This support reflects Fremantle Ports’ priorities and values.
Dolphin ResearchSignificant support from Fremantle Ports is helping to ensure the long-term conservation of bottlenose dolphins in Perth metropolitan waters. The funding support is for the Coastal and Estuarine Dolphin Project, a collaborative project between Murdoch and Curtin universities. The research project is studying the health and ecology of the dolphins in the Swan River, Inner Harbour and Cockburn Sound.
Port EventsFremantle’s second Celebrate Maritime Day expo in September 2010 was a great success with an estimated 9000 visitors and some 38 industry booths and numerous displays and activities. Building on the previous year’s inaugural event, the Fremantle Passenger Terminal was a lively scene, with action also in the harbour.
Significant support from Fremantle Ports is helping to ensure the long-term conservation of bottlenose dolphins in Perth metropolitan waters.
Bottlenose dolphins are sighted frequently in the Inner Harbour.

Fremantle Ports | Annual Repor t 2011 | Page 52
Back Forward
Performance Business Sustainability
Entertainment and attractions were also provided for the public at Victoria Quay for the inaugural visit of the cruise ship Queen Elizabeth in March 2011.
Support for Community EventsFremantle Ports has been the anchor sponsor for the Fremantle Football Club’s Starlight Purple Haze Game for six years. A series of fundraising activities at the port, including an official Purple Haze launch linked with the departure of Queen Elizabeth from Victoria Quay in March, Purple Haze parties held in the community and in schools, employee donations and the match-day tin-rattle, resulted in a record tally of almost $71,000. The Starlight Children’s Foundation brightens the lives of seriously ill and hospitalised children in WA and since Fremantle Ports began its involvement with Purple Haze activities, the total raised has been $278,795.
Fremantle Ports was a major sponsor of the inaugural Rottnest Conservation Foundation Festival of Sail in April 2011. The aim of the regatta was to raise the profile of the Foundation’s work in “conserving the essence of Rottnest” through funding environmental conservation works on the island.
Fremantle Ports also supported the Concert for Pakistan held in October at the Fremantle Arts Centre. This event raised more than $15,000 for the Oxfam Pakistan Floods Appeal.
Other sponsorships and support have included the Fremantle Festival (including sponsorship of the Fremantle Proms concert), the Kwinana Festival, Rockingham Mussel Fest, the Fremantle - East Fremantle Heritage Festival, the Blessing of the Fleet Festival, the Fremantle Ports Swim Thru, the Coogee Jetty-to-Jetty Swim, and the 2011 Gimme Shelter Homeless Association concert.
Education SupportFremantle Ports is committed to working with organisations and schools in the Fremantle, Cockburn, Kwinana and Rockingham areas to support education and to increase understanding of the role and importance of the maritime industry and the port. Providing support for schools in key areas of mutual interest, such as environmental sustainability is another focus.
A new partnership with Surf Life Saving WA is enabling the organisations Life Skills for Life education program to be delivered to 20 Year 7 classes a year in schools in the Fremantle and Rockingham - Kwinana areas. The program delivers valuable first aid and resuscitation education and introduces students to basic skills that will allow them to act quickly and appropriately in many first aid situations.
Fremantle Ports employees donated soccer balls to children at Kulunga Kindergarten at Hilton Primary School, as part of a fund-raising event for the school.
Learning about ropes at Celebrate Maritime Day.
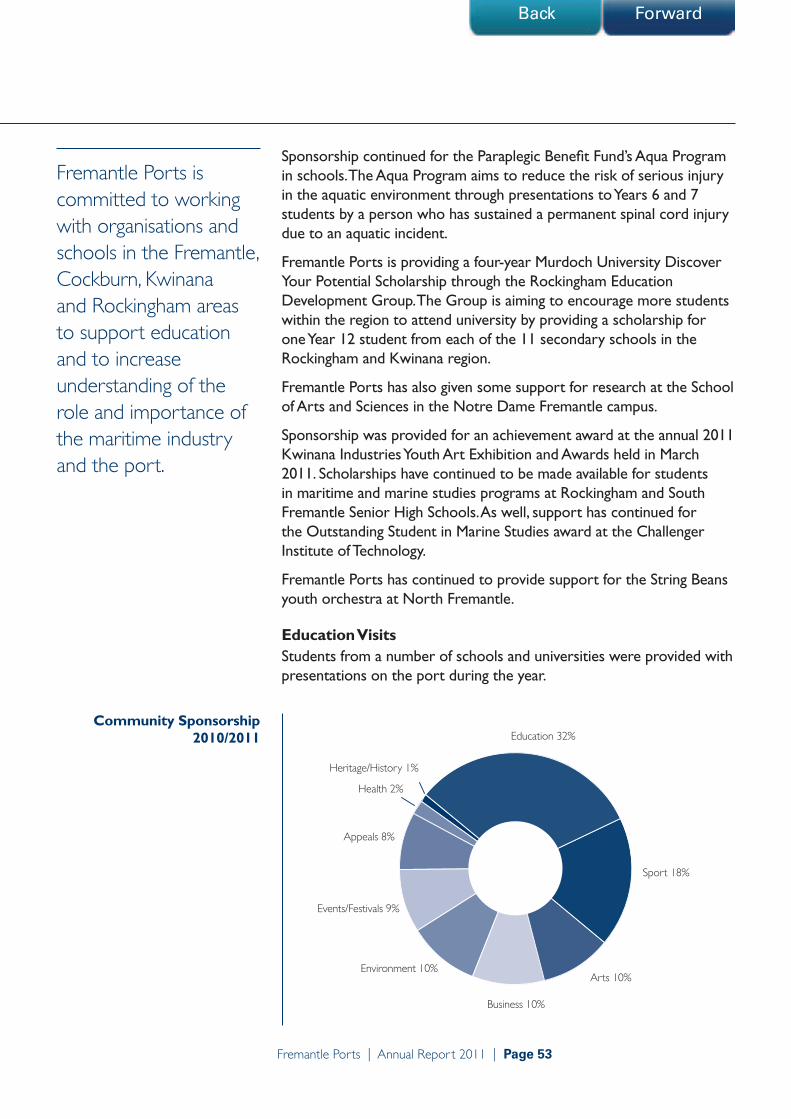
Fremantle Ports | Annual Repor t 2011 | Page 53
Back Forward
Sponsorship continued for the Paraplegic Benefit Fund’s Aqua Program in schools. The Aqua Program aims to reduce the risk of serious injury in the aquatic environment through presentations to Years 6 and 7 students by a person who has sustained a permanent spinal cord injury due to an aquatic incident.
Fremantle Ports is providing a four-year Murdoch University Discover Your Potential Scholarship through the Rockingham Education Development Group. The Group is aiming to encourage more students within the region to attend university by providing a scholarship for one Year 12 student from each of the 11 secondary schools in the Rockingham and Kwinana region.
Fremantle Ports has also given some support for research at the School of Arts and Sciences in the Notre Dame Fremantle campus.
Sponsorship was provided for an achievement award at the annual 2011 Kwinana Industries Youth Art Exhibition and Awards held in March 2011. Scholarships have continued to be made available for students in maritime and marine studies programs at Rockingham and South Fremantle Senior High Schools. As well, support has continued for the Outstanding Student in Marine Studies award at the Challenger Institute of Technology.
Fremantle Ports has continued to provide support for the String Beans youth orchestra at North Fremantle.
Education VisitsStudents from a number of schools and universities were provided with presentations on the port during the year.
Community Sponsorship 2010/2011 Education 32%
Sport 18%
Arts 10%
Business 10%
Environment 10%
Events/Festivals 9%
Appeals 8%
Health 2%
Heritage/History 1%
Fremantle Ports is committed to working with organisations and schools in the Fremantle, Cockburn, Kwinana and Rockingham areas to support education and to increase understanding of the role and importance of the maritime industry and the port.

Fremantle Ports | Annual Repor t 2011 | Page 54
Back Forward
Performance Business Sustainability
New WebsiteFremantle Ports’ Internet website was redeveloped during the year, introducing a new structure to make the site easier to navigate. A number of new features have been introduced.
Complaints ManagementFremantle Ports received 103 complaints in 2010/11 compared with 117 complaints in 2009/10. Of these, 35 were related to odour impacts, compared with 13 in this category the previous year.
Most of the odour complaints were generated by the impacts of livestock exports from the Inner Harbour at Fremantle and the significant increase was due mainly to two events. One of these was that four livestock vessels were loaded in the port in the four days leading up to Christmas Day, with weather conditions and the concentrated activity combining to create an odour issue. The other cluster of complaints occurred during the loading of the Bader III in March 2011. The ship had been undergoing repairs at Victoria Quay prior to loading and was also the subject of a dispute over crew pay and conditions. Once these matters were resolved, the ship was moved to Berth 12 on North Quay and the sheep were transferred from the holding feedlots. Under Fremantle Ports’ preferred berthing policy for
Fremantle Ports - Registered Complaints 2010/2011
Comparison with average of previous two years
Inner
Harb
our D
eepe
ning
Beac
hes
Envir
onmen
t - N
oise
Envir
onmen
t - W
ater
Visits -
Even
ts
Secu
rity
Envir
onmen
t - O
ther
Envir
onmen
t - D
ust
Acces
s
Vehic
le Traf
fic
Inter
nal Is
sue
Envir
onmen
t - O
dour
Safet
y
Custo
mer Is
sues
Othe
r
0
5
10
15
20
25
30
35
40
2010/11 Average 2008/09 & 2009/010
Num
ber
of C
om
plai
nts
Type of Complaint
Num
ber
of C
ompl
aint
s
2010/11 Average 2008/09 & 2009/10
Fremantle Ports’ new Internet website was launched in May 2011.

Fremantle Ports | Annual Repor t 2011 | Page 55
Back Forward
livestock vessels most loading takes place at North Quay Berths 1 and 2, the berths furthest from residential development. On this occasion, however, these berths were not available in the required timeframe.
Complaints relating to the Inner Harbour deepening project reduced significantly in 2010/11. Five complaints were received in this category, compared with 27 the previous year.
Case Study - Managing Rail NoiseFinding ways to reduce the impacts of rail noise on the community continues to receive attention as a high priority issue. An inter-agency working group on reducing rail noise was established and facilitated by Fremantle Ports in response to complaints received over time from local residents living near the railway line in the West End area of Fremantle.
The initial focus was on rail and rolling stock maintenance, track lubrication systems and train speed.
Monitoring of noise levels was commissioned in April 2010 by the Public Transport Authority to measure freight train pass-by noise levels at two residential properties opposite the Roundhouse. This study was unable to identify an optimal speed for reduced noise from train pass-bys and concluded that there were other contributing factors.
Since October 2010, the train speed limit through the area has been reduced on a trial basis from 25km/hr to 10km/hr.
Monitoring of noise levels was undertaken to understand the effectiveness of various initiatives including rail and rolling stock maintenance, track lubrication systems and train speed. An independent expert consultant was engaged to review results and make recommendations. These and other measures are currently being examined and tested to address this issue and the community representatives continue to be consulted and kept informed of progress.
Monitoring of noise levels was undertaken to understand the effectiveness of various initiatives including rail and rolling stock maintenance, track lubrication systems and train speed.
Increased use of rail for container freight reduces the rate of growth of port - related truck traffic.

Fremantle Ports | Annual Repor t 2011 | Page 56
Back Forward
Significant Issues
Catering for Future Trade The Minister for Transport has confirmed the ongoing role of the Inner Harbour in catering for future trade growth.
Additional container facilities will also be required once the Inner Harbour reaches capacity and studies over time have shown that the Outer Harbour is the best site for these. The point at which the Inner Harbour will be at capacity will depend on trade trends and other factors but this is likely to be within the next decade.
Fremantle’s Outer Harbour in Cockburn Sound currently plays an important role in the import and export of bulk products. Future growth in import and export of bulk products is anticipated and this will continue to stimulate demand for additional Outer Harbour port facilities and associated transport links.
The Minister has asked the Western Australian Planning Commission to assess environmental, transport and planning issues that will enable the provision of port facilities to support future trade needs while protecting Cockburn Sound.
L to R: Dr Fred Affleck, Chairman WA Freight and Logistics Council; Dr Jim Limerick, Chairman Fremantle Ports Board; and the Hon Troy Buswell MLA, Minister for Transport at an industry breakfast briefing hosted by Fremantle Ports and the Department of Transport in June 2011.

Fremantle Ports | Annual Repor t 2011 | Page 57
Back ForwardBack Forward
Landside LogisticsA port is only as efficient as the supply chain in which it sits. Efficient port operations can be stifled by congestion and inefficiencies in the land transport linkages between the port and importers and exporters.
To ensure the Inner Harbour plays a significant role in international trade into the foreseeable future, Fremantle Ports has adopted a comprehensive strategy which incorporates:
• planning for future landside logistics facilities at the port;
• ensuring transport corridors and inland distribution sites and associated land uses are protected and developed;
• removing obstacles to improving transport efficiency; and
• facilitating improved coordination including working with industry to better align operating hours along the container supply chain.
These measures are detailed in the Inner Harbour Land Transport Linkages Strategy which is being discussed and refined in consultation with industry and Government agencies.
The container trade growth forecasts show that, at a base rate of growth of 5.5 per cent annually, the current container throughput will double before 2025. The Strategy is designed to ensure that port growth can be achieved with improved efficiency for port-related freight movements and in a way that addresses community concerns relating to safety and amenity.

Fremantle Ports | Annual Repor t 2011 | Page 58
Back Forward
Significant Issues
Road TransportAs a result of a complex set of operating factors, nearly one third of truck trips to and from the port are empty. The large number of carriers involved in servicing the port, many of them quite small, and the fragmented nature of the industry present challenges to improving trucking productivity.
Through the WA Port Operations Task Force, which Fremantle Ports funds and hosts, a number of initiatives are being pursued, including:
• extending working hours at terminals and container parks to reduce reliance on peak-hour operations and to better align truck movements between those sites;
• ensuring new site developments on port land promote trucking efficiency;
• improving the vehicle booking system to promote more two-way loading of trucks; and
• advice to industry on dealing with overloaded trucks.
With most of the container cargo transported by road, improving trucking productivity is a high priority.

Fremantle Ports | Annual Repor t 2011 | Page 59
Back Forward
Case Study - Truck MarshallingThe first stage of a truck congestion management system and truck marshalling area was introduced during the year and planning is well advanced for significant enhancements to this as part of the development of the newly reclaimed land on North Quay.
The truck marshalling area (TMA) is a parking facility for truck drivers who cannot go directly to their container park/terminal due to congestion.
In 2010, an electronic congestion management system was developed by Fremantle Ports in consultation with the WA Port Operations Task Force, Main Roads WA and industry to manage the flow of vehicles through the TMA. The system became operational in November 2010 and won the 2010 WA Transport and Logistics Innovation Award.
It involves using variable messaging signs on key approach roads to divert drivers to the TMA when congestion is occurring. Port users activate the system by logging on via a dedicated website. As trucks arrive at the marshalling area, their registration and time of arrival is recorded electronically, enabling a call-up system to operate fairly and effectively.
The response to this first stage development from North Quay users and drivers has been positive. When activated, sites are able to clear any congestion in an orderly way and roads in the North Quay area are kept clear of congestion.
This first stage is being improved to include more automation, in particular, to monitor authorised arrivals and link in with key container terminal operating systems.
With the reconfiguration of the North Quay - Rous Head precinct, permanent infrastructure measures will be put in place to take congested traffic off public roads, while still allowing the container park and/terminals affected by a traffic build-up to call through vehicles in an ordered manner until congestion has dissipated. A permanent TMA will be established in the precinct.
As trucks arrive at the marshalling area, their registration and time of arrival is recorded electronically, enabling a call-up system to operate fairly and effectively.
Variable messaging signs direct trucks to destinations at North Quay.

Fremantle Ports | Annual Repor t 2011 | Page 60
Back Forward
Significant Issues
Rail TransportWhile rail volumes have increased significantly in recent years, further development of rail services to Fremantle Port will require a coordinated package of infrastructure development along the rail corridor and at intermodal terminals, improved wharf-side operations and carefully targeted market development. Government transport policies will also be centrally important to rail’s future.
In the past decade, rail share of containers moved through the port has grown from about two per cent to a peak of 15 per cent and is now about 12 per cent. A target share of at least 30 per cent is considered necessary to optimise the Inner Harbour’s capacity.
Market Share of Containers on Rail
Improved rail infrastructure is a key to improving rail’s capacity and competitiveness. Joint funding of $53.5 million for rail infrastructure was secured from the Commonwealth through the Nation Building Fund and the State Government and was announced in the Federal Budget in May 2010. It will be used on three main projects:
North Quay Rail TerminalThe reclaimed land at Rous Head and the reconfiguration of the Rous Head/North Quay precinct provides an opportunity to extend the North Quay rail terminal to provide for more efficient operations, including longer trains.
Market Share of Containers on Rail
- TEUs 2001/2002 to 2010/2011
2001/02 2002/03 2003/04 2004/05 2005/06 2006/07 2007/08 2008/09 2009/10 2010/11
700
600
500
400
300
200
100
0
TE
Us
(Tho
usan
ds)
98% 97% 93% 94% 95.5% 90%
8%4.5%6%
7%
3%
2%
87%
13%
85%
15%
89%
11%
89%
11%
7 11 28 26 20 42 77 85 61 68
324 354 375 409 426 464 503 480 496 522
RAIL
ROAD

Fremantle Ports | Annual Repor t 2011 | Page 61
Back Forward
Inland Intermodal TerminalThe Kewdale - Forrestfield area is an important component of the freight network in Western Australia due to its accessibility by road and rail and proximity to industrial areas.
A 2008 study identified potential sites within the Kewdale - Forrestfield area for a modern freight terminal to support the Inner Harbour – Kewdale container rail service. Currently, the Department of Transport, Fremantle Ports and the Public Transport Authority are working to update and extend this work to support development of an intermodal terminal in the area.
Fremantle Ports is working with shipping lines and road carriers to make use of the intermodal facilities at Forrestfield more attractive to importers and exporters.
Rail Line CapacityPlanning is underway for a rail passing loop to be constructed in 2011/12 to improve rail line capacity.
In addition to infrastructure development, a number of other rail initiatives are being pursued. These include:
• examining options for re-structuring financial assistance to rail as part of a long-term strategy for rail development and sustainability;
• promoting development of new services and markets to build rail volumes and achieve economies of scale;
• implementing cost reduction measures to improve rail’s competitiveness; and
• establishing a new rail freight service contract that will require the proponent to demonstrate how it will grow container volumes.
In addition to infrastructure development, a number of other rail initiatives are being pursued.

Fremantle Ports | Annual Repor t 2011 | Page 62
Back Forward
Disclosures and Legal Compliance Directors’ Reportfor the year ended 30 June 2011
The Board of Directors of the Fremantle Port Authority (Fremantle Ports) has pleasure in submitting its report for the financial year ended 30 June 2011.
DirectorsDetails of the Board of Directors of Fremantle Ports during the financial year and until the date of this report are:
Jim Limerick (Chairman)Dr Limerick was appointed Chairman of the Board on 1 October 2010, having served as a Director from 1 October 2009. Dr Limerick worked in technical and management roles in the resources industry from 1976 -1986 and at senior levels in government administration from 1987- 2008. He was appointed Director General of the Department of Industry and Resources from 2001 and at various times was a member of the Western Australian Planning Commission and a member of the LandCorp Board. He has been influential for over a decade in strategic planning for future industrial infrastructure in WA and in 2008 was awarded the Australian Public Service Medal. He is now the Principal of Ramelton Consulting Pty Ltd. Dr Limerick has an honours degree in Science and a PhD from the University of NSW, a Graduate Diploma in Business from Curtin University and is a graduate member of the Australian Institute of Company Directors.
Expiry of present term: 30 June 2012
Jim Limerick

Fremantle Ports | Annual Repor t 2011 | Page 63
Back Forward
Robert Pearce (Deputy Chairman)Mr Pearce has served on the Board since 1 July 2004. He is a former Western Australian Government Minister for Transport and Planning who also held the portfolios of Education, Environment and Leader of the House. He is Executive Director of the Forest Industries Federation of WA and Past President of the National Association of Forest Industries. He currently serves on the Freight and Logistics Council of Western Australia and the Biosecurity Council. He was previously Chairman of the Western Australian Port Operations Taskforce and a member of the Sea Freight Council of WA. He has served on the Board of the Fremantle Sailing Club. Mr Pearce was appointed Deputy Chairman on 14 September 2004.
Expiry of present term: 30 June 2011
Marie MalaxosMs Malaxos has served as a Director since 1 October 2009. She is an electronic engineer with a Post-Graduate Diploma in Business Management. She started her working career in the upstream side of the oil and gas industry, in a variety of technical, consulting and management roles on the Dampier to Bunbury, Goldfields and Parmelia pipelines in Western Australia. She joined ARC Energy Ltd in 2002 and was appointed Chief Operating Officer in 2006. In 2008, Ms Malaxos began a career consulting to the resources industry in WA and is the Principal of GM Woodmont Pty Ltd. Ms Malaxos is a member of the Australian Institute of Company Directors.
Expiry of present term: 30 June 2012
Marie Malaxos
Robert Pearce

Fremantle Ports | Annual Repor t 2011 | Page 64
Back Forward
Disclosures and Legal Compliance Directors’ Report
Michael FeutrillMr Michael Feutrill was appointed a Director on 1 December 2010. He is a barrister and member of the Western Australian Bar Association and practises in corporate and commercial litigation and arbitration. He graduated from the University of Western Australia with Bachelors of Law and Economics in 1996 and a Masters of Law, with distinction, in 2007. He currently teaches International Commercial Arbitration at the UWA law school. Mr Feutrill has experience in marine litigation, commercial and trade practices and worked in Paris as counsel in international arbitrations concerning shareholder, oil and gas and foreign investment treaty disputes.
Expiry of present term: 31 December 2012
Jillian HoffmannMs Hoffmann was appointed to the Board on 17 May 2011. She is the Vice President Environment at Woodside Energy Ltd, Australia’s largest oil and gas company. She has a Bachelor of Business Studies and a Masters of Business Administration. Her 20 years’ experience in commercial environments within the oil and gas industry has included work for Woodside Energy, Transfield Worley Ltd and Chevron UK Ltd. As well as established leadership skills, Ms Hoffmann has a strong commercial background and experience in negotiating and dealing with complex and challenging commercial issues. She is a member of the Australian Institute of Company Directors.
Expiry of present term: 31 December 2012
Alan BirchmoreMr Birchmore, who served as Chairman from 1 March 2008, was formerly Chairman of the Albany Port Authority. He has occupied senior management and board appointments in Australia, the UK, Europe and the US, through a range of financial, industrial and mining operations. He came to Western Australia in 1979 as Managing Director of Amalgamated Industries and when this company was taken over by Bond Corporation, he was retained as an Executive Director, responsible for managing Bond’s industrial and mining interests. From 1984 he spent 12 years in the United Kingdom overseeing a range of European assets including international brewing, television, property developments and Airship Industries. Mr Birchmore is a Fellow of the Australian Institute of Company Directors. He is also a former Chairman of United Minerals and former Deputy Chairman of the Western Australian Ballet. His term ended on 30 September 2010.
Michael Feutrill
Jillian Hoffmann
Alan Birchmore
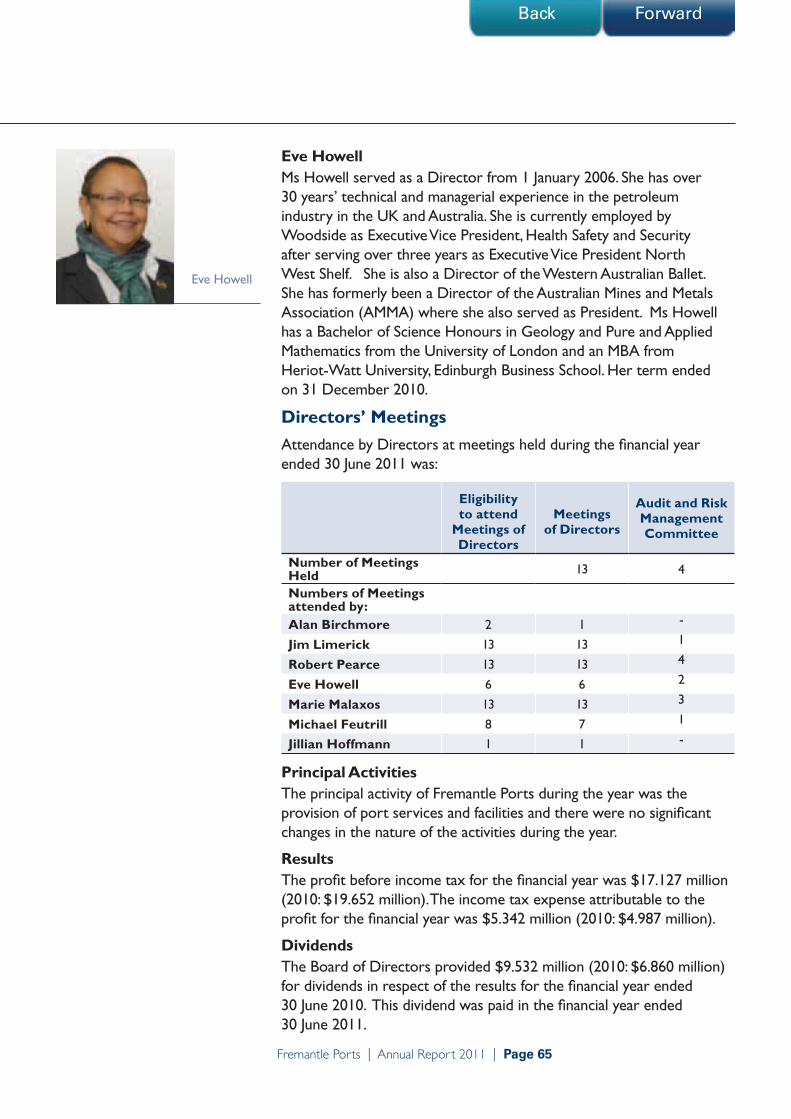
Fremantle Ports | Annual Repor t 2011 | Page 65
Back Forward
Eve HowellMs Howell served as a Director from 1 January 2006. She has over 30 years’ technical and managerial experience in the petroleum industry in the UK and Australia. She is currently employed by Woodside as Executive Vice President, Health Safety and Security after serving over three years as Executive Vice President North West Shelf. She is also a Director of the Western Australian Ballet. She has formerly been a Director of the Australian Mines and Metals Association (AMMA) where she also served as President. Ms Howell has a Bachelor of Science Honours in Geology and Pure and Applied Mathematics from the University of London and an MBA from Heriot-Watt University, Edinburgh Business School. Her term ended on 31 December 2010.
Directors’ MeetingsAttendance by Directors at meetings held during the financial year ended 30 June 2011 was:
Eligibility to attend
Meetings of Directors
Meetingsof Directors
Audit and Risk Management Committee
Number of Meetings Held 13 4
Numbers of Meetings attended by:Alan Birchmore 2 1 -
Jim Limerick 13 13 1
Robert Pearce 13 13 4
Eve Howell 6 6 2
Marie Malaxos 13 13 3
Michael Feutrill 8 7 1
Jillian Hoffmann 1 1 -
Principal ActivitiesThe principal activity of Fremantle Ports during the year was the provision of port services and facilities and there were no significant changes in the nature of the activities during the year.
ResultsThe profit before income tax for the financial year was $17.127 million (2010: $19.652 million). The income tax expense attributable to the profit for the financial year was $5.342 million (2010: $4.987 million).
DividendsThe Board of Directors provided $9.532 million (2010: $6.860 million) for dividends in respect of the results for the financial year ended 30 June 2010. This dividend was paid in the financial year ended 30 June 2011.
Eve Howell

Fremantle Ports | Annual Repor t 2011 | Page 66
Back Forward
Disclosures and Legal Compliance Directors’ Report
Review of OperationsFremantle Ports is a general cargo port and ensures that port services and facilities meet the needs of customers.
A summary of the results during the year is set out below:-
2011 2010 $’000 $’000
Profit before income tax 17,127 19,652
Income tax expense (5,342) (4,987)
Profit for the period 11,785 14,665
Retained earnings at 1 July 106,517 98,712
118,302 113,377
Dividends paid in the financial year (9,532) (6,860)
Retained earnings at 30 June 108,770 106,517
State of AffairsThere were no significant changes in the state of affairs of Fremantle Ports during the financial year under review.
Fremantle Ports operates in Western Australia under the provisions of the Port Authorities Act 1999.
Events Subsequent to Reporting DateSubsequent to 30 June 2011, a writ has been lodged against Fremantle Ports in the Federal Court. Fremantle Ports does not believe that the claim is credible and has taken steps to defend the matter.
Other than the matter discussed above, there here has not arisen in the interval between the end of the financial year and the date of this report any item, transaction or event of a material and unusual nature likely, in the opinion of the Directors of Fremantle Ports, to affect significantly the operations, the results of those operations, or the state of affairs, in future financial years.
Likely Developments and Expected ResultsFremantle Ports will continue to work closely with customers and stakeholders to fulfil its trade facilitation role. Major infrastructure projects underway for the Inner and Outer Harbours will be progressed and further work will be undertaken towards embedding of Fremantle Ports’ business principles.

Fremantle Ports | Annual Repor t 2011 | Page 67
Back Forward
EmolumentsIn accordance with Section 13(c)(i) of Schedule 5 of the Port Authorities Act 1999, included below is the nature and amount of each element for each Director and the five named officers of Fremantle Ports receiving the highest emoluments.
Directors’ EmolumentsThe Minister determines the emoluments of the Board of Directors.
Details of emoluments provided to directors:
PrimaryFees
$
Post- employment
Superannuation$
Total$
J Limerick 43,750 3,938 47,688
R Pearce 33,000 2,970 35,970
M Malaxos 25,000 2,250 27,250
M Feutrill 15,417 1,388 16,805
E Howell 12,500 1,125 13,625
A Birchmore 8,333 750 9,083
J Hoffmann 3,125 281 3,406
Directors’ BenefitsNo Directors of Fremantle Ports have received benefits or became entitled to receive any benefit (other than a benefit included in the total amount of emoluments received or due and receivable by Directors) by reason of a contract made with the Director, or with a firm of which the Director is a member, or with an entity in which the Director has a substantial interest.
Executives’ EmolumentsThe Board, with the approval of the Minister and subject to the Salaries and Allowances Act 1975, determines the emolument package of the Chief Executive Officer. The Board delegates to the Chief Executive Officer the power to determine the terms and conditions of other senior executives in accord with a policy under which Fremantle Ports engages emolument consultants to report and recommend competitive emolument packages for senior executives based on benchmarking with other organisations.
The performance of the Chief Executive Officer and senior executives is monitored against agreed criteria.

Fremantle Ports | Annual Repor t 2011 | Page 68
Back Forward
Disclosures and Legal Compliance Directors’ Report
Details of emoluments provided to senior executives:
Salary$
PrimaryBonus
$Other
$
Post- employ-
mentSuper-
annuation$
Total$
C Leatt-Hayter 377,575 3,330 10,343 53,976 445,224
A Meyer 310,561 3,892 5,452 42,564 362,469
G Valenti 303,861 3,884 5,551 27,697 340,993
S Wade 290,997 3,789 5,333 40,629 340,748
A Gray 282,439 3,717 5,571 25,754 317,481
Environmental RegulationFremantle Ports’ operations are subject to regulation under both Commonwealth and State environmental legislation applicable to any Australian commercial entity. Under the Port Authorities Act 1999, Fremantle Ports is also required to “protect the environment of the port and minimise the impact of port activities on that environment”.
Environmental ManagementFremantle Ports is committed to demonstrating that it is an environmentally responsible organisation and this commitment is reflected in its values and corporate priorities. To comply with environmental responsibilities and objectives, Fremantle Ports maintains an environmental management system certified to the international standard ISO14001 by external auditors.
Rounding of Amounts to Nearest Thousand Dollars
Amounts have been rounded off to the nearest thousand dollars in the Directors’ Report and Financial Statements.
This report is made in accordance with a resolution of the Board on 19 August 2011.
Chairman
Director
19 August 2011

Fremantle Ports | Annual Repor t 2011 | Page 69
Back Forward
Disclosures and Legal Compliance Financial Statements
for the year ended 30 June 2011
Statement of Comprehensive Income 70
Statement of Financial Position 71
Statement of Changes In Equity 72
Statement of Cash Flows 73
Notes to the Financial Statements 74
1. Summary of significant accounting policies 74
2. Revenue and other income 82
3. Profit before income tax 83
4. Income tax expense 84
5. Dividends 86
6. Current assets 86
7. Non-current assets 88
8. Current and non-current liabilities 92
9. Financial instruments 95
10. Commitments 98
11. Provisions 101
12. Deferred income 103
13. Other liabilities 104
14. Equity 104
15. Notes to Statement of Cash Flows 105
16. Remuneration of auditors 105
17. Related parties 106
18. Contingent liabilities 106
19. Events subsequent to end of the reporting period 106
Directors’ Declaration 107
Financial Audit Opinion 108
Financial Performance Indicators 109

Fremantle Ports | Annual Repor t 2011 | Page 70
Back Forward
Disclosures and Legal Compliance Statement of Comprehensive Income
for the year ended 30 June 2011
2011 2010 Note $’000 $’000
Revenue 2.1 152,239 133,009Asset maintenance (35,043) (31,877)
General administration (30,432) (27,713)
Port operations expenses (27,232) (22,570)
Depreciation and amortisation expense 3 (11,922) (8,288)
Finance costs (8,108) (2,999)
Marine expenses (6,949) (6,326)
Rates and Taxes (5,128) (5,023)
Port utilities (4,848) (4,340)
Other expenses (4,024) (1,776)
Environmental expenses (1,426) (2,445)
Profit before income tax 17,127 19,652
Income tax expense 4 (5,342) (4,987)
Profit for the period 11,785 14,665
Other comprehensive income for the period, net of income tax - -
Total comprehensive income for the period 11,785 14,665
The above Statement of Comprehensive Income should be read in conjunction with the accompanying notes.

Fremantle Ports | Annual Repor t 2011 | Page 71
Back Forward
Disclosures and Legal Compliance Statement of Financial Position
As at 30 June 2011
2011 2010 Note $’000 $’000
ASSETS Current assets Cash and cash equivalents 6.1 15,209 16,958 Trade and other receivables 6.2 22,017 18,631 Inventories 6.3 1,114 1,119
Total current assets 38,340 36,708
Non-current assets Receivables 7.1 7,995 8,369 Property, plant and equipment 7.2 397,974 316,548 Deferred tax assets 4 13,035 13,077
Total non-current assets 419,004 337,994
Total assets 457,344 374,702
LIABILITIES Current liabilities Trade and other payables 8.1 22,412 26,597 Interest bearing borrowings 8.2 1,514 6,943 Income tax payable 4 2,492 1,092 Provisions 11 9,152 7,846 Deferred Income 12 1,000 - Other 13 1,661 630
Total current liabilities 38,231 43,108
Non-current liabilities Interest bearing borrowings 8.2 239,653 156,200 Provisions 11 14,897 13,169 Other 13 1,543 1,561
Total non-current liabilities 256,093 170,930
Total liabilities 294,324 214,038
Net assets 163,020 160,664
EQUITY Contributed equity 14 54,250 54,147 Retained earnings 14 108,770 106,517
Total equity 14 163,020 160,664
The above Statement of Financial Position should be read in conjunction with the accompanying notes.

Fremantle Ports | Annual Repor t 2011 | Page 72
Back Forward
Disclosures and Legal Compliance Statement of Changes in Equity
for the year ended 30 June 2011
Contributed Retained Total equity earnings Equity Note $’000 $’000 $’000
Balance at 1 July 2009 53,938 98,712 152,650Total comprehensive income for the year - 14,665 14,665
Transactions with owners in their capacity as owners:
Capital contributions 14 209 - 209
Dividends paid 5 - (6,860) (6,860)
Balance at 30 June 2010 14 54,147 106,517 160,664
Balance at 1 July 2010 54,147 106,517 160,664Total comprehensive income for the year - 11,785 11,785
Transactions with owners in their capacity as owners:
Capital contributions 14 103 - 103
Dividends paid 5 - (9,532) (9,532)
Balance at 30 June 2011 14 54,250 108,770 163,020
The above Statement of Changes in Equity should be read in conjunction with the accompanying notes.

Fremantle Ports | Annual Repor t 2011 | Page 73
Back Forward
Disclosures and Legal Compliance Statement of Cash Flows
for the year ended 30 June 2011
2011 2010 Note $’000 $’000
Cash flows from operating activities
Receipts from customers 165,954 142,596
Payments to suppliers and employees (131,214) (101,847)
Interest received 1,990 1,837
Interest paid (6,976) (2,055)
Income tax paid (3,901) (4,308)
Net cash inflow from operating activities 15 25,853 36,223
Cash flows from investing activities
Purchase of property, plant and equipment (96,005) (116,721)
Proceeds from sale of property, plant and equipment 40 2
Net cash outflow from investing activities (95,965) (116,719)
Cash flows from financing activities
Repayment of borrowings (6,426) (1,503)
Proceeds from borrowings 84,500 74,000
Payment of finance lease liabilities (625) (592)
Proceeds from finance lease receivable 343 315
Dividends paid 5 (9,532) (6,860)
Equity contribution received 14 103 209
Net cash inflow from financing activities 68,363 65,569
Net decrease in cash and cash equivalents (1,749) (14,927)
Cash and cash equivalents at 1 July 16,958 31,885
Cash and cash equivalents at 30 June 6.1 15,209 16,958
The above Statement of Cash Flows should be read in conjunction with the accompanying notes.

Fremantle Ports | Annual Repor t 2011 | Page 74
Disclosures and Legal Compliance Notes to the Financial Statements
for the year ended 30 June 2011
Back Forward
1. Summary of Significant Accounting PoliciesThe financial statements were authorised for issue on 19 August 2011 by the Board of Directors of Fremantle Port Authority (‘Fremantle Ports’). The following significant accounting policies have been adopted in the preparation of the financial statements for the year ended 30 June 2011.
1.1 Statement of ComplianceThese financial statements have been prepared as general purpose financial statements in accordance with Australian Accounting Standards (AASBs) (including Australian Interpretations) adopted by the Australian Accounting Standards Board (AASB) and the financial reporting provisions of the Port Authorities Act 1999.
The following standards and amendments were available for early adoption but have not been assessed for application by Fremantle Ports in these financial statements:
• AASB 2009-11 Amendments to Australian Accounting Standards arising from AASB 9 [AASB 1, 3, 4, 5, 7, 101, 102, 108, 112, 118, 121, 127, 128, 131, 132, 136, 139, 1023 & 1038 and Interpretations 10 & 12]. The revised Standard introduces a number of changes to the accounting for financial assets.
• AASB 2009-12 Amendments to Australian Accounting Standards [AASBs 5, 8, 108, 110, 112, 119, 133, 137, 139, 1023 & 1031 and Interpretations 2, 4, 16, 1039 & 1052]. This amendment makes numerous editorial changes to a range of Australian Accounting Standards and Interpretations.
• AASB 124 (Revised) Related Party Disclosures (December 2009). The revised Standard simplifies the definition of a related party, clarifying its intended meaning and eliminating inconsistencies from the definition.
• AASB 9 Financial Instruments. This Standard includes the requirement for the classification and measurement of financial assets resulting from the first part of phase 1 of the IASB’s project to replace IAS 39 Financial Instruments: Recognition and Measurement (AASB 139 Financial Instruments: Recognition and Measurement).
• AASB 1053 Application of Tiers of Australian Accounting Standards. This Standard establishes a differential financial reporting framework consisting of two Tiers of reporting requirements for preparing general purpose financial statements.
• AASB 1054 Australian Additional Disclosures. This Standard is as a consequence of phase 1 of the joint Trans-Tasman Convergence project of the AASB and FRSB. It relocates all Australian specific disclosures from other standards to one place and revises disclosure.
• AASB 2010-2 Amendments to Australian Accounting Standards arising from reduced disclosure requirements. This Standard makes amendments to many Australian Accounting Standards, reducing the disclosure requirements for Tier 2 entities, identified in accordance with AASB 1053.
• AASB 2010-4 Further Amendments to Australian Accounting Standards arising from the Annual Improvements Project [AASBs 1, 7, 101, 134 and Interpretation 13]. This Standard emphasis the interaction between quantitative and qualitative AASB 7 disclosures and the nature and extent of risks associated with financial instruments.
• AASB 2010-5 Amendments to Australian Accounting Standards [AASBs 1, 3, 4, 101, 112, 118, 119, 121, 132, 133, 134, 137, 139, 140, 1023 & 1038 and Interpretations 112, 115, 127, 132 & 1042]. This Standard makes numerous editorial amendments to a range of Australian Accounting Standards and Interpretations, including amendments to reflect changes made to the text of IFRS by the IASB.
• AASB 2010-6 Amendments to Australian Accounting Standards - Disclosures on Transfers of Financial Assets [AASB 1 & 7]. This Standard amends the disclosure requirements for transactions involving the transfers of financial assets.
• AASB 2010-7 Amendments to Australian Accounting Standards arising from AASB 9 (December 2010) [AASBs 1, 3, 4, 5, 7, 101, 102, 108, 112, 118, 120, 121, 127, 128, 131, 132, 136, 137, 139, 1023 & 1038 and Interpretations 2, 5, 10, 12, 19, 127]. This Standard includes the requirement for classifying and measuring financial liabilities added to AASB 9.

Fremantle Ports | Annual Repor t 2011 | Page 75
Back Forward
Disclosures and Legal Compliance Notes to the Financial Statements
for the year ended 30 June 2011
1. Summary of Significant Accounting Policies (continued)
1.2 Basis of PreparationThe financial statements have been prepared on an accrual accounting basis and in accordance with the historical cost convention.
The accounting policies adopted in the preparation of the financial statements have been consistently applied throughout all periods presented unless otherwise stated.
Statement of Comprehensive Income classification of expenses by nature is considered to provide more relevant and reliable information than classification by function due to the nature of the Authority’s operations.
According to AASB 101 Presentation of Financial Statements, expenses classified by nature are not reallocated among various functions within the entity. However, the Authority has allocated employee benefits expenses to various line items on the Statement of Comprehensive Income including marine expenses, port operations expenses, general administration, and asset maintenance. This allocation reflects the internal reporting structure of the Authority which allocates labour expenses to significant expense items in the Statement of Comprehensive Income based on the nature of the expenses incurred. The Authority believes that the allocation is more relevant to the understanding of the financial performance of the Authority and does not result in a function of expense presentation.
Total employee benefits expenses are disclosed in note 3(ii) to the financial statements.
The financial statements are presented in Australian dollars and all values are rounded to the nearest thousand dollars ($’000) unless otherwise stated.
1.3 Use of Estimates and JudgementsThe preparation of financial statements requires management to make judgements, estimates and assumptions that affect the application of accounting policies and the reported amounts of assets, liabilities, income and expenses. Actual results may differ from these estimates.
Estimates and underlying assumptions are reviewed on an ongoing basis. Revisions to accounting estimates are recognised in the period in which the estimate is revised and in any future periods affected.
In particular, information about significant areas of estimation, uncertainty and critical judgements in applying accounting policies that have the most significant effect on the amount recognised in the financial statements are:
Provision for environmental remediation
Various assumptions are required in determining Fremantle Port’s environmental rehabilitation obligations including the extent of environmental damages to be rectified and the methodology and timing for rectifications.
Defined benefit plans
Various actuarial assumptions are required when determining Fremantle Ports’ superannuation obligations. These assumptions and the related carrying amounts are discussed in note 1.18.
Impairment losses
Various assumptions are required in determining Fremantle Port’s impairment of trade and other receivables including an assessment of risk and subsequent recovery and impairment of property, plant and equipment.

Fremantle Ports | Annual Repor t 2011 | Page 76
Disclosures and Legal Compliance Notes to the Financial Statements
for the year ended 30 June 2011
Back Forward
1. Summary of Significant Accounting Policies (continued)
1.4 Revenue RecognitionRevenue is recognised to the extent that it is probable that the economic benefits will flow to Fremantle Ports and the revenue can be reliably measured. The following specific recognition criteria must also be met before revenue is recognised.
Revenue for services rendered is recognised in the Statement of Comprehensive Income in proportion to the stage of completion of the transaction at the Statement of Financial Position date. Where the contract outcome cannot be measured reliably, revenue is recognised only to the extent of the expenses recognised that are recoverable.
Interest revenue includes interest receivable on funds invested and interest receivable under finance leases. Interest receivable on funds invested includes interest on short-term investments and term deposits and is recognised as it accrues using the effective interest rate method. The interest receivable component of finance lease receivables is also recognised in the Statement of Comprehensive Income using the effective interest rate method.
Miscellaneous revenue recognised as the legal entitlement arises is derived predominantly from the hire of facilities and equipment, recoupment of rates and taxes and insurance claims.
Rental income is recognised in the Statement of Comprehensive Income on a straight-line basis over the term of the lease. Lease incentives granted are recognised as an integral part of the total rental income.
Deferred income represents income received in advance and is released to the Statement of Comprehensive Income over that period to which the income relates.
1.5 Expenses by NatureOperating expenses are presented in the Statement of Comprehensive Income using a classification based on the nature of expenses. Marine expenses include those expenses derived from water based activities, port operations expenses include those expenses related to land based support activities, whilst general administration expenses includes expenditure of an administrative nature.
1.6 Finance CostsFinance costs comprise finance charges payable under finance leases and interest payable on borrowings calculated using the effective interest rate method. The interest expense component of finance lease payments is also recognised in the Statement of Comprehensive Income using the effective interest rate method.
Borrowing costs are recognised as expenses in the period in which they are incurred except where they are directly attributable to the acquisition, construction or production of a qualifying asset in which case they are capitalised as part of the cost of the asset, in accordance with AASB 123 Borrowing Costs.
In determining the amount of borrowing costs to be capitalised during the financial year, investment revenue earned directly relating to the borrowings, is deducted from the borrowing costs incurred.
1.7 National Tax Equivalent Regime (Income tax)Fremantle Ports is subject to the National Tax Equivalent Regime (NTER).
The NTER is an administrative arrangement under which relevant Commonwealth Taxation laws are applied notionally to the NTER entities as if they were subject to those laws. Income tax equivalent liabilities are paid to the State Government.

Fremantle Ports | Annual Repor t 2011 | Page 77
Back Forward
Disclosures and Legal Compliance Notes to the Financial Statements
for the year ended 30 June 2011
1. Summary of Significant Accounting Policies (continued)
1.8 Income TaxIncome tax on the profit or loss for the year comprises current and deferred tax. Income tax is recognised in the Statement of Comprehensive Income except to the extent that it relates to items recognised directly in equity, in which case it is recognised in equity.
Current tax is the expected tax payable on the taxable profit for the year, using the tax rates enacted or substantially enacted at the Statement of Financial Position date, and any adjustment to tax payable in respect of previous years.
Deferred income tax is provided, using the liability method, on all temporary differences at the Statement of Financial Position date between the tax bases of assets and liabilities and their carrying amounts for financial reporting purposes.
Deferred tax liabilities are recognised for all taxable temporary differences except where the deferred tax liability arises from the initial recognition of an asset or liability in a transaction that is not a business combination and, at the time of the transaction, affects neither the accounting profit nor taxable profit or loss.
Deferred tax assets are recognised for all deductible temporary differences to the extent that it is probable that taxable profit will be available against which the deductible temporary differences can be utilised except where the deferred income tax asset relating to the deductible temporary difference arises from the initial recognition of an asset or liability in a transaction that is not a business combination and, at the time of the transaction, affects neither the accounting profit nor taxable profit or loss.
The carrying amount of deferred tax assets is reviewed at each Statement of Financial Position date and reduced to the extent that it is no longer probable that sufficient taxable profit will be available to allow all or part of the deferred tax asset to be utilised.
Deferred tax assets and liabilities are measured at the tax rates that are expected to apply to the year when the asset is realised or the liability is settled, based on tax rates (and tax laws) that have been enacted or substantively enacted at the Statement of Financial Position date.
1.9 Receivables
Trade receivables
Trade debtors are recognised and carried at the original amounts due less an allowance for any uncollectible amounts. Debtors are generally settled within 30 days except for property rentals, which are governed by individual lease agreements.
The value of the provision for impairment loss is assessed using an analysis of historical data to determine the level of risk and subsequent recovery of debts based on the age of amounts outstanding. Bad debts are written off when formally recognised as being irrecoverable.
Trade and other receivables are stated at their cost less impairment losses.
Lease receivables
A lease receivable is recognised for leases of property, plant and equipment which effectively transfers to the lessee substantially all of the risks and benefits incidental to legal ownership of the leased asset. The lease receivable is initially recognised as the amount of the present value of the minimum lease payments receivable at the end of the reporting period plus the present value of any unguaranteed residual value expected to accrue at the end of the lease term.
Finance lease payments are allocated between interest revenue and reduction of the lease receivable over the term of the lease in order to reflect a constant periodic rate of return on the net investment outstanding in respect of the lease with interest revenue calculated using the interest rate implicit in the lease and recognised directly in the Statement of Comprehensive Income.

Fremantle Ports | Annual Repor t 2011 | Page 78
Disclosures and Legal Compliance Notes to the Financial Statements
for the year ended 30 June 2011
Back Forward
1. Summary of Significant Accounting Policies (continued)
1.10 InventoriesInventories consist of stores which are stated at the lower of cost and net realisable value.
1.11 Property, Plant and EquipmentProperty, plant and equipment purchased or constructed for port operations is recorded at the cost of acquisition less accumulated depreciation and impairment losses. Cost includes expenditure that is directly attributable to the acquisition of the asset. The cost of self-constructed assets includes the cost of materials and direct labour, and any other costs directly attributable to bringing the asset to a working condition for its intended use.
Any subsequent cost of replacing/upgrading an item of property, plant and equipment is recognised in the carrying amount of the item if it is probable that the future economic benefits embodied within the part will flow to Fremantle Ports and its cost can be measured reliably.
Property, plant and equipment, excluding freehold land, are depreciated at rates based on the expected useful lives using the straight line method. Depreciation on assets under construction commences when the assets are ready for use. Depreciation is charged to the Statement of Comprehensive Income.
An item or property, plant and equipment is derecognised upon disposal or when no future economic benefits are expected from its use or disposal.
The depreciation rates for the various classes of non-current assets are as follows:
Depreciation Rates (%)
Channels and breakwaters 1.9 - 3.7
Land improvements 1.9 - 10
Buildings and improvements 2 - 14.3
Plant and equipment 2.5 - 70.8
Berths, jetties and infrastructure 2 - 50
Plant and equipment under lease 20 - 53.3
1.12 ImpairmentThe carrying values of assets are reviewed for impairment when events or changes in circumstances indicate the carrying value may not be recoverable.
If a trigger exists and where the carrying values exceed the estimated recoverable amount, the assets are written down to their recoverable amount.
The recoverable amount of assets is the greater of fair value less costs to sell and value in use. As Fremantle Ports is a not-for-profit entity, the value in use is the asset’s depreciated replacement cost where the future economics benefits of the asset are not primarily dependent on the asset’s ability to generate net cash inflows and where Fremantle Ports would, if deprived of the asset, replace its future economic benefits. In all other instances value in use is the present value of future cash flows expected to arise from the asset.
Impairment losses are recognised in the Statement of Comprehensive Income.
1.13 Leased AssetsLeases are classified as either operating or finance leases based on the economic substance of the agreement so as to reflect the risks and benefits incidental to ownership.

Fremantle Ports | Annual Repor t 2011 | Page 79
Back Forward
Disclosures and Legal Compliance Notes to the Financial Statements
for the year ended 30 June 2011
1. Summary of Significant Accounting Policies (continued)
1.13 Leased Assets (continued)
Finance leasesLeases which effectively transfer substantially all of the risks and benefits incidental to ownership of the leased asset to Fremantle Ports are capitalised at the inception of the lease at the fair value of the leased property or, if lower, at the present value of the minimum lease payments and disclosed as property, plant and equipment under lease. A lease liability of equal value is also recognised.
Finance leased assets are amortised over the shorter of the estimated useful life of the assets and the lease term. Minimum lease payments are allocated between interest expense and reduction of the lease liability so as to achieve a consistent rate of interest on the remaining balance of the liability with interest expense calculated using the interest rate implicit in the lease and recognised directly against income.
Leased assets held at the end of the reporting period are being amortised over periods ranging from 3 to 5 years (2010: 1.75 to 5 years).
Operating leasesLeases where the lessor retains substantially all the risks and benefits of ownership of the asset are classified as operating leases. Initial direct costs incurred in negotiating an operating lease are added to the carrying amount of the leased asset and recognised over the lease term on the same basis as the lease income. Operating lease payments are recognised as an expense in the Statement of Comprehensive Income on a straight-line basis over the lease term as this represents the pattern of benefits derived from the leased assets.
1.14 Financial InstrumentsIn addition to cash, Fremantle Ports has three categories of financial instruments:
• Loans and receivables;• Held to maturity investments; and• Financial liabilities measured at amortised cost.
Refer to Note 9(b) for further information on the classification of financial instruments.
Initial recognition and measurement is at fair value plus directly attributable transaction costs for assets not carried at fair value through profit and loss. Subsequent measurement is at amortised cost using the effective interest method.
The fair value of short-term receivables and payables approximates their carrying amount because there is no interest rate applicable and subsequent measurement is not required as the effect of discounting is not material. Gains or losses are recognised when the financial assets are derecognised or impaired.
1.15 PayablesPayables, including trade creditors, amounts payable and accrued expenses, are recognised for amounts to be paid in the future for goods and services received prior to the end of the reporting period. Trade creditors are unsecured and are usually paid within 30 days of recognition.
1.16 Interest Bearing BorrowingsAll borrowings are initially recognised at the fair value of the consideration received less directly attributable transaction costs.
After initial recognition, interest-bearing borrowings are subsequently measured at amortised cost using the effective interest method.
Gains and losses are recognised in the Statement of Comprehensive Income when the liabilities are derecognised, as well as through the amortisation process.

Fremantle Ports | Annual Repor t 2011 | Page 80
Disclosures and Legal Compliance Notes to the Financial Statements
for the year ended 30 June 2011
Back Forward
1. Summary of Significant Accounting Policies (continued)
1.16 Interest Bearing Borrowings (continued)Borrowing costs are expensed as incurred unless they relate to qualifying assets.
Finance Lease Liabilities are recognised at the present value of the minimum lease payments. The interest expense is recognised in the Statement of Comprehensive Income using the effective interest method.
1.17 Employee BenefitsAnnual Leave benefits represent present obligations resulting from employees’ services provided to end of the reporting period and are provided at nominal amounts calculated on the basis of remuneration rates expected to be paid when the liability is settled.
Sick Leave and Long Service Leave liabilities were assessed on the basis of the present value of estimated future payments, discounted by the Commonwealth Government Bonds rates estimated to be applicable to the relevant period. A 5.00% (2010: 4.50%) per annum rate of increase in employee wage and salary rates was assumed in the present value calculations.
The liability in all provisions covers entitlements from the date the employee commences in accordance with the conditions of employment.
Provisions are made for long service leave even though in some cases such amounts are currently not vesting.
Associated payroll on-costs are included in the determination of other provisions.
1.18 Employee SuperannuationThe Gold State Superannuation Scheme (GSS), a defined benefit lump sum scheme, and the Superannuation and Family Benefits Act Scheme, a defined benefit pension scheme, are now closed to new members. Fremantle Ports is liable for superannuation benefits for past years’ service of members of the Superannuation and Family Benefits Act Scheme who elected to transfer to the GSS Scheme. Fremantle Ports also accrues for superannuation benefits to the pension scheme for those members who elected not to transfer from that scheme.
The superannuation liability for existing employees with the pre-transfer service incurred under the Superannuation and Family Benefits Act Scheme who transferred to the GSS Scheme is provided for at the end of the reporting period.
Fremantle Ports’ total superannuation liability has been actuarially assessed as at 30 June 2011.
Employees who are not members of either the Pension or the GSS Schemes became non-contributory members of the West State Superannuation Scheme (WSS), an accumulation fund until 15 April 2009. From 16 April 2009, employees who are not members of the Pension, GSS or WSS Schemes become non-contributory members of the GESB Superannuation Scheme (GESB Super), a taxed accumulation fund. Fremantle Ports makes concurrent contributions to the Government Employee Superannuation Board (GESB) on behalf of employees in compliance with the Commonwealth Government’s Superannuation Guarantee (Administration) Act 1992. These contributions extinguish the liability for superannuation charges in respect of the WSS and GESB Super Schemes.
Defined benefit plan
Fremantle Ports’ net obligation in respect of defined benefit pension plans is calculated separately by estimating the amount of future benefit that employees have earned in return for their service in the current and prior periods; that benefit is discounted to determine its present value, and the fair value of any plan assets is deducted. These benefits are unfunded.
The discount rate used is the market yield rate at the Statement of Financial Position date on national government bonds that have maturity dates approximating to the terms of the entity’s obligations. The calculation is performed by a qualified actuary using the actuarial cost method.

Fremantle Ports | Annual Repor t 2011 | Page 81
Back Forward
Disclosures and Legal Compliance Notes to the Financial Statements
for the year ended 30 June 2011
1. Summary of Significant Accounting Policies (continued)
1.18 Employee Superannuation (continued)The superannuation expense of the defined benefit plan is made up of the following elements:
• Current service cost;• Interest cost (unwinding of the discount);• Actuarial gains and losses; and• Past service cost.
Actuarial gains and losses of the defined benefit plan are recognised immediately as income and expense in the Statement of Comprehensive Income.
The superannuation expense of the defined contribution plan is recognised as and when the contributions fall due.
1.19 DividendsDividends are recognised as a liability in the period in which they are declared.
1.20 ProvisionsA provision is recognised in the Statement of Financial Position when Fremantle Ports has a present legal or constructive obligation as a result of a past event, and it is probable that an outflow of economic benefits will be required to settle the obligation and a reliable estimate can be made of the amount of the obligation. If the effect of the time value of money is material, provisions are determined by discounting the expected future cash flows at a pre-tax rate that reflects current market assessments of the time value of money and, where appropriate, the risks specific to the liability.
Where discounting is used, the increase in the provision due to the passage of time is recognised as finance costs.
1.21 Cash and Cash EquivalentsCash and cash equivalents in the Statement of Financial Position comprise cash on hand, cash at bank, at call deposits and term deposits due within 30 days.
For the purpose of the Statement of Cash Flows, cash equivalents consist of cash and cash equivalents as defined above.
1.22 Goods and Services Tax Revenues, expenses and assets are recognised net of the amount of goods and services tax except where the amount of GST incurred is not recoverable from the taxation authority. In these circumstances, the GST is recognised as part of the cost of acquisition of the asset or as part of the expense item as applicable.
Receivables and payables are stated inclusive of GST. The net amount of GST recoverable from, or payable to the ATO is included as a current asset or liability in the Statement of Financial Position.
Cash flows are included in the Statement of Cash Flows on a gross basis. The GST components of cash flows arising from investing and financing activities which are recoverable from, or payable to, the ATO are classified as operating cash flows.
1.23 Contributed EquityFremantle Ports receives support from the WA Government (See Note 14). The amount received is recognised directly as a credit to contributed equity.

Fremantle Ports | Annual Repor t 2011 | Page 82
Disclosures and Legal Compliance Notes to the Financial Statements
for the year ended 30 June 2011
Back Forward
2. Revenue and Other Income
2.1 RevenueRevenue consists of the following items:
2011 2010 $’000 $’000
Revenue
Charges on cargo 90,744 79,515
Charges on ships 13,163 12,669
Shipping services 9,301 8,236
Rentals and leases 15,296 14,904
Port utilities and services 5,190 4,448
Miscellaneous revenue 16,576 11,424
150,270 131,196
Interest
Bank interest receivable 543 721
Interest receivable from cash equivalents 426 113
Interest receivable under finance leases 998 979
Other interest receivable 2 -
1,969 1,813
Total revenue 152,239 133,009

Fremantle Ports | Annual Repor t 2011 | Page 83
Back Forward
Disclosures and Legal Compliance Notes to the Financial Statements
for the year ended 30 June 2011
3. Profit Before Income Tax 2011 2010 Note $’000 $’000
(i) Expenses Profit before income tax includes the following specific expenses:
Finance costs
Finance charges payable under finance leases 81 79
Borrowings 11,917 5,864
Total finance costs 11,998 5,943
Less: finance costs capitalised (3,890) (2,944)
Total finance costs expensed 8,108 2,999
Depreciation and amortisation
Channels and breakwaters 2,387 1,112
Land improvements 352 365
Buildings and improvements 606 572
Plant and equipment 3,080 2,911
Berths, jetties and infrastructure 4,868 2,732
Plant and equipment under lease 629 596
Total depreciation and amortisation 11,922 8,288
Net loss on sale of property, plant and equipment - 106
Other charges against assets
Impairment loss on trade receivables 6.2 558 1,413
Impairment loss on prepayments - 890
Impairment loss on property, plant and equipment 7.2 3,190 341
3,748 2,644
Rental expense relating to operating leases 362 350
2011 2010 $’000 $’000
(ii) Employee Benefits Expenses Wages and salaries 33,918 28,953
Workers’ compensation 133 161
Pension costs 3,286 3,600
Employee benefits 1,577 728
Retirement benefit obligations 684 (386)
39,598 33,056

Fremantle Ports | Annual Repor t 2011 | Page 84
Disclosures and Legal Compliance Notes to the Financial Statements
for the year ended 30 June 2011
Back Forward
4. Income Tax ExpenseMajor components of income tax expense for the year are:
2011 2010 $’000 $’000
Income tax expense
Current income tax:
Current income tax charge (7,128) (6,330)
Adjustments in respect of previous years 1,828 1,229
Deferred income tax:
Deferred income tax charge (42) 114
Income tax expense reported in the Statement of Comprehensive Income (5,342) (4,987)
A reconciliation between tax expense and the product of accounting profit before income tax multiplied by Fremantle Port’s applicable income tax rate is as follows:
2011 2010 $’000 $’000
Accounting profit before income tax 17,127 19,652
Tax at statutory income tax rate of 30% (5,138) (5,896)
Tax effect of amounts which are taxable in calculating taxable income:
Depreciation (295) (295)
Sundry items (59) (25)
(5,492) (6,216)
Adjustments in respect of previous years 150 1,229
(5,342) (4,987)

Fremantle Ports | Annual Repor t 2011 | Page 85
Back Forward
Disclosures and Legal Compliance Notes to the Financial Statements
for the year ended 30 June 2011
4. Income Tax Expense (continued)
Deferred Tax 2011 2010 2011 2010 Statement of Statement of Statement of Statement of Financial Financial Comprehensive Comprehensive Position Position Income Income
$’000 $’000 $’000 $’000
Deferred tax liabilities
Finance lease receivables (2,511) (2,614) 103 95
Others (1,111) (3,493) 2,382 (1,515)
Gross deferred tax liabilities (3,622) (6,107)
Deferred tax assets
Employee benefits 6,004 5,325 679 102
Accelerated depreciation for accounting purposes 7,034 10,969 (3,935) 1,032
Prepaid rental 999 912 87 (24)
Deferred income 1,380 - 1,380 -
Others 1,240 1,978 (738) 424
Gross deferred tax assets 16,657 19,184
Set-off of deferred tax liabilities pursuant to set-off provisions (3,622) (6,107)
Net deferred tax assets 13,035 13,077
Deferred tax charge (42) 114
Current Tax LiabilitiesThe current tax liability of $2.492 million (2010: $1.092 million) represents the amount of income taxes payable in respect of current and prior financial periods.

Fremantle Ports | Annual Repor t 2011 | Page 86
Disclosures and Legal Compliance Notes to the Financial Statements
for the year ended 30 June 2011
Back Forward
5. Dividends 2011 2010 $’000 $’000
Dividend paid in the financial year 9,532 6,860
In accordance with Government Financial Policy, WA Ports are required to pay dividends of 65% (2010: 50%) of after tax profits. However, in accordance with Australian Accounting Standards, dividends relating to the financial results for the year ended 30 June 2011 have not been provided as they are expected to be approved by Government and declared by the Board after balance date.
A dividend of $9.532 million (2010: $6.860 million) in respect of the financial results for the year ended 30 June 2010 was paid by 30 June 2011.
6. Current Assets
6.1 Cash and Cash EquivalentsCash and cash equivalents represent Cash at Bank, Cash on Hand, At Call Deposits and Term Deposits. Funds surplus to operational requirements have been invested in At Call Deposits and Term Deposits to maximise earnings.
2011 2010 $’000 $’000
Cash at Bank and Cash on Hand 922 433
At Call Deposits 6,287 8,025
Term Deposits 8,000 8,500
Cash and cash equivalents in the Statement of Cash Flows 15,209 16,958
(i) Significant Terms and Conditions
Interest on Cash at Bank was at prevailing rates. The weighted average interest rate at 30 June 2011 was 4.15% (2010: 4%).
Interest on At Call Deposits was at prevailing rates. The weighted average interest rate at 30 June 2011 was 4.95% (2010: 4.73%).
The weighted average interest rate for Term Deposits at 30 June 2011 was 5.35%. Term Deposits are held until their maturity dates and are normally held for a period of 30 days.
(ii) Fair Value
The directors consider the carrying amounts of Cash at Bank and At Call Deposits represent their fair value.
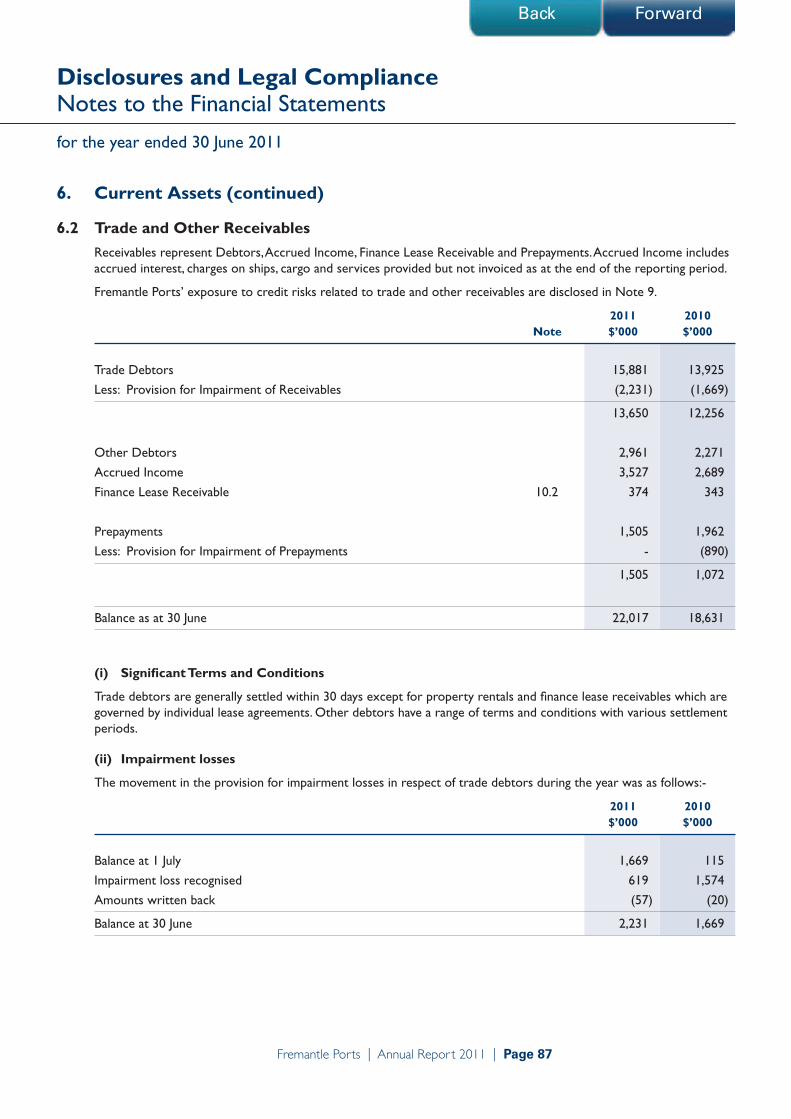
Fremantle Ports | Annual Repor t 2011 | Page 87
Back Forward
Disclosures and Legal Compliance Notes to the Financial Statements
for the year ended 30 June 2011
6. Current Assets (continued)
6.2 Trade and Other ReceivablesReceivables represent Debtors, Accrued Income, Finance Lease Receivable and Prepayments. Accrued Income includes accrued interest, charges on ships, cargo and services provided but not invoiced as at the end of the reporting period.
Fremantle Ports’ exposure to credit risks related to trade and other receivables are disclosed in Note 9.
2011 2010 Note $’000 $’000
Trade Debtors 15,881 13,925
Less: Provision for Impairment of Receivables (2,231) (1,669)
13,650 12,256
Other Debtors 2,961 2,271
Accrued Income 3,527 2,689
Finance Lease Receivable 10.2 374 343
Prepayments 1,505 1,962
Less: Provision for Impairment of Prepayments - (890)
1,505 1,072
Balance as at 30 June 22,017 18,631
(i) Significant Terms and Conditions
Trade debtors are generally settled within 30 days except for property rentals and finance lease receivables which are governed by individual lease agreements. Other debtors have a range of terms and conditions with various settlement periods.
(ii) Impairment losses
The movement in the provision for impairment losses in respect of trade debtors during the year was as follows:-
2011 2010 $’000 $’000
Balance at 1 July 1,669 115
Impairment loss recognised 619 1,574
Amounts written back (57) (20)
Balance at 30 June 2,231 1,669

Fremantle Ports | Annual Repor t 2011 | Page 88
Disclosures and Legal Compliance Notes to the Financial Statements
for the year ended 30 June 2011
Back Forward
6. Current Assets (continued)
6.2 Trade and Other Receivables (continued)
The movement in the provision for impairment losses in respect of prepayments during the year was as follows:-
2011 2010 $’000 $’000
Balance at 1 July 890 -
Impairment loss recognised - 890
Impairment loss written off (890) -
Balance at 30 June - 890
The impairment loss relates to a prepayment which has now been written off against the provision.
At 30 June, the ageing analysis of trade debtors past due but not impaired is as follows: 2011 2010 $’000 $’000
Not more than 3 months 3,118 3,092
More than 3 months but less than 6 months 10 11
More than 6 months but less than 1 year - 36
More than 1 year - 63
3,128 3,202
(iii) Fair Value
The directors consider the carrying amounts of trade and other receivables represent their fair value.
6.3 Inventories 2011 2010 $’000 $’000
Current
Stores – at cost 1,114 1,143
Less: Provision for Obsolete Inventory - (24)
1,114 1,119
7. Non-Current Assets
7.1 ReceivablesReceivables represent Finance Lease Receivable 2011 2010 Note $’000 $’000
Finance Lease Receivable 10.2 7,995 8,369

Fremantle Ports | Annual Repor t 2011 | Page 89
Back Forward
Disclosures and Legal Compliance Notes to the Financial Statements
for the year ended 30 June 2011
7. Non-Current Assets (continued)
7.1 Receivables (continued)
(i) Fair Value
The directors consider the carrying amounts of receivables represent their fair value.
7.2 Property, Plant and Equipment 2011 2010 $’000 $’000
Channels and Breakwaters At Cost 163,555 41,697Less: Accumulated Depreciation (24,541) (22,154)
139,014 19,543
Land At Cost 42,311 41,549
42,311 41,549
Land Improvements At Cost 9,737 12,057Less: Accumulated Depreciation (3,497) (4,143)
6,240 7,914
Buildings and Improvements At Cost 20,361 19,959Less: Accumulated Depreciation (10,563) (9,957)
9,798 10,002
Plant and Equipment At Cost 55,668 58,161Less: Accumulated Depreciation (24,086) (22,629)
31,582 35,532
Berths, Jetties and Infrastructure At Cost 186,714 71,010Less: Accumulated Depreciation (35,599) (30,738)
151,115 40,272
Leased Plant and Equipment At Cost 2,613 2,436Less: Accumulated Amortisation (1,657) (1,426)
956 1,010
Total Property, Plant and Equipment at net book value 381,016 155,822 Add: Work in Progress (at cost) 16,958 160,726
Total Property, Plant and Equipment 397,974 316,548

Fremantle Ports | Annual Repor t 2011 | Page 90
Disclosures and Legal Compliance Notes to the Financial Statements
for the year ended 30 June 2011
Back Forward
7. Non-Current Assets (continued)
7.2 Property, Plant and Equipment (continued)Fremantle Ports, as lessor, derives operating lease income from the following leased assets included in the above:
2011 2010 $’000 $’000
Land
At Cost 14,176 14,471
14,176 14,471
Buildings and Improvements At Cost 4,204 4,198
Less: Accumulated Depreciation (1,920) (1,774)
2,284 2,424
Included in Accumulated Depreciation above is the depreciation charge for the year of 142 142
Reconciliations of carrying amounts
2011 2010 $’000 $’000
Channels and Breakwaters:
Carrying amount at 1 July 19,543 20,655
Transfer from work in progress 121,858 -
Depreciation for the year (2,387) (1,112)
Carrying amount at 30 June 139,014 19,543
Land: Carrying amount at 1 July 41,549 41,549
Transfer from work in progress 762 -
Carrying amount at 30 June 42,311 41,549
Land Improvements: Carrying amount at 1 July 7,914 8,202
Transfer from work in progress 27 77
Depreciation for the year (352) (365)
Impairment loss (1,349) -
Carrying amount at 30 June 6,240 7,914

Fremantle Ports | Annual Repor t 2011 | Page 91
Back Forward
Disclosures and Legal Compliance Notes to the Financial Statements
for the year ended 30 June 2011
7. Non-Current Assets (continued)
7.2 Property, Plant and Equipment (continued)
Reconciliations of carrying amounts (continued) 2011 2010 $’000 $’000
Buildings and Improvements:
Carrying amount at 1 July 10,002 10,001
Transfer from work in progress 402 575
Disposals - (2)
Depreciation for the year (606) (572)
Carrying amount at 30 June 9,798 10,002
Plant and Equipment: Carrying amount at 1 July 35,532 35,881
Transfer from work in progress 774 2,604
Disposals (41) (42)
Depreciation for the year (3,080) (2,911)
Impairment loss (1,603) -
Carrying amount at 30 June 31,582 35,532
Berths, Jetties and Infrastructure: Carrying amount at 1 July 40,272 41,027
Transfer from work in progress 115,712 2,043
Disposals (1) (66)
Depreciation for the year (4,868) (2,732)
Carrying amount at 30 June 151,115 40,272
Leased Plant and Equipment: Carrying amount at 1 July 1,010 1,005
Additions 575 601
Amortisation for the year (629) (596)
Carrying amount at 30 June 956 1,010
381,016 155,822
Work in Progress: Carrying amount at 1 July 160,726 50,534
Additions 96,005 116,721
Derecognition - (890)
Impairment loss (238) (341)
Transfers to property, plant and equipment (239,535) (5,298)
Carrying amount at 30 June 16,958 160,726
Total Property, Plant and Equipment 397,974 316,548

Fremantle Ports | Annual Repor t 2011 | Page 92
Disclosures and Legal Compliance Notes to the Financial Statements
for the year ended 30 June 2011
Back Forward
7. Non-Current Assets (continued)
7.2 Property, Plant and Equipment (continued)
Impairment of property, plant and equipment
An impairment loss of $3.190 million has been recognised in the Statement of Comprehensive Income for certain plant and equipment and land improvements whose carrying value was considered to exceed its recoverable amount. Where recoverable amount has been determined using value in use cash flows, pre-tax discount rates ranging between 11% to 13% have been utilised.
8. Current and Non-Current Liabilities
8.1 Trade and Other PayablesTrade and other payables represent Trade Creditors, Amounts Payable and Accrued Expenses. Accrued Expenses are comprised of interest and charges for goods and services received but not invoiced as at the end of the reporting period.
2011 2010 $’000 $’000
Trade Creditors and Amounts Payable 16,008 20,770
Accrued Expenses 6,404 5,827
22,412 26,597
(i) Significant Terms and Conditions
Trade creditors payable are usually settled within 30 days.
(ii) Fair Value
The directors consider the carrying amounts of Trade Creditors, Amounts Payable and Accrued Expenses represent their fair value.
8.2 Interest Bearing Borrowings 2011 2010 Note $’000 $’000
Current
Special borrowings 1,013 6,426
Lease liabilities 10.2 501 517
1,514 6,943
Non-Current Direct borrowings 213,797 129,297
Special borrowings 25,317 26,330
Lease liabilities 10.2 539 573
239,653 156,200

Fremantle Ports | Annual Repor t 2011 | Page 93
Back Forward
Disclosures and Legal Compliance Notes to the Financial Statements
for the year ended 30 June 2011
8. Current and Non-Current Liabilities (continued)
8.2 Interest Bearing Borrowings (continued) 2011 2010 $’000 $’000
Financing arrangements Fremantle Ports has access to the following lines of credit
Total facilities available:
Liquidity facility, direct and special borrowings 262,100 198,800
262,100 198,800
Facilities utilised at the end of the reporting period:
Liquidity facility, direct and special borrowings 240,127 162,053
240,127 162,053
Total facilities not utilised at the end of the reporting period:
Liquidity facility, direct and special borrowings 21,973 36,747
At reporting date, Fremantle Ports has an approved financing facility from Western Australian Treasury Corporation (WATC) for 2012 of $342.9 million.
(i) Master Lending Agreement (MLA)
For the purposes of accessing more simplified and flexible borrowing arrangements, Fremantle Ports entered into a MLA with the WATC on 15 December 2006 which consolidates all of the existing agreements into one facility.
(ii) Significant Terms and Conditions
All interest-bearing borrowings are unsecured and guaranteed by the WA Government.
Interest repayments on Direct Borrowings are payable quarterly whilst the principal repayments are deferred as part of the loan product flexibility. The weighted average interest rate at 30 June 2011 on the loan portfolio is 5.65% per annum (2010: 5.54%).
Included in Special Borrowings are amounts to fund the acquisition of a bulk unloader at Fremantle Ports’ Kwinana Bulk Jetty and a new bulk unloader and other assets at Fremantle Ports’ Kwinana Bulk Terminal. A portion of the borrowings is subject to interest only. Interest and principal is payable quarterly. Interest rates on the Special Borrowings are fixed and range from 4.74% to 6.24% per annum (2010: 4.74% to 6.24%).
The interest rates implicit in the Lease Liabilities range from 4% to 7.80% (2010: 4.50% to 7.80%).

Fremantle Ports | Annual Repor t 2011 | Page 94
Disclosures and Legal Compliance Notes to the Financial Statements
for the year ended 30 June 2011
Back Forward
8. Current and Non-Current Liabilities (continued)
8.2 Interest Bearing Borrowings (continued)
(iii) Interest Rate Risk Exposures
Fremantle Ports’ exposure to interest rate risk on the interest bearing borrowings and the effective weighted average interest rate at year end by maturity periods is set out in the following table.
2011 Fixed interest rate
Variable interest
rate1 year or less
Over 1 to 2 years
Over 2 to 3 years
Over 3 to 4 years
Over 4 to 5 years
More than 5 years Total
$’000 $’000 $’000 $’000 $’000 $’000 $’000 $’000
Interest Bearing Borrowings:
Direct borrowings 213,797 - - - - - - 213,797
Special borrowings 1,013 1,076 1,143 1,213 1,291 20,594 26,330
Lease liabilities - 501 324 172 41 2 - 1,040
213,797 1,514 1,400 1,315 1,254 1,293 20,594 241,167
Weighted Average Interest Rate:
Direct borrowings 5.65% - - - - - -
Special borrowings - 5.75% 5.75% 5.75% 5.75% 5.75% 5.75%
Lease liabilities - 5.90% 5.90% 5.90% 5.90% 5.90% -
2010 Fixed interest rate
Variable interest
rate1 year or less
Over 1 to 2 years
Over 2 to 3 years
Over 3 to 4 years
Over 4 to 5 years
More than 5 years Total
$’000 $’000 $’000 $’000 $’000 $’000 $’000 $’000
Interest Bearing Borrowings:
Direct borrowings 129,297 - - - - - - 129,297
Special borrowings 6,426 1,013 1,076 1,142 1,213 21,886 32,756
Lease liabilities - 517 350 167 52 4 - 1,090
129,297 6,943 1,363 1,243 1,194 1,217 21,886 163,143
Weighted Average Interest Rate:
Direct borrowings 5.54% - - - - - -
Special borrowings - 5.75% 5.75% 5.75% 5.75% 5.75% 5.75%
Lease liabilities - 6.36% 6.36% 6.36% 6.36% 6.36% -

Fremantle Ports | Annual Repor t 2011 | Page 95
Back Forward
Disclosures and Legal Compliance Notes to the Financial Statements
for the year ended 30 June 2011
8. Current and Non-Current Liabilities (continued)
8.2 Interest Bearing Borrowings (continued)
(iv) Fair Value
Unless disclosed below, the carrying amount of Fremantle Ports’ current and non-current borrowings approximate their fair value. The fair values have been calculated by discounting the expected future cash flows at prevailing market interest rates.
2011 2010
Carrying Fair Carrying Fair Amount Value Amount Value $’000 $’000 $’000 $’000
Special borrowings 26,330 26,936 32,756 33,546
26,330 26,936 32,756 33,546
9. Financial Instruments
(a) Financial Risk Management Objectives and PoliciesFremantle Ports’ principal financial instruments comprise receivables, payables, interest bearing borrowings, finance leases and cash and cash equivalents.
The main risks arising from Fremantle Ports’ financial instruments are interest rate risk, liquidity risk and credit risk. Fremantle Ports’ policies for managing each of these risks are summarised below.
Interest rate risk
Fremantle Ports’ exposure to market risk for changes in interest rates relates primarily to its cash and cash equivalent holdings and its long-term debt obligation. Fremantle Ports’ borrowings are all obtained through the Western Australian Treasury Corporation (WATC) and are at fixed rates with varying maturities or at variable rates. The risk is managed by WATC through portfolio diversification and variation in maturity dates. Other than as detailed in the interest rate sensitivity analysis in the table below, Fremantle Ports has limited exposure to interest rate risk because it has no borrowings other than WATC borrowings and finance leases (fixed interest rate).
Sensitivity analysis
Fremantle Ports’ policy is to manage its finance costs using a mix of fixed and variable debt with the objective of achieving optimum returns whilst managing interest rate risk to avoid uncertainty and volatility in the market place.
Fremantle Ports constantly analyses its interest rate exposure. Within this analysis consideration is given to potential renewals of existing positions and alternative financing structures.

Fremantle Ports | Annual Repor t 2011 | Page 96
Disclosures and Legal Compliance Notes to the Financial Statements
for the year ended 30 June 2011
Back Forward
9. Financial Instruments (continued)
(a) Financial Risk Management Objectives and Policies (continued)
Sensitivity analysis (continued)
At the Statement of Financial Position date, if interest rates had moved as illustrated in the table below, with all other variables held constant, the effect would be as follows:
+0.50% (0.25%) change change
Carrying Amount Profit Profit 2011 $’000 $’000 $’000
Financial Assets
Cash and cash equivalents 15,209 76 (38)
Financial Liabilities Interest bearing borrowings 213,797 1,069 (534)
Total (Decrease)/Increase (993) 496
+0.50% (0.25%) change change
Carrying Amount Profit Profit 2010 $’000 $’000 $’000
Financial Assets
Cash and cash equivalents 16,958 85 (42)
Financial Liabilities Interest bearing borrowings 129,297 646 (323)
Total Increase/(Decrease) (561) 281
Credit risk
Credit risk arises when there is the possibility of debtors defaulting on their contractual obligations resulting in financial loss to Fremantle Ports. Fremantle Ports measures credit risk on a fair value basis and monitors risk on a regular basis. With respect to credit risk arising from cash and cash equivalents, Fremantle Ports’ exposure to credit risk arises from default of the counter party, with a maximum exposure equal to the carrying amount of the cash and cash equivalents. Fremantle Ports manages credit risk on cash deposits by only holding funds at Australian financial institutions which have satisfactory credit ratings.
Fremantle Ports operates predominantly within the shipping and cargo handling industry and accordingly is exposed to risks affecting that industry. The maximum exposure to credit risk at Statement of Financial Position date in relation to each class of recognised financial assets is the gross carrying amount of those assets inclusive of any provisions for impairment, as shown in the table at Note 9(b).

Fremantle Ports | Annual Repor t 2011 | Page 97
Back Forward
Disclosures and Legal Compliance Notes to the Financial Statements
for the year ended 30 June 2011
9. Financial Instruments (continued)
(a) Financial Risk Management Objectives and Policies (continued)
Credit risk (continued)
Fremantle Ports follows stringent credit control and management procedures in reviewing and monitoring debtor accounts and outstanding balances as evidenced by the historical aged debtor balances. In addition, management of receivable balances includes frequent monitoring thereby minimising Fremantle Ports’ exposure to bad debts. For financial assets that are either past due or impaired, refer to note 6.2 Trade and Other Receivables.
Fremantle Ports’ credit risk management, with regard to trade receivables, is further supported by rental agreements and sections 116 & 117 of the Port Authorities Act 1999. Section 116 refers to the liability to pay port charges in respect of vessels and Section 117 refers to the liability to pay port charges in respect of goods. Port charges are defined in Section 115.
Liquidity risk
Liquidity risk is the risk that a corporation will not be able to meet its financial obligations as they fall due.
Fremantle Ports’ objective is to maintain a balance between continuity of funding and flexibility through the use of cash reserves and its borrowing facilities. Fremantle Ports manages its exposure to liquidity risk by ensuring appropriate procedures are in place to manage cash flows, including monitoring forecast cash flows to ensure sufficient funds are available to meet its commitments.
The risk implied from the values shown in the table below reflects the cash outflows from leasing obligations, trade payables and other financial liabilities which mainly originate from the financing of assets used in the ongoing operations such as property, plant and equipment and investments in working capital e.g. inventories and trade receivables.
Risk associated with the liability on borrowings is reduced by Fremantle Ports paying a guarantee charge. This charge guarantees payment to the WATC by the Government for outstanding borrowings in case of default.
Including interest
2011
Carrying Amount
$’000
<12Months$’000
1-5 Years$’000
>5 years$’000
Total$’000
Financial liabilities
Trade and other payables 22,412 22,412 - - 22,412
Interest bearing borrowings 241,167 15,419 63,621 309,838 388,878
263,579 37,831 63,621 309,838 411,290
Including interest
2010
Carrying Amount
$’000
<12Months$’000
1-5 Years$’000
>5 years$’000
Total$’000
Financial liabilities
Trade and other payables 26,597 26,597 - - 26,597
Interest bearing borrowings 163,143 15,849 45,042 200,794 261,685
189,740 42,446 45,042 200,794 288,282
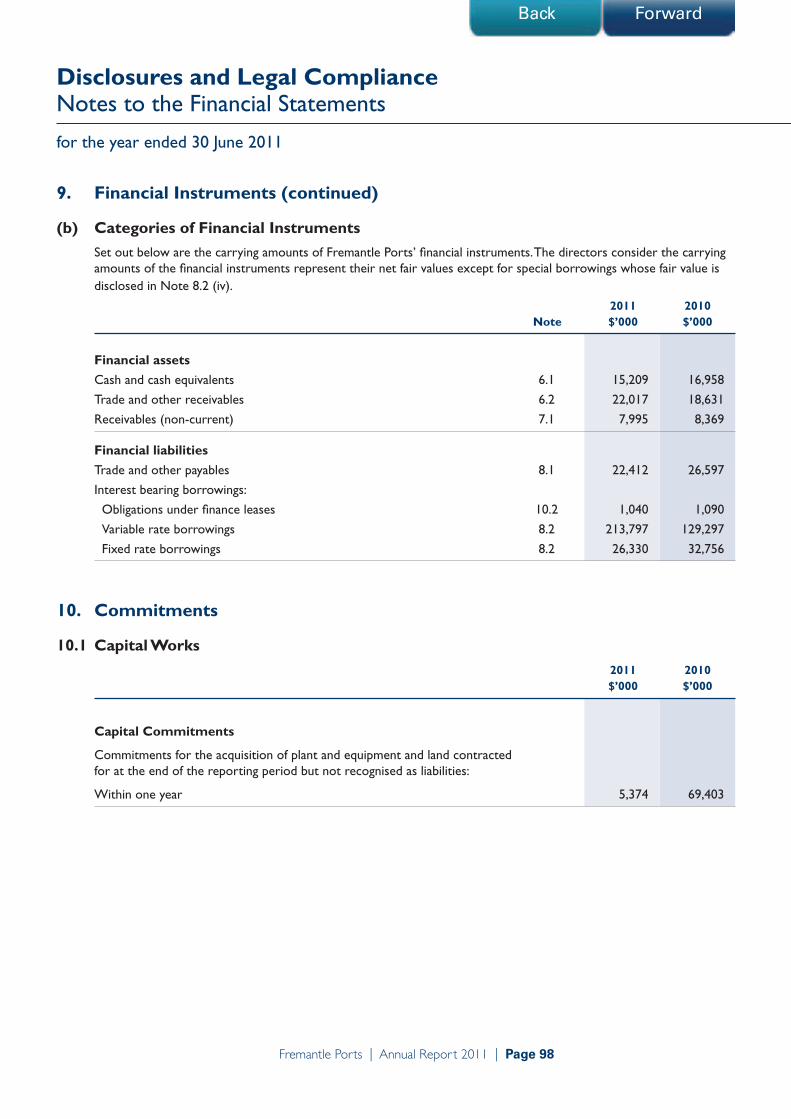
Fremantle Ports | Annual Repor t 2011 | Page 98
Disclosures and Legal Compliance Notes to the Financial Statements
for the year ended 30 June 2011
Back Forward
9. Financial Instruments (continued)
(b) Categories of Financial InstrumentsSet out below are the carrying amounts of Fremantle Ports’ financial instruments. The directors consider the carrying amounts of the financial instruments represent their net fair values except for special borrowings whose fair value is disclosed in Note 8.2 (iv).
2011 2010 Note $’000 $’000
Financial assets
Cash and cash equivalents 6.1 15,209 16,958
Trade and other receivables 6.2 22,017 18,631
Receivables (non-current) 7.1 7,995 8,369
Financial liabilities Trade and other payables 8.1 22,412 26,597
Interest bearing borrowings:
Obligations under finance leases 10.2 1,040 1,090
Variable rate borrowings 8.2 213,797 129,297
Fixed rate borrowings 8.2 26,330 32,756
10. Commitments
10.1 Capital Works 2011 2010 $’000 $’000
Capital Commitments
Commitments for the acquisition of plant and equipment and land contracted for at the end of the reporting period but not recognised as liabilities:
Within one year 5,374 69,403

Fremantle Ports | Annual Repor t 2011 | Page 99
Back Forward
Disclosures and Legal Compliance Notes to the Financial Statements
for the year ended 30 June 2011
10. Commitments (continued)
10.2 Lease Commitments 2011 2010 $’000 $’000
Finance Leases Payable
Future minimum lease payment in relation to finance leases payable at the end of the reporting period are as follows:
Within one year 549 571
Later than one year but not later than five years 570 609
Minimum lease payments 1,119 1,180
Future finance charges (79) (90)
Present value of lease liabilities 1,040 1,090
2011 2010 Note $’000 $’000
Representing Lease Liabilities
Current 8.2 501 517
Non-current 8.2 539 573
1,040 1,090
Finance leases payable are in respect of computer and office equipment and security equipment with a carrying amount of $1.040 million (2010: $1.090 million) expiring within 3 to 5 years (2010: 1.75 to 5 years). Under the terms of the leases, Fremantle Ports has the option to return or upgrade the equipment at the expiry of the lease agreement.
2011 2010 $’000 $’000
Operating Leases Payable
Future minimum rentals payable in relation to operating leases payable at the end of the reporting period but not recognised as liabilities payable are as follows:
Within one year 298 316
Later than one year but not later than five years 176 219
474 535
Operating leases payable are in respect of motor vehicles.

Fremantle Ports | Annual Repor t 2011 | Page 100
Disclosures and Legal Compliance Notes to the Financial Statements
for the year ended 30 June 2011
Back Forward
10. Commitments (continued)
10.2 Lease Commitments (continued) 2011 2010 $’000 $’000
Finance Lease Receivable
Amounts receivable under finance leases:
Within one year 1,079 1,079
Later than one year but not later than five years 4,315 4,315
Later than five years 8,449 9,528
13,848 14,922
Unearned finance income (5,474) (6,210)
Present value of minimum lease payments receivable 8,369 8,712
2011 2010 Note $’000 $’000
Representing Finance Lease Receivable
Current 6.2 374 343
Non-current 7.1 7,995 8,369
8,369 8,712
Finance leases receivable are in respect of buildings and plant and equipment. The lease agreement expires in April 2024. Interest is charged at 8.59% (2010: 8.59%) per annum.
2011 2010 $’000 $’000
Operating Leases Receivable
Future minimum rentals receivable for operating leases at the end of the reporting period but not recognised as assets:
Within one year 14,709 12,428
Later than one year but not later than five years 38,031 43,779
Later than five years 21,555 22,939
74,295 79,146
Operating leases receivable are in respect of property rentals.
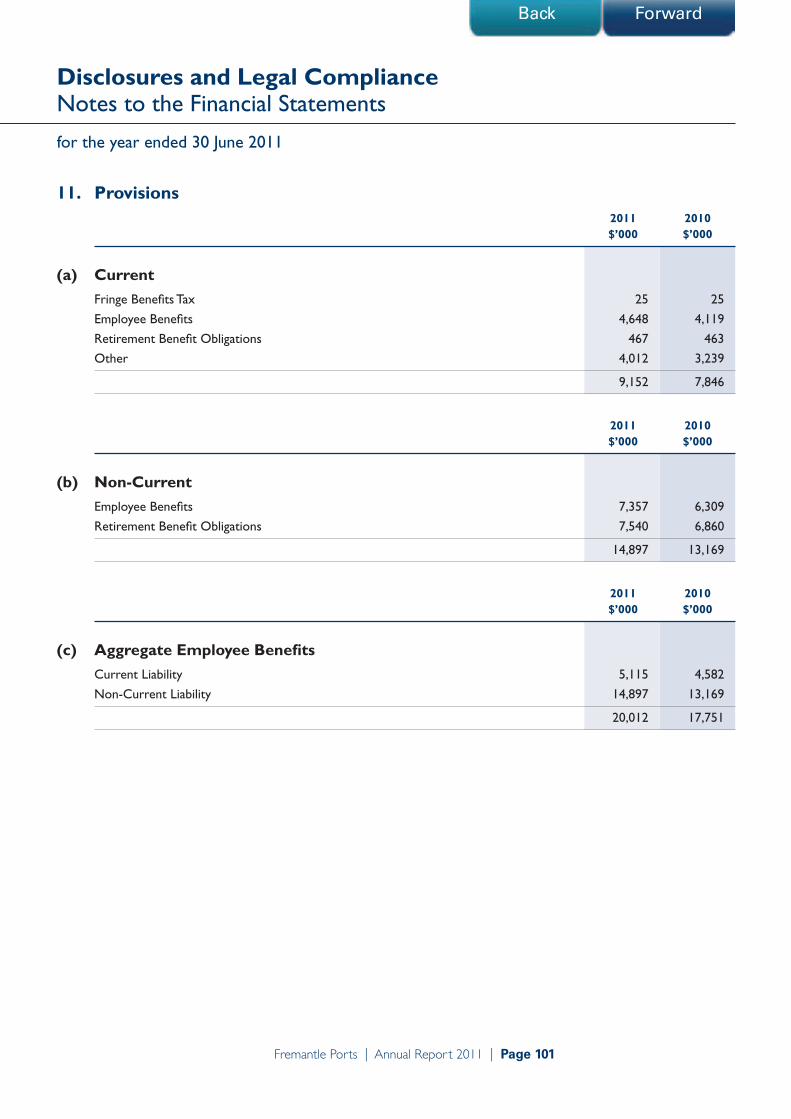
Fremantle Ports | Annual Repor t 2011 | Page 101
Back Forward
Disclosures and Legal Compliance Notes to the Financial Statements
for the year ended 30 June 2011
11. Provisions 2011 2010 $’000 $’000
(a) CurrentFringe Benefits Tax 25 25
Employee Benefits 4,648 4,119
Retirement Benefit Obligations 467 463
Other 4,012 3,239
9,152 7,846
2011 2010 $’000 $’000
(b) Non-CurrentEmployee Benefits 7,357 6,309
Retirement Benefit Obligations 7,540 6,860
14,897 13,169
2011 2010 $’000 $’000
(c) Aggregate Employee BenefitsCurrent Liability 5,115 4,582
Non-Current Liability 14,897 13,169
20,012 17,751

Fremantle Ports | Annual Repor t 2011 | Page 102
Disclosures and Legal Compliance Notes to the Financial Statements
for the year ended 30 June 2011
Back Forward
11. Provisions (continued) 2011 2010 $’000 $’000
(d) Retirement Benefit Obligations
Surplus/deficit
The following is a summary of the most recent financial position of the Pension Scheme related to Fremantle Ports calculated in accordance with AASB 119 Employee Benefits.
Amounts recognised in the Statement of Financial Position:
Present value of unfunded obligations 8,007 7,279
Fair value of plan assets - -
8,007 7,279
Reconciliation of movement in the present value of the unfunded obligations recognised in the Statement of Financial Position:
Opening balance 7,279 7,662
Current service cost 66 64
Interest cost 387 398
Actuarial loss/(gain) on liabilities 442 (30)
Benefits paid (including expenses and taxes) (167) (815)
8,007 7,279
Amounts recognised in the Statement of Comprehensive Income:
Current service cost 66 64
Interest cost 387 398
Actuarial loss/(gain) recognised 442 (30)
895 432
Historic summary
Defined benefit plan obligation 8,007 7,279
Plan assets - -
8,007 7,279
Experience adjustments arising on plan liabilities 442 (30)
Experience adjustments arising on plan assets - -
Principal actuarial assumptions
Discount rate 5.28% 5.48%
Expected future salary increases 4.5% 4.5%
Expected future pension increases 2.5% 2.5%
Anticipated return on plan assets N/A N/A
Expected contributions
Employer contributions are made to meet the cost of retirement benefit obligations as they fall due. For further details regarding the policy in respect of provision for retirement benefit obligations, refer to Note 1.18.

Fremantle Ports | Annual Repor t 2011 | Page 103
Back Forward
Disclosures and Legal Compliance Notes to the Financial Statements
for the year ended 30 June 2011
11. Provisions (continued) 2011 $’000
(e) ReconciliationsReconciliations for the carrying amounts of each class of provision, except for employee benefits, are set out below:
Retirement Benefit Obligations Carrying amount at 1 July 7,323
Provisions made during the year 4,146
Amounts utilised in the year (3,462)
Carrying amount at 30 June 8,007
Fringe Benefits Tax Carrying amount at 1 July 25
Provisions made during the year 102
Amounts utilised in the year (102)
Carrying amount at 30 June 25
Other Carrying amount at 1 July 3,239
Provisions made during the year 1,048
Amounts utilised in the year (275)
Carrying amount at 30 June 4,012
Other provision is mainly for on-costs related to employee benefits and costs associated with environmental assessment and remediation.
12. Deferred Income 2011 2010 $’000 $’000
CurrentDeferred Income 1,000 -
1,000 -

Fremantle Ports | Annual Repor t 2011 | Page 104
Disclosures and Legal Compliance Notes to the Financial Statements
for the year ended 30 June 2011
Back Forward
13. Other Liabilities 2011 2010 $’000 $’000
CurrentPrepaid Rental Income 1,633 599
Interest Received in Advance 28 31
1,661 630
Non-Current Prepaid Rental Income 1,543 1,561
14. Equity Contributed Retained Total equity earnings Equity Note $’000 $’000 $’000
Balance at 1 July 2009 53,938 98,712 152,650
Equity contribution in the year 209 - 209
Total comprehensive income - 14,665 14,665
Dividends paid 5 - (6,860) (6,860)
Balance at 30 June 2010 54,147 106,517 160,664
Equity contribution in the year 103 - 103
Total comprehensive income - 11,785 11,785
Dividends paid 5 - (9,532) (9,532)
Balance at 30 June 2011 54,250 108,770 163,020
On 12 December 2000, Fremantle Ports entered into a fixed interest loan of $5 million with the Western Australian Treasury Corporation which partially funded the acquisition of a bulk unloader at Fremantle Ports’ Kwinana Bulk Jetty.
The WA Government has agreed to provide support on borrowing costs for this loan by way of equity contributions to Fremantle Ports. The amount of equity contributions made to Fremantle Ports is equivalent to the after tax cost of the borrowing costs paid by Fremantle Ports. The equity contribution on these borrowing costs for the year ended 30 June 2011 was $0.103 million (2010: $0.209 million).

Fremantle Ports | Annual Repor t 2011 | Page 105
Back Forward
Disclosures and Legal Compliance Notes to the Financial Statements
for the year ended 30 June 2011
15. Notes to Statement of Cash FlowsReconciliation of net cash inflow from operating activities to profit after income tax
2011 2010 $’000 $’000
Net Profit 11,785 14,665
Depreciation 11,293 7,692
Amortisation of leased assets 629 596
Net loss on sale of property, plant and equipment - 106
Impairment loss on property, plant and equipment 3,190 341
Impairment loss on prepayments - 890
Changes in assets and liabilities:
Receivables (2,922) (2,131)
Inventories 5 (292)
Prepaid expenses (433) (664)
Payables (4,185) 14,280
Prepaid rental income and interest received in advance 1,013 (498)
Employee benefits 2,261 343
Income tax 1,400 794
Deferred tax assets 42 (115)
Deferred income 1,000 -
Others 775 216
Net cash inflow from operating activities 25,853 36,223
16. Remuneration of Auditors 2011 2010 $’000 $’000
Remuneration for audit of the financial statements 144,000 134,300

Fremantle Ports | Annual Repor t 2011 | Page 106
Disclosures and Legal Compliance Notes to the Financial Statements
for the year ended 30 June 2011
Back Forward
17. Related PartiesThe following persons held the position of director during the financial year and until the date of this report:
Dr. Jim Limerick Mr. Robert PearceMs. Marie Malaxos Mr. Michael Feutrill (appointed 1 December 2010)Ms. Jillian Hoffmann (appointed 17 May 2011)Mr. Alan Birchmore (ceased 30 September 2010)Ms. Eve Howell (ceased 31 December 2010)
There are no transactions in the year with the directors or other related parties.
18. Contingent LiabilitiesIn addition to the liabilities included in the financial statements, there are the following contingent liabilities:
Contaminated sitesUnder the Contaminated Sites Act 2003 (the Act), the Port is required to report all land owned, vested or leased by the Authority that is known to be, or is suspected of being, contaminated to the Department of Environment and Conservation (DEC). In accordance with the Act, the DEC classifies these sites on the basis of the risk to human health, the environment and environmental values. Where sites are classified as either ‘contaminated – remediation required’ or ‘possibly contaminated – investigation required’, the Port may have a liability in respect of investigation or remediation expenses.
Except for those areas planned underway for remediation and for which a liability has been provided, a portion of the sites identified as ‘contaminated – remediation required’ are currently being assessed further and therefore it is not yet practicable to reliably estimate the potential financial effect or to identify the uncertainties relating to the amount or timing of any outflows other than the necessary detailed site investigations.
At 30 June 2011, a provision for environmental remediation of $2.876 million (2010: $1.944 million) has been provided for sites classified by the DEC as ‘contaminated – remediation required’. A provision for further detailed site investigations of $0.300 million (2010: $0.300 million) for other areas identified as ‘contaminated – remediation required’ has also been provided in order to more reliably estimate the amount, timing and methodology required to comply.
19. Events Subsequent to End of the Reporting PeriodSubsequent to 30 June 2011, a writ has been lodged against Fremantle Ports in the Federal Court. Fremantle Ports does not believe that the claim is credible and has taken steps to defend the matter.
Other than the matter discussed above, there has not arisen in the interval between the end of the financial year and the date of this report any item, transaction or event of a material and unusual nature likely, in the opinion of the Directors of Fremantle Ports, to affect significantly the operations, the results of those operations, or the state of affairs, in future financial years.

Fremantle Ports | Annual Repor t 2011 | Page 107
Back Forward
In the opinion of the Directors of the Fremantle Port Authority:
(a) the financial statements and notes, set out on pages 70 to 106, are in accordance with the financial reporting provisions of the Port Authorities Act 1999, including:
(i) giving a true and fair view of the financial position of the Fremantle Port Authority as at 30 June 2011 and its performance, as represented by the results of its operations and its cash flows, for the year ended on that date; and
(ii) complying with Australian Accounting Standards and the Port Authorities Act 1999; and
(b) there are reasonable grounds to believe that the Fremantle Port Authority will be able to pay its debts as and when they become due and payable.
This declaration is signed in accordance with a resolution of the Directors on 19 August 2011.
Chairman
Director
19 August 2011
Disclosures and Legal Compliance Directors’ Declaration

Fremantle Ports | Annual Repor t 2011 | Page 108
Back Forward
Disclosures and Legal Compliance Financial Audit Opinion
Auditor General
Page 1 of 2
4th Floor Dumas House 2 Havelock Street West Perth 6005 Western Australia Tel: 08 9222 7500 Fax: 08 9322 5664
INDEPENDENT AUDITOR’S REPORT To the Parliament of Western Australia FREMANTLE PORT AUTHORITY I have audited the financial report of the Fremantle Port Authority. The financial report comprises the Statement of Financial Position as at 30 June 2011, the Statement of Comprehensive Income, Statement of Changes in Equity, and Statement of Cash Flows for the year then ended, and Notes comprising a summary of significant accounting policies and other explanatory information and the Directors’ Declaration. Directors’ Responsibility for the Financial Report The directors of the Fremantle Port Authority are responsible for the preparation of the financial report that gives a true and fair view in accordance with Australian Accounting Standards and the Port Authorities Act 1999, and for such internal control as the directors determine is necessary to enable the preparation of the financial report that is free from material misstatement, whether due to fraud or error. Auditor’s Responsibility As required by the Port Authorities Act 1999, my responsibility is to express an opinion on the financial report based on my audit. The audit was conducted in accordance with Australian Auditing Standards. Those Standards require compliance with relevant ethical requirements relating to audit engagements and that the audit be planned and performed to obtain reasonable assurance about whether the financial report is free from material misstatement. An audit involves performing procedures to obtain audit evidence about the amounts and disclosures in the financial report. The procedures selected depend on the auditor’s judgement, including the assessment of the risks of material misstatement of the financial report, whether due to fraud or error. In making those risk assessments, the auditor considers internal control relevant to the Authority’s preparation of the financial report that gives a true and fair view in order to design audit procedures that are appropriate in the circumstances, but not for the purpose of expressing an opinion on the effectiveness of the Authority’s internal control. An audit also includes evaluating the appropriateness of the accounting policies used and the reasonableness of accounting estimates made by the directors, as well as evaluating the overall presentation of the financial report. I believe that the audit evidence obtained is sufficient and appropriate to provide a basis for my audit opinion. Independence In conducting this audit, I have complied with the independence requirements of the Auditor General Act 2006 and the Australian Auditing Standards, and other relevant ethical requirements.
Page 2 of 2
Fremantle Port Authority Opinion In my opinion, the financial report of the Fremantle Port Authority is in accordance with schedule 5 of the Port Authorities Act 1999, including: (a) giving a true and fair view of the Authority’s financial position as at 30 June 2011 and
of its performance for the year ended on that date; and (b) complying with Australian Accounting Standards and the Corporations Regulations
2001.
COLIN MURPHY AUDITOR GENERAL 31 August 2011

Fremantle Ports | Annual Repor t 2011 | Page 109
Back Forward
In addition to the key performance indicators provided, the following financial performance indicators, which are not subjected to audit, are provided to assist users to assess the financial management performance of Fremantle Ports. The indicators selected are considered appropriate for use in either evaluating the performance of a Government Trading Enterprise or an entity in the private sector.
Current Ratio – Graph 1After adjusting for GST, this ratio is used to ascertain the extent to which current assets may be realised to meet current liabilities.
2011$’000
2010$’000
Total Current Assets 37,518= 1.0
34,618= 0.8
Total Current Liabilities 38,231 43,108
Free Cash Flow – Graph 2Measures the net cash flow available as a source of funds from operations after meeting interest costs.
2011$’000
2010$’000
Net Cashflow from Operations (after interest) 25,853
= 78.8%36,223
= 94.6%Net Cashflow from Operations
(before interest)32,828 38,278
Debtors Average Collection Period – Graph 3Shows the rate at which debtors generate cash flow for use in operations.
2011$’000
2010$’000
Average Trade Debtors 16,155 x 365= 35 days
13,698 x 365= 35 days
Sales Revenue 166,871 144,355
Disclosures and Legal Compliance Financial Performance Indicators

Fremantle Ports | Annual Repor t 2011 | Page 110
Back Forward
Disclosures and Legal Compliance Financial Performance Indicators
Interest Cover – Graph 4Provides an indication of the Port’s ability to meet interest costs from operating profit.
2011$’000
2010$’000
Earnings Before Interest and Tax 25,235= 3.11 times
22,651= 7.55 times
Total Interest Costs 8,108 2,999
Return on Assets – Graph 5This measures the rate of return earned through operating total assets provided by the Port.
2011$’000
2010$’000
Earnings Before Interest and Tax 25,235= 6.1%
22,651= 6.9%
Average Total Assets 416,023 326,875
Economic Rate of Return – Graph 6In accordance with the Government policy effective July 2000, Fremantle Ports is required to report a rate of return on non-current assets valued at Deprival Value. This indicator quantifies the rate of return earned on average current and non-current assets of the Port.
2011$’000
2010$’000
Operating EBIT (excluding significant items) +
Depreciation – Deprival Value Depreciation 26,348
= 4.8%22,247
= 4.8%Current Assets +
Deprival Value of Assets – Accumulated Deprival Value
Depreciation
549,302 467,278

Fremantle Ports | Annual Repor t 2011 | Page 111
Back Forward
0.0
0.8
1.6
2.4
2010/112009/102008/092007/082006/07
2010/112009/102008/092007/082006/07
2010/112009/102008/092007/082006/07 2010/112009/102008/092007/082006/07
2010/112009/102008/092007/082006/07
1.70 1.60 2.10 0.80 1.00
Graph 1: Current RatioComparison 2006/2007 to 2010/2011
0.0%
5.0%
10.0%
15.0%
9.6% 12.7% 8.6% 6.9% 6.1%
Graph 5: Return on AssetsComparison 2006/2007 to 2010/2011
0
5
10
15
20
25
30
35
40
32 34 33 35 35
Graph 3: Debtors Average Collection PeriodComparison 2006/2007 to 2010/2011
0.00
2.00
4.00
6.00
8.00
10.00
6.52 9.16 8.45 7.55 3.11
Graph 4: Interest CoverComparison 2006/2007 to 2010/2011
0.0%
3.0%
6.0%
9.0%
6.0% 8.2% 5.3% 4.8% 4.8%
Graph 6: Economic Rate of ReturnComparison 2006/2007 to 2010/2011
50%
60%
70%
80%
90%
100%
2010/112009/102008/092007/082006/07
87.6% 87.1% 92.2% 94.5% 78.8%
Graph 2: Free Cash FlowComparison 2006/2007 to 2010/2011

Fremantle Ports | Annual Repor t 2011 | Page 112
Back Forward
Disclosures and Legal Compliance Key Performance Indicators
Service Delivery
Our Objective• Providing exceptional services that exceed customer expectations.
Outcomes Sought• Understanding of customer needs• Meeting or exceeding customer expectations• Availability and reliability of all services and facilities• Responsiveness
Berthing Delays – Incoming VesselsThe performance targets for port operations include maximum berthing delays due to the unavailability of services and berths for container vessels in the Inner Harbour and for all vessels at Fremantle Ports’ Kwinana Bulk Terminal and Kwinana Bulk Jetty in the Outer Harbour. Services include pilotage, towage and mooring. This performance indicator measures the percentage of ships affected and the average hours per delay for unavailability of services and berths.
Figures 1 and 2 below show that Fremantle Ports did better than its target with no vessel delays recorded as a result of the unavailability of shipping services at the Kwinana Bulk Jetty. At the Kwinana Bulk Terminal, the percentage of vessels affected due to unavailability of shipping services was slightly higher than budget and similar to the target for average delay time for vessels delayed. In the Inner Harbour the percentage of vessels affected and the average delay time due to the unavailability of shipping services were below target.
Fig 1. Delays to Incoming Vessels due to Unavailability
of Shipping Services 2010/11 % of total vessels affected
I-H CONTAINER KBT KBJ
0.4
Target <1%
Target <2%
1.4
0
2.50
2.00
1.50
1.00
0.50
0.00
Target <1%
Note: Shipping services include pilotage, towage and mooring

Fremantle Ports | Annual Repor t 2011 | Page 113
Back Forward
Crane RatesContainer stevedoring in Fremantle Ports is carried out by Patrick and DP World. Crane rates are a measure of the productivity of the container terminal operators in the port. The crane rate is the number of containers handled divided by the Elapsed Crane Time. The Elapsed Crane Time is the total allocated crane hours, less operational and non operational delays.
Figure 3 shows that crane rates measured in containers per hour have increased by 47.6 per cent from the December Quarter 1997 to the December Quarter 2010 (latest figures released by Waterline). Productivity in Fremantle was 5.1 per cent lower than the five port average in the December Quarter 2010. The crane rate for Fremantle was consistently above the five port average from the December
Fig 2. Delays to Incoming Vessels due to Unavailability of Shipping Services 2010/11
Average hours of delay per vessel delayed
I-H CONTAINER KBT KBJ
Target per vessel delayed <5 hours
Target per vessel delayed <5 hours
Target per vessel delayed <5 hours
0
15.0
13.5
12.00
10.50
9.00
7.50
6.00
4.50
3.00
1.50
0.00
Note: Shipping services include pilotage, towage and mooring
5
2
Fig 3. Container Performance Indicators
Comparison of Crane Rates between Fremantle and Five
Ports Average December 1997 to December
2010 Containers per hour
35
30
25
20
15
10
5
0
Dec-97 Dec-98 Dec-99 Dec-00 Dec-01 Dec-02 Dec-03 Dec-04 Dec-05 Dec-06 Dec-07 Dec-08 Dec-09 Dec-10
18.9 20.7 21.2 26.8 27.9 28.1 27.0 27.2 27.1 27.8 28.0 26.7 30.3 27.9
18.5 18.9 19.0 25.5 26.1 26.0 27.2 27.1 27.7 26.8 27.2 27.5 29.5 29.4
FREMANTLE
FIVE PORTS
Source: Waterline, Bureau of Infrastructure, Transport and Regional Economics. Figures for March and June Quarter 2011 not available due to Waterline being published in October 2010 and July 2011

Fremantle Ports | Annual Repor t 2011 | Page 114
Back Forward
Disclosures and Legal Compliance Key Performance Indicators
quarter of 1997 to the December quarter 2009. Productivity has been below the five port average from the March quarter 2010 to the December quarter 2010.
The Ship Rate in Fremantle increased from 35.9 containers per hour in December 2000 to 52.5 containers per hour in December 2010, an increase of 46.2 per cent. The Ship Rate is defined as the crane rate multiplied by Crane Intensity. Crane Intensity is defined as the total number of allocated crane hours, divided by the elapsed time from labour first boarding the ship and labour last leaving the ship.
The number of cranes used by a stevedore to work a ship depends on a variety of factors including the size of the ship, the stowage pattern and number of containers to be exchanged, the total number of cranes at the terminal, crane availability, and the cost of using the cranes in terms of labour and maintenance.
Productivity rates have decreased for the two operators at Fremantle, DP World and Patrick. Fremantle Ports will continue to work with the stevedores to help facilitate ongoing productivity improvements and also to work with them to facilitate investment in new infrastructure and accommodate future trade growth. Inner Harbour deepening was essential to enable the port to accommodate bigger ships at full cargo-carrying capacity, thus retaining shipping services and maintaining compatibility with other national container ports.
The ability for Patrick and DP World to service larger, more efficient ships with new generation cranes will improve productivity. The average size of container vessels has increased from 29,300 gross tons (GT) in 1999/00 to 38,400 GT in 2010/11, an increase of 31.1 per cent over that period.
The average number of containers exchanged per container vessel increased by 0.8 per cent over the year, from 1,061 TEU per vessel in 2009/10 to 1,070 TEU per vessel in 2010/11.
The Vessel Working Rate (the number of containers handled divided by the Elapsed Labour Time) in the port for the December quarter 2010 was 36.8 containers per hour, an increase of 50.8 per cent compared with the figures for the December quarter 2000, which further highlights labour productivity over that period.
Customer Satisfaction Fremantle Ports conducted a survey of shipping lines in June 2010. The survey was conducted as part of Fremantle Ports’ customer liaison program with major lines and agents. A total of 19 shipping lines were surveyed and the response rate was 86 per cent.

Fremantle Ports | Annual Repor t 2011 | Page 115
Back Forward
The overall results were analysed by a firm of marketing and communications research consultants.
Fig 4. Shipping Line/Agent Survey Services
- 2006/07 to 2010/11 Level of Overall Satisfaction with
Fremantle Ports’ Services
Figure 4 shows that 95 per cent of respondents were satisfied or very satisfied with services provided by Fremantle Ports which was above the target range of 80-90 per cent and above the level in the previous year when the response rate to the survey was 94 per cent.
06/07 07/08 08/09 09/10 10/11
100
90
80
70
60
50
40
30
20
10
0
Per
Cen
t
Note: In 2010/11, 95% of respondents were satisfied or very satisfied. Target range 80-90%

Fremantle Ports | Annual Repor t 2011 | Page 116
Back Forward
Disclosures and Legal Compliance Key Performance Indicators
Capability for the Future
Our Objective Ensuring sound planning for all aspects of our business including resources, services and infrastructure
Outcomes Sought• Relevant planning is undertaken across all areas
• Providing appropriate infrastructure and services for current and future trade
Figure 5 shows that 26 per cent of Inner Harbour container vessels incurred delays due to unavailability of berths (percentage of total vessels affected). Container vessels were above target but in the main it is due to vessels arriving early, ahead of their schedule and berth unavailability due to the Inner Harbour deepening and berth works project. Unavailability of berths at Kwinana Bulk Terminal was also higher than target at 61 per cent due to significant increases in berth utilisation and trade. Trade at the Kwinana Bulk Terminal increased by 0.8 million tonnes or 49.5 per cent in 2010/11 compared with 2009/10. Unavailability of berths at Kwinana Bulk Jetty was lower than the target at 18 per cent.
Fig 5. Unavailability of Berths 2010/11
% of total vessels affected
I-H CONTAINER Kwinanna Bulk Terminal Kwinanna Bulk Jetty
18%
70%
60%
50%
40%
30%
20%
10%
0%
61%
26%
Target <12%
Target <25% Target <25%

Fremantle Ports | Annual Repor t 2011 | Page 117
Back Forward
Fig 6. Unavailability of Berths 2010/11
Average hours of delay
Figure 6 shows that average hours of delay at Kwinana Bulk Terminal significantly exceeded the target in 2010/11 mainly due to an increase in berth utilisation which is the result of significant trade increases. In this regard, trade at the Kwinana Bulk Terminal was 49.5 per cent higher than the previous year. Average hours of delay at the Kwinana Bulk Jetty were below the target and slightly higher than the 36 hours recorded in 2009/10. Trade levels at the Kwinana Bulk Jetty increased by 0.3 million tonnes or 20.1 per cent in 2010/11 compared to 2009/10 and berth utilisation was slightly lower than last year.
I-H CONTAINER Kwinanna Bulk Terminal Kwinanna Bulk Jetty
170
160
150
140
130
120
110
100
90
80
70
60
50
40
30
20
10
05
20
88
158
7
41
Target <20
Target <50
Target <80
Average Hours Delayed All Ships
Average Hours Delayed Per Ship Delayed

Fremantle Ports | Annual Repor t 2011 | Page 118
Back Forward
Trade and Business Growth
Our ObjectivePromoting and facilitating trade and business growth opportunities
Outcomes Sought• Trade growth
• Meeting or exceeding customer expectations for customer growth initiative
• Business growth
Total Port Trade (Mass Tonnes 000’s)Figure 7 shows that total port trade (total imports and exports), was 0.05 million tonnes or 0.2 per cent lower than last year. Total exports decreased by 1.0 million tonnes or 7.4 per cent to 13.0 million tonnes in 2010/11 while total imports increased by 1.0 million tonnes or 8.2 per cent to 13.1 million tonnes.
Inner Harbour exports decreased by 3.0 per cent in 2010/11 mainly due to a significant fall in full container trade, particularly wheat exports which decreased by 38.3 per cent compared with last year. Outer Harbour exports decreased by 8.9 per cent, influenced by falls in grain at the Kwinana Grain Terminal.
Disclosures and Legal Compliance Key Performance Indicators
Fig 7. Total Port Trade (Mass Tonnes) 28.0
26.0
24.0
22.0
20.0
18.0
16.0
14.0
12.0
06/07 07/08 08/09 09/10 10/11
25.1 26.1 26.6 26.2 26.1Tonnes
Mas
s Ton
nes
(Mill
ions
)
Note: The Statement of Corporate Intent forecast for total trade in 2010/11 was annual growth of 2.2 per cent

Fremantle Ports | Annual Repor t 2011 | Page 119
Back Forward
Trade and Business Growth
Our ObjectivePromoting and facilitating trade and business growth opportunities
Outcomes Sought• Trade growth
• Meeting or exceeding customer expectations for customer growth initiative
• Business growth
Total Port Trade (Mass Tonnes 000’s)Figure 7 shows that total port trade (total imports and exports), was 0.05 million tonnes or 0.2 per cent lower than last year. Total exports decreased by 1.0 million tonnes or 7.4 per cent to 13.0 million tonnes in 2010/11 while total imports increased by 1.0 million tonnes or 8.2 per cent to 13.1 million tonnes.
Inner Harbour exports decreased by 3.0 per cent in 2010/11 mainly due to a significant fall in full container trade, particularly wheat exports which decreased by 38.3 per cent compared with last year. Outer Harbour exports decreased by 8.9 per cent, influenced by falls in grain at the Kwinana Grain Terminal.
Fig 8. Total Container Trade - TEU
Inner Harbour imports increased by 9.2 per cent mainly due to rises in iron and steel, chemicals, cork and wood manufactures, manufactures of metal, plastic wares, agricultural and industrial machinery and other transport equipment and parts. Outer Harbour imports increased by 7.8 per cent due to rises in cement clinker, refined petroleum, phosphates/fertilisers, sulphur and gypsum.
Total Container TradeFigure 8 shows that container trade has increased by 18.3 per cent since 2006/07 and by 7.4 per cent over the 12 months to 30 June 2011.
The main features of the container trade over the last twelve months were as follows:
• Total container exports increased by 7.2 per cent and imports increased by 7.5 per cent.
• Full container exports decreased by 5.6 per cent or 10,022 TEU and full imports increased by 11.1 per cent or 29,393 TEU. (Note: the reduction in full exports was attributable to a 9,262 TEU fall in the export of grain in containers).
• Empty container exports increased by 32.8 per cent and empty imports decreased by 31.6 per cent.
• Coastal container throughput totalled 68,508 TEU, a decrease of 6.8 per cent on 2009/10. Coastal full container throughput totalled 62,758 TEU, 4.7 per cent down on 2009/10.
• The number of container vessel visits to Fremantle Port increased from 517 visits in 2009/10 to 555 visits in 2010/11.
06/07 07/08 08/09 09/10 10/11
600
500
400
300
200
100
0
505.82 580.35 565.49 557.44 598.53TEU
TE
Us
(Tho
usan
ds)
Note: The Statement of Corporate Intent forecast for total container trade in 2010/11 was annual growth of 2 per cent

Fremantle Ports | Annual Repor t 2011 | Page 120
Back Forward
• The average size of container vessels has remained at a similar level to last year, 38,400 gross tons (GT).
• The average number of containers exchanged per container vessel increased by 0.8 per cent over the year, from 1,061 TEU per vessel in 2009/10 to 1,070 TEU per vessel in 2010/11.
Container Trade - Market Share
Figure 9 shows that Fremantle Ports’ market share, measured as the number of containers through Fremantle as a percentage of Australian capital city ports (excluding Hobart), remained stable at around 10 per cent over the period 2006/07 to 2010/11.
Disclosures and Legal Compliance Key Performance Indicators
Fig 9. Container Trade Fremantle
Market Share % Australian Container Trade
06/07 07/08 08/09 09/10 10/11
9.52 9.94 9.97 9.42 9.52%
Per
Cen
t12.00
11.00
10.00
9.00
8.00
7.00
6.00
5.00
4.00
3.00
2.00
1.00
0.00
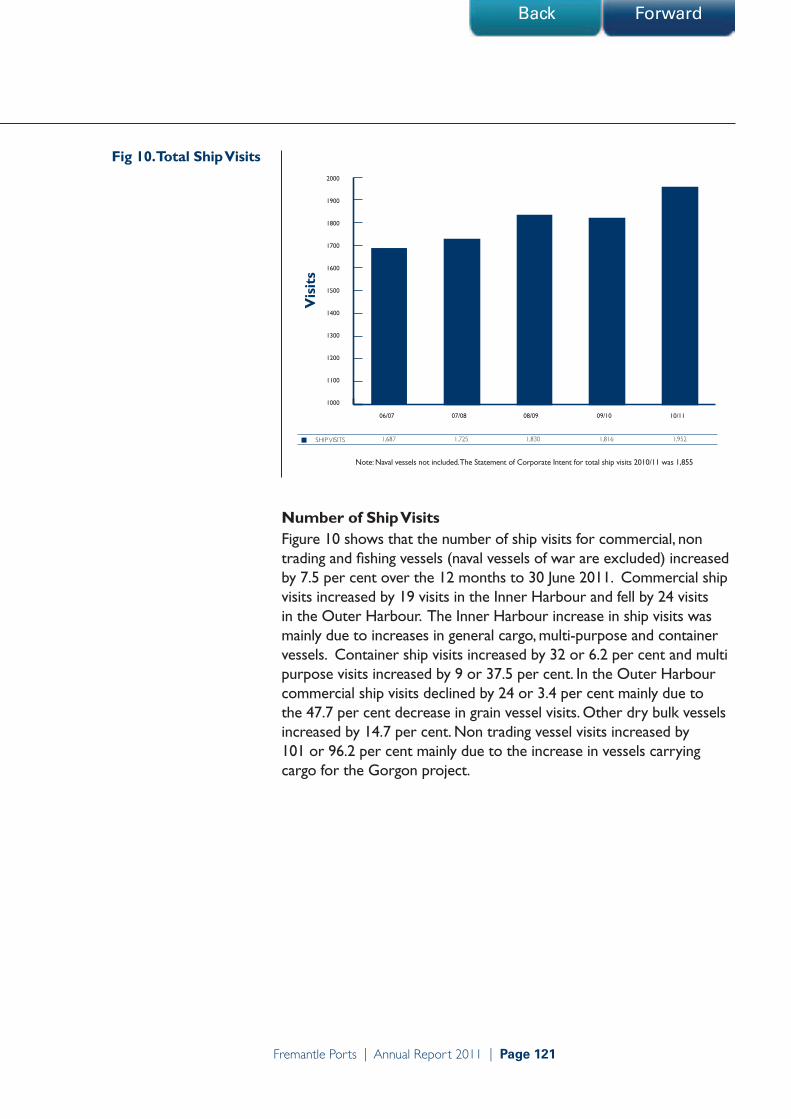
Fremantle Ports | Annual Repor t 2011 | Page 121
Back Forward
Fig 10. Total Ship Visits
Number of Ship VisitsFigure 10 shows that the number of ship visits for commercial, non trading and fishing vessels (naval vessels of war are excluded) increased by 7.5 per cent over the 12 months to 30 June 2011. Commercial ship visits increased by 19 visits in the Inner Harbour and fell by 24 visits in the Outer Harbour. The Inner Harbour increase in ship visits was mainly due to increases in general cargo, multi-purpose and container vessels. Container ship visits increased by 32 or 6.2 per cent and multi purpose visits increased by 9 or 37.5 per cent. In the Outer Harbour commercial ship visits declined by 24 or 3.4 per cent mainly due to the 47.7 per cent decrease in grain vessel visits. Other dry bulk vessels increased by 14.7 per cent. Non trading vessel visits increased by 101 or 96.2 per cent mainly due to the increase in vessels carrying cargo for the Gorgon project.
06/07 07/08 08/09 09/10 10/11
2000
1900
1800
1700
1600
1500
1400
1300
1200
1100
1000
1,687 1,725 1,830 1,816 1,952SHIP VISITS
Vis
its
Note: Naval vessels not included. The Statement of Corporate Intent for total ship visits 2010/11 was 1,855
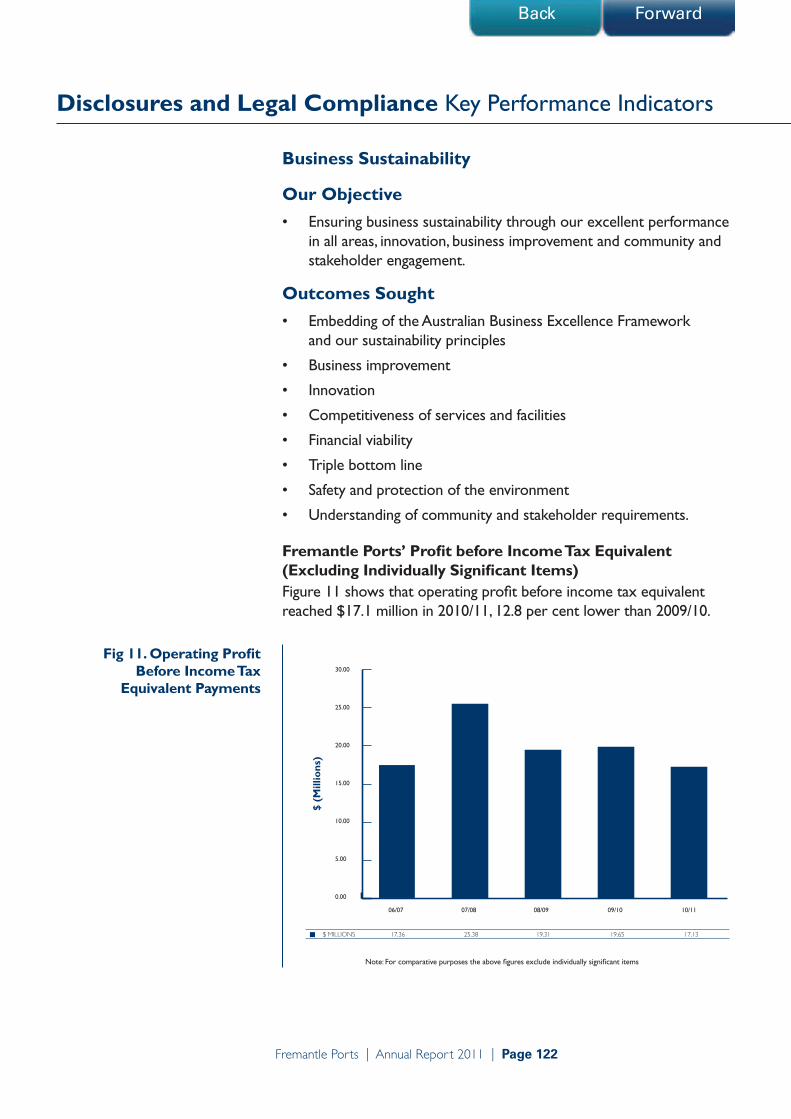
Fremantle Ports | Annual Repor t 2011 | Page 122
Back Forward
Disclosures and Legal Compliance Key Performance Indicators
Business Sustainability
Our Objective• Ensuring business sustainability through our excellent performance
in all areas, innovation, business improvement and community and stakeholder engagement.
Outcomes Sought• Embedding of the Australian Business Excellence Framework
and our sustainability principles
• Business improvement
• Innovation
• Competitiveness of services and facilities
• Financial viability
• Triple bottom line
• Safety and protection of the environment
• Understanding of community and stakeholder requirements.
Fremantle Ports’ Profit before Income Tax Equivalent (Excluding Individually Significant Items)Figure 11 shows that operating profit before income tax equivalent reached $17.1 million in 2010/11, 12.8 per cent lower than 2009/10.
Fig 11. Operating Profit Before Income Tax
Equivalent Payments
06/07 07/08 08/09 09/10 10/11
30.00
25.00
20.00
15.00
10.00
5.00
0.00
17.36 25.38 19.31 19.65 17.13$ MILLIONS
$ (M
illio
ns)
Note: For comparative purposes the above figures exclude individually significant items

Fremantle Ports | Annual Repor t 2011 | Page 123
Back Forward
Economic Rate of Return on AssetsFigure 12 shows that the Economic Rate of Return on assets was 4.8 per cent for 2010/11. This compares with the target of 3.3 per cent for the year. The target Rate of Return is agreed with the State Government annually. During the year, the value of assets on which the Rate of Return is calculated increased by $82.0 million or 17.6 per cent
Fig 12. Economic Rate of Return on Assets
06/07 07/08 08/09 09/10 10/11
6.0 8.2 5.3 4.8 4.8%
Per
Cen
t9.0
8.0
7.0
6.0
5.0
4.0
3.0
2.0
1.0
0.0
Note: The Economic Rate or Return is based on assets valued at deprival value.

Fremantle Ports | Annual Repor t 2011 | Page 124
Back Forward
Disclosures and Legal Compliance Key Performance Indicators
Community Satisfaction Fremantle Ports conducted a community satisfaction survey in June 2011 as part of its community liaison program. This involved a telephone survey with 200 residents in the Inner Harbour area (North Fremantle, South Fremantle, East Fremantle, and Fremantle) and 200 residents in the Outer Harbour (Cockburn, Kwinana, and Rockingham).
The overall results were analysed by a firm of marketing and communications research consultants.
Figure 13 shows that 72 per cent of respondents in the Inner Harbour and 73 per cent in the Outer Harbour were very satisfied or quite satisfied with the performance of Fremantle Ports overall and that 19 per cent and 23 per cent respectively were neither satisfied nor dissatisfied.
Fig 13. Overall Satisfaction with Fremantle Ports -
June 2011 Q. How Satisfied are you with the performance of Fremantle Ports overall?
Very Satisfied Quite Satisfied Quite DissatisfiedNeither Very Satisfied
Inner Harbour - 2011 (n=192)
Outer Harbour - 2011 (n=192)
0% 25% 50% 75% 100%
21
14 59 23 2 2
51 19 6 3
% of Respondents

Fremantle Ports | Annual Repor t 2011 | Page 125
Back Forward
Other Legal Requirements
Ministerial DirectivesThe Minister may give directions in writing to the Board of Directors with respect to the performance of the functions prescribed by legislation.
There were no Ministerial directives during the year.
Advertising and Market Research ExpenditureIn compliance with section 175ZE of the Electoral Act 1907 the following is supplied:
Advertising Agencies NIL
Marketing Research Organisations
Synovate Pty Ltd $46,843.00
Polling Organisation NIL
Direct Mail Organisations
Fremantle Herald (distribution of leaflets) $3,135.00
Community news (distribution of leaflets) $2,110.00
Media Advertising Organisations
Fremantle Herald $3,301.00
WA Volunteer Fire and Rescue $177.00
Community Newspaper Group $954.00
RMJ Promotions $218.00
Seek (recruitment adverts) $7,665.00
Acorn Design (includes tenders, recruitment adverts) $64,956.00
Optimum Media Decisions (OMD) (includes tenders, recruitment adverts)
$105,459.00
Farcount Media Asia $3,950.00
Informa Australia $420.00
The Fremantle Book $850.00
City of Fremantle $1,200.00
Adcorp Australia $22,292.00
Air Ads $870.00
Chamber of Commerce & Industry $2,250.00
Total $266,650.00
Disclosures and Legal Compliance Other Legal Requirements
Fremantle Ports | Annual Repor t 2011 | Page 126
Back Forward
Disability Access and Inclusion Plan OutcomesFremantle Ports provides disability access to public areas of the Administration Building, the Fremantle Passenger Terminal and the recently completed ferry terminal within B Shed on Victoria Quay.
The Fremantle Ports’ redesigned website includes a new section on visiting the port. To help people with disabilities, this includes details on parking locations, ramps and building access, disabled fishing platform, toilets, public transport, including the fully accessible CAT bus service and a taxi services available for passengers with disabilities.
Compliance with Public Sector Standards and Ethical Codes
Code of Conduct Fremantle Ports’ Code of Conduct Charter adopted by the Board, staff and management encompasses the following principles:
• We will respect laws and each other and act accordingly
• We conduct ourselves with integrity and treat others with dignity
• We are responsible for our actions and accountable for their consequences
• We are fair and honest in all our dealings
• We do not place ourselves in situations which result in divided loyalties
• We use Fremantle Ports’ assets (including funds, equipment and information) responsibly, efficiently and in the best interest of the organisation.
The Code of Conduct also includes provision for whistleblowers in line with the Public Interest Disclosure Act 2003.
Fremantle Ports has detailed guidelines and processes in place which support these standards in human resource management. Human Resource policies and procedures are available to all staff and these are periodically reviewed to ensure they continue to reflect best practice in a commercialised environment and that there is compliance with them.
All staff members are provided with a copy of the Code of Conduct. A requirement for compliance with the Code of Conduct is included in employment contracts and is addressed at induction. Corporate Governance is also covered at induction of all new staff. Additionally, the Code of Conduct and organisational values are promoted via Fremantle Ports’ intranet.
In 2010/11 there were no incidents involving reportable misconduct.
Disclosures and Legal Compliance Other Legal Requirements

Fremantle Ports | Annual Repor t 2011 | Page 127
Back Forward
Disclosures and Legal Compliance Other Legal Requirements
A major Human Resources initiative in the first half of 2011 focused on equal employment opportunity, particularly on training employees to have a better understanding of the implications of workplace bullying and harassment. The training was mandatory for all staff, with managers and supervisors required to attend a full day session and other employees a half day.
Recordkeeping Plans
In accordance with Section 61 of the State Records Act 2000, Fremantle Ports provides the following information in support of compliance with the State Records Commission’s Standard 2 Principal 6.
Fremantle Ports is strongly committed to continuous improvement and has implemented best-practice recordkeeping programs to ensure compliance with the State Records Act 2000. The organisation consistently reviews the external market to learn better ways to manage corporate records, and audits new technology to meet business and compliance requirements.
Whether the efficiency and effectiveness of Fremantle Ports’ recordkeeping systems has been evaluated or alternatively when such an evaluation is proposed.
Since 2009, when Fremantle Ports’ electronic document and records management system (TRIM) was integrated with the corporate intranet, there has been a gradual improvement in the use of these two systems. There is now no confusion about where to store documents as users are only permitted to store documents as TRIM reference files on the corporate intranet.
The improved technology has enabled a more positive records management culture to emerge and employees are encouraged to suggest better ways of using these systems. Using TRIM and the Corporate Intranet to manage major projects is an example. Another example has been a review of how project management records are captured for technical projects. This identified that project managers used a hierarchy structure for folders on network drives to store project documents, which meant that only final project documents were being registered to TRIM. A new business classification system was set up to mirror these hierarchical project folders in TRIM and has gained buy-in from project managers.
A vital information review was completed in June 2011, resulting in the creation of vital information maps for Fremantle Ports in the event of a natural disaster. These maps are now stored and are accessible by all on the corporate intranet. Hard copies are stored offsite. The vital information review showed that at least 80 per cent of employees see TRIM as one of the most important systems for storing information.

Fremantle Ports | Annual Repor t 2011 | Page 128
Back Forward
The nature and extent of the recordkeeping training program conducted by or for Fremantle Ports.
Records management officers meet with new employees individually within a week of commencement. A detailed training session covers recordkeeping policies and procedures as well as the use of Fremantle Ports’ business classification scheme. Computer application trainers follow up with one-on-one applications training.
Records management officers or managers provide new employees with the relevant links to records and documents as a starting point for familiarity with use of the system. Further follow up training is completed 2 to 3 weeks later and is targeted to the way people work.
Regular information is also published through the corporate intranet and newsletters about the importance of not disposing of hardcopy or electronic documents, including emails, without first consulting records management staff.
Whether the efficiency and effectiveness of the recordkeeping training program has been reviewed or alternatively when this is planned to be done.
Feedback is invited from all employees through the corporate intranet, emails and newsletters and is provided verbally to records management officers and computer applications trainers who do weekly floor walking. Floor walking is a proactive approach to training and enables just-in-time help to be delivered. Marketing material is regularly reviewed and promoted through the corporate intranet and newsletters and policies and procedures are communicated.
Regular checks of the records management system are undertaken to ensure employees are naming their electronic records and documents appropriately. Capturing any issues when they first occur helps employees to learn the system quickly and gain confidence in using it.
Some managers who were previously not supportive have suggested that any new applications purchased or developed should have the ability to link to TRIM. This demonstrates that the training is effective and has resulted in a change of culture around the importance of capturing and storing records and documents at creation rather than finalisation.
Assurance that Fremantle Ports’ induction program addresses employee roles and responsibilities in regard to their compliance with Fremantle Ports’ recordkeeping plan.
Disclosures and Legal Compliance Other Legal Requirements

Fremantle Ports | Annual Repor t 2011 | Page 129
Back Forward
Disclosures and Legal Compliance Other Legal Requirements
The monthly induction program was recently reviewed and now includes more information on the implications and accountabilities of inefficient recordkeeping, particularly in relation to Freedom of Information. The induction program is part of a wider training program and is delivered to all new employees, including contractors and consultants, in the form of a role play and quiz. This provides information to inductees about their recordkeeping responsibilities and compliance with Fremantle Ports’ Recordkeeping Plan.
Government Policy Requirements
Substantive EqualityFremantle Ports continues to proactively support employees balancing work and family responsibilities with flexible hours, availability of purchased leave, part-time work opportunities, working from home arrangements, and paid maternity and paternity leave.
Fremantle Ports’ Employee Assistance program continues to offer employees and their families with 24 hour confidential counselling assistance on work related or family issues.
Fremantle Ports - Women Employees 2011
compared to 2003
Number of women
employed
Number of permanent full-time women
Number of permanent part-time women
Number of women in
management positions (Tier 1-3)
90
80
70
60
50
40
30
20
10
0
2003 2011

Fremantle Ports | Annual Repor t 2011 | Page 130
Back Forward
Compliance with Occupational Safety, Health and Injury Management ReportingFremantle Ports is committed to providing a safe and healthy work environment for its employees. In the event that an employee is injured or ill due to their work a structured, systematic approach to injury management and rehabilitation has been established to support the earliest possible return to work. Integral to this process is the involvement of the injured employee’s manager/supervisor and Fremantle Ports’ Injury Management Coordinator.
General fitness for work in relation to fatigue management, hours of work and the physical level of work being undertaken by employees continues to be monitored.
Formal Mechanism for Consultation with Employees on Occupational Safety and Health Matters.
Fremantle Ports recognises that active participation by employees and contractors in the safety and health decision-making process is fundamental to an effective Safety Management System. It is the policy of Fremantle Ports that all employees and contractors are given adequate opportunity and encouragement to participate in safety and health matters relevant to their work.
Generally, occupational safety and health issues are identified via incident reports and trend analyses, review of safety performance indicators, and changes to legislation. The Business Improvement Branch provides information to all employees and contractors for their review, discussion in their teams, comments and feedback. The Branch reviews feedback, develops and amends policies and procedures, makes recommendations to the Executive Team as necessary, and communicates changes to employees and contractors.
Fremantle Ports complies with the injury management requirements of the Workers’ Compensation and Injury Management Act 1981.
SAI Global conducts annual surveillance audits on Fremantle Ports’ safety and health management systems to ensure that Fremantle Ports remains eligible for certification to the ANZS 4801 safety management standard. SAI’s audit feedback identifies opportunities for improvement, which are then entered into action plans to ensure continued improvement over time. In May 2011, Fremantle Ports was audited against this standard and also the international environmental and quality standards and ISO14001 and ISO9001 and retained certification to all three.
Disclosures and Legal Compliance Other Legal Requirements

Fremantle Ports | Annual Repor t 2011 | Page 131
Back Forward
Disclosures and Legal Compliance Other Legal Requirements
A number of other auditing activites will be undertaken over the next 12 months, including management-led site reviews and operational and contractor audits to further test the health and safety systems.
Indicator Target and actual 2010-11
Number of fatalities Target - 0Actual - 0
Lost time injury frequency rate(number of lost time injuries by 1,000,000 per total man-hours worked)
Overall target - 0Improvement - 15Actual - 17.6
Lost time injury severity rate (number by 1,000,000 per total man-hours worked)
Improvement target - 141Actual - 361
Percentage of injured workers returned to work within 28 weeks
Target - 100%Actual - 100%
Percentage of managers trained in occupational safety, health and injury management responsibilities
Target - 100%Actual - 100%
Note: The improvement targets are based on the Premier’s improvement challenge of 10% pa, introduced to Public Sector agencies in July 2007.
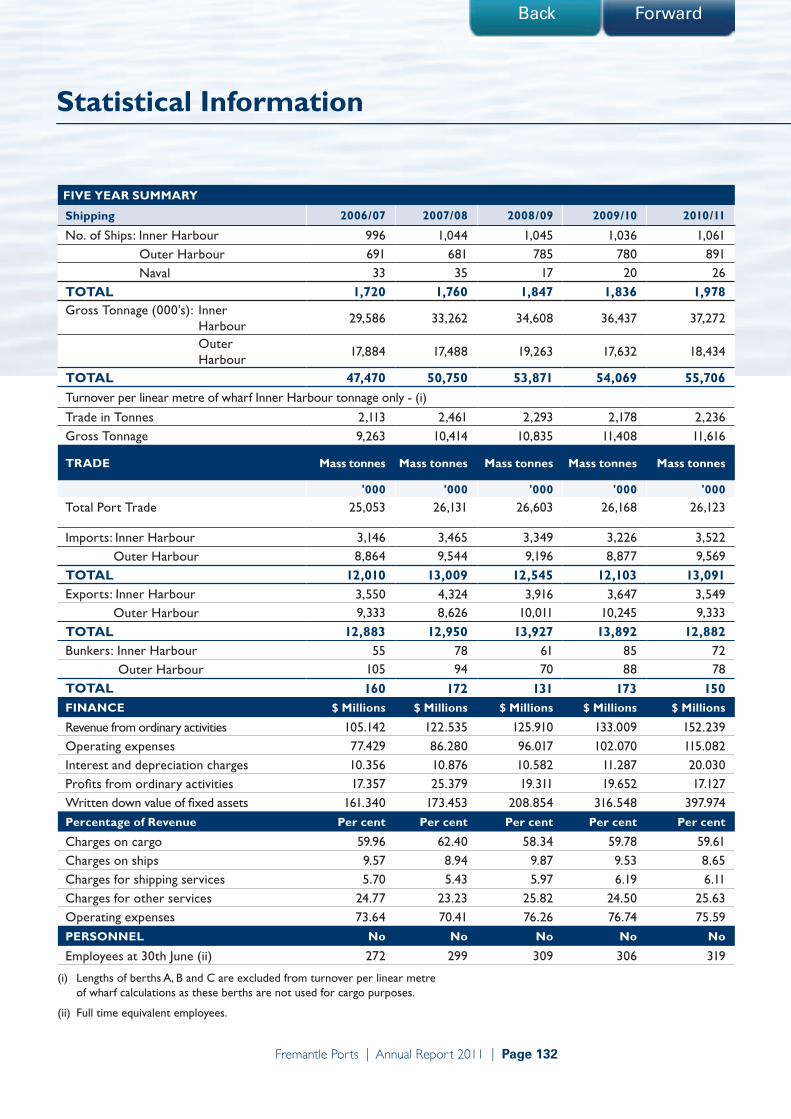
Fremantle Ports | Annual Repor t 2011 | Page 132
Back Forward
Statistical Information
FIVE yEAR SUMMARy
Shipping 2006/07 2007/08 2008/09 2009/10 2010/11
No. of Ships: Inner Harbour 996 1,044 1,045 1,036 1,061 Outer Harbour 691 681 785 780 891 Naval 33 35 17 20 26TOTAL 1,720 1,760 1,847 1,836 1,978Gross Tonnage (000's): Inner Harbour
29,586 33,262 34,608 36,437 37,272
Outer Harbour
17,884 17,488 19,263 17,632 18,434
TOTAL 47,470 50,750 53,871 54,069 55,706Turnover per linear metre of wharf Inner Harbour tonnage only - (i)
Trade in Tonnes 2,113 2,461 2,293 2,178 2,236Gross Tonnage 9,263 10,414 10,835 11,408 11,616
TRADE Mass tonnes Mass tonnes Mass tonnes Mass tonnes Mass tonnes
'000 '000 '000 '000 '000
Total Port Trade 25,053 26,131 26,603 26,168 26,123
Imports: Inner Harbour 3,146 3,465 3,349 3,226 3,522 Outer Harbour 8,864 9,544 9,196 8,877 9,569TOTAL 12,010 13,009 12,545 12,103 13,091Exports: Inner Harbour 3,550 4,324 3,916 3,647 3,549 Outer Harbour 9,333 8,626 10,011 10,245 9,333TOTAL 12,883 12,950 13,927 13,892 12,882Bunkers: Inner Harbour 55 78 61 85 72 Outer Harbour 105 94 70 88 78TOTAL 160 172 131 173 150FINANCE $ Millions $ Millions $ Millions $ Millions $ Millions
Revenue from ordinary activities 105.142 122.535 125.910 133.009 152.239Operating expenses 77.429 86.280 96.017 102.070 115.082Interest and depreciation charges 10.356 10.876 10.582 11.287 20.030Profits from ordinary activities 17.357 25.379 19.311 19.652 17.127Written down value of fixed assets 161.340 173.453 208.854 316.548 397.974Percentage of Revenue Per cent Per cent Per cent Per cent Per cent
Charges on cargo 59.96 62.40 58.34 59.78 59.61Charges on ships 9.57 8.94 9.87 9.53 8.65Charges for shipping services 5.70 5.43 5.97 6.19 6.11Charges for other services 24.77 23.23 25.82 24.50 25.63Operating expenses 73.64 70.41 76.26 76.74 75.59PERSONNEL No No No No No
Employees at 30th June (ii) 272 299 309 306 319
(i) Lengths of berths A, B and C are excluded from turnover per linear metre of wharf calculations as these berths are not used for cargo purposes.
(ii) Full time equivalent employees.

Fremantle Ports | Annual Repor t 2011 | Page 133
Back ForwardBack Forward
SHIP VISITS AND GROSS TONNAGE
Commercial Non TradingTotal Commercial &
Non TradingNaval
year Ended 30 June
No.Gross
TonnageNo.
Gross Tonnage
No.Gross
TonnageNo.
2007 1,628 47,297,066 59 171,991 1,687 47,469,057 33
2008 1,660 50,496,789 65 253,628 1,725 50,750,417 35
2009 1,774 53,650,220 56 221,352 1,830 53,871,572 17
2010 1,710 53,818,582 106 250,225 1,816 54,068,807 20
2011 1,705 55,049,838 247 656,015 1,952 55,705,853 26
SHIPS CLASSIFIED ACCORDING TO CARGO CLASS
2008/2009 2009/2010 2010/2011
Cargo Class No.Gross
Tonnage (000’s)
Average Per Ship (000’s)
No.Gross
Tonnage (000’s)
Average Per Ship (000’s)
No.Gross
Tonnage (000’s)
Average Per Ship (000’s)
Break Bulk/ Gen Carrier
141 1,768 12.5 99 1,177 11.9 109 1,212 11.1
Container 548 20,214 36.9 517 19,873 38.4 555 21,311 38.4
Multi Purpose 28 153 5.5 24 120 5.0 35 196 5.6
Roll-on/Roll-off 53 3,105 58.6 55 3,441 62.6 18 1,205 67.0
Vehicle Carrier 127 5,894 46.4 151 7,481 49.5 180 9,838 54.7
Livestock Carrier
86 2,018 23.5 68 1,611 23.7 70 1,662 23.7
Passenger 29 1,208 41.7 40 2,138 53.5 29 1,353 46.6
Tankers 265 8,198 30.9 256 7,796 30.5 266 8,104 30.5
Dry Bulk - Grain
145 3,549 24.5 154 3,409 22.1 81 2,244 27.7
Dry Bulk - Other
227 4,485 19.8 217 4,411 20.3 220 4,678 21.3
Bunkering Only 125 3,058 24.5 129 2,361 18.3 141 3,192 22.6
Other - (Fishing, Tenders, etc.)
56 221 3.9 106 250 2.4 248 711 2.6
Sub Total 1,830 53,871 29.4 1,816 54,068 29.8 1,952 55,706 28.5
Naval 17 20 26
Grand Total 1,847 53,871 29.4 1,836 54,068 29.8 1,978 55,732 28.5

Fremantle Ports | Annual Repor t 2011 | Page 134
Back Forward
Statistical Information
Commercial 1,628 1,660 1,774 1,710 1,705
Non-Trading 59 65 56 106 247
Total 1,687 1,725 1,830 1,816 1,952
Shi
p V
isit
s
0
200
400
600
800
1000
1200
1400
1600
1800
2000
2010/112009/102008/092007/082006/07
Ship Visits (Excluding Naval)
0.0
2.5
5.0
7.5
10.0
12.5
15.0
17.5
20.0
22.5
25.0
27.5
10/1109/1008/0907/0806/0705/0604/0503/0402/0301/0200/01
Imports 9.729 10.628 11.023 11.727 11.434 11.176 12.010 13.009 12.545 12.103 13.091
Exports 12.818 12.024 12.467 14.212 14.112 13.936 13.043 13.122 14.058 14.065 13.032
Total 22.547 22.652 23.490 25.939 25.546 25.112 25.053 26.131 26.603 26.168 26.123
Mas
s T
onn
es (
Mill
ions
)
Growth p.a. 2005/06 - 2010/11 - 0.8% Growth p.a. 2000/01 - 2010/11 - 1.5%
Total Port Trade
GRT 29,052 30,420 30,243 31,473 32,287
GR
T
20000
22500
25000
27500
30000
32500
2010/112009/102008/092007/082006/07
Average Gross Registered Tonnage per Commercial Vessel 2006/2007 to 2010/2011Ship Visits 2006/2007 to 2010/2011
(Excluding Naval)
Total Port Trade 2000/2001 to 2010/2011
Average Gross Registered Tonnage per Commercial Vessel 2006/2007 to 2010/2011

Fremantle Ports | Annual Repor t 2011 | Page 135
Back Forward
55% Liquid Bulk
18% Dry Bulk
4% Non-Containerised
23% Containerised
21% Liquid Bulk
53% Dry Bulk
4% Non-Containerised
22% Containerised
Trade by Cargo Class
Imports Exports
TRADE By CARGO CLASS (MASS TONNES)
Cargo Imports Exports
Liquid Bulk 7,232,868 2,721,852
Dry Bulk 2,380,266 6,910,633
Non-Containerised 465,399 533,508
Containerised 3,012,424 2,865,775
Total 13,090,957 13,031,786
Trade By Cargo Class Imports 2010/2011 (Mass Tonnes)
Trade By Cargo Class Exports 2010/2011 (Mass Tonnes)
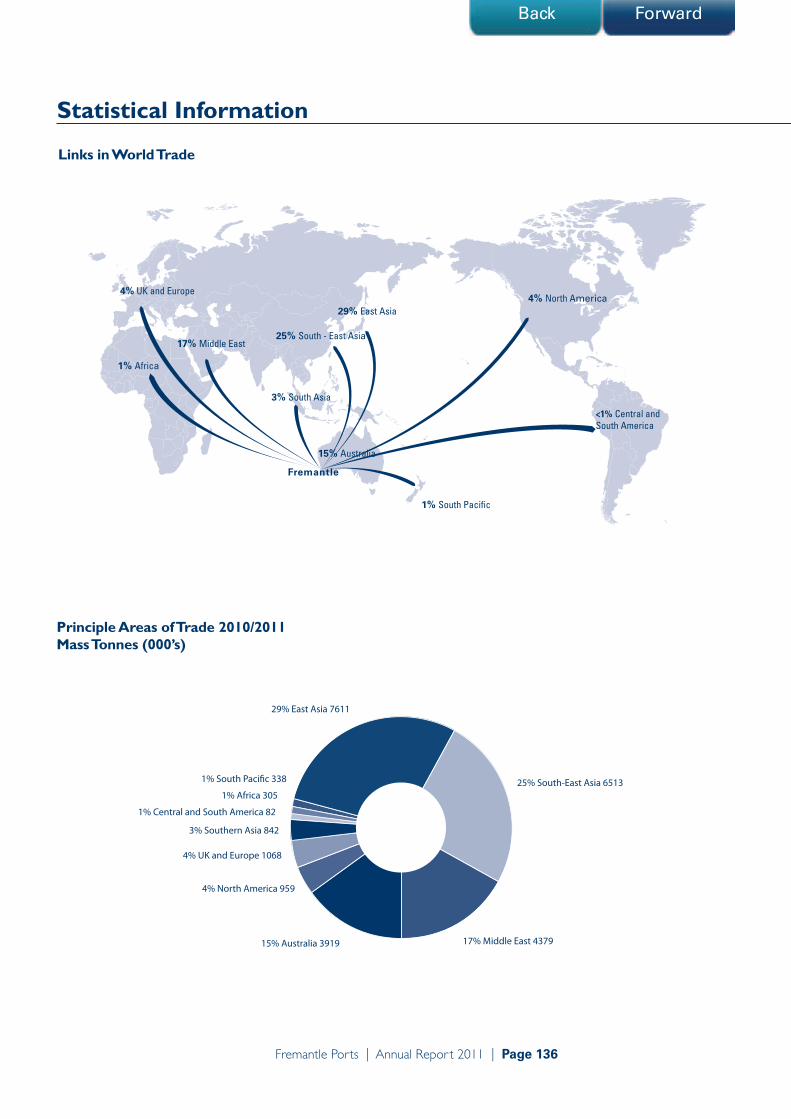
Fremantle Ports | Annual Repor t 2011 | Page 136
Back Forward
Statistical Information
15% Australia
4% UK and Europe
25% South - East Asia
3% South Asia
29% East Asia
1% South Pacific
<1% Central and South America
4% North America
17% Middle East
1% Africa
Fremantle
Links in World Trade
1% Africa 305
15% Australia 3919
4% North America 959
1% Central and South America 82
29% East Asia 7611
4% UK and Europe 1068
17% Middle East 4379
1% South Paci�c 338 25% South-East Asia 6513
3% Southern Asia 842
Principle Areas of Trade 2009/2010Mass Tonnes (000’s)
Principle Areas of Trade 2010/2011 Mass Tonnes (000’s)

Fremantle Ports | Annual Repor t 2011 | Page 137
Back Forward
Imports 184,108 196,771 223,267 244,127 238,635 232,825 258,738 299,075 287,962 288,463 310,070
170,119 186,365 208,457 221,855 228,945 223,229 247,081 281,270 277,529 268,980 288,464
354,227 383,136 431,724 465,982 467,580 456,054 505,819 580,345 565,491 557,443 598,534
Exports
Total
TE
U
Growth p.a. 2005/06 - 2010/11 - 5.6%Growth p.a. 2000/01 - 2010/11 - 5.4%
0
50000
100000
150000
200000
250000
300000
350000
400000
450000
500000
550000
600000
10/1109/1008/0907/0806/0705/0604/0503/0402/0301/0200/01
Total Container Trade - TEU
Total Container Trade - TEU 2000/2001 to 2010/2011
Full 125,613 142,498 152,946 162,861 161,491 154,136 164,228 198,842 190,791 178,892 168,870
44,506 43,867 55,511 58,994 67,454 69,093 82,853 82,428 86,738 90,088 119,594Empty
170,119 186,365 208,457 221,855 228,945 223,229 247,081 281,270 277,529 268,980 288,464Total
TE
U
Growth p.a. 2005/06 - 2010/11 - 5.3% Growth p.a. 2000/01 - 2010/11 - 5.4%
0
25000
50000
75000
100000
125000
150000
175000
200000
225000
250000
275000
300000
10/1109/1008/0907/0806/0705/0604/0503/0402/0301/0200/01
Full
Total
00/01 125,613 44,506 170,11901/02 142,498 43,867 186,36502/03 152,946 55,511 208,45703/04 162,861 58,994 221,85504/05 161,491 67,454 228,94505/06 154,136 69,093 223,22906/07 164,228 82,853 247,08107/08 198,842 82,428 281,27008/09 190,791 86,738 277,52909/10 178,892 90,088 268,98010/11 168,870 119,594 288,464
Export Container Trade - TEU 2000/2001 to 2010/2011
Full 136,526 154,829 185,943 208,334 209,710 205,767 234,894 255,713 255,765 263,815 293,208
47,582 41,942 37,324 35,793 28,925 27,058 23,844 43,362 32,197 24,648 16,862
184,108 196,771 223,267 244,127 238,635 232,825 258,738 299,075 287,962 288,463 310,070
Empty
Total
TE
U
Growth p.a. 2005/06 - 2010/11- 5.9% Growth p.a. 2000/01 - 2010/11 - 5.4%
0
25000
50000
75000
100000
125000
150000
175000
200000
225000
250000
275000
300000
325000
10/1109/1008/0907/0806/0705/0604/0503/0402/0301/0200/01
Import Container Trade - TEU’
Import Container Trade - TEU 2000/2001 to 2010/2011

Fremantle Ports | Annual Repor t 2011 | Page 138
Back Forward
Statistical Information
SyNOPSIS OF TRADE 2010/2011
Cargo
Inner Harbour
Mass Tonnes
Outer Harbour
Mass Tonnes
Port Total Mass
Tonnes
Imports
From Intrastate Ports 901 552,563 553,463
From Interstate Ports 771,345 224,439 995,785
From Overseas Ports 2,750,082 8,791,623 11,541,704
Total Imports 3,522,328 9,568,625 13,090,952
Exports
To Intrastate Ports 10,899 172,449 183,348
To Interstate Ports 39,768 1,997,096 2,036,864
To Overseas Ports 3,498,382 7,163,267 10,661,649
Total Exports 3,549,050 9,332,812 12,881,862
7,071,377 18,901,437 25,972,814
Bunkers
Fuel oil 71,780 78,295 150,075
Total Port Trade 7,143,157 18,979,732 26,122,889
21.9% Interstate
78.1% Overseas
0.03% Intrastate
2.0% Bunkers1.6% Interstate
96.6% Overseas
0.3% Intrastate 0.8% Bunkers
21.2% Interstate
76.1% Overseas
1.8% Intrastate
2.0% Interstate
91.9% Overseas
5.8% Intrastate
Inner Harbour Imports Outer Harbour Imports
Inner Harbour Exports Outer Harbour Exports
Inner Harbour Imports Outer Harbour Imports
Inner Harbour Exports Outer Harbour Exports

Fremantle Ports | Annual Repor t 2011 | Page 139
Back Forward
PORT OF FREMANTLE CONTAINER TRADE - TEU JULY 1 2010 TO JUNE 30 2011
COUNTRYIMPORTS ExPORTS GRAND
TOTALFULL EMPTy TOTAL FULL EMPTy TOTALChina 85,415 1,910 87,325 33,908 723 34,631 121,956
Singapore 12,782 8,871 21,653 9,600 89,216 98,816 120,469
Australia 61,537 3,821 65,358 1,282 2,091 3,373 68,731
Malaysia 14,630 461 15,091 7,853 18,520 26,373 41,464
Japan 6,328 6 6,334 28,383 620 29,003 35,337
Indonesia 9,271 124 9,395 13,424 99 13,523 22,918
Thailand 13,955 6 13,961 6,778 430 7,208 21,169
South Korea 8,877 8,877 10,740 276 11,016 19,893
United States of America 13,528 41 13,569 3,969 9 3,978 17,547
New Zealand 3,668 32 3,700 3,115 6,627 9,742 13,442
Vietnam 4,301 4,301 5,619 89 5,708 10,009
Taiwan 4,885 4,885 4,394 5 4,399 9,284
India 3,673 3,673 4,852 3 4,855 8,528
Hong Kong 2,204 2 2,206 5,795 82 5,877 8,083
Germany 6,523 69 6,592 1,138 149 1,287 7,879
United Kingdom 5,219 5,219 1,669 137 1,806 7,025
Italy 5,111 7 5,118 606 228 834 5,952
United Arab Emirates 2,516 2,516 2,831 2,831 5,347
Philippines 1,774 1,774 3,231 3,231 5,005
Netherlands 2,593 16 2,609 2,151 17 2,168 4,777
Belgium 2,932 72 3,004 1,440 180 1,620 4,624
South Africa 2,830 2,830 959 3 962 3,792
Mexico 2,677 2,677 370 370 3,047
Spain 1,954 1,954 925 10 935 2,889
France 2,307 4 2,311 181 181 2,492
Saudi Arabia 196 10 206 1,502 1,502 1,708
Canada 1,302 1,302 325 325 1,627
Christmas Island 21 531 552 915 70 985 1,537
Finland 680 680 577 577 1,257
Sweden 1,110 1 1,111 91 91 1,202
Turkey 908 908 146 146 1,054
Sri Lanka 333 333 676 676 1,009
Israel 976 976 14 14 990
Myanmar 36 36 927 927 963
Pakistan 412 412 350 350 762
Bahrain 285 285 441 441 726
Ghana 24 24 696 696 720
Reunion 606 606 97 97 703
Other Countries 5,435 272 5,707 6,900 10 6,910 12,617Grand Total 293,208 16,862 310,070 168,870 119,954 288,464 598,534
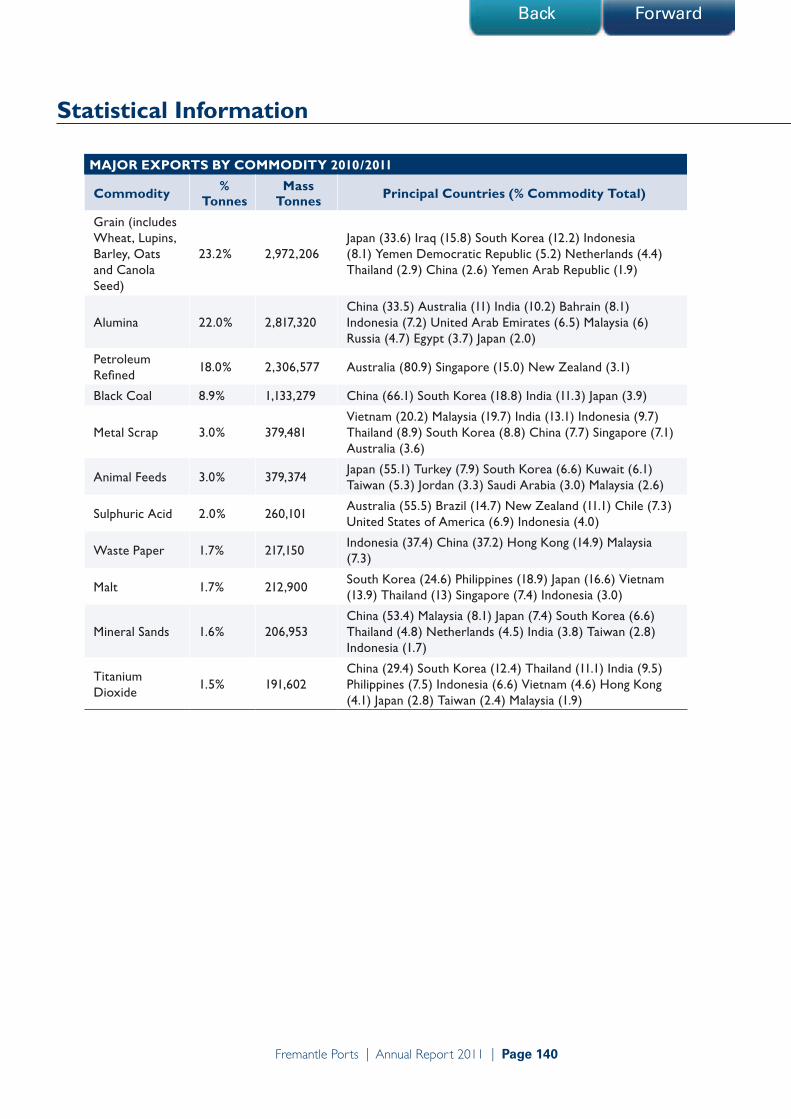
Fremantle Ports | Annual Repor t 2011 | Page 140
Back Forward
Statistical Information
MAJOR ExPORTS By COMMODITy 2010/2011
Commodity % Tonnes
Mass Tonnes Principal Countries (% Commodity Total)
Grain (includes Wheat, Lupins, Barley, Oats and Canola Seed)
23.2% 2,972,206Japan (33.6) Iraq (15.8) South Korea (12.2) Indonesia (8.1) Yemen Democratic Republic (5.2) Netherlands (4.4) Thailand (2.9) China (2.6) Yemen Arab Republic (1.9)
Alumina 22.0% 2,817,320China (33.5) Australia (11) India (10.2) Bahrain (8.1) Indonesia (7.2) United Arab Emirates (6.5) Malaysia (6) Russia (4.7) Egypt (3.7) Japan (2.0)
Petroleum Refined
18.0% 2,306,577 Australia (80.9) Singapore (15.0) New Zealand (3.1)
Black Coal 8.9% 1,133,279 China (66.1) South Korea (18.8) India (11.3) Japan (3.9)
Metal Scrap 3.0% 379,481Vietnam (20.2) Malaysia (19.7) India (13.1) Indonesia (9.7) Thailand (8.9) South Korea (8.8) China (7.7) Singapore (7.1) Australia (3.6)
Animal Feeds 3.0% 379,374Japan (55.1) Turkey (7.9) South Korea (6.6) Kuwait (6.1) Taiwan (5.3) Jordan (3.3) Saudi Arabia (3.0) Malaysia (2.6)
Sulphuric Acid 2.0% 260,101Australia (55.5) Brazil (14.7) New Zealand (11.1) Chile (7.3) United States of America (6.9) Indonesia (4.0)
Waste Paper 1.7% 217,150Indonesia (37.4) China (37.2) Hong Kong (14.9) Malaysia (7.3)
Malt 1.7% 212,900South Korea (24.6) Philippines (18.9) Japan (16.6) Vietnam (13.9) Thailand (13) Singapore (7.4) Indonesia (3.0)
Mineral Sands 1.6% 206,953China (53.4) Malaysia (8.1) Japan (7.4) South Korea (6.6) Thailand (4.8) Netherlands (4.5) India (3.8) Taiwan (2.8) Indonesia (1.7)
Titanium Dioxide
1.5% 191,602China (29.4) South Korea (12.4) Thailand (11.1) India (9.5) Philippines (7.5) Indonesia (6.6) Vietnam (4.6) Hong Kong (4.1) Japan (2.8) Taiwan (2.4) Malaysia (1.9)

Fremantle Ports | Annual Repor t 2011 | Page 141
Back Forward
MAJOR IMPORTS By COMMODITy 2010/2011
Commodity % Tonnes
Mass Tonnes Principal Countries (% Commodity Total)
Crude Petroleum
42.4% 5,536,109United Arab Emirates (35.1) Malaysia (20.1) Indonesia (15.3) Australia (6.5) Saudi Arabia (6.3) South Korea (5.2) Singapore (3.6) Brunei (2.9) Vietnam (2.0)
Cement Clinker
7.4% 959,393 Japan (46.9) Indonesia (42.5) China (8.4) Malaysia (2.2)
Caustic Soda 6.0% 783,611Saudi Arabia (32.5) Taiwan (21.1) China (17.3) United Arab Emirates (15.7) United States of America (10.3)
Petroleum Refined
6.0% 777,248Singapore (58.7) South Korea (17.0) Indonesia (13.1) Australia (5.2) Japan (2.2)
Phosphates - Fertilisers
3.6% 474,226United States of America (31.5) China (16.4) Morocco (14.7) Australia (12.9) South Korea (12.1) Saudi Arabia (3.9) New Zealand (2.4)
Iron and Steel Products
3.6% 468,414China (26.8) Australia (15.3) Singapore (11.3) Malaysia (8.9) Taiwan (8.4) South Korea (5.2) Japan (4.6) Thailand (4.2) Indonesia (2.7) Belgium (2.3)
Sulphur 3.2% 418,107 Canada (100)
Chemicals and Related Products
2.9% 377,916
China (24.6) Australia (12.8) Singapore (8.2) Thailand (6.8) United States of America (5.4) South Korea (4.8) Malaysia (4.1) Taiwan (3.8) Indonesia (3.6) Belgium (3.2) United Arab Emirates (3.0) United Kingdom (1.9)

Fremantle Ports | Annual Repor t 2011 | Page 142
Back Forward
Statistical Information
MAJOR ExPORTS By COUNTRy 2010/2011
Country % TonnesMass Tonnes Principal Commodities (% Country Total)
China 19.31% 2,470,520
Alumina (38.2) Black Coal (30.3) Mineral Sands (4.5) Iron Ore (3.7) Waste Paper (3.3) Grain (3.2) Nickel Matt and Concentrates (2.7) Titanium Dioxide (2.3) Wool (2.2) Lead Carbonate Concentrate (2.0)
Australia 18.50% 2,367,072 Refined Petroleum (78.8) Alumina (13.1) Sulphuric Acid (6.1)
Japan 11.19% 1,431,579Grain (69.7) Animal Feeds (14.6) Alumina (3.8) Black Coal (3.1) Malt (2.5)
South Korea 6.13% 783,845Grain (46.1) Black Coal (27.1) Malt (6.7) Metal Scrap (4.2) Alumina (3.3) Animal Feeds (3.2) Titanium Dioxide (3) Mineral Sands (1.7)
Indonesia 5.28% 675,825Grain (35.8) Alumina (30.2) Waste Paper (12) Metal Scrap (5.4) Ammonium Nitrate (3.5) Titanium Dioxide (1.9)
Singapore 4.43% 566,860Refined Petroleum (61.2) Petroleum Crude (6.3) Grain (5.8) Metal Scrap (4.8) Dairy Products (4.2) Malt (2.8) Fresh Fruit and Vegetables (2.6) Unclassified Goods (2.1)
India 4.28% 547,190Alumina (52.5) Black Coal (23.4) Metal Scrap (9.1) Titanium Dioxide (3.3) Other Crude Minerals (3.1) Grain (2.8)
Iraq 3.68% 471,051 Grain (99.9)
Malaysia 3.09% 395,548Alumina (42.7) Metal Scrap (18.9) Grain (11.8) Mineral Sands (4.2) Waste Paper (4) Fresh Fruit and Vegetables (3.2) Animal Feeds (2.6) Refined Petroleum (1.6)
Bahrain 1.99% 254,774Alumina (89.3) Animal Feeds (8.3) Fresh Fruit and Vegetables (1.9)
United Arab Emirates
1.90% 243,522Alumina (75.8) Fresh Fruit and Vegetables (7.3) Grain (6.8) Animal Feeds (2.2) Fresh Meat - Chilled or Frozen (2.1)

Fremantle Ports | Annual Repor t 2011 | Page 143
Back Forward
MAJOR IMPORTS By COUNTRy 2010/2011
Country % TonnesMass Tonnes Principal Commodities (% Country Total)
United Arab Emirates
16.1% 2,097,401 Crude Petroleum (92.8) Caustic Soda (5.9)
Australia 11.8% 1,541,587
Crude Petroleum (23.4) Gypsum (11.2) Paper, Paperboard and Articles of Paper Pulp (7.3) Ammonia (5.9) Iron and Steel Products (4.7) Phosphates - Fertilisers (4.0) Fabricated Construction Materials (4.0) Unclassified Goods (3.5) Chemicals and Related Products (3.1) Ale, Beer and Stout; Cider (Alcoholic) (2.9) Refined Petroleum (2.6) Glass (2.2) Fruit and Vegetables (Preserved, Canned, Bottled or Frozen) (2.1) Coke (2.1)
Indonesia 11.2% 1,457,734Crude Petroleum (58.0) Cement Clinker (28.0) Refined Petroleum (7.0)
Malaysia 9.9% 1,293,832 Crude Petroleum (85.8) Iron and Steel Products (3.2)
China 7.8% 1,019,599
Caustic Soda (13.3) Iron and Steel Products (12.3) Chemicals and Related Products (9.1) Manufactures of Metal (8.1) Cement Clinker (7.9) Phosphates - Fertilisers (7.6) Furniture and Parts Thereof (7.6) Machinery - Agricultural, Industrial (5.4) Bricks, Tiles, Pavers, etc (4.5) Plastic Wares and Other Manufactures (3.4) Rubber Manufactures (2.3)
Singapore 6.3% 824,619Refined Petroleum (55.3) Crude Petroleum (24.3) Iron and Steel Products (6.4) Unclassified Goods (4.3) Chemicals and Related Products (3.8)
Japan 6.2% 812,132
Cement Clinker (55.4) Slag Residue Ex Steel Furnace (23.8) Motor Vehicles - New (6.7) Rubber Manufactures (3.2) Iron and Steel Products (2.7) Vehicles - Industrial and Agricultural (2.3) Refined Petroleum (2.1)
Saudi Arabia 5.1% 659,808Crude Petroleum (52.6) Caustic Soda (38.6) Urea (5.8) Phosphates - Fertilisers (2.8)
South Korea 4.7% 616,579
Crude Petroleum (46.3) Refined Petroleum (21.4) Phosphates - Fertilisers (9.3) Newsprint (4.9) Iron and Steel Products (3.9) Motor Vehicles - New (3.6) Chemicals and Related Products (2.9) Caustic Soda (1.8)
Canada 3.3% 432,120 Sulphur (96.7)
United States of America
3.2% 412,110
Phosphates - Fertilisers (36.3) Caustic Soda (19.5) Chemicals and Related Products (4.9) Machinery - Agricultural, Industrial (4.8) Vehicles - Industrial and Agricultural (4.7) Other Transport Equipment and Parts (3.9) Urea (2.5) Rubber Manufactures (2.1) Soya Bean Meal (1.9)
Taiwan 1.9% 248,491
Caustic Soda (66.6) Iron and Steel Products (15.8) Chemicals and Related Products (5.8) Machinery - Agricultural, Industrial (1.8) Plastic Wares and Other Manufactures (1.8) Manufactures of Metal (1.8)

Fremantle Ports | Annual Repor t 2011 | Page 144
Back Forward
Mar
itim
e M
useu
m
Carp
ark
Carp
ark
Gate
s/En
tranc
eN
.Q 3
Exi
t Gat
e
Gate
s/En
tranc
ePa
trick
Priv
ate
Entra
nce
to B
erth
s 7
to 1
0
Gate
s/En
tranc
eN
.Q 1
Exi
t Gat
e
INN
ER
H
AR
BO
UR
CO
NTA
INER
AN
D BR
EAK-
BULK
COM
MON
-USE
R BE
RTHS
- N
ORTH
QUA
Y
DP W
ORLD
PATR
ICK
COM
MON
-USE
R BE
RTHS
- VI
CTOR
IA Q
UAY
FREM
ANTL
E PA
SSEN
GER
TERM
INAL
1 2 3 4 5Ro
ttnes
t Fer
ry
Kool
inda
Ho
use
OU
TE
R
HA
RB
OU
R
BULK
CAR
GOES
ALUM
INA
REFI
NER
Y JE
TTY
KWIN
ANA
BULK
TER
MIN
AL
BP R
EFIN
ERY
JETT
Y
KWIN
ANA
BULK
JET
TY
KWIN
ANA
GRAI
N J
ETTY
6 7 8 9 10Fr
eman
tle P
orts
Ad
min
istra
tion
Build
ing
Carp
ark
Carp
ark
N
W S
E
D S
hed
C Sh
ed
B Sh
ed
RO
US
HEA
D H
AR
BO
UR
NO
RT
H M
OLE
SO
UT
H M
OLE
NO
RTH
QU
AY
DP W
orld
Patri
ck
Berth
4
Berth
1Be
rth 2
Berth
5Be
rth 6
Berth
7Be
rth 8
Berth
9
N.Q
COM
MON
USE
R
Berth
10
Berth
JBe
rth H
Berth
GBe
rth F
A Sh
ed
E Sh
ed
Pass
enge
r Ter
min
alF
Shed
G S
hed
Berth
EBe
rth D
Berth
C
Berth
B
Berth
A
Berth
11
Berth
12
VIC
TOR
IA Q
UA
Y
FR
EM
AN
TL
E H
AR
BO
UR
SW
AN
R
IVER
IND
IAN
OC
EAN
Emer
genc
yAs
sem
bly
Area
Emer
genc
yAs
sem
bly
Area
Emer
genc
yAs
sem
bly
Area
CON
TAIN
ER T
ERM
INAL
S
RECL
AIM
ATIO
N L
AND
Gate
s/En
tranc
eN
.Q 2
Exi
t Gat
e
Gate
s/En
tranc
eDP
Wor
ld P
rivat
e En
tranc
e Be
rths
4 to
6
Gate
s/En
tranc
eCr
ew A
cces
s Ga
te
Gate
s/En
tranc
eBe
rth E
Car
go
Acce
ss G
ate
Gate
s/En
tranc
ePa
ssen
ger T
erm
inal
Gat
e
Gate
s/En
tranc
eCa
rgo
Acce
ss G
ate
Gate
s/En
tranc
eCa
rgo
Acce
ss G
ate
Gate
s/En
tranc
eCa
rgo
Acce
ss G
ate
Gate
s/En
tranc
eN
o 2.
Gat
e
Gate
s/En
tranc
eV.
Q 3
Exit
Gate
Acce
ss ro
ad
to o
pera
tiona
l ar
eaFe
nce
Pete
r Hug
hes
Driv
ePr
ivat
e Ro
ad
Beac
h St
reet
Railw
ay S
tatio
nPh
illim
ore
Stre
et
Fleet
Stre
et
Slip
Stre
et
Smal
l Cr
aft
Pen
Gate
s/En
tranc
eN
.Q 4
Exi
t Gat
e
Tydeman Road
Napier Road
Port
Beac
h Ro
ad
Rudd
erha
m D
rive
Rous
Hea
d Ro
ad
Sultan Way
North Mole Drive
Nor
th M
ole
Driv
e Emer
genc
yAs
sem
bly
Area
N.Q
COM
MON
USE
R
V.Q
COM
MON
USE
R
Emer
genc
yAs
sem
bly
Area
Cliff Street
Mouat Street
Henry Street
Pakenham Street
Rous
Hea
d In
dust
rial A
rea
Emer
genc
yAs
sem
bly
Area
Emer
genc
yAs
sem
bly
Area
Inner and Outer Harbour Maps

Fremantle Ports | Annual Repor t 2011 | Page 145
Back Forward
I N D I A N O C E A N
N
W
S
E
Prohibited Anchorage
I N N E R H A R B O U R
R O C K I N G H A M
F R E M A N T L E
S WA N R I V E R
COCKBURN SOUND
O U T E R H A R B O U R
R O T T N E S T I S L A N D
C A R N A C I S L A N D
G A R D E N I S L A N D
O U T E R H A R B O U R BULK CARGOES
ALUMINA REFINERY JETTY
KWINANA BULK TERMINAL
BP REFINERY JETTY
KWINANA BULK JETTY
KWINANA GRAIN JETTY
6
7
8
9
10
KWINANA BULK JETTY
KWINANA GRAIN JETTY
KWINANA BULK TERMINAL
ALUMINA REFINERY JETTY
BP OIL REFINERY JETTY
Inner and Outer Harbour Maps

Fremantle Ports | Annual Repor t 2011 | Page 146
Back Forward
About this Annual ReportThis Annual Report complies with the relevant legislation and is designed to inform the public, other stakeholders and customers about Fremantle Ports’ services, activities, achievements and future directions.
The report is written and edited by Fremantle Ports staff.
The Annual Report can be reviewed and downloaded from Fremantle Ports’ website: www.fremantleports.com.au
Additional copies may be obtained on disk from External Affairs, Telephone 61 (8) 9430 3555.
AbbreviationsFTE – Full Time Equivalent GT – Gross Tonnes KBJ – Kwinana Bulk Jetty KBT – Kwinana Bulk Terminal TEU – Twenty Foot Equivalent Unit
AddressFremantle Ports 1 Cliff Street, Fremantle Western Australia 6160
Postal AddressPO Box 95, Fremantle 6959
ContactTelephone: 61 (8) 9430 3555 Main Fax: 61 (8) 9336 1391 Internet: www.fremantleports.com.au E-Mail: [email protected]
ISSN No 1320520X
Publications, Abbreviations, Address
Tell us how we are going We are interested in your feedback on our Annual Report and invite your queries on any aspect of the activities undertaken by Fremantle Ports. As only limited printed copies of Annual Reports are produced electronic copies of this and previous years’ reports are available from our web site.
To provide your comments or ask a question, contact us by:
Phone: 61 (8) 9430 3555
Web: www.fremantleports.com.au and click on Contact Us
Mail: Write to us at Fremantle Ports 1 Cliff Street, Fremantle Western Australia 6160
Visit: Fremantle Ports 1 Cliff Street, Fremantle Western Australia 6160